Zip Codes with the Highest Percentage of Population Employed in Food Preparation & Serving in Ruston, LA
RELATED REPORTS & OPTIONS
Food Preparation & Serving
Ruston
Compare Zip Codes
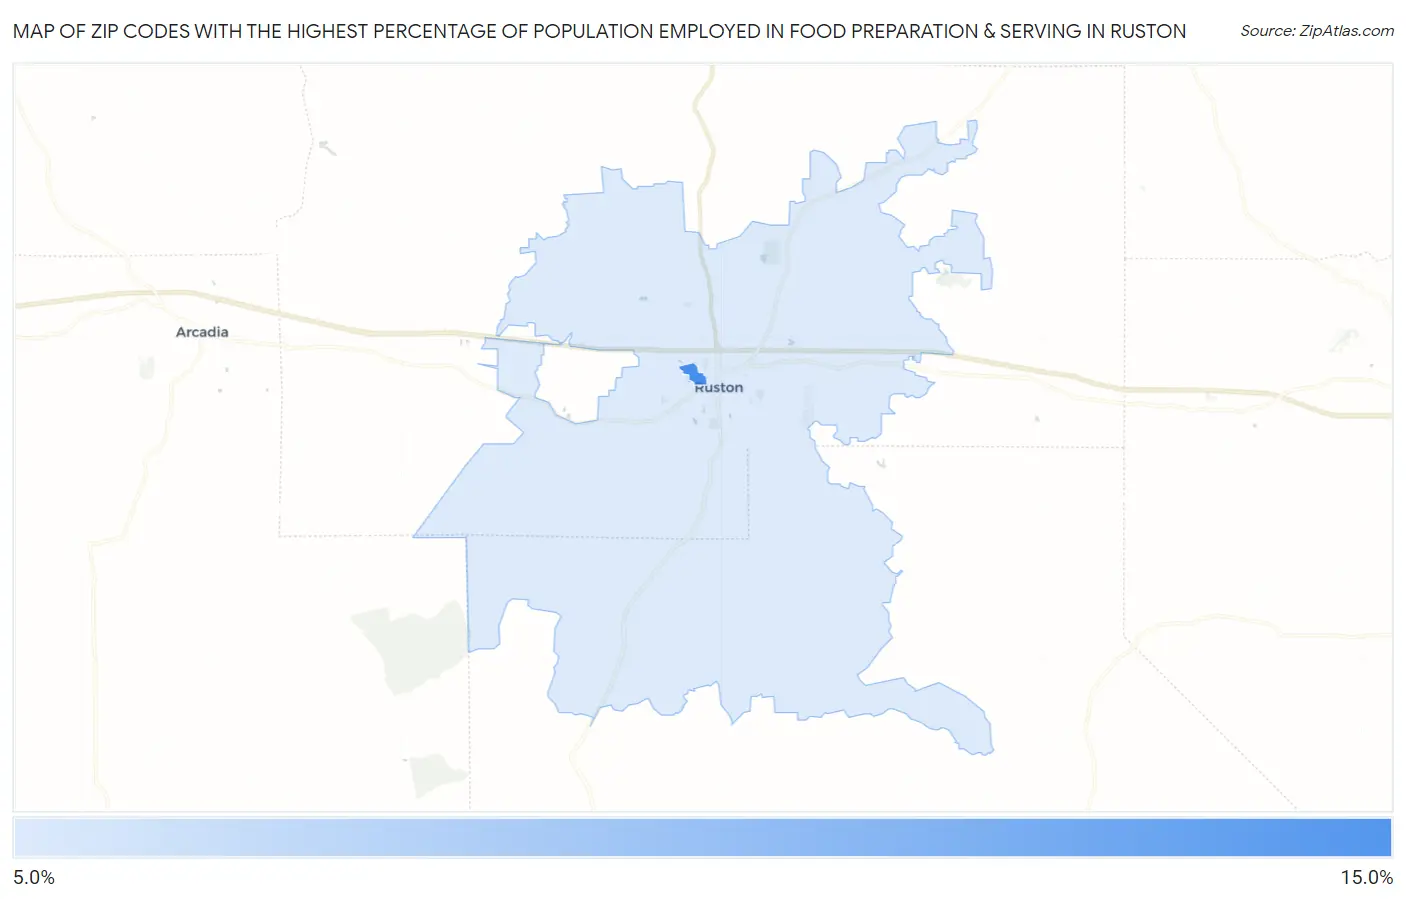
Map of Zip Codes with the Highest Percentage of Population Employed in Food Preparation & Serving in Ruston
8.7%
15.0%
Zip Codes with the Highest Percentage of Population Employed in Food Preparation & Serving in Ruston, LA
| Zip Code | % Employed | vs State | vs National | |
| 1. | 71272 | 15.0% | 6.0%(+8.95)#28 | 5.3%(+9.70)#983 |
| 2. | 71270 | 8.7% | 6.0%(+2.65)#82 | 5.3%(+3.40)#3,872 |
1
Common Questions
What are the Top Zip Codes with the Highest Percentage of Population Employed in Food Preparation & Serving in Ruston, LA?
Top Zip Codes with the Highest Percentage of Population Employed in Food Preparation & Serving in Ruston, LA are:
What zip code has the Highest Percentage of Population Employed in Food Preparation & Serving in Ruston, LA?
71272 has the Highest Percentage of Population Employed in Food Preparation & Serving in Ruston, LA with 15.0%.
What is the Percentage of Population Employed in Food Preparation & Serving in Ruston, LA?
Percentage of Population Employed in Food Preparation & Serving in Ruston is 10.8%.
What is the Percentage of Population Employed in Food Preparation & Serving in Louisiana?
Percentage of Population Employed in Food Preparation & Serving in Louisiana is 6.0%.
What is the Percentage of Population Employed in Food Preparation & Serving in the United States?
Percentage of Population Employed in Food Preparation & Serving in the United States is 5.3%.