Zip Codes with the Highest Percentage of Population Employed in Food Preparation & Serving in New Iberia, LA
RELATED REPORTS & OPTIONS
Food Preparation & Serving
New Iberia
Compare Zip Codes
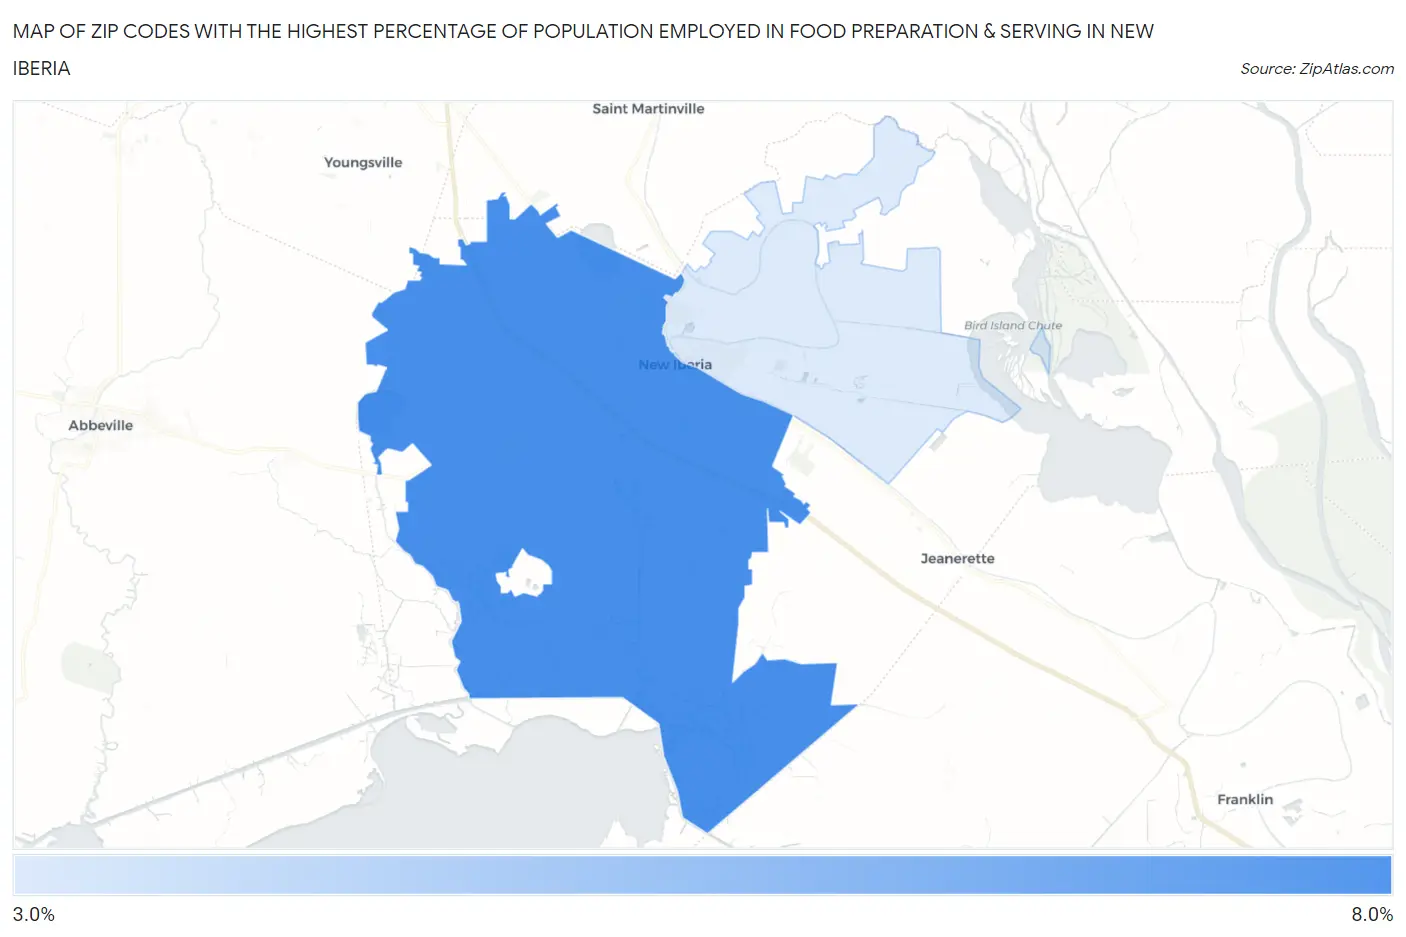
Map of Zip Codes with the Highest Percentage of Population Employed in Food Preparation & Serving in New Iberia
3.4%
6.7%
Zip Codes with the Highest Percentage of Population Employed in Food Preparation & Serving in New Iberia, LA
| Zip Code | % Employed | vs State | vs National | |
| 1. | 70560 | 6.7% | 6.0%(+0.701)#139 | 5.3%(+1.46)#7,224 |
| 2. | 70563 | 3.4% | 6.0%(-2.62)#312 | 5.3%(-1.86)#19,515 |
1
Common Questions
What are the Top Zip Codes with the Highest Percentage of Population Employed in Food Preparation & Serving in New Iberia, LA?
Top Zip Codes with the Highest Percentage of Population Employed in Food Preparation & Serving in New Iberia, LA are:
What zip code has the Highest Percentage of Population Employed in Food Preparation & Serving in New Iberia, LA?
70560 has the Highest Percentage of Population Employed in Food Preparation & Serving in New Iberia, LA with 6.7%.
What is the Percentage of Population Employed in Food Preparation & Serving in New Iberia, LA?
Percentage of Population Employed in Food Preparation & Serving in New Iberia is 8.5%.
What is the Percentage of Population Employed in Food Preparation & Serving in Louisiana?
Percentage of Population Employed in Food Preparation & Serving in Louisiana is 6.0%.
What is the Percentage of Population Employed in Food Preparation & Serving in the United States?
Percentage of Population Employed in Food Preparation & Serving in the United States is 5.3%.