Zip Codes with the Highest Percentage of Population Employed in Food Preparation & Serving in Shreveport, LA
RELATED REPORTS & OPTIONS
Food Preparation & Serving
Shreveport
Compare Zip Codes
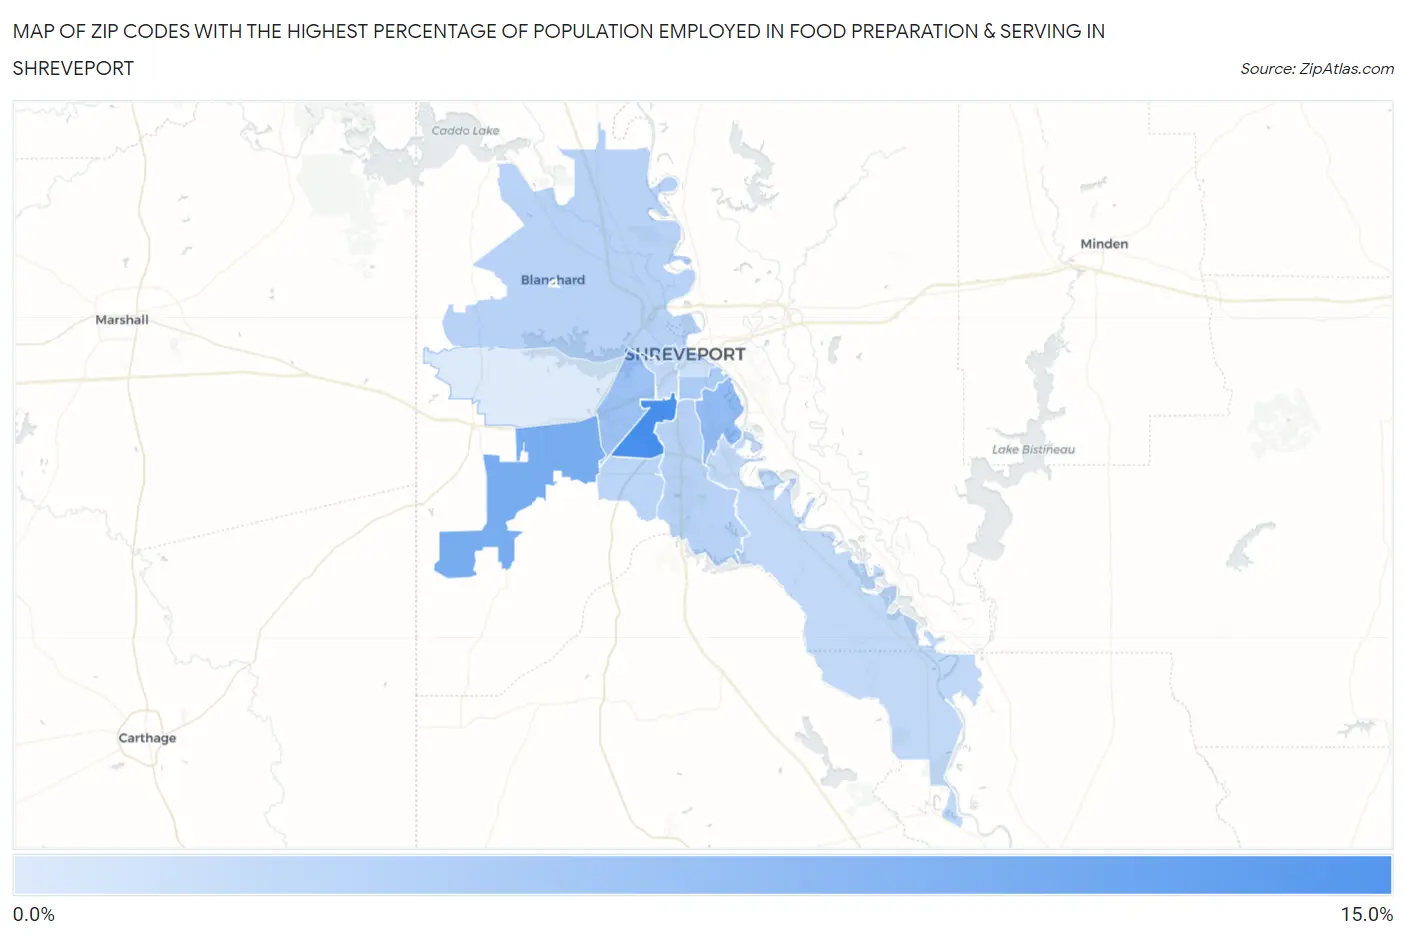
Map of Zip Codes with the Highest Percentage of Population Employed in Food Preparation & Serving in Shreveport
3.5%
10.6%
Zip Codes with the Highest Percentage of Population Employed in Food Preparation & Serving in Shreveport, LA
| Zip Code | % Employed | vs State | vs National | |
| 1. | 71108 | 10.6% | 6.0%(+4.59)#56 | 5.3%(+5.34)#2,246 |
| 2. | 71129 | 8.3% | 6.0%(+2.22)#95 | 5.3%(+2.98)#4,356 |
| 3. | 71105 | 7.1% | 6.0%(+1.06)#125 | 5.3%(+1.81)#6,341 |
| 4. | 71109 | 6.6% | 6.0%(+0.590)#145 | 5.3%(+1.35)#7,532 |
| 5. | 71104 | 5.8% | 6.0%(-0.269)#175 | 5.3%(+0.487)#10,111 |
| 6. | 71107 | 5.2% | 6.0%(-0.821)#207 | 5.3%(-0.065)#12,061 |
| 7. | 71106 | 5.2% | 6.0%(-0.855)#209 | 5.3%(-0.100)#12,209 |
| 8. | 71118 | 5.1% | 6.0%(-0.919)#211 | 5.3%(-0.164)#12,457 |
| 9. | 71103 | 4.9% | 6.0%(-1.16)#222 | 5.3%(-0.403)#13,433 |
| 10. | 71115 | 4.8% | 6.0%(-1.21)#227 | 5.3%(-0.459)#13,649 |
| 11. | 71101 | 4.2% | 6.0%(-1.80)#266 | 5.3%(-1.05)#16,157 |
| 12. | 71119 | 3.5% | 6.0%(-2.52)#306 | 5.3%(-1.76)#19,103 |
1
Common Questions
What are the Top 10 Zip Codes with the Highest Percentage of Population Employed in Food Preparation & Serving in Shreveport, LA?
Top 10 Zip Codes with the Highest Percentage of Population Employed in Food Preparation & Serving in Shreveport, LA are:
What zip code has the Highest Percentage of Population Employed in Food Preparation & Serving in Shreveport, LA?
71108 has the Highest Percentage of Population Employed in Food Preparation & Serving in Shreveport, LA with 10.6%.
What is the Percentage of Population Employed in Food Preparation & Serving in Shreveport, LA?
Percentage of Population Employed in Food Preparation & Serving in Shreveport is 6.4%.
What is the Percentage of Population Employed in Food Preparation & Serving in Louisiana?
Percentage of Population Employed in Food Preparation & Serving in Louisiana is 6.0%.
What is the Percentage of Population Employed in Food Preparation & Serving in the United States?
Percentage of Population Employed in Food Preparation & Serving in the United States is 5.3%.