Turkey Creek, LA Map & Demographics
Turkey Creek Map
Turkey Creek Overview
$25,699
PER CAPITA INCOME
$51,528
AVG FAMILY INCOME
$50,278
AVG HOUSEHOLD INCOME
76.2%
WAGE / INCOME GAP [ % ]
23.8¢/ $1
WAGE / INCOME GAP [ $ ]
0.44
INEQUALITY / GINI INDEX
374
TOTAL POPULATION
210
MALE POPULATION
164
FEMALE POPULATION
128.05
MALES / 100 FEMALES
78.10
FEMALES / 100 MALES
35.4
MEDIAN AGE
3.2
AVG FAMILY SIZE
2.6
AVG HOUSEHOLD SIZE
131
LABOR FORCE [ PEOPLE ]
48.2%
PERCENT IN LABOR FORCE
3.1%
UNEMPLOYMENT RATE
Turkey Creek Zip Codes
Turkey Creek Area Codes
Income in Turkey Creek
Income Overview in Turkey Creek
Per Capita Income in Turkey Creek is $25,699, while median incomes of families and households are $51,528 and $50,278 respectively.
| Characteristic | Number | Measure |
| Per Capita Income | 374 | $25,699 |
| Median Family Income | 99 | $51,528 |
| Mean Family Income | 99 | $77,320 |
| Median Household Income | 146 | $50,278 |
| Mean Household Income | 146 | $66,184 |
| Income Deficit | 99 | $0 |
| Wage / Income Gap (%) | 374 | 76.16% |
| Wage / Income Gap ($) | 374 | 23.84¢ per $1 |
| Gini / Inequality Index | 374 | 0.44 |
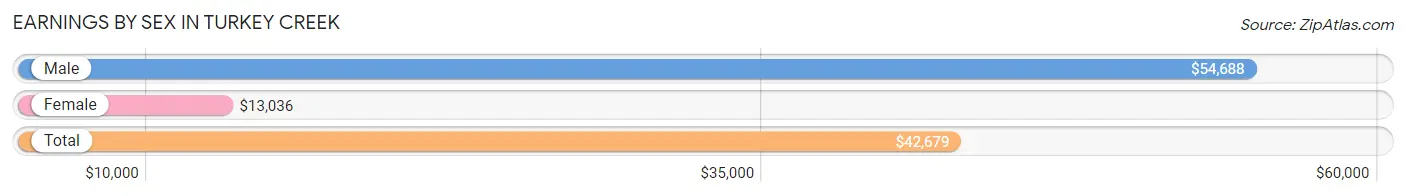
Earnings by Sex in Turkey Creek
Average Earnings in Turkey Creek are $42,679, $54,688 for men and $13,036 for women, a difference of 76.2%.
| Sex | Number | Average Earnings |
| Male | 80 (57.6%) | $54,688 |
| Female | 59 (42.4%) | $13,036 |
| Total | 139 (100.0%) | $42,679 |
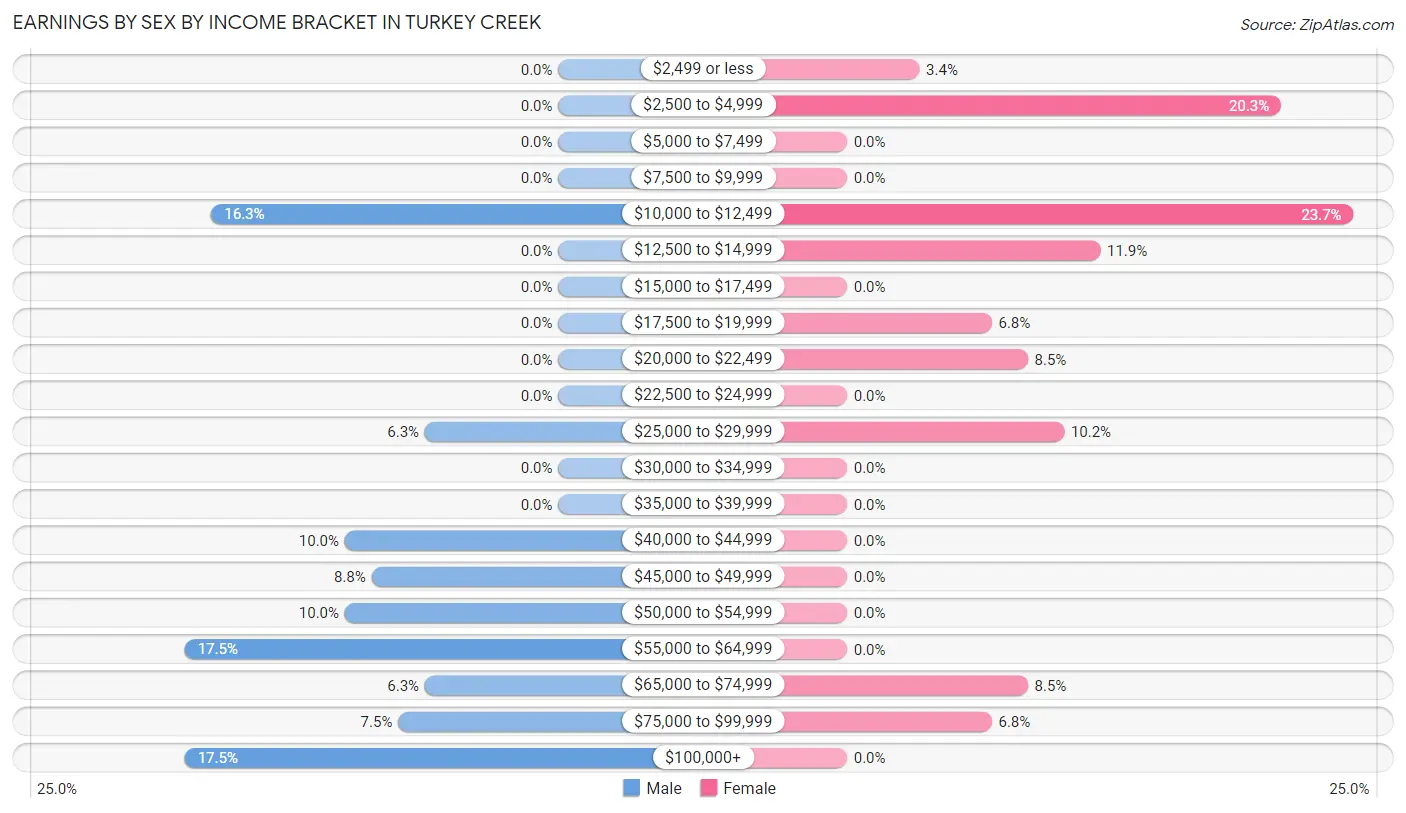
Earnings by Sex by Income Bracket in Turkey Creek
The most common earnings brackets in Turkey Creek are $55,000 to $64,999 for men (14 | 17.5%) and $10,000 to $12,499 for women (14 | 23.7%).
| Income | Male | Female |
| $2,499 or less | 0 (0.0%) | 2 (3.4%) |
| $2,500 to $4,999 | 0 (0.0%) | 12 (20.3%) |
| $5,000 to $7,499 | 0 (0.0%) | 0 (0.0%) |
| $7,500 to $9,999 | 0 (0.0%) | 0 (0.0%) |
| $10,000 to $12,499 | 13 (16.3%) | 14 (23.7%) |
| $12,500 to $14,999 | 0 (0.0%) | 7 (11.9%) |
| $15,000 to $17,499 | 0 (0.0%) | 0 (0.0%) |
| $17,500 to $19,999 | 0 (0.0%) | 4 (6.8%) |
| $20,000 to $22,499 | 0 (0.0%) | 5 (8.5%) |
| $22,500 to $24,999 | 0 (0.0%) | 0 (0.0%) |
| $25,000 to $29,999 | 5 (6.2%) | 6 (10.2%) |
| $30,000 to $34,999 | 0 (0.0%) | 0 (0.0%) |
| $35,000 to $39,999 | 0 (0.0%) | 0 (0.0%) |
| $40,000 to $44,999 | 8 (10.0%) | 0 (0.0%) |
| $45,000 to $49,999 | 7 (8.7%) | 0 (0.0%) |
| $50,000 to $54,999 | 8 (10.0%) | 0 (0.0%) |
| $55,000 to $64,999 | 14 (17.5%) | 0 (0.0%) |
| $65,000 to $74,999 | 5 (6.2%) | 5 (8.5%) |
| $75,000 to $99,999 | 6 (7.5%) | 4 (6.8%) |
| $100,000+ | 14 (17.5%) | 0 (0.0%) |
| Total | 80 (100.0%) | 59 (100.0%) |
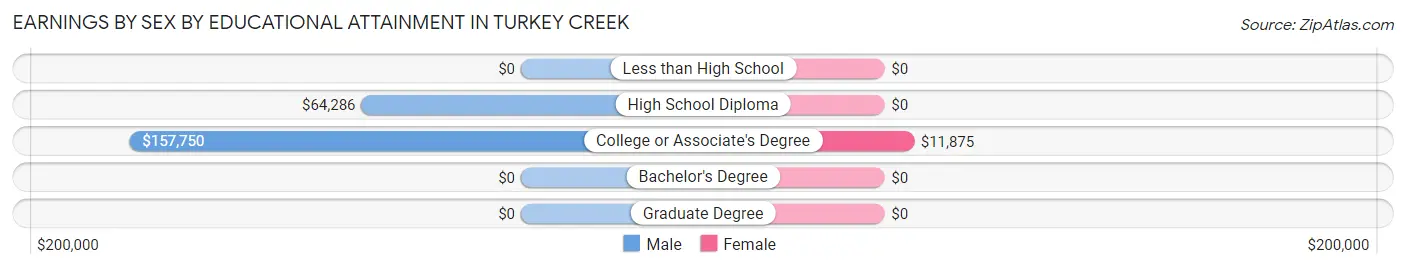
Earnings by Sex by Educational Attainment in Turkey Creek
Average earnings in Turkey Creek are $63,036 for men and $12,679 for women, a difference of 79.9%. Men with an educational attainment of college or associate's degree enjoy the highest average annual earnings of $157,750, while those with high school diploma education earn the least with $64,286. Women with an educational attainment of college or associate's degree earn the most with the average annual earnings of $11,875, while those with college or associate's degree education have the smallest earnings of $11,875.
| Educational Attainment | Male Income | Female Income |
| Less than High School | - | - |
| High School Diploma | $64,286 | $0 |
| College or Associate's Degree | $157,750 | $11,875 |
| Bachelor's Degree | - | - |
| Graduate Degree | - | - |
| Total | $63,036 | $12,679 |
Family Income in Turkey Creek
Family Income Brackets in Turkey Creek
According to the Turkey Creek family income data, there are 32 families falling into the $25,000 to $34,999 income range, which is the most common income bracket and makes up 32.3% of all families.
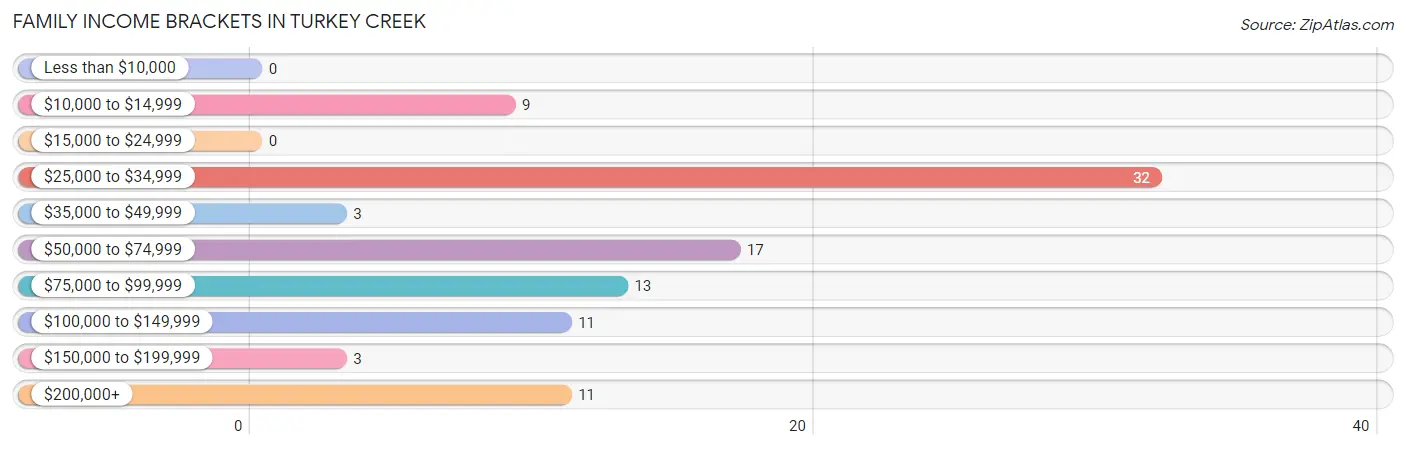
| Income Bracket | # Families | % Families |
| Less than $10,000 | 0 | 0.0% |
| $10,000 to $14,999 | 9 | 9.1% |
| $15,000 to $24,999 | 0 | 0.0% |
| $25,000 to $34,999 | 32 | 32.3% |
| $35,000 to $49,999 | 3 | 3.0% |
| $50,000 to $74,999 | 17 | 17.2% |
| $75,000 to $99,999 | 13 | 13.1% |
| $100,000 to $149,999 | 11 | 11.1% |
| $150,000 to $199,999 | 3 | 3.0% |
| $200,000+ | 11 | 11.1% |
Family Income by Famaliy Size in Turkey Creek
4-person families (20 | 20.2%) account for the highest median family income in Turkey Creek with $77,917 per family, while 4-person families (20 | 20.2%) have the highest median income of $19,479 per family member.
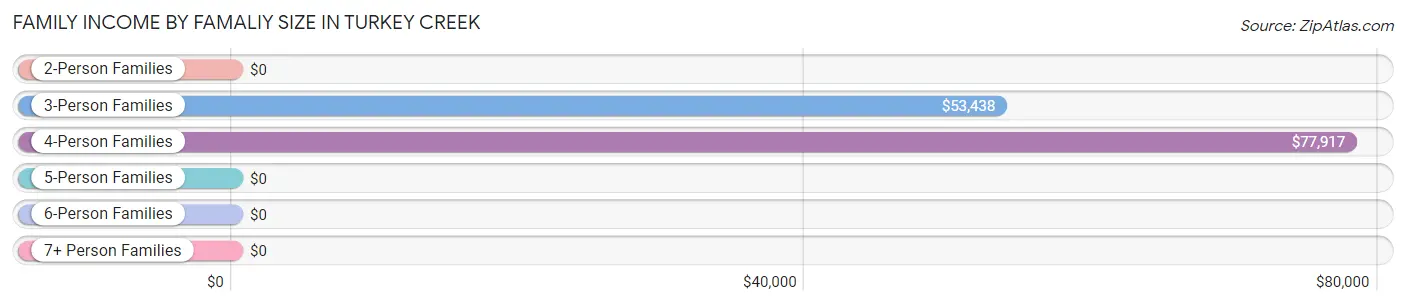
| Income Bracket | # Families | Median Income |
| 2-Person Families | 40 (40.4%) | $0 |
| 3-Person Families | 25 (25.3%) | $53,438 |
| 4-Person Families | 20 (20.2%) | $77,917 |
| 5-Person Families | 14 (14.1%) | $0 |
| 6-Person Families | 0 (0.0%) | $0 |
| 7+ Person Families | 0 (0.0%) | $0 |
| Total | 99 (100.0%) | $51,528 |
Family Income by Number of Earners in Turkey Creek
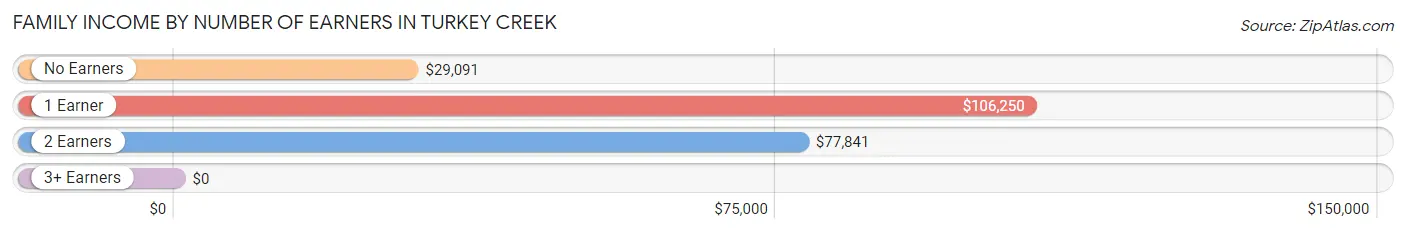
| Number of Earners | # Families | Median Income |
| No Earners | 32 (32.3%) | $29,091 |
| 1 Earner | 35 (35.3%) | $106,250 |
| 2 Earners | 27 (27.3%) | $77,841 |
| 3+ Earners | 5 (5.1%) | $0 |
| Total | 99 (100.0%) | $51,528 |
Household Income in Turkey Creek
Household Income Brackets in Turkey Creek
With 43 households falling in the category, the $25,000 to $34,999 income range is the most frequent in Turkey Creek, accounting for 29.4% of all households. In contrast, only 2 households (1.4%) fall into the less than $10,000 income bracket, making it the least populous group.
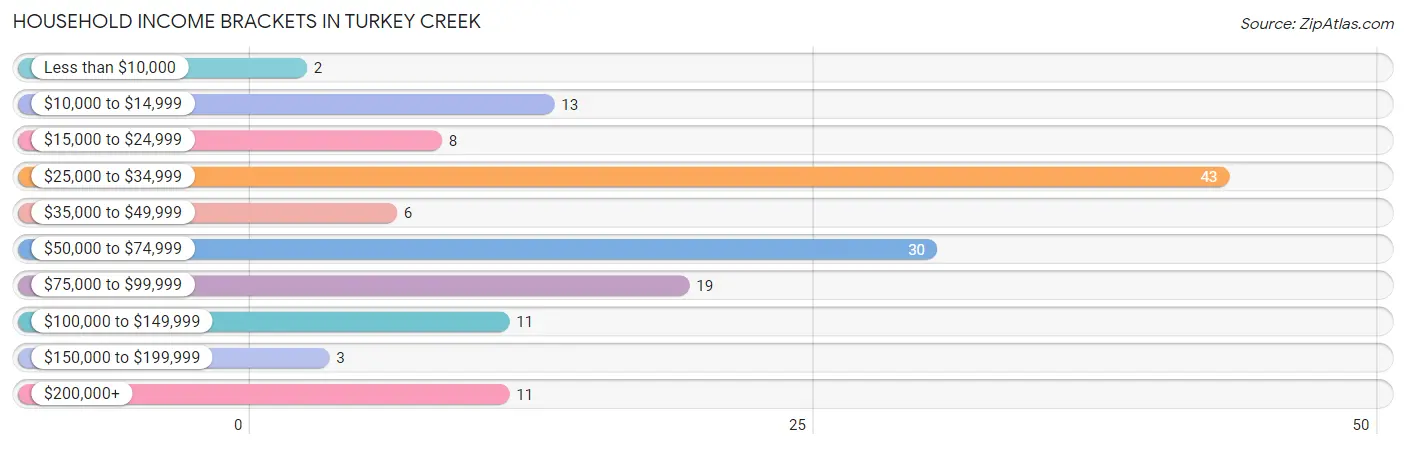
| Income Bracket | # Households | % Households |
| Less than $10,000 | 2 | 1.4% |
| $10,000 to $14,999 | 13 | 8.9% |
| $15,000 to $24,999 | 8 | 5.5% |
| $25,000 to $34,999 | 43 | 29.5% |
| $35,000 to $49,999 | 6 | 4.1% |
| $50,000 to $74,999 | 30 | 20.5% |
| $75,000 to $99,999 | 19 | 13.0% |
| $100,000 to $149,999 | 11 | 7.5% |
| $150,000 to $199,999 | 3 | 2.1% |
| $200,000+ | 11 | 7.5% |
Household Income by Householder Age in Turkey Creek
The median household income in Turkey Creek is $50,278, with the highest median household income of $59,464 found in the 25 to 44 years age bracket for the primary householder. A total of 55 households (37.7%) fall into this category. Meanwhile, the 15 to 24 years age bracket for the primary householder has the lowest median household income of $0, with 5 households (3.4%) in this group.
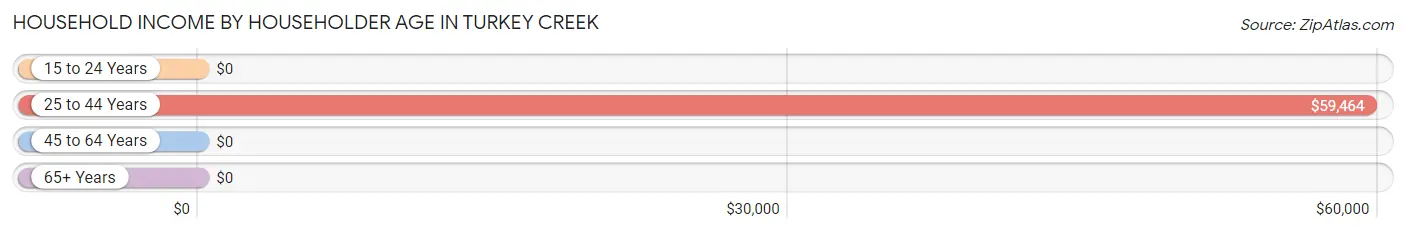
| Income Bracket | # Households | Median Income |
| 15 to 24 Years | 5 (3.4%) | $0 |
| 25 to 44 Years | 55 (37.7%) | $59,464 |
| 45 to 64 Years | 32 (21.9%) | $0 |
| 65+ Years | 54 (37.0%) | $0 |
| Total | 146 (100.0%) | $50,278 |
Poverty in Turkey Creek
Income Below Poverty by Sex and Age in Turkey Creek
With 9.0% poverty level for males and 26.2% for females among the residents of Turkey Creek, 12 to 14 year old males and 25 to 34 year old females are the most vulnerable to poverty, with 7 males (29.2%) and 11 females (55.0%) in their respective age groups living below the poverty level.
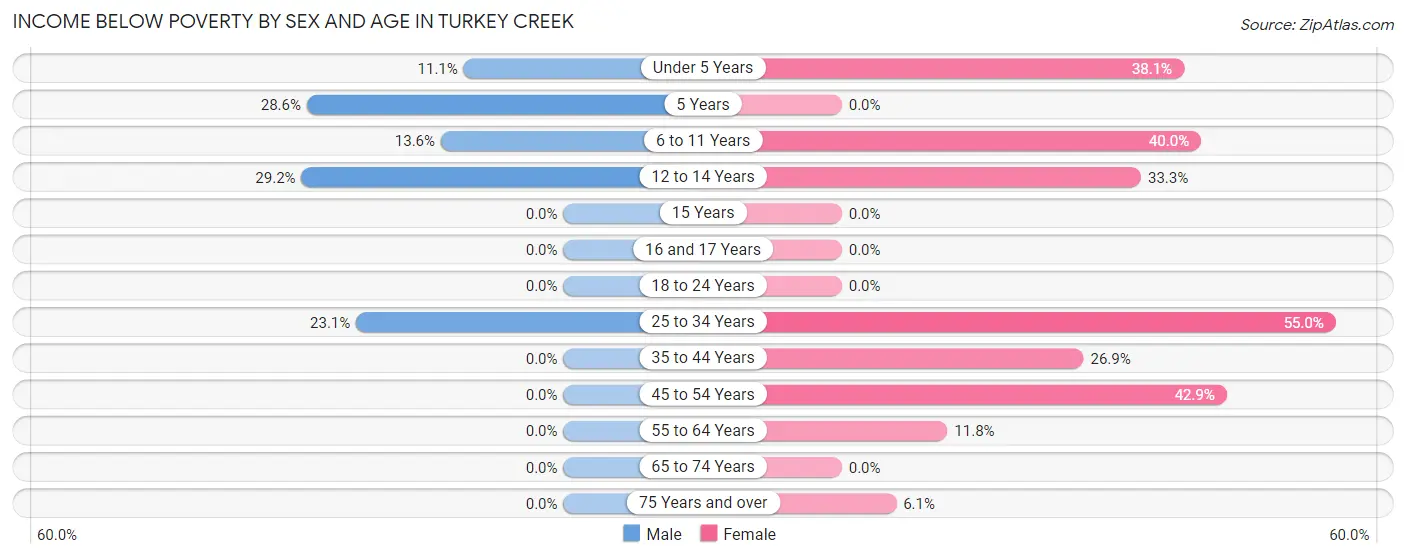
| Age Bracket | Male | Female |
| Under 5 Years | 1 (11.1%) | 8 (38.1%) |
| 5 Years | 2 (28.6%) | 0 (0.0%) |
| 6 to 11 Years | 3 (13.6%) | 2 (40.0%) |
| 12 to 14 Years | 7 (29.2%) | 2 (33.3%) |
| 15 Years | 0 (0.0%) | 0 (0.0%) |
| 16 and 17 Years | 0 (0.0%) | 0 (0.0%) |
| 18 to 24 Years | 0 (0.0%) | 0 (0.0%) |
| 25 to 34 Years | 6 (23.1%) | 11 (55.0%) |
| 35 to 44 Years | 0 (0.0%) | 7 (26.9%) |
| 45 to 54 Years | 0 (0.0%) | 9 (42.9%) |
| 55 to 64 Years | 0 (0.0%) | 2 (11.8%) |
| 65 to 74 Years | 0 (0.0%) | 0 (0.0%) |
| 75 Years and over | 0 (0.0%) | 2 (6.1%) |
| Total | 19 (9.0%) | 43 (26.2%) |
Income Above Poverty by Sex and Age in Turkey Creek
According to the poverty statistics in Turkey Creek, males aged 15 years and females aged 5 years are the age groups that are most secure financially, with 100.0% of males and 100.0% of females in these age groups living above the poverty line.
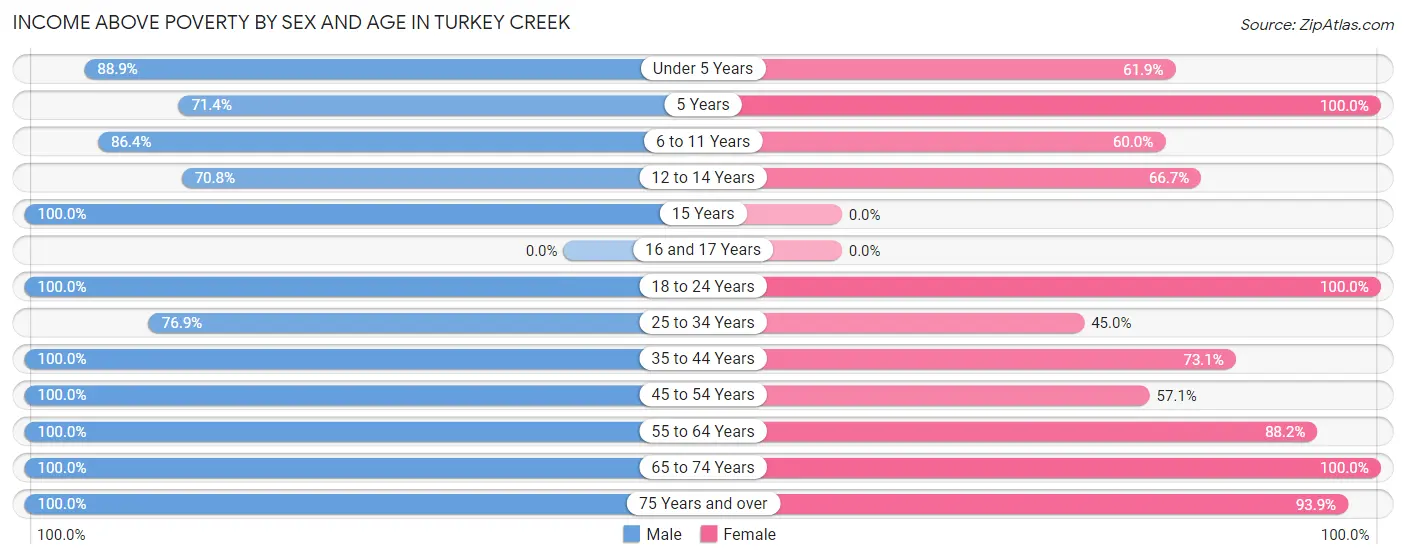
| Age Bracket | Male | Female |
| Under 5 Years | 8 (88.9%) | 13 (61.9%) |
| 5 Years | 5 (71.4%) | 3 (100.0%) |
| 6 to 11 Years | 19 (86.4%) | 3 (60.0%) |
| 12 to 14 Years | 17 (70.8%) | 4 (66.7%) |
| 15 Years | 5 (100.0%) | 0 (0.0%) |
| 16 and 17 Years | 0 (0.0%) | 0 (0.0%) |
| 18 to 24 Years | 23 (100.0%) | 11 (100.0%) |
| 25 to 34 Years | 20 (76.9%) | 9 (45.0%) |
| 35 to 44 Years | 40 (100.0%) | 19 (73.1%) |
| 45 to 54 Years | 3 (100.0%) | 12 (57.1%) |
| 55 to 64 Years | 18 (100.0%) | 15 (88.2%) |
| 65 to 74 Years | 21 (100.0%) | 1 (100.0%) |
| 75 Years and over | 12 (100.0%) | 31 (93.9%) |
| Total | 191 (90.9%) | 121 (73.8%) |
Income Below Poverty Among Married-Couple Families in Turkey Creek
The poverty statistics for married-couple families in Turkey Creek show that 4.0% or 3 of the total 75 families live below the poverty line. Families with 1 or 2 children have the highest poverty rate of 9.4%, comprising of 3 families. On the other hand, families with no children have the lowest poverty rate of 0.0%, which includes 0 families.
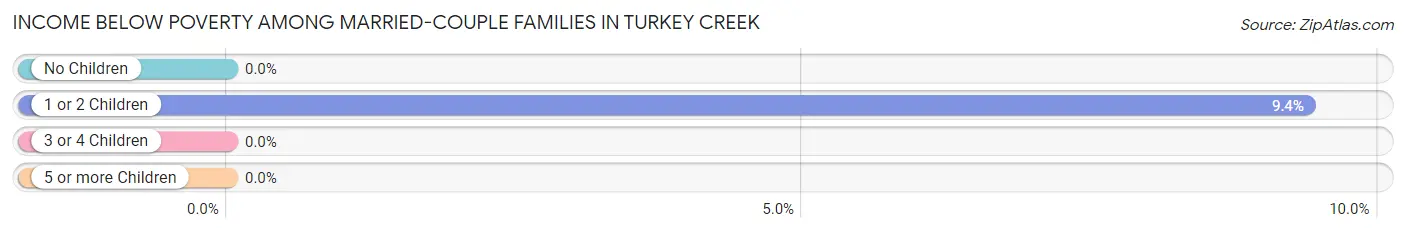
| Children | Above Poverty | Below Poverty |
| No Children | 37 (100.0%) | 0 (0.0%) |
| 1 or 2 Children | 29 (90.6%) | 3 (9.4%) |
| 3 or 4 Children | 6 (100.0%) | 0 (0.0%) |
| 5 or more Children | 0 (0.0%) | 0 (0.0%) |
| Total | 72 (96.0%) | 3 (4.0%) |
Income Below Poverty Among Single-Parent Households in Turkey Creek
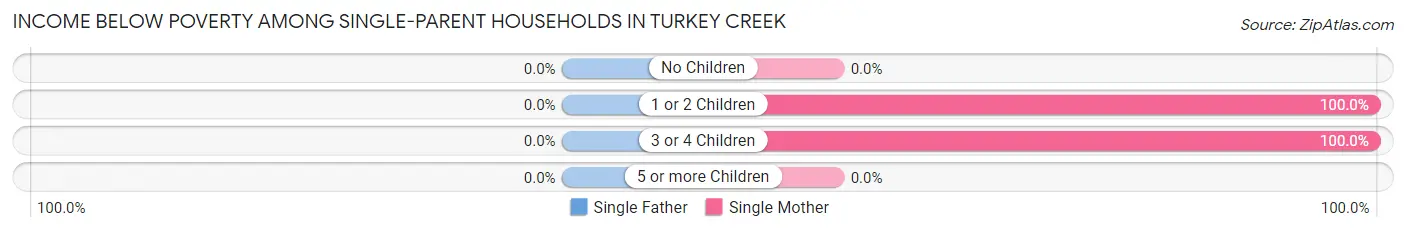
| Children | Single Father | Single Mother |
| No Children | 0 (0.0%) | 0 (0.0%) |
| 1 or 2 Children | 0 (0.0%) | 3 (100.0%) |
| 3 or 4 Children | 0 (0.0%) | 7 (100.0%) |
| 5 or more Children | 0 (0.0%) | 0 (0.0%) |
| Total | 0 (0.0%) | 10 (47.6%) |
Income Below Poverty Among Married-Couple vs Single-Parent Households in Turkey Creek
The poverty data for Turkey Creek shows that 3 of the married-couple family households (4.0%) and 10 of the single-parent households (41.7%) are living below the poverty level. Within the married-couple family households, those with 1 or 2 children have the highest poverty rate, with 3 households (9.4%) falling below the poverty line. Among the single-parent households, those with 3 or 4 children have the highest poverty rate, with 7 household (100.0%) living below poverty.
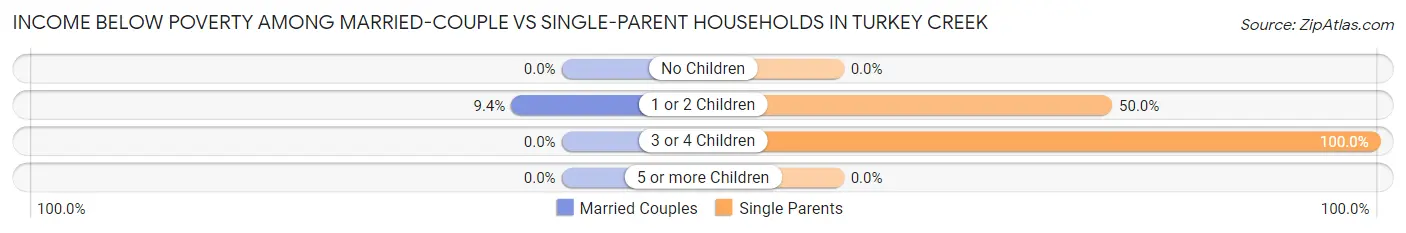
| Children | Married-Couple Families | Single-Parent Households |
| No Children | 0 (0.0%) | 0 (0.0%) |
| 1 or 2 Children | 3 (9.4%) | 3 (50.0%) |
| 3 or 4 Children | 0 (0.0%) | 7 (100.0%) |
| 5 or more Children | 0 (0.0%) | 0 (0.0%) |
| Total | 3 (4.0%) | 10 (41.7%) |
Race in Turkey Creek
The most populous races in Turkey Creek are White / Caucasian (353 | 94.4%), Two or more Races (17 | 4.5%), and Native / Alaskan (4 | 1.1%).
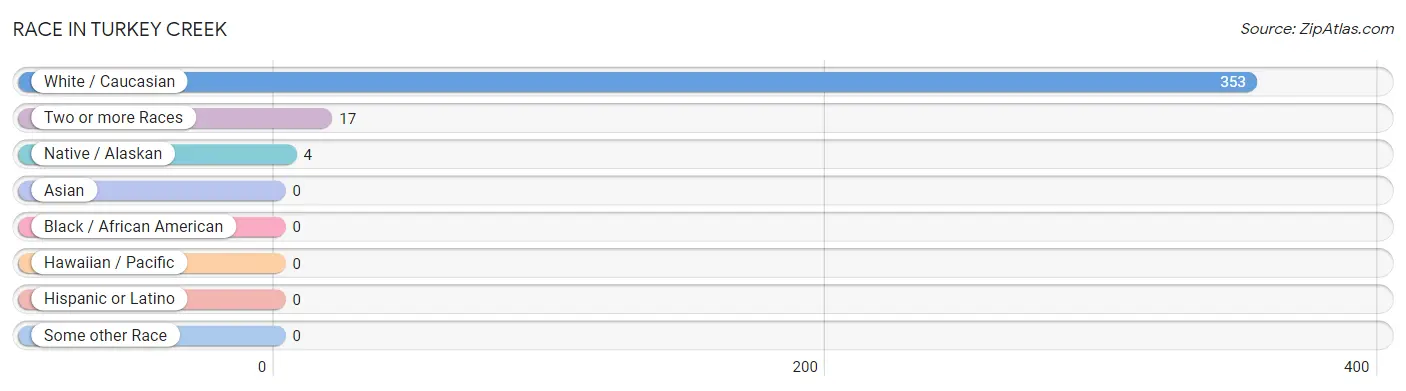
| Race | # Population | % Population |
| Asian | 0 | 0.0% |
| Black / African American | 0 | 0.0% |
| Hawaiian / Pacific | 0 | 0.0% |
| Hispanic or Latino | 0 | 0.0% |
| Native / Alaskan | 4 | 1.1% |
| White / Caucasian | 353 | 94.4% |
| Two or more Races | 17 | 4.5% |
| Some other Race | 0 | 0.0% |
| Total | 374 | 100.0% |
Ancestry in Turkey Creek
The most populous ancestries reported in Turkey Creek are French (148 | 39.6%), German (35 | 9.4%), American (27 | 7.2%), Irish (27 | 7.2%), and English (23 | 6.1%), together accounting for 69.5% of all Turkey Creek residents.
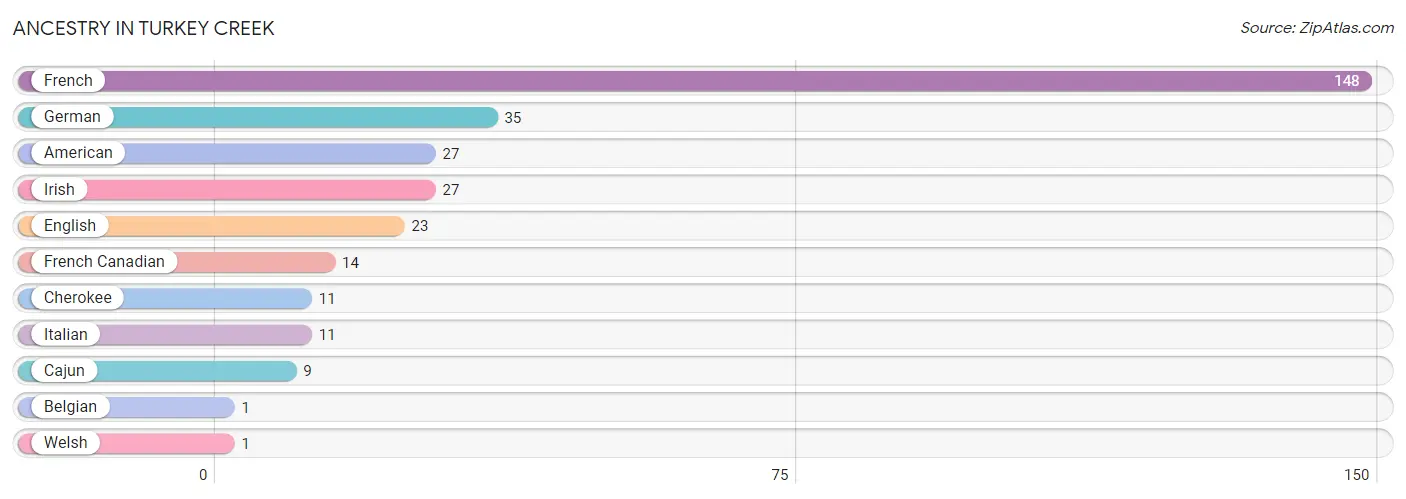
| Ancestry | # Population | % Population |
| American | 27 | 7.2% |
| Belgian | 1 | 0.3% |
| Cajun | 9 | 2.4% |
| Cherokee | 11 | 2.9% |
| English | 23 | 6.1% |
| French | 148 | 39.6% |
| French Canadian | 14 | 3.7% |
| German | 35 | 9.4% |
| Irish | 27 | 7.2% |
| Italian | 11 | 2.9% |
| Welsh | 1 | 0.3% | View All 11 Rows |
Immigrants in Turkey Creek
The most numerous immigrant groups reported in Turkey Creek came from , and Canada (10 | 2.7%), together accounting for 2.7% of all Turkey Creek residents.

| Immigration Origin | # Population | % Population |
| Canada | 10 | 2.7% | View All 1 Rows |
Sex and Age in Turkey Creek
Sex and Age in Turkey Creek
The most populous age groups in Turkey Creek are 10 to 14 Years (29 | 13.8%) for men and 35 to 39 Years (23 | 14.0%) for women.
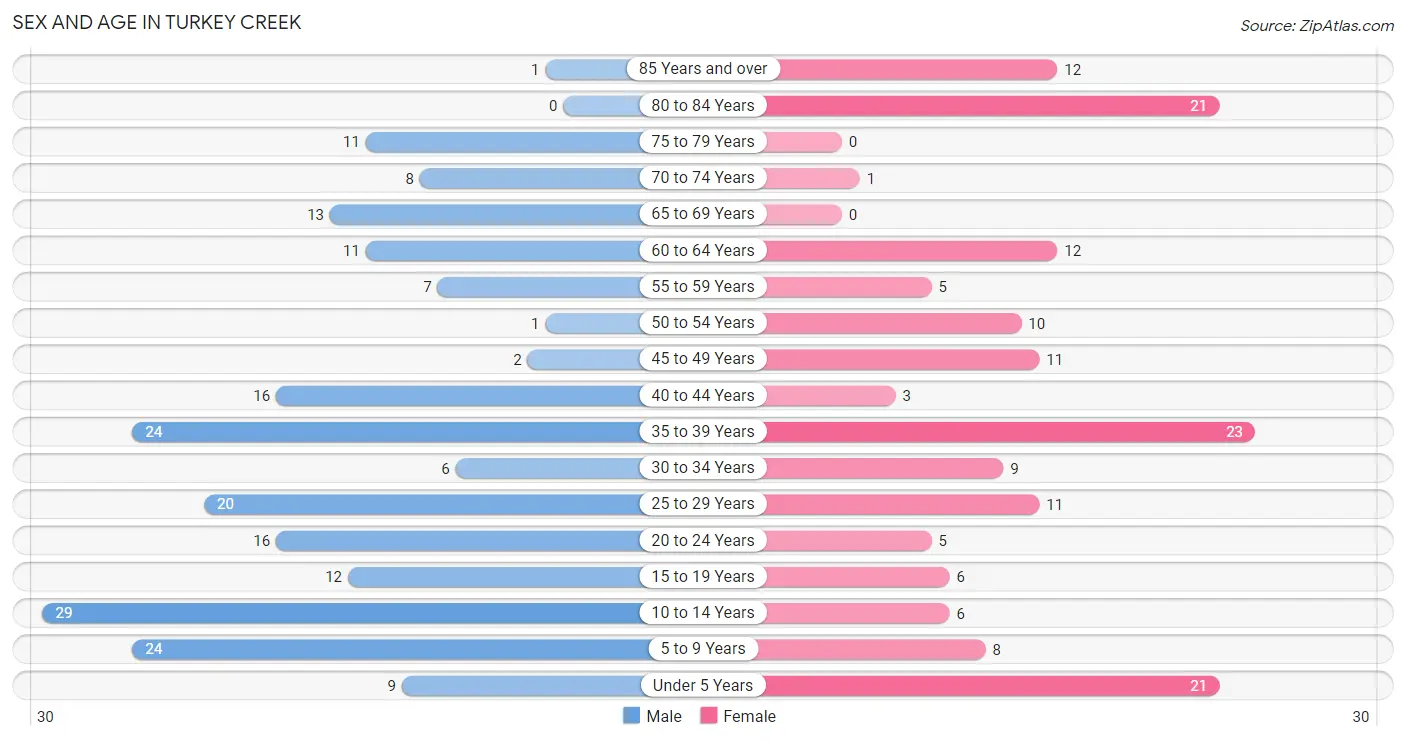
| Age Bracket | Male | Female |
| Under 5 Years | 9 (4.3%) | 21 (12.8%) |
| 5 to 9 Years | 24 (11.4%) | 8 (4.9%) |
| 10 to 14 Years | 29 (13.8%) | 6 (3.7%) |
| 15 to 19 Years | 12 (5.7%) | 6 (3.7%) |
| 20 to 24 Years | 16 (7.6%) | 5 (3.0%) |
| 25 to 29 Years | 20 (9.5%) | 11 (6.7%) |
| 30 to 34 Years | 6 (2.9%) | 9 (5.5%) |
| 35 to 39 Years | 24 (11.4%) | 23 (14.0%) |
| 40 to 44 Years | 16 (7.6%) | 3 (1.8%) |
| 45 to 49 Years | 2 (0.9%) | 11 (6.7%) |
| 50 to 54 Years | 1 (0.5%) | 10 (6.1%) |
| 55 to 59 Years | 7 (3.3%) | 5 (3.0%) |
| 60 to 64 Years | 11 (5.2%) | 12 (7.3%) |
| 65 to 69 Years | 13 (6.2%) | 0 (0.0%) |
| 70 to 74 Years | 8 (3.8%) | 1 (0.6%) |
| 75 to 79 Years | 11 (5.2%) | 0 (0.0%) |
| 80 to 84 Years | 0 (0.0%) | 21 (12.8%) |
| 85 Years and over | 1 (0.5%) | 12 (7.3%) |
| Total | 210 (100.0%) | 164 (100.0%) |
Families and Households in Turkey Creek
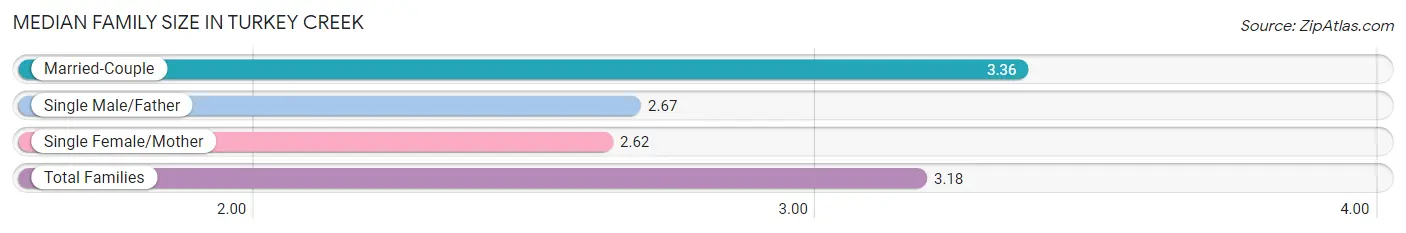
Median Family Size in Turkey Creek
The median family size in Turkey Creek is 3.18 persons per family, with married-couple families (75 | 75.8%) accounting for the largest median family size of 3.36 persons per family. On the other hand, single female/mother families (21 | 21.2%) represent the smallest median family size with 2.62 persons per family.
| Family Type | # Families | Family Size |
| Married-Couple | 75 (75.8%) | 3.36 |
| Single Male/Father | 3 (3.0%) | 2.67 |
| Single Female/Mother | 21 (21.2%) | 2.62 |
| Total Families | 99 (100.0%) | 3.18 |
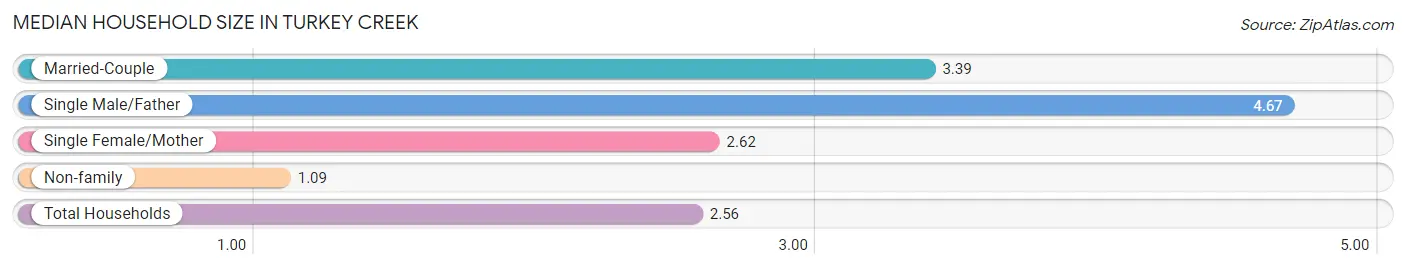
Median Household Size in Turkey Creek
The median household size in Turkey Creek is 2.56 persons per household, with single male/father households (3 | 2.1%) accounting for the largest median household size of 4.67 persons per household. non-family households (47 | 32.2%) represent the smallest median household size with 1.09 persons per household.
| Household Type | # Households | Household Size |
| Married-Couple | 75 (51.4%) | 3.39 |
| Single Male/Father | 3 (2.1%) | 4.67 |
| Single Female/Mother | 21 (14.4%) | 2.62 |
| Non-family | 47 (32.2%) | 1.09 |
| Total Households | 146 (100.0%) | 2.56 |
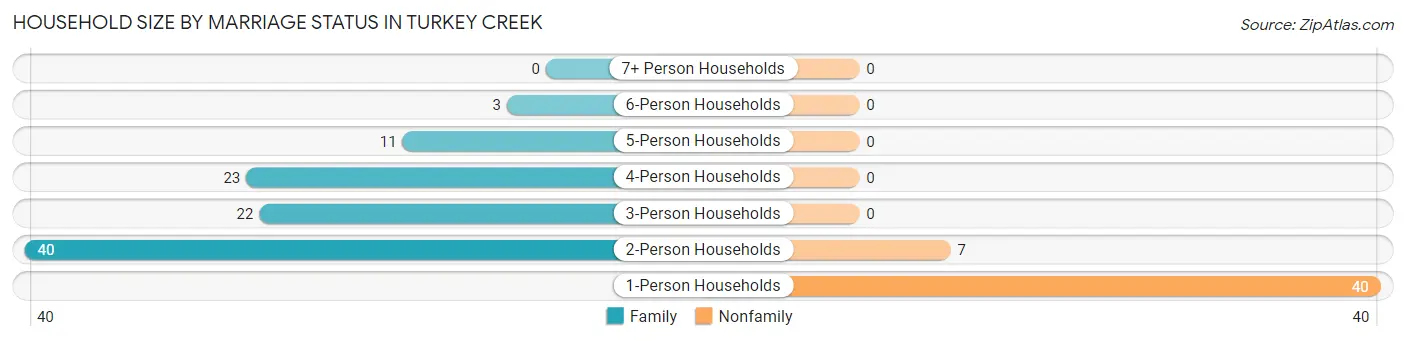
Household Size by Marriage Status in Turkey Creek
Out of a total of 146 households in Turkey Creek, 99 (67.8%) are family households, while 47 (32.2%) are nonfamily households. The most numerous type of family households are 2-person households, comprising 40, and the most common type of nonfamily households are 1-person households, comprising 40.
| Household Size | Family Households | Nonfamily Households |
| 1-Person Households | - | 40 (27.4%) |
| 2-Person Households | 40 (27.4%) | 7 (4.8%) |
| 3-Person Households | 22 (15.1%) | 0 (0.0%) |
| 4-Person Households | 23 (15.8%) | 0 (0.0%) |
| 5-Person Households | 11 (7.5%) | 0 (0.0%) |
| 6-Person Households | 3 (2.1%) | 0 (0.0%) |
| 7+ Person Households | 0 (0.0%) | 0 (0.0%) |
| Total | 99 (67.8%) | 47 (32.2%) |
Female Fertility in Turkey Creek
Fertility by Age in Turkey Creek
Average fertility rate in Turkey Creek is 188.0 births per 1,000 women. Women in the age bracket of 20 to 34 years have the highest fertility rate with 520.0 births per 1,000 women. Women in the age bracket of 20 to 34 years acount for 100.0% of all women with births.
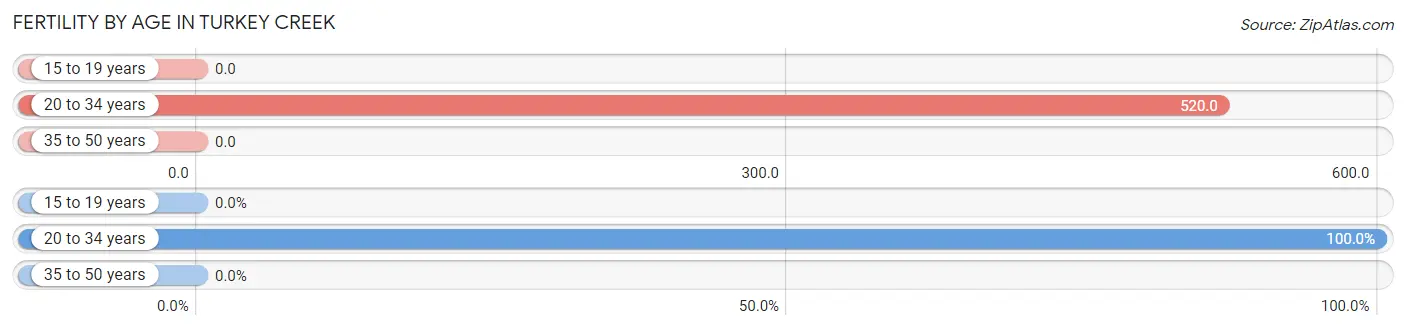
| Age Bracket | Women with Births | Births / 1,000 Women |
| 15 to 19 years | 0 (0.0%) | 0.0 |
| 20 to 34 years | 13 (100.0%) | 520.0 |
| 35 to 50 years | 0 (0.0%) | 0.0 |
| Total | 13 (100.0%) | 188.0 |
Fertility by Age by Marriage Status in Turkey Creek
53.8% of women with births (13) in Turkey Creek are married. The highest percentage of unmarried women with births falls into 20 to 34 years age bracket with 46.2% of them unmarried at the time of birth, while the lowest percentage of unmarried women with births belong to 20 to 34 years age bracket with 46.2% of them unmarried.
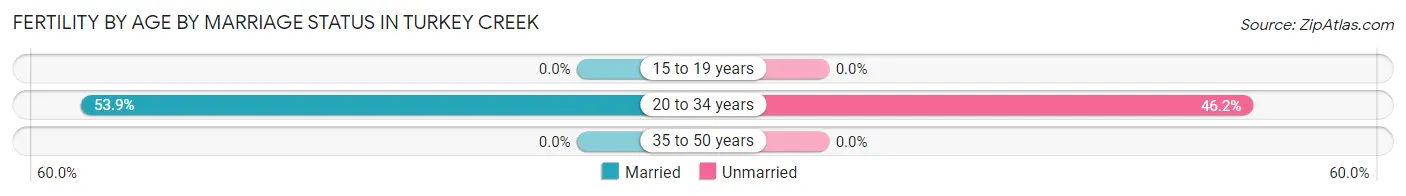
| Age Bracket | Married | Unmarried |
| 15 to 19 years | 0 (0.0%) | 0 (0.0%) |
| 20 to 34 years | 7 (53.8%) | 6 (46.2%) |
| 35 to 50 years | 0 (0.0%) | 0 (0.0%) |
| Total | 7 (53.8%) | 6 (46.2%) |
Fertility by Education in Turkey Creek
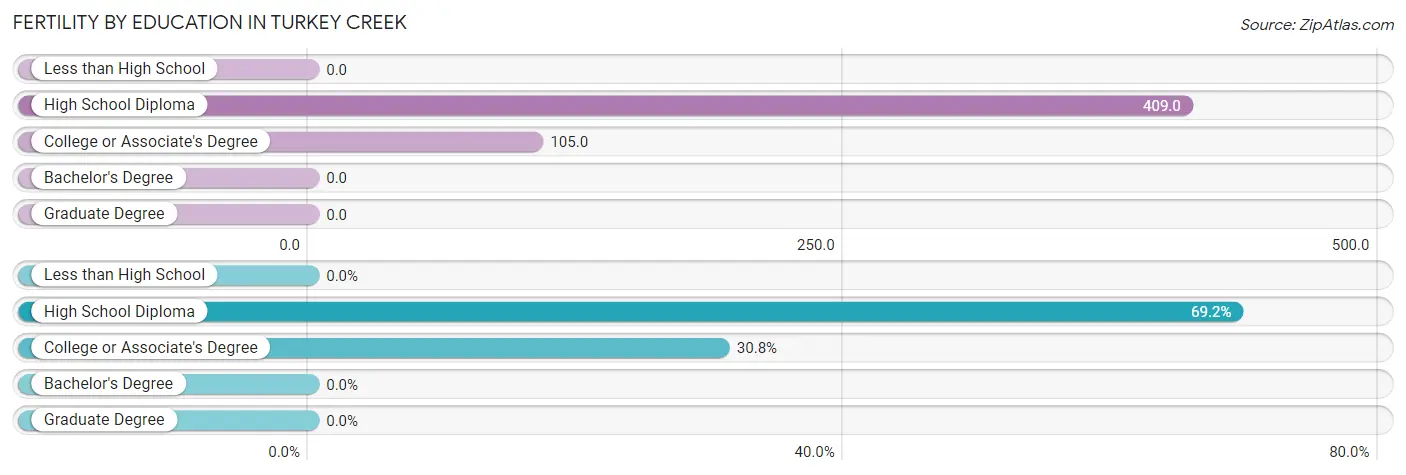
| Educational Attainment | Women with Births | Births / 1,000 Women |
| Less than High School | 0 (0.0%) | 0.0 |
| High School Diploma | 9 (69.2%) | 409.0 |
| College or Associate's Degree | 4 (30.8%) | 105.0 |
| Bachelor's Degree | 0 (0.0%) | 0.0 |
| Graduate Degree | 0 (0.0%) | 0.0 |
| Total | 13 (100.0%) | 188.0 |
Fertility by Education by Marriage Status in Turkey Creek
46.2% of women with births in Turkey Creek are unmarried. Women with the educational attainment of college or associate's degree are most likely to be married with 100.0% of them married at childbirth, while women with the educational attainment of high school diploma are least likely to be married with 66.7% of them unmarried at childbirth.
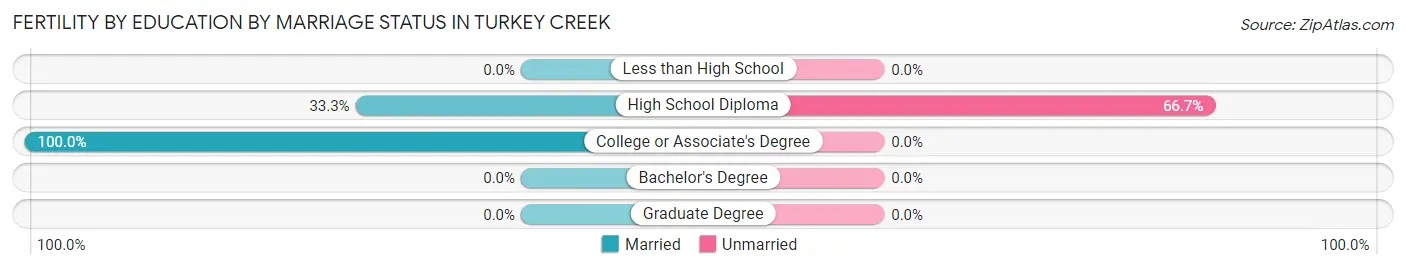
| Educational Attainment | Married | Unmarried |
| Less than High School | 0 (0.0%) | 0 (0.0%) |
| High School Diploma | 3 (33.3%) | 6 (66.7%) |
| College or Associate's Degree | 4 (100.0%) | 0 (0.0%) |
| Bachelor's Degree | 0 (0.0%) | 0 (0.0%) |
| Graduate Degree | 0 (0.0%) | 0 (0.0%) |
| Total | 7 (53.8%) | 6 (46.2%) |
Employment Characteristics in Turkey Creek
Employment by Class of Employer in Turkey Creek
Among the 122 employed individuals in Turkey Creek, private company employees (83 | 68.0%), self-employed (not incorporated) (25 | 20.5%), and federal government employees (6 | 4.9%) make up the most common classes of employment.
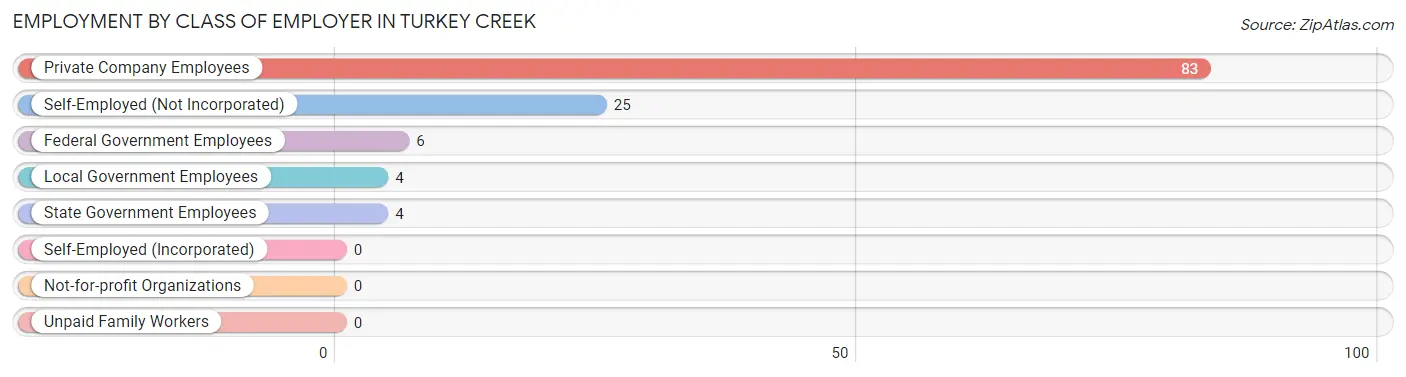
| Employer Class | # Employees | % Employees |
| Private Company Employees | 83 | 68.0% |
| Self-Employed (Incorporated) | 0 | 0.0% |
| Self-Employed (Not Incorporated) | 25 | 20.5% |
| Not-for-profit Organizations | 0 | 0.0% |
| Local Government Employees | 4 | 3.3% |
| State Government Employees | 4 | 3.3% |
| Federal Government Employees | 6 | 4.9% |
| Unpaid Family Workers | 0 | 0.0% |
| Total | 122 | 100.0% |
Employment Status by Age in Turkey Creek
According to the labor force statistics for Turkey Creek, out of the total population over 16 years of age (272), 48.2% or 131 individuals are in the labor force, with 3.1% or 4 of them unemployed. The age group with the highest labor force participation rate is 60 to 64 years, with 91.3% or 21 individuals in the labor force. Within the labor force, the 16 to 19 years age range has the highest percentage of unemployed individuals, with 36.4% or 4 of them being unemployed.
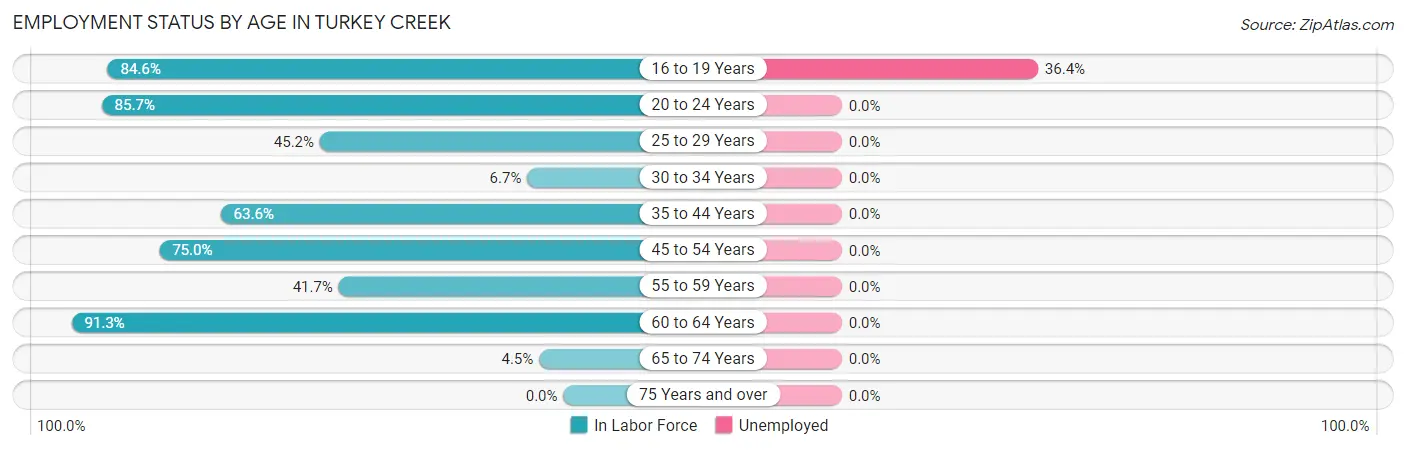
| Age Bracket | In Labor Force | Unemployed |
| 16 to 19 Years | 11 (84.6%) | 4 (36.4%) |
| 20 to 24 Years | 18 (85.7%) | 0 (0.0%) |
| 25 to 29 Years | 14 (45.2%) | 0 (0.0%) |
| 30 to 34 Years | 1 (6.7%) | 0 (0.0%) |
| 35 to 44 Years | 42 (63.6%) | 0 (0.0%) |
| 45 to 54 Years | 18 (75.0%) | 0 (0.0%) |
| 55 to 59 Years | 5 (41.7%) | 0 (0.0%) |
| 60 to 64 Years | 21 (91.3%) | 0 (0.0%) |
| 65 to 74 Years | 1 (4.5%) | 0 (0.0%) |
| 75 Years and over | 0 (0.0%) | 0 (0.0%) |
| Total | 131 (48.2%) | 4 (3.1%) |
Employment Status by Educational Attainment in Turkey Creek
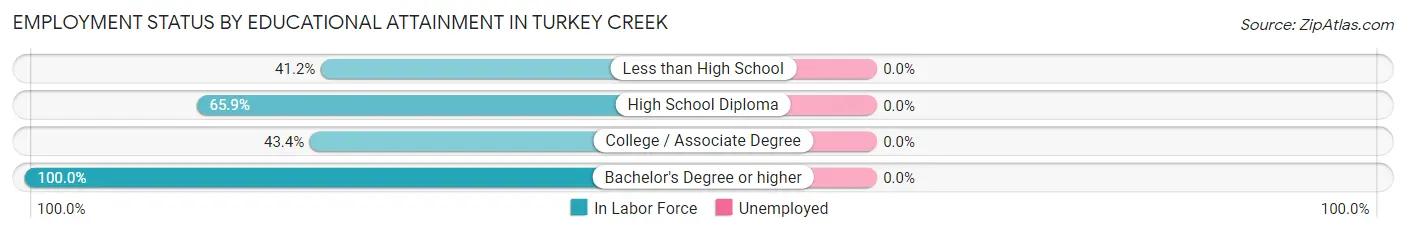
| Educational Attainment | In Labor Force | Unemployed |
| Less than High School | 7 (41.2%) | 0 (0.0%) |
| High School Diploma | 58 (65.9%) | 0 (0.0%) |
| College / Associate Degree | 23 (43.4%) | 0 (0.0%) |
| Bachelor's Degree or higher | 13 (100.0%) | 0 (0.0%) |
| Total | 101 (59.1%) | 0 (0.0%) |
Employment Occupations by Sex in Turkey Creek
Management, Business, Science and Arts Occupations
The most common Management, Business, Science and Arts occupations in Turkey Creek are Community & Social Service (8 | 6.3%), Education Instruction & Library (8 | 6.3%), Health Diagnosing & Treating (5 | 3.9%), Health Technologists (5 | 3.9%), and Management (2 | 1.6%).
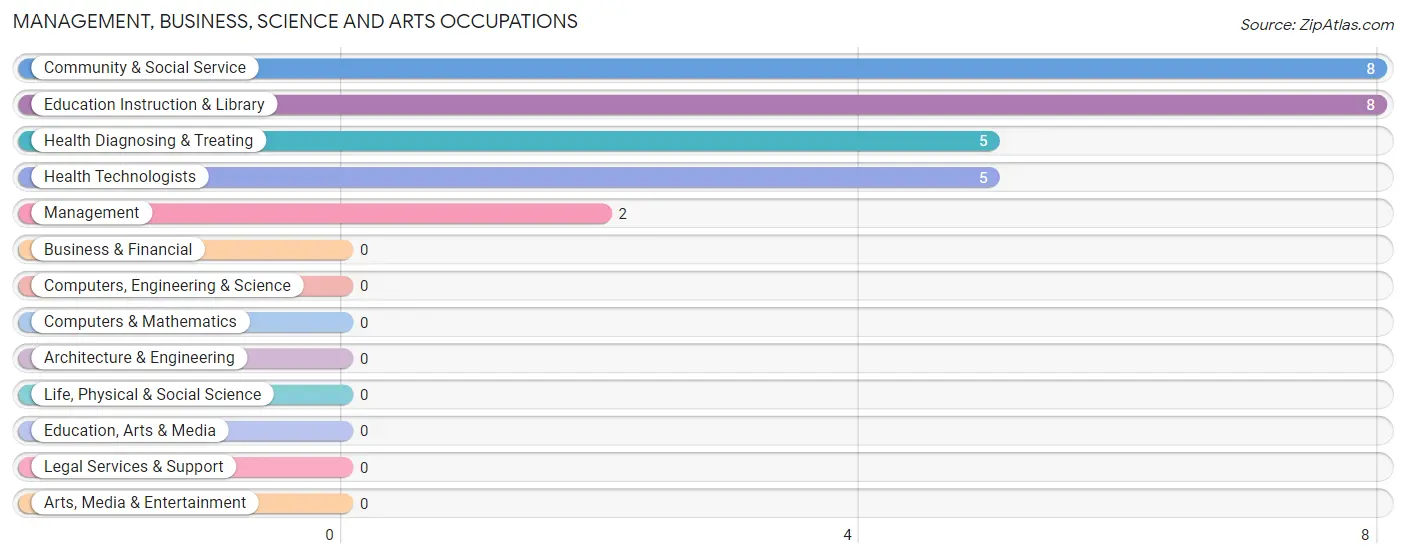
Management, Business, Science and Arts Occupations by Sex
Within the Management, Business, Science and Arts occupations in Turkey Creek, the most male-oriented occupations are Community & Social Service (100.0%), and Education Instruction & Library (100.0%), while the most female-oriented occupations are Management (100.0%), Health Diagnosing & Treating (100.0%), and Health Technologists (100.0%).
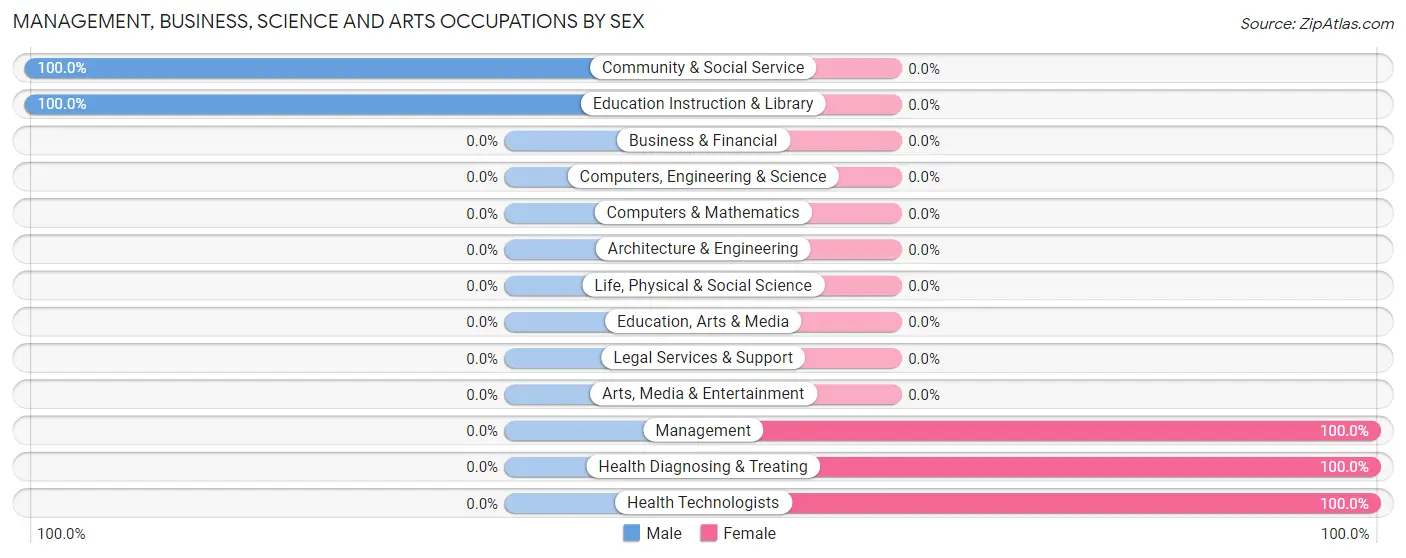
| Occupation | Male | Female |
| Management | 0 (0.0%) | 2 (100.0%) |
| Business & Financial | 0 (0.0%) | 0 (0.0%) |
| Computers, Engineering & Science | 0 (0.0%) | 0 (0.0%) |
| Computers & Mathematics | 0 (0.0%) | 0 (0.0%) |
| Architecture & Engineering | 0 (0.0%) | 0 (0.0%) |
| Life, Physical & Social Science | 0 (0.0%) | 0 (0.0%) |
| Community & Social Service | 8 (100.0%) | 0 (0.0%) |
| Education, Arts & Media | 0 (0.0%) | 0 (0.0%) |
| Legal Services & Support | 0 (0.0%) | 0 (0.0%) |
| Education Instruction & Library | 8 (100.0%) | 0 (0.0%) |
| Arts, Media & Entertainment | 0 (0.0%) | 0 (0.0%) |
| Health Diagnosing & Treating | 0 (0.0%) | 5 (100.0%) |
| Health Technologists | 0 (0.0%) | 5 (100.0%) |
| Total (Category) | 8 (53.3%) | 7 (46.7%) |
| Total (Overall) | 74 (58.3%) | 53 (41.7%) |
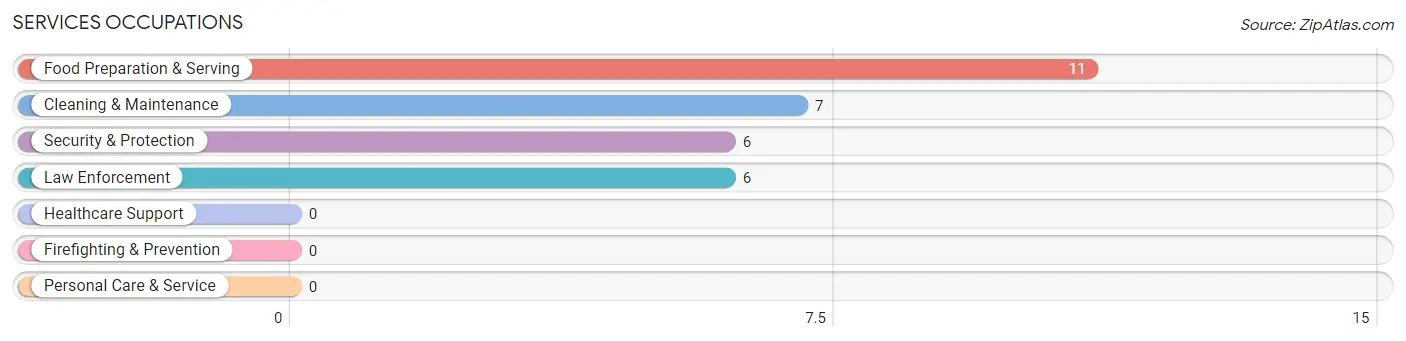
Services Occupations
The most common Services occupations in Turkey Creek are Food Preparation & Serving (11 | 8.7%), Cleaning & Maintenance (7 | 5.5%), Security & Protection (6 | 4.7%), and Law Enforcement (6 | 4.7%).
Services Occupations by Sex
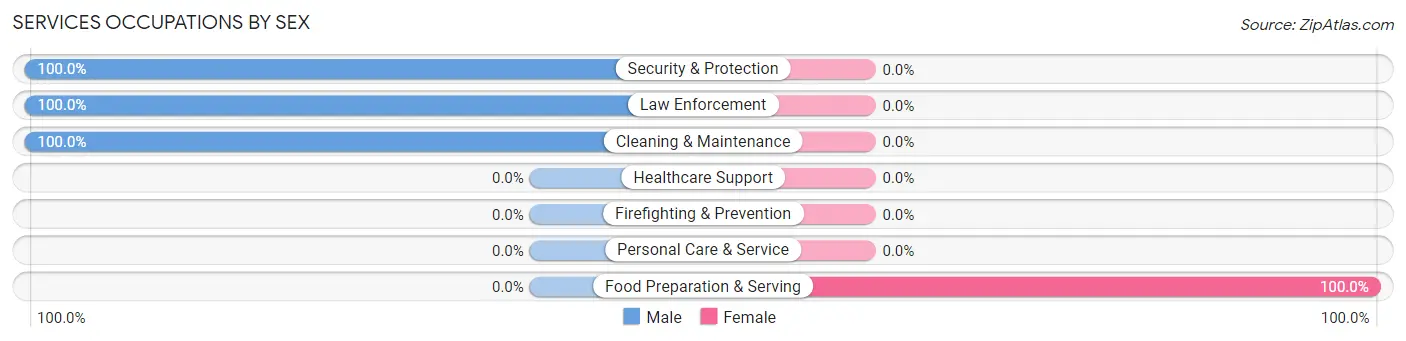
| Occupation | Male | Female |
| Healthcare Support | 0 (0.0%) | 0 (0.0%) |
| Security & Protection | 6 (100.0%) | 0 (0.0%) |
| Firefighting & Prevention | 0 (0.0%) | 0 (0.0%) |
| Law Enforcement | 6 (100.0%) | 0 (0.0%) |
| Food Preparation & Serving | 0 (0.0%) | 11 (100.0%) |
| Cleaning & Maintenance | 7 (100.0%) | 0 (0.0%) |
| Personal Care & Service | 0 (0.0%) | 0 (0.0%) |
| Total (Category) | 13 (54.2%) | 11 (45.8%) |
| Total (Overall) | 74 (58.3%) | 53 (41.7%) |
Sales and Office Occupations
The most common Sales and Office occupations in Turkey Creek are Office & Administration (12 | 9.5%), and Sales & Related (10 | 7.9%).

Sales and Office Occupations by Sex

| Occupation | Male | Female |
| Sales & Related | 0 (0.0%) | 10 (100.0%) |
| Office & Administration | 0 (0.0%) | 12 (100.0%) |
| Total (Category) | 0 (0.0%) | 22 (100.0%) |
| Total (Overall) | 74 (58.3%) | 53 (41.7%) |
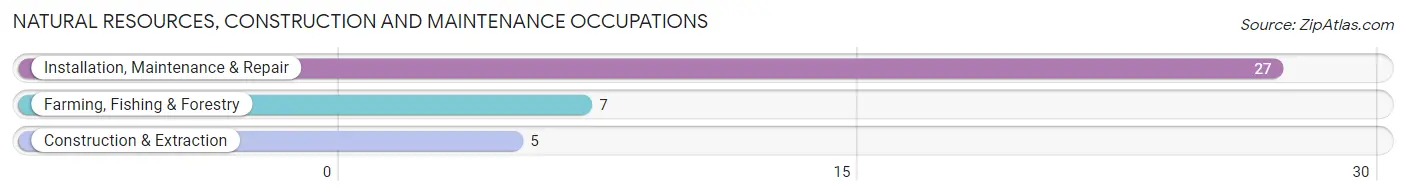
Natural Resources, Construction and Maintenance Occupations
The most common Natural Resources, Construction and Maintenance occupations in Turkey Creek are Installation, Maintenance & Repair (27 | 21.3%), Farming, Fishing & Forestry (7 | 5.5%), and Construction & Extraction (5 | 3.9%).
Natural Resources, Construction and Maintenance Occupations by Sex

| Occupation | Male | Female |
| Farming, Fishing & Forestry | 7 (100.0%) | 0 (0.0%) |
| Construction & Extraction | 5 (100.0%) | 0 (0.0%) |
| Installation, Maintenance & Repair | 27 (100.0%) | 0 (0.0%) |
| Total (Category) | 39 (100.0%) | 0 (0.0%) |
| Total (Overall) | 74 (58.3%) | 53 (41.7%) |
Production, Transportation and Moving Occupations
The most common Production, Transportation and Moving occupations in Turkey Creek are Transportation (24 | 18.9%), Material Moving (2 | 1.6%), and Production (1 | 0.8%).
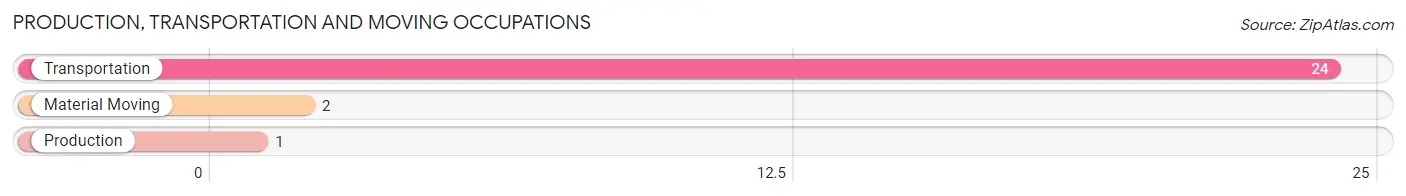
Production, Transportation and Moving Occupations by Sex
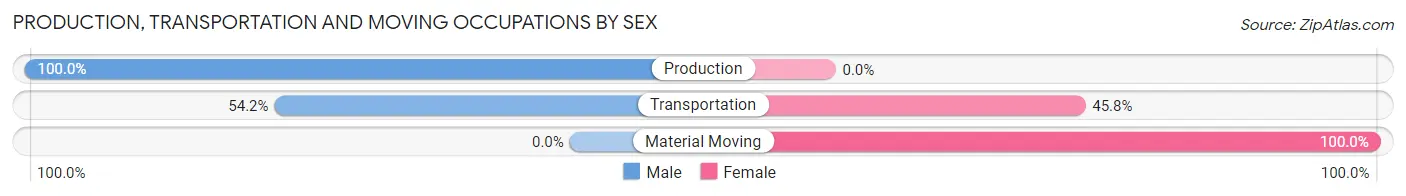
| Occupation | Male | Female |
| Production | 1 (100.0%) | 0 (0.0%) |
| Transportation | 13 (54.2%) | 11 (45.8%) |
| Material Moving | 0 (0.0%) | 2 (100.0%) |
| Total (Category) | 14 (51.8%) | 13 (48.1%) |
| Total (Overall) | 74 (58.3%) | 53 (41.7%) |
Employment Industries by Sex in Turkey Creek
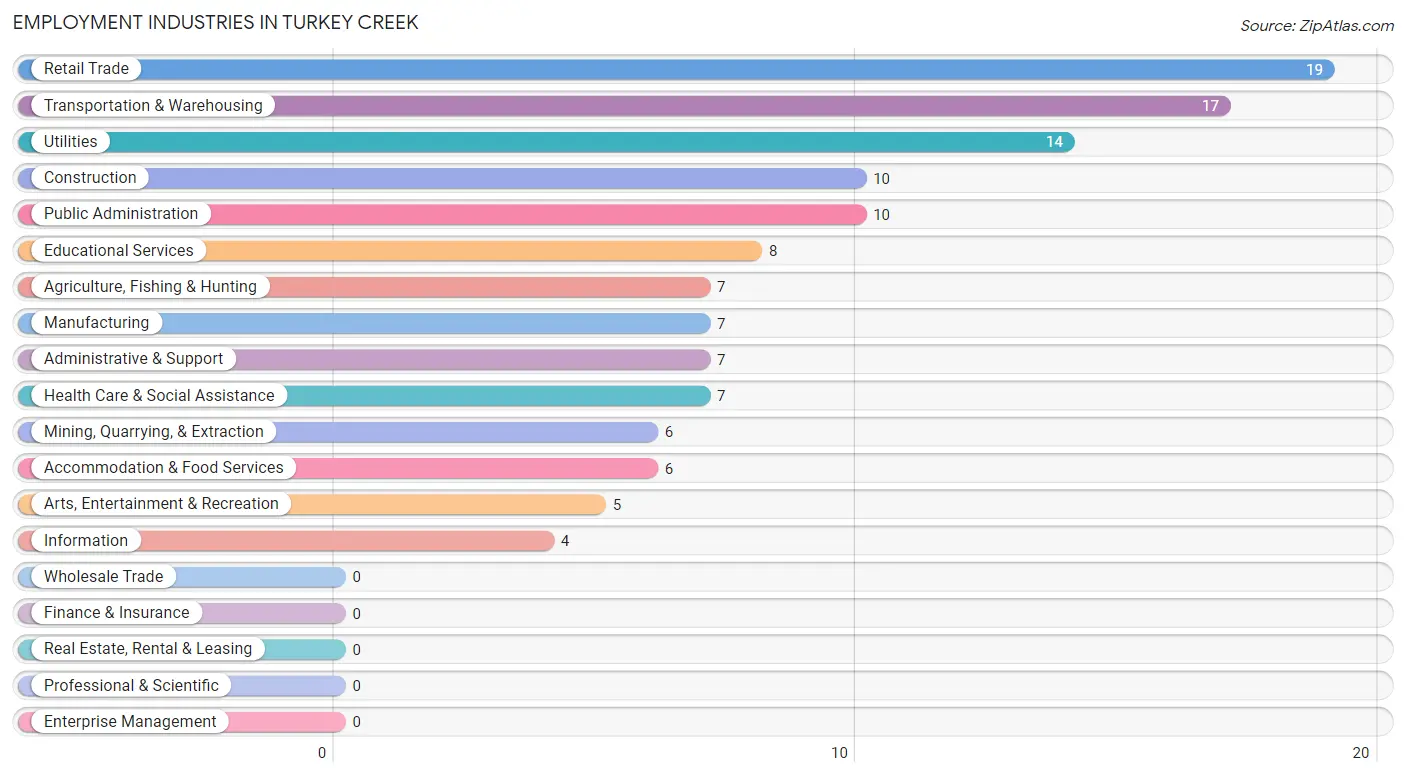
Employment Industries in Turkey Creek
The major employment industries in Turkey Creek include Retail Trade (19 | 15.0%), Transportation & Warehousing (17 | 13.4%), Utilities (14 | 11.0%), Construction (10 | 7.9%), and Public Administration (10 | 7.9%).
Employment Industries by Sex in Turkey Creek
The Turkey Creek industries that see more men than women are Agriculture, Fishing & Hunting (100.0%), Mining, Quarrying, & Extraction (100.0%), and Manufacturing (100.0%), whereas the industries that tend to have a higher number of women are Information (100.0%), Health Care & Social Assistance (100.0%), and Arts, Entertainment & Recreation (100.0%).
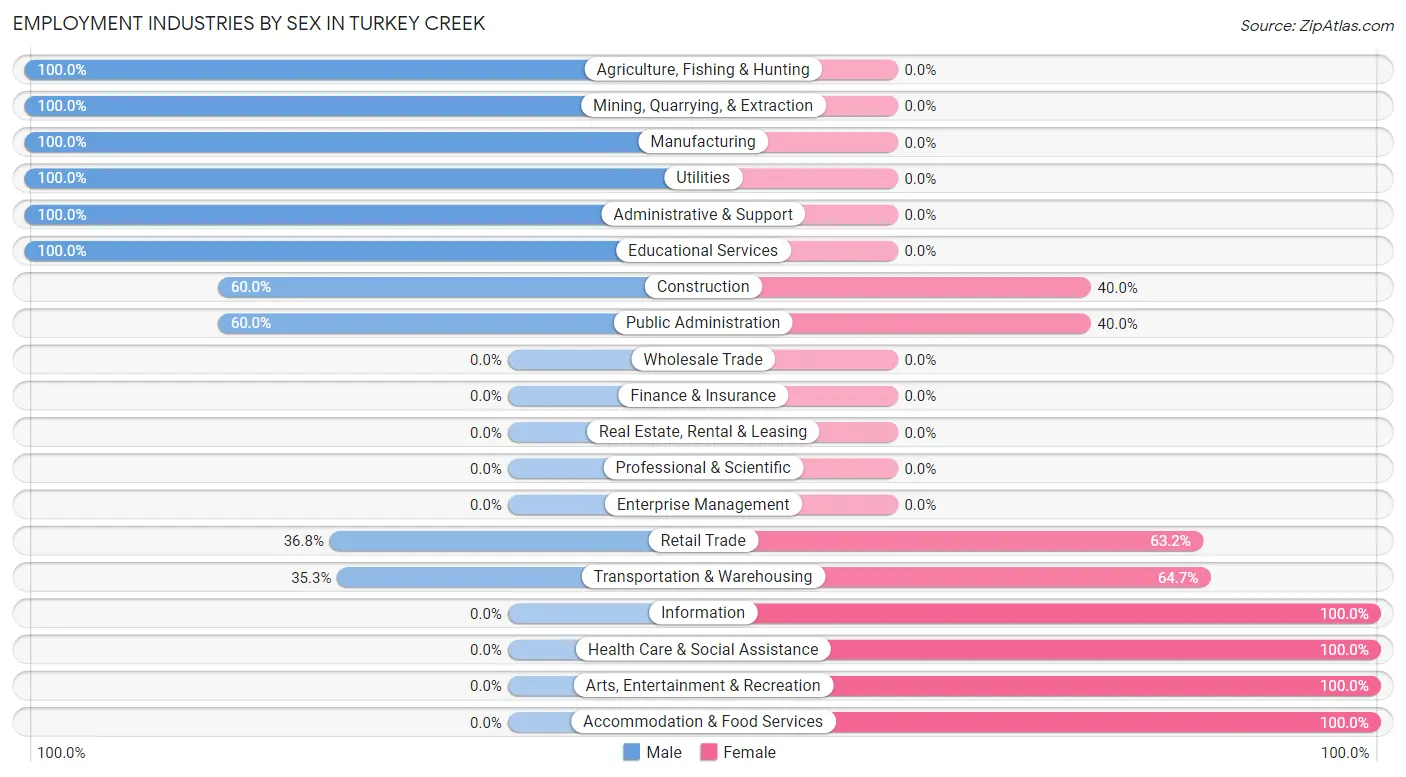
| Industry | Male | Female |
| Agriculture, Fishing & Hunting | 7 (100.0%) | 0 (0.0%) |
| Mining, Quarrying, & Extraction | 6 (100.0%) | 0 (0.0%) |
| Construction | 6 (60.0%) | 4 (40.0%) |
| Manufacturing | 7 (100.0%) | 0 (0.0%) |
| Wholesale Trade | 0 (0.0%) | 0 (0.0%) |
| Retail Trade | 7 (36.8%) | 12 (63.2%) |
| Transportation & Warehousing | 6 (35.3%) | 11 (64.7%) |
| Utilities | 14 (100.0%) | 0 (0.0%) |
| Information | 0 (0.0%) | 4 (100.0%) |
| Finance & Insurance | 0 (0.0%) | 0 (0.0%) |
| Real Estate, Rental & Leasing | 0 (0.0%) | 0 (0.0%) |
| Professional & Scientific | 0 (0.0%) | 0 (0.0%) |
| Enterprise Management | 0 (0.0%) | 0 (0.0%) |
| Administrative & Support | 7 (100.0%) | 0 (0.0%) |
| Educational Services | 8 (100.0%) | 0 (0.0%) |
| Health Care & Social Assistance | 0 (0.0%) | 7 (100.0%) |
| Arts, Entertainment & Recreation | 0 (0.0%) | 5 (100.0%) |
| Accommodation & Food Services | 0 (0.0%) | 6 (100.0%) |
| Public Administration | 6 (60.0%) | 4 (40.0%) |
| Total | 74 (58.3%) | 53 (41.7%) |
Education in Turkey Creek
School Enrollment in Turkey Creek
The most common levels of schooling among the 85 students in Turkey Creek are middle school (31 | 36.5%), elementary school (22 | 25.9%), and high school (13 | 15.3%).
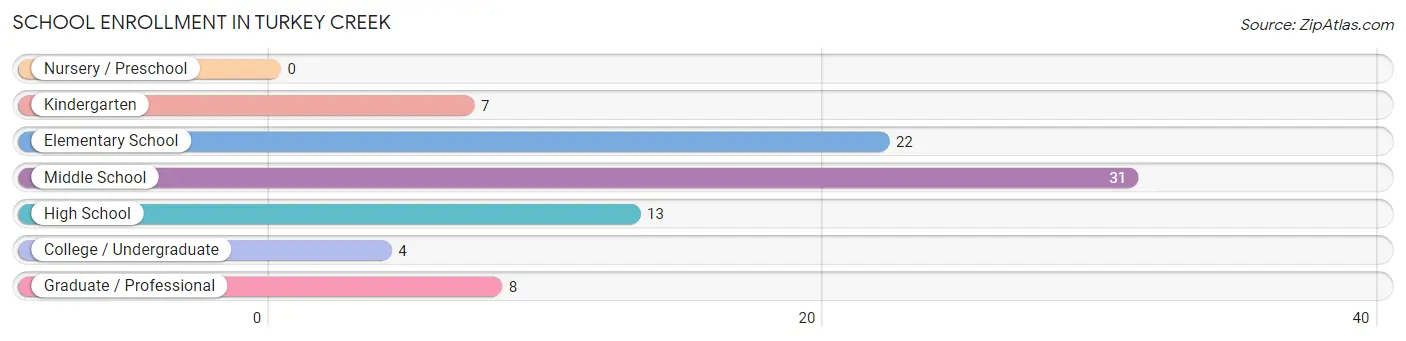
| School Level | # Students | % Students |
| Nursery / Preschool | 0 | 0.0% |
| Kindergarten | 7 | 8.2% |
| Elementary School | 22 | 25.9% |
| Middle School | 31 | 36.5% |
| High School | 13 | 15.3% |
| College / Undergraduate | 4 | 4.7% |
| Graduate / Professional | 8 | 9.4% |
| Total | 85 | 100.0% |
School Enrollment by Age by Funding Source in Turkey Creek
Out of a total of 85 students who are enrolled in schools in Turkey Creek, 10 (11.8%) attend a private institution, while the remaining 75 (88.2%) are enrolled in public schools. The age group of 25 to 34 year olds has the highest likelihood of being enrolled in private schools, with 8 (100.0% in the age bracket) enrolled. Conversely, the age group of 5 to 9 year old has the lowest likelihood of being enrolled in a private school, with 29 (100.0% in the age bracket) attending a public institution.
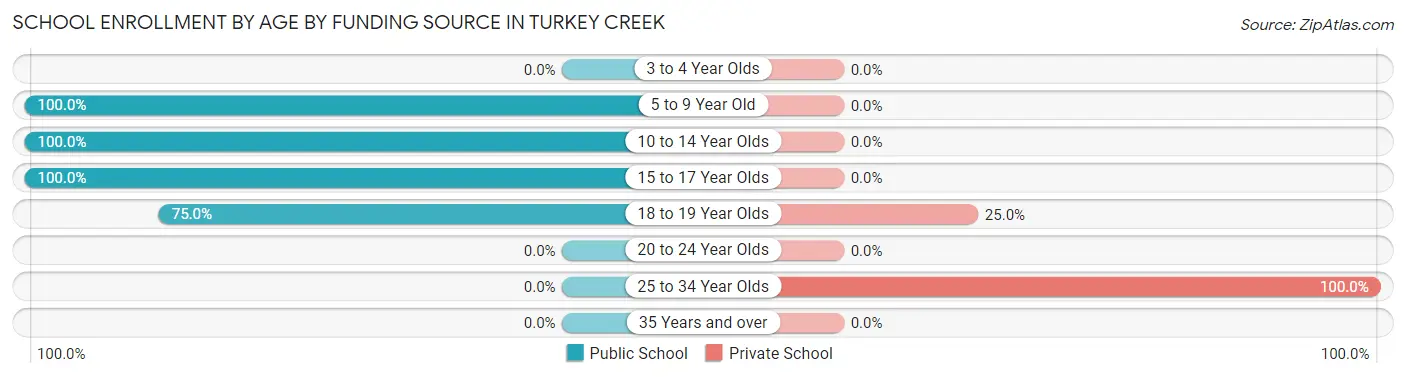
| Age Bracket | Public School | Private School |
| 3 to 4 Year Olds | 0 (0.0%) | 0 (0.0%) |
| 5 to 9 Year Old | 29 (100.0%) | 0 (0.0%) |
| 10 to 14 Year Olds | 35 (100.0%) | 0 (0.0%) |
| 15 to 17 Year Olds | 5 (100.0%) | 0 (0.0%) |
| 18 to 19 Year Olds | 6 (75.0%) | 2 (25.0%) |
| 20 to 24 Year Olds | 0 (0.0%) | 0 (0.0%) |
| 25 to 34 Year Olds | 0 (0.0%) | 8 (100.0%) |
| 35 Years and over | 0 (0.0%) | 0 (0.0%) |
| Total | 75 (88.2%) | 10 (11.8%) |
Educational Attainment by Field of Study in Turkey Creek
Liberal arts & history (8 | 61.5%), and science & technology (5 | 38.5%) are the most common fields of study among 13 individuals in Turkey Creek who have obtained a bachelor's degree or higher.
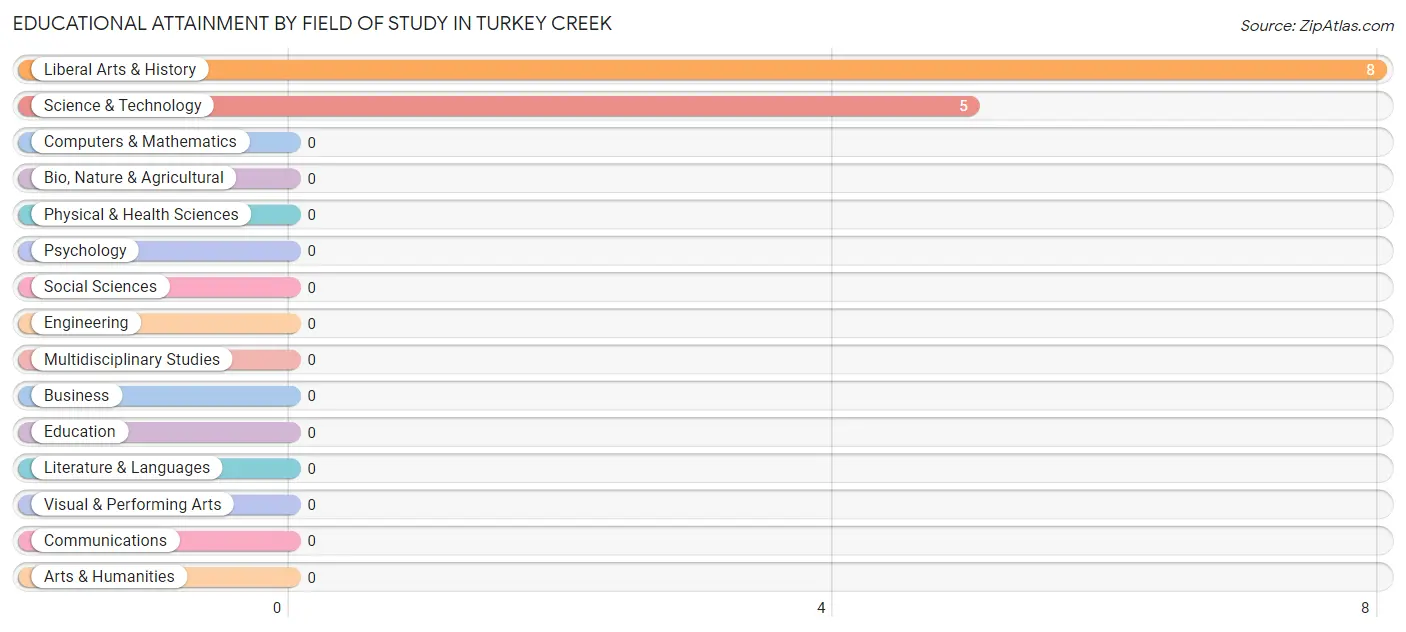
| Field of Study | # Graduates | % Graduates |
| Computers & Mathematics | 0 | 0.0% |
| Bio, Nature & Agricultural | 0 | 0.0% |
| Physical & Health Sciences | 0 | 0.0% |
| Psychology | 0 | 0.0% |
| Social Sciences | 0 | 0.0% |
| Engineering | 0 | 0.0% |
| Multidisciplinary Studies | 0 | 0.0% |
| Science & Technology | 5 | 38.5% |
| Business | 0 | 0.0% |
| Education | 0 | 0.0% |
| Literature & Languages | 0 | 0.0% |
| Liberal Arts & History | 8 | 61.5% |
| Visual & Performing Arts | 0 | 0.0% |
| Communications | 0 | 0.0% |
| Arts & Humanities | 0 | 0.0% |
| Total | 13 | 100.0% |
Transportation & Commute in Turkey Creek
Vehicle Availability by Sex in Turkey Creek
The most prevalent vehicle ownership categories in Turkey Creek are males with 2 vehicles (39, accounting for 52.7%) and females with 2 vehicles (13, making up 81.2%).
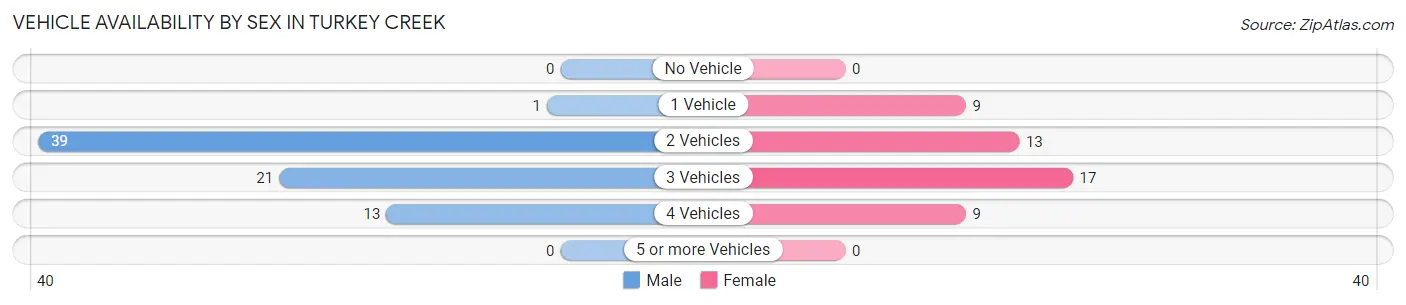
| Vehicles Available | Male | Female |
| No Vehicle | 0 (0.0%) | 0 (0.0%) |
| 1 Vehicle | 1 (1.3%) | 9 (18.8%) |
| 2 Vehicles | 39 (52.7%) | 13 (27.1%) |
| 3 Vehicles | 21 (28.4%) | 17 (35.4%) |
| 4 Vehicles | 13 (17.6%) | 9 (18.8%) |
| 5 or more Vehicles | 0 (0.0%) | 0 (0.0%) |
| Total | 74 (100.0%) | 48 (100.0%) |
Commute Time in Turkey Creek
The most frequently occuring commute durations in Turkey Creek are less than 5 minutes (27 commuters, 22.9%), 40 to 44 minutes (18 commuters, 15.2%), and 90 or more minutes (15 commuters, 12.7%).
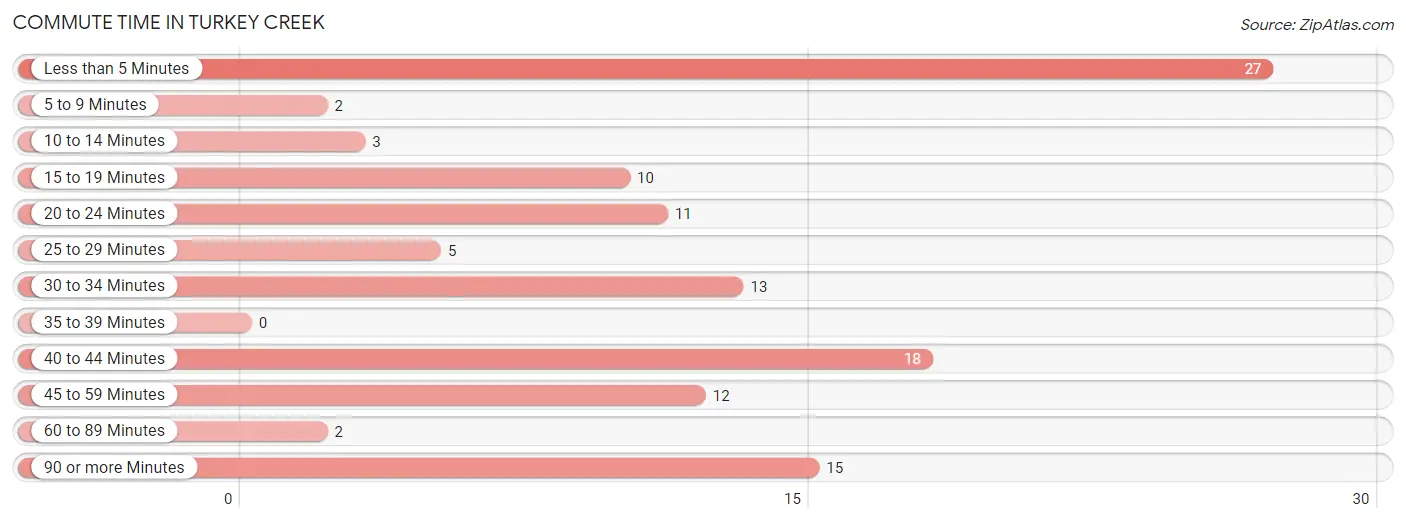
| Commute Time | # Commuters | % Commuters |
| Less than 5 Minutes | 27 | 22.9% |
| 5 to 9 Minutes | 2 | 1.7% |
| 10 to 14 Minutes | 3 | 2.5% |
| 15 to 19 Minutes | 10 | 8.5% |
| 20 to 24 Minutes | 11 | 9.3% |
| 25 to 29 Minutes | 5 | 4.2% |
| 30 to 34 Minutes | 13 | 11.0% |
| 35 to 39 Minutes | 0 | 0.0% |
| 40 to 44 Minutes | 18 | 15.2% |
| 45 to 59 Minutes | 12 | 10.2% |
| 60 to 89 Minutes | 2 | 1.7% |
| 90 or more Minutes | 15 | 12.7% |
Commute Time by Sex in Turkey Creek
The most common commute times in Turkey Creek are 90 or more minutes (15 commuters, 20.3%) for males and less than 5 minutes (16 commuters, 36.4%) for females.
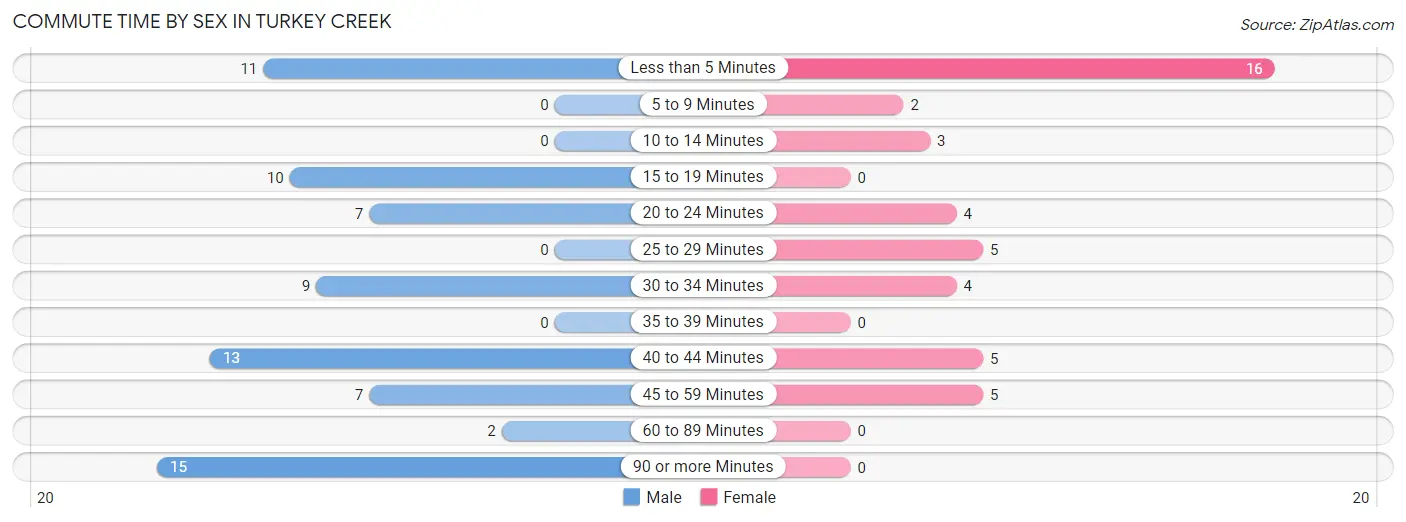
| Commute Time | Male | Female |
| Less than 5 Minutes | 11 (14.9%) | 16 (36.4%) |
| 5 to 9 Minutes | 0 (0.0%) | 2 (4.5%) |
| 10 to 14 Minutes | 0 (0.0%) | 3 (6.8%) |
| 15 to 19 Minutes | 10 (13.5%) | 0 (0.0%) |
| 20 to 24 Minutes | 7 (9.5%) | 4 (9.1%) |
| 25 to 29 Minutes | 0 (0.0%) | 5 (11.4%) |
| 30 to 34 Minutes | 9 (12.2%) | 4 (9.1%) |
| 35 to 39 Minutes | 0 (0.0%) | 0 (0.0%) |
| 40 to 44 Minutes | 13 (17.6%) | 5 (11.4%) |
| 45 to 59 Minutes | 7 (9.5%) | 5 (11.4%) |
| 60 to 89 Minutes | 2 (2.7%) | 0 (0.0%) |
| 90 or more Minutes | 15 (20.3%) | 0 (0.0%) |
Time of Departure to Work by Sex in Turkey Creek
The most frequent times of departure to work in Turkey Creek are 5:00 AM to 5:29 AM (21, 28.4%) for males and 6:00 AM to 6:29 AM (13, 29.5%) for females.
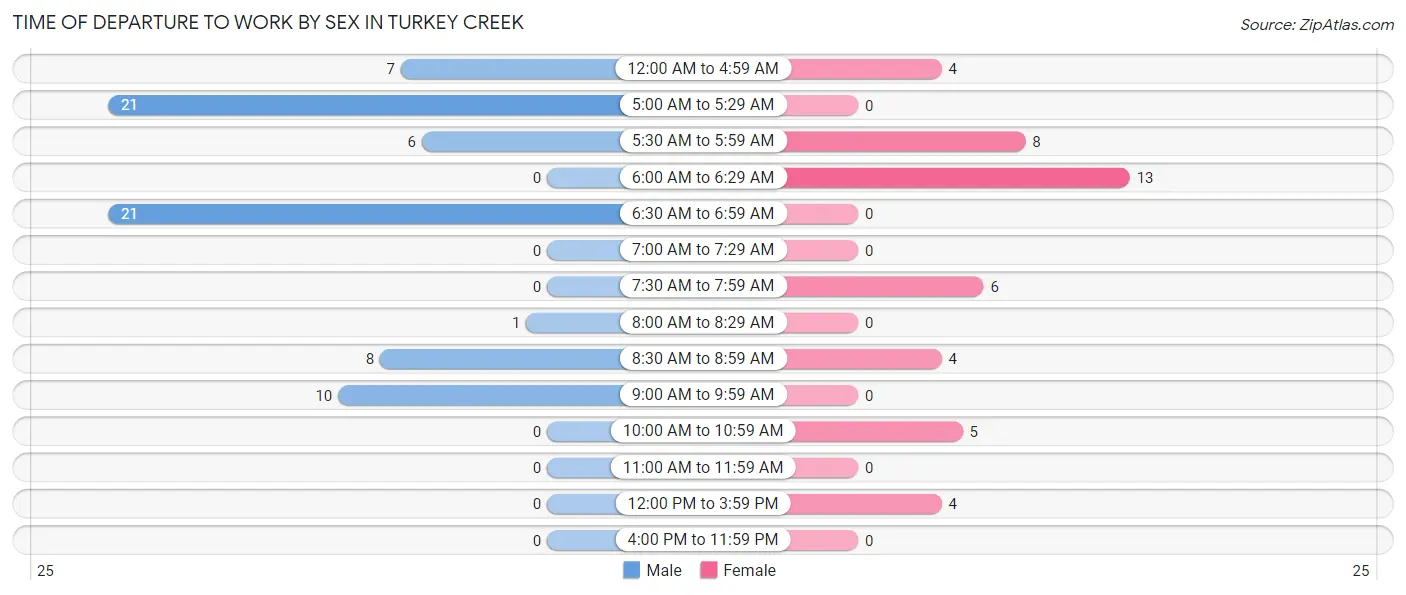
| Time of Departure | Male | Female |
| 12:00 AM to 4:59 AM | 7 (9.5%) | 4 (9.1%) |
| 5:00 AM to 5:29 AM | 21 (28.4%) | 0 (0.0%) |
| 5:30 AM to 5:59 AM | 6 (8.1%) | 8 (18.2%) |
| 6:00 AM to 6:29 AM | 0 (0.0%) | 13 (29.5%) |
| 6:30 AM to 6:59 AM | 21 (28.4%) | 0 (0.0%) |
| 7:00 AM to 7:29 AM | 0 (0.0%) | 0 (0.0%) |
| 7:30 AM to 7:59 AM | 0 (0.0%) | 6 (13.6%) |
| 8:00 AM to 8:29 AM | 1 (1.3%) | 0 (0.0%) |
| 8:30 AM to 8:59 AM | 8 (10.8%) | 4 (9.1%) |
| 9:00 AM to 9:59 AM | 10 (13.5%) | 0 (0.0%) |
| 10:00 AM to 10:59 AM | 0 (0.0%) | 5 (11.4%) |
| 11:00 AM to 11:59 AM | 0 (0.0%) | 0 (0.0%) |
| 12:00 PM to 3:59 PM | 0 (0.0%) | 4 (9.1%) |
| 4:00 PM to 11:59 PM | 0 (0.0%) | 0 (0.0%) |
| Total | 74 (100.0%) | 44 (100.0%) |
Housing Occupancy in Turkey Creek
Occupancy by Ownership in Turkey Creek
Of the total 146 dwellings in Turkey Creek, owner-occupied units account for 106 (72.6%), while renter-occupied units make up 40 (27.4%).
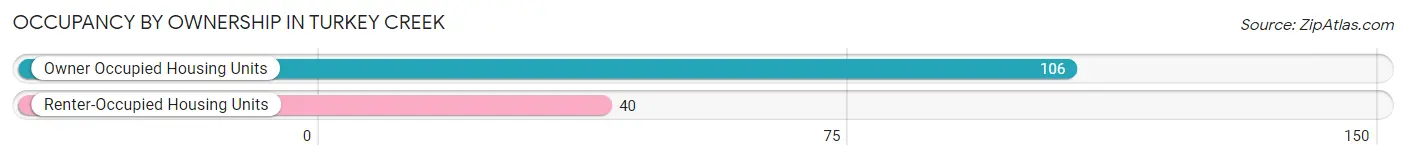
| Occupancy | # Housing Units | % Housing Units |
| Owner Occupied Housing Units | 106 | 72.6% |
| Renter-Occupied Housing Units | 40 | 27.4% |
| Total Occupied Housing Units | 146 | 100.0% |
Occupancy by Household Size in Turkey Creek
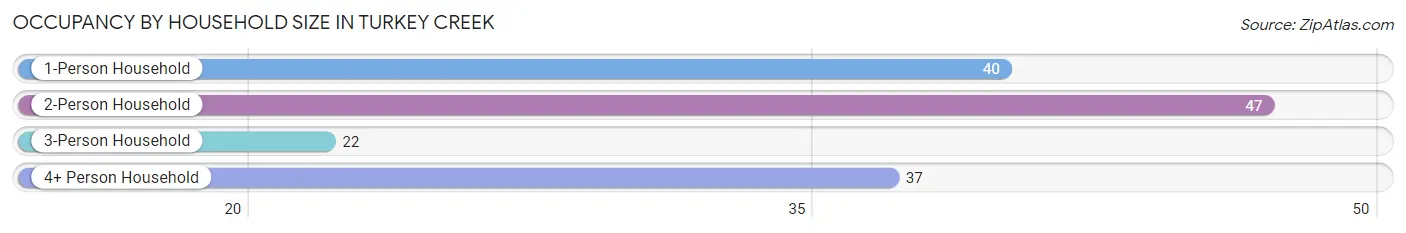
| Household Size | # Housing Units | % Housing Units |
| 1-Person Household | 40 | 27.4% |
| 2-Person Household | 47 | 32.2% |
| 3-Person Household | 22 | 15.1% |
| 4+ Person Household | 37 | 25.3% |
| Total Housing Units | 146 | 100.0% |
Occupancy by Ownership by Household Size in Turkey Creek
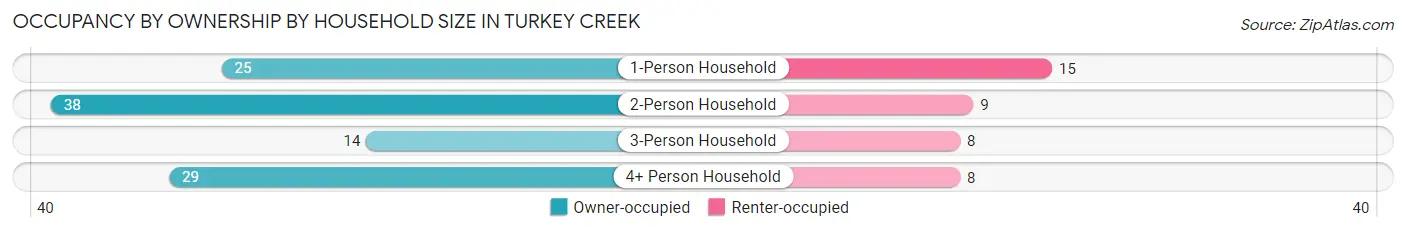
| Household Size | Owner-occupied | Renter-occupied |
| 1-Person Household | 25 (62.5%) | 15 (37.5%) |
| 2-Person Household | 38 (80.8%) | 9 (19.2%) |
| 3-Person Household | 14 (63.6%) | 8 (36.4%) |
| 4+ Person Household | 29 (78.4%) | 8 (21.6%) |
| Total Housing Units | 106 (72.6%) | 40 (27.4%) |
Occupancy by Educational Attainment in Turkey Creek
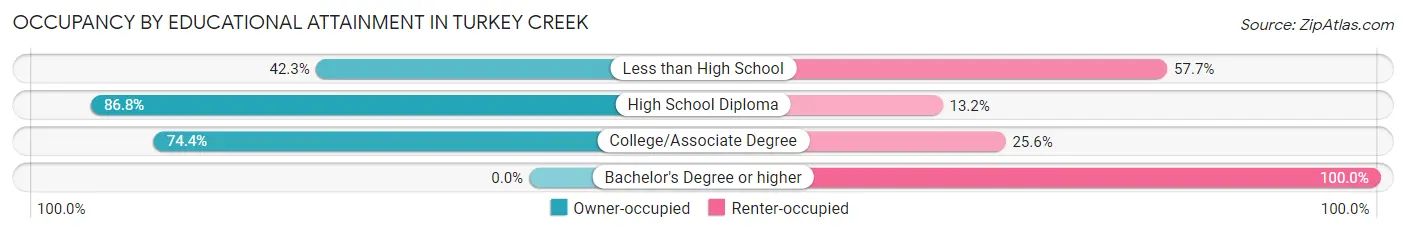
| Household Size | Owner-occupied | Renter-occupied |
| Less than High School | 11 (42.3%) | 15 (57.7%) |
| High School Diploma | 66 (86.8%) | 10 (13.2%) |
| College/Associate Degree | 29 (74.4%) | 10 (25.6%) |
| Bachelor's Degree or higher | 0 (0.0%) | 5 (100.0%) |
Occupancy by Age of Householder in Turkey Creek
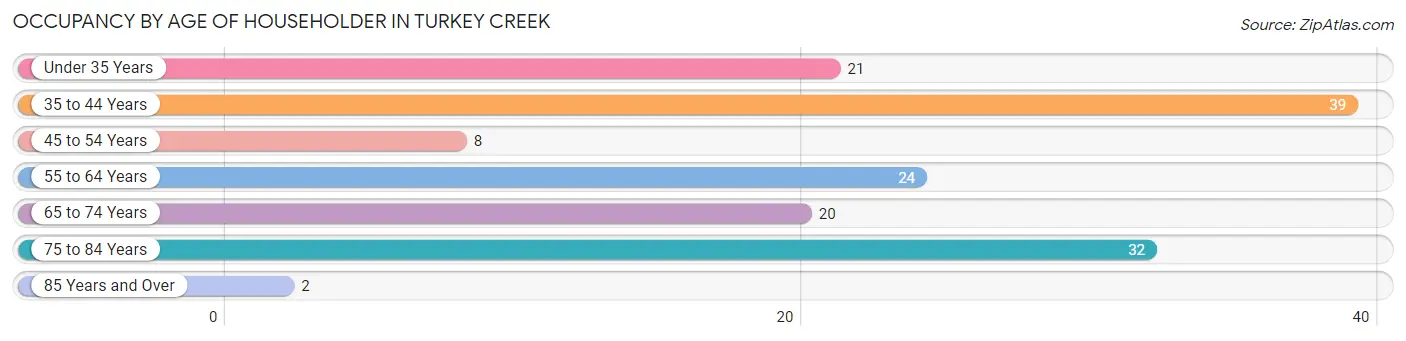
| Age Bracket | # Households | % Households |
| Under 35 Years | 21 | 14.4% |
| 35 to 44 Years | 39 | 26.7% |
| 45 to 54 Years | 8 | 5.5% |
| 55 to 64 Years | 24 | 16.4% |
| 65 to 74 Years | 20 | 13.7% |
| 75 to 84 Years | 32 | 21.9% |
| 85 Years and Over | 2 | 1.4% |
| Total | 146 | 100.0% |
Housing Finances in Turkey Creek
Median Income by Occupancy in Turkey Creek
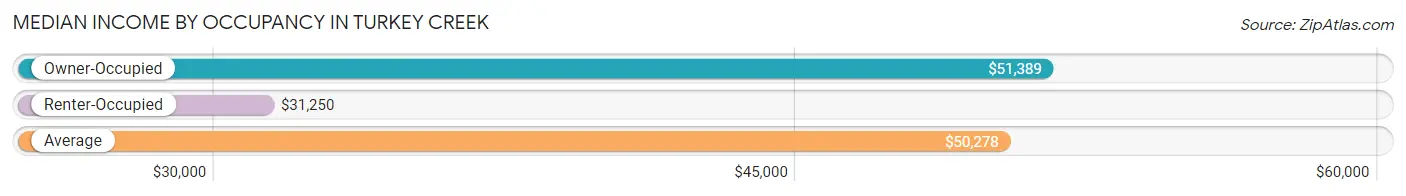
| Occupancy Type | # Households | Median Income |
| Owner-Occupied | 106 (72.6%) | $51,389 |
| Renter-Occupied | 40 (27.4%) | $31,250 |
| Average | 146 (100.0%) | $50,278 |
Occupancy by Householder Income Bracket in Turkey Creek
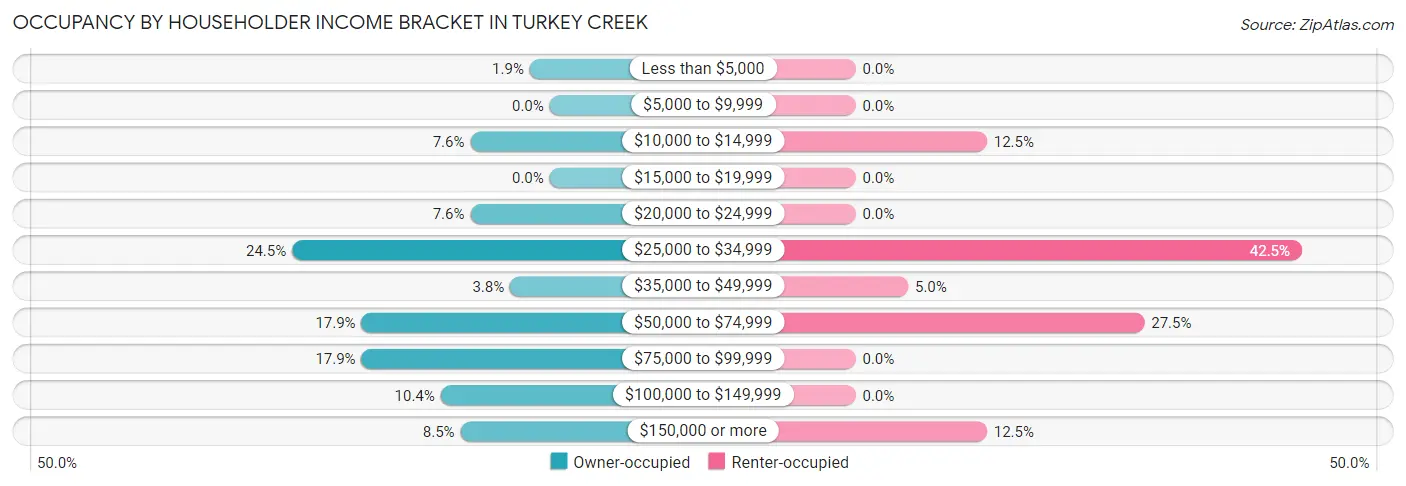
| Income Bracket | Owner-occupied | Renter-occupied |
| Less than $5,000 | 2 (1.9%) | 0 (0.0%) |
| $5,000 to $9,999 | 0 (0.0%) | 0 (0.0%) |
| $10,000 to $14,999 | 8 (7.5%) | 5 (12.5%) |
| $15,000 to $19,999 | 0 (0.0%) | 0 (0.0%) |
| $20,000 to $24,999 | 8 (7.5%) | 0 (0.0%) |
| $25,000 to $34,999 | 26 (24.5%) | 17 (42.5%) |
| $35,000 to $49,999 | 4 (3.8%) | 2 (5.0%) |
| $50,000 to $74,999 | 19 (17.9%) | 11 (27.5%) |
| $75,000 to $99,999 | 19 (17.9%) | 0 (0.0%) |
| $100,000 to $149,999 | 11 (10.4%) | 0 (0.0%) |
| $150,000 or more | 9 (8.5%) | 5 (12.5%) |
| Total | 106 (100.0%) | 40 (100.0%) |
Monthly Housing Cost Tiers in Turkey Creek
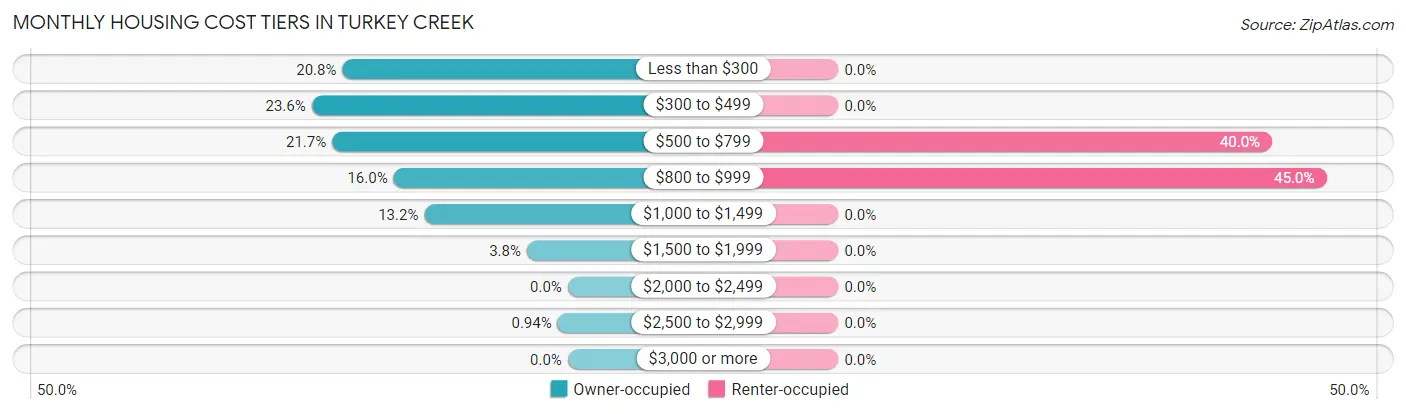
| Monthly Cost | Owner-occupied | Renter-occupied |
| Less than $300 | 22 (20.7%) | 0 (0.0%) |
| $300 to $499 | 25 (23.6%) | 0 (0.0%) |
| $500 to $799 | 23 (21.7%) | 16 (40.0%) |
| $800 to $999 | 17 (16.0%) | 18 (45.0%) |
| $1,000 to $1,499 | 14 (13.2%) | 0 (0.0%) |
| $1,500 to $1,999 | 4 (3.8%) | 0 (0.0%) |
| $2,000 to $2,499 | 0 (0.0%) | 0 (0.0%) |
| $2,500 to $2,999 | 1 (0.9%) | 0 (0.0%) |
| $3,000 or more | 0 (0.0%) | 0 (0.0%) |
| Total | 106 (100.0%) | 40 (100.0%) |
Physical Housing Characteristics in Turkey Creek
Housing Structures in Turkey Creek
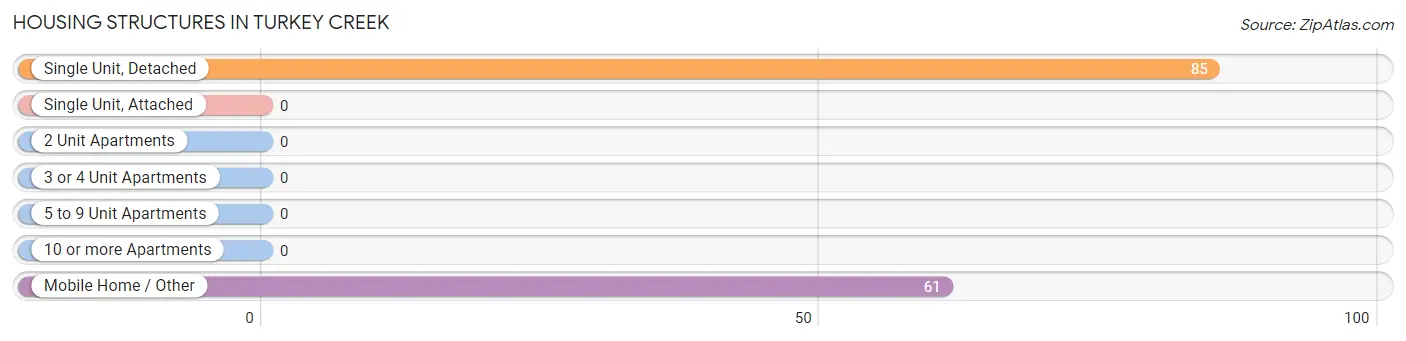
| Structure Type | # Housing Units | % Housing Units |
| Single Unit, Detached | 85 | 58.2% |
| Single Unit, Attached | 0 | 0.0% |
| 2 Unit Apartments | 0 | 0.0% |
| 3 or 4 Unit Apartments | 0 | 0.0% |
| 5 to 9 Unit Apartments | 0 | 0.0% |
| 10 or more Apartments | 0 | 0.0% |
| Mobile Home / Other | 61 | 41.8% |
| Total | 146 | 100.0% |
Housing Structures by Occupancy in Turkey Creek
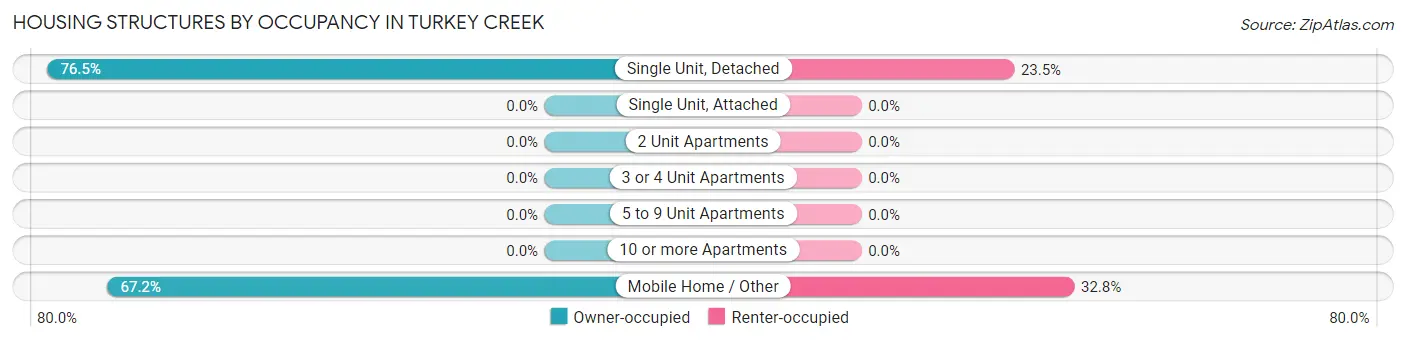
| Structure Type | Owner-occupied | Renter-occupied |
| Single Unit, Detached | 65 (76.5%) | 20 (23.5%) |
| Single Unit, Attached | 0 (0.0%) | 0 (0.0%) |
| 2 Unit Apartments | 0 (0.0%) | 0 (0.0%) |
| 3 or 4 Unit Apartments | 0 (0.0%) | 0 (0.0%) |
| 5 to 9 Unit Apartments | 0 (0.0%) | 0 (0.0%) |
| 10 or more Apartments | 0 (0.0%) | 0 (0.0%) |
| Mobile Home / Other | 41 (67.2%) | 20 (32.8%) |
| Total | 106 (72.6%) | 40 (27.4%) |
Housing Structures by Number of Rooms in Turkey Creek
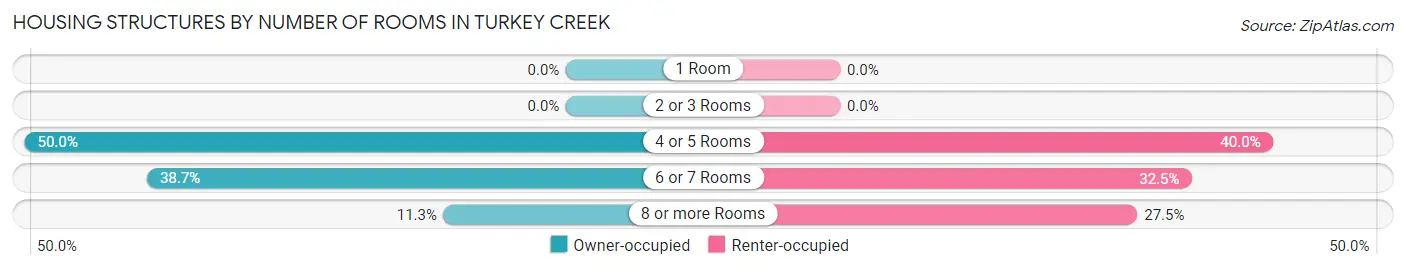
| Number of Rooms | Owner-occupied | Renter-occupied |
| 1 Room | 0 (0.0%) | 0 (0.0%) |
| 2 or 3 Rooms | 0 (0.0%) | 0 (0.0%) |
| 4 or 5 Rooms | 53 (50.0%) | 16 (40.0%) |
| 6 or 7 Rooms | 41 (38.7%) | 13 (32.5%) |
| 8 or more Rooms | 12 (11.3%) | 11 (27.5%) |
| Total | 106 (100.0%) | 40 (100.0%) |
Housing Structure by Heating Type in Turkey Creek
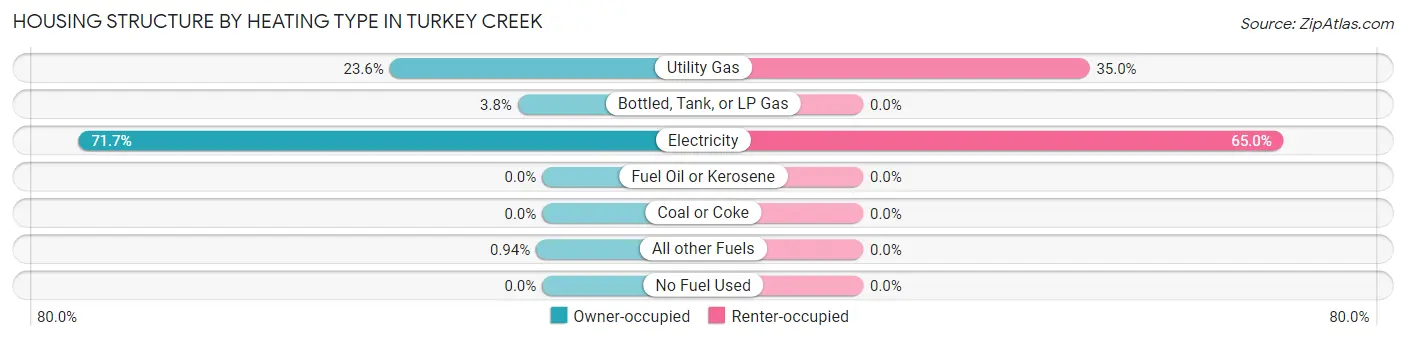
| Heating Type | Owner-occupied | Renter-occupied |
| Utility Gas | 25 (23.6%) | 14 (35.0%) |
| Bottled, Tank, or LP Gas | 4 (3.8%) | 0 (0.0%) |
| Electricity | 76 (71.7%) | 26 (65.0%) |
| Fuel Oil or Kerosene | 0 (0.0%) | 0 (0.0%) |
| Coal or Coke | 0 (0.0%) | 0 (0.0%) |
| All other Fuels | 1 (0.9%) | 0 (0.0%) |
| No Fuel Used | 0 (0.0%) | 0 (0.0%) |
| Total | 106 (100.0%) | 40 (100.0%) |
Household Vehicle Usage in Turkey Creek
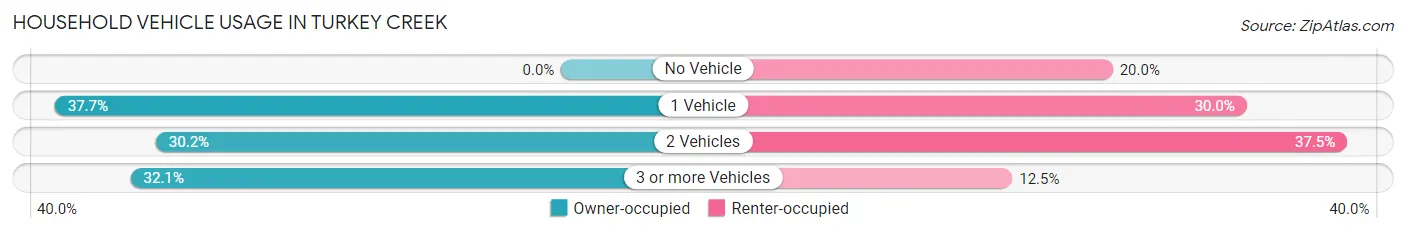
| Vehicles per Household | Owner-occupied | Renter-occupied |
| No Vehicle | 0 (0.0%) | 8 (20.0%) |
| 1 Vehicle | 40 (37.7%) | 12 (30.0%) |
| 2 Vehicles | 32 (30.2%) | 15 (37.5%) |
| 3 or more Vehicles | 34 (32.1%) | 5 (12.5%) |
| Total | 106 (100.0%) | 40 (100.0%) |
Real Estate & Mortgages in Turkey Creek
Real Estate and Mortgage Overview in Turkey Creek
| Characteristic | Without Mortgage | With Mortgage |
| Housing Units | 72 | 34 |
| Median Property Value | - | - |
| Median Household Income | $46,250 | $3 |
| Monthly Housing Costs | $347 | $0 |
| Real Estate Taxes | $240 | $6 |
Property Value by Mortgage Status in Turkey Creek
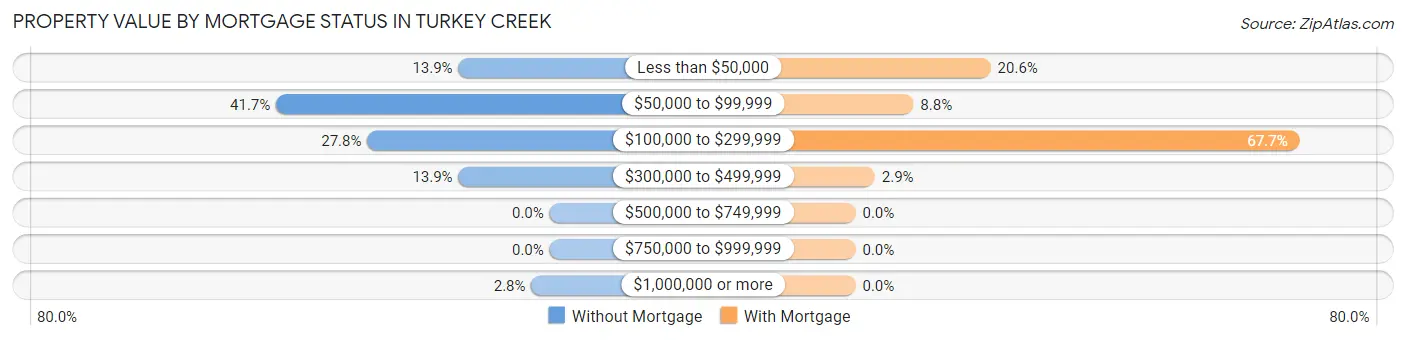
| Property Value | Without Mortgage | With Mortgage |
| Less than $50,000 | 10 (13.9%) | 7 (20.6%) |
| $50,000 to $99,999 | 30 (41.7%) | 3 (8.8%) |
| $100,000 to $299,999 | 20 (27.8%) | 23 (67.6%) |
| $300,000 to $499,999 | 10 (13.9%) | 1 (2.9%) |
| $500,000 to $749,999 | 0 (0.0%) | 0 (0.0%) |
| $750,000 to $999,999 | 0 (0.0%) | 0 (0.0%) |
| $1,000,000 or more | 2 (2.8%) | 0 (0.0%) |
| Total | 72 (100.0%) | 34 (100.0%) |
Household Income by Mortgage Status in Turkey Creek
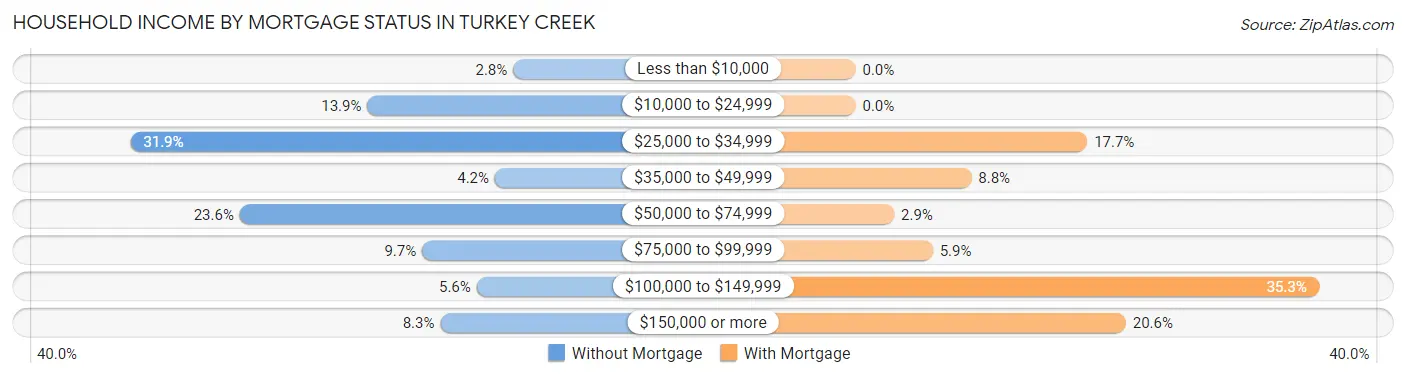
| Household Income | Without Mortgage | With Mortgage |
| Less than $10,000 | 2 (2.8%) | 0 (0.0%) |
| $10,000 to $24,999 | 10 (13.9%) | 0 (0.0%) |
| $25,000 to $34,999 | 23 (31.9%) | 6 (17.6%) |
| $35,000 to $49,999 | 3 (4.2%) | 3 (8.8%) |
| $50,000 to $74,999 | 17 (23.6%) | 1 (2.9%) |
| $75,000 to $99,999 | 7 (9.7%) | 2 (5.9%) |
| $100,000 to $149,999 | 4 (5.6%) | 12 (35.3%) |
| $150,000 or more | 6 (8.3%) | 7 (20.6%) |
| Total | 72 (100.0%) | 34 (100.0%) |
Property Value to Household Income Ratio in Turkey Creek
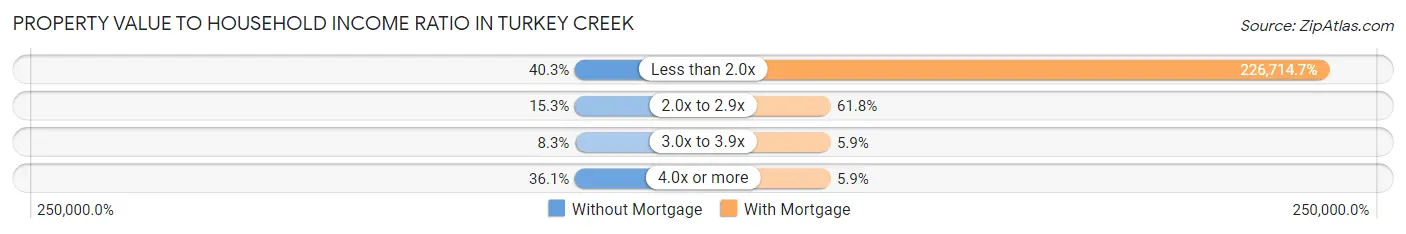
| Value-to-Income Ratio | Without Mortgage | With Mortgage |
| Less than 2.0x | 29 (40.3%) | 77,083 (226,714.7%) |
| 2.0x to 2.9x | 11 (15.3%) | 21 (61.8%) |
| 3.0x to 3.9x | 6 (8.3%) | 2 (5.9%) |
| 4.0x or more | 26 (36.1%) | 2 (5.9%) |
| Total | 72 (100.0%) | 34 (100.0%) |
Real Estate Taxes by Mortgage Status in Turkey Creek
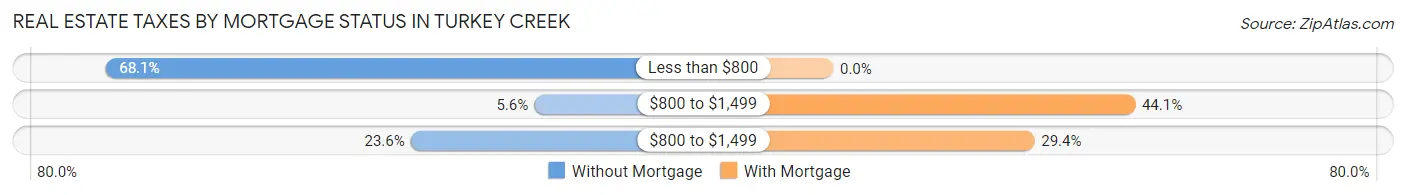
| Property Taxes | Without Mortgage | With Mortgage |
| Less than $800 | 49 (68.1%) | 0 (0.0%) |
| $800 to $1,499 | 4 (5.6%) | 15 (44.1%) |
| $800 to $1,499 | 17 (23.6%) | 10 (29.4%) |
| Total | 72 (100.0%) | 34 (100.0%) |
Health & Disability in Turkey Creek
Health Insurance Coverage by Age in Turkey Creek
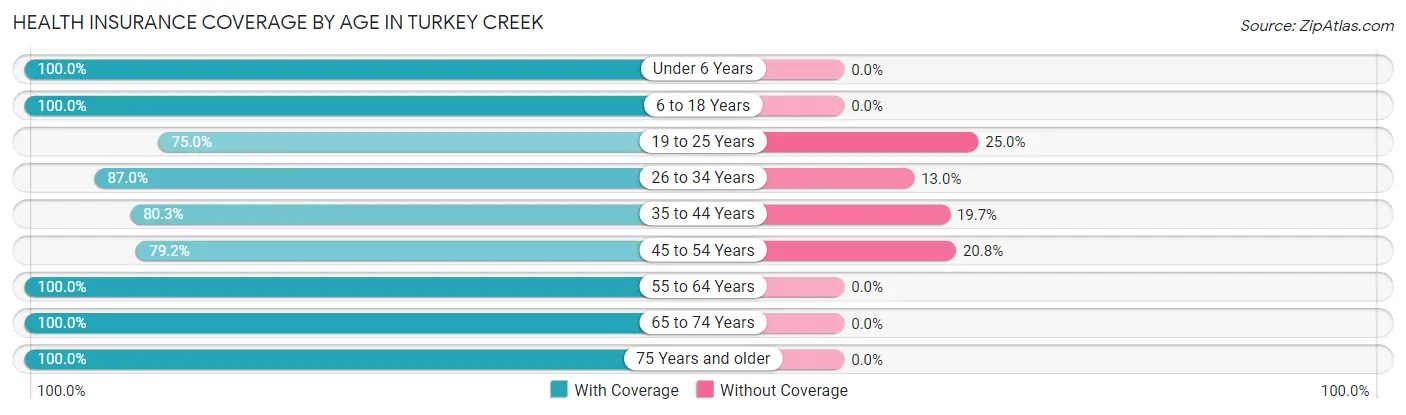
| Age Bracket | With Coverage | Without Coverage |
| Under 6 Years | 40 (100.0%) | 0 (0.0%) |
| 6 to 18 Years | 68 (100.0%) | 0 (0.0%) |
| 19 to 25 Years | 21 (75.0%) | 7 (25.0%) |
| 26 to 34 Years | 40 (87.0%) | 6 (13.0%) |
| 35 to 44 Years | 53 (80.3%) | 13 (19.7%) |
| 45 to 54 Years | 19 (79.2%) | 5 (20.8%) |
| 55 to 64 Years | 35 (100.0%) | 0 (0.0%) |
| 65 to 74 Years | 22 (100.0%) | 0 (0.0%) |
| 75 Years and older | 45 (100.0%) | 0 (0.0%) |
| Total | 343 (91.7%) | 31 (8.3%) |
Health Insurance Coverage by Citizenship Status in Turkey Creek

| Citizenship Status | With Coverage | Without Coverage |
| Native Born | 40 (100.0%) | 0 (0.0%) |
| Foreign Born, Citizen | 68 (100.0%) | 0 (0.0%) |
| Foreign Born, not a Citizen | 21 (75.0%) | 7 (25.0%) |
Health Insurance Coverage by Household Income in Turkey Creek
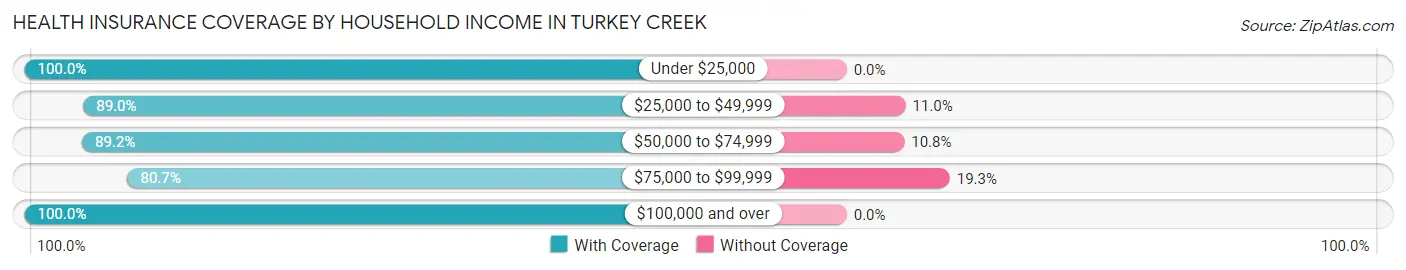
| Household Income | With Coverage | Without Coverage |
| Under $25,000 | 34 (100.0%) | 0 (0.0%) |
| $25,000 to $49,999 | 105 (89.0%) | 13 (11.0%) |
| $50,000 to $74,999 | 58 (89.2%) | 7 (10.8%) |
| $75,000 to $99,999 | 46 (80.7%) | 11 (19.3%) |
| $100,000 and over | 100 (100.0%) | 0 (0.0%) |
Public vs Private Health Insurance Coverage by Age in Turkey Creek
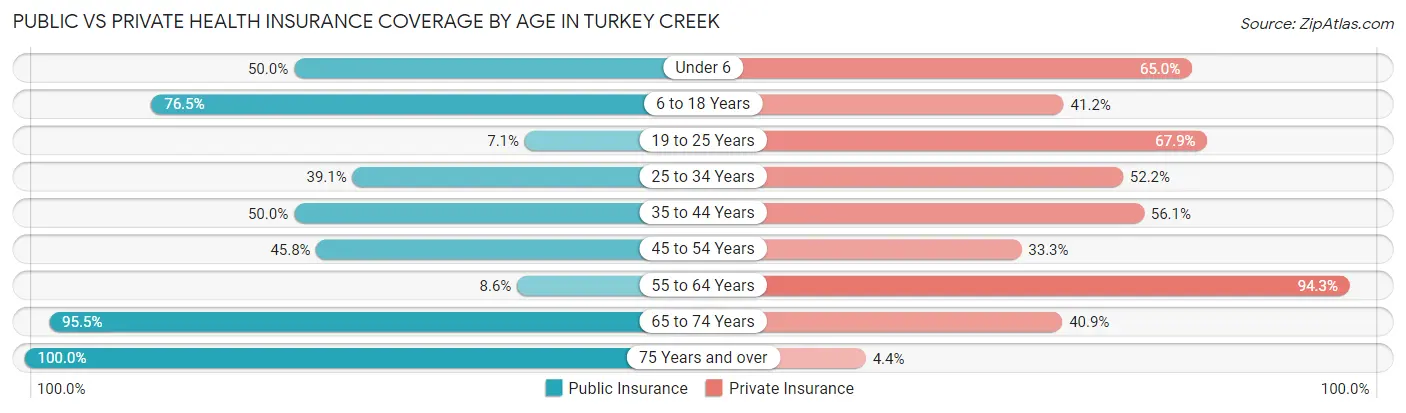
| Age Bracket | Public Insurance | Private Insurance |
| Under 6 | 20 (50.0%) | 26 (65.0%) |
| 6 to 18 Years | 52 (76.5%) | 28 (41.2%) |
| 19 to 25 Years | 2 (7.1%) | 19 (67.9%) |
| 25 to 34 Years | 18 (39.1%) | 24 (52.2%) |
| 35 to 44 Years | 33 (50.0%) | 37 (56.1%) |
| 45 to 54 Years | 11 (45.8%) | 8 (33.3%) |
| 55 to 64 Years | 3 (8.6%) | 33 (94.3%) |
| 65 to 74 Years | 21 (95.5%) | 9 (40.9%) |
| 75 Years and over | 45 (100.0%) | 2 (4.4%) |
| Total | 205 (54.8%) | 186 (49.7%) |
Disability Status by Sex by Age in Turkey Creek
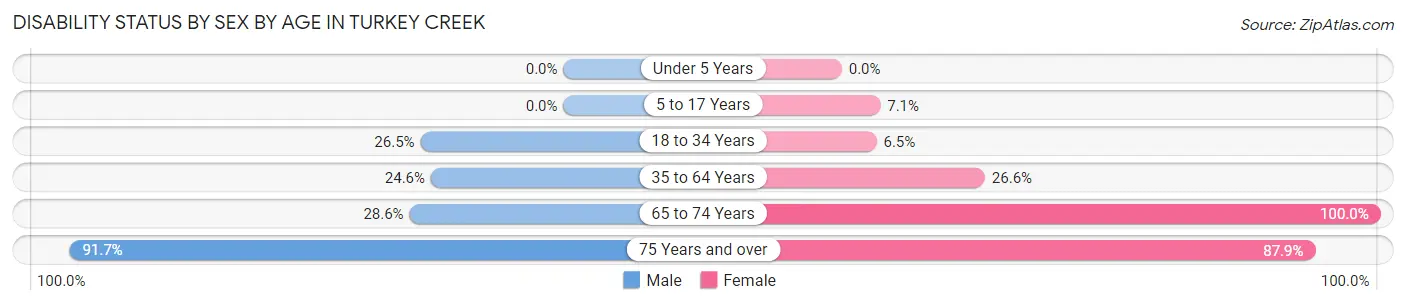
| Age Bracket | Male | Female |
| Under 5 Years | 0 (0.0%) | 0 (0.0%) |
| 5 to 17 Years | 0 (0.0%) | 1 (7.1%) |
| 18 to 34 Years | 13 (26.5%) | 2 (6.5%) |
| 35 to 64 Years | 15 (24.6%) | 17 (26.6%) |
| 65 to 74 Years | 6 (28.6%) | 1 (100.0%) |
| 75 Years and over | 11 (91.7%) | 29 (87.9%) |
Disability Class by Sex by Age in Turkey Creek
Disability Class: Hearing Difficulty
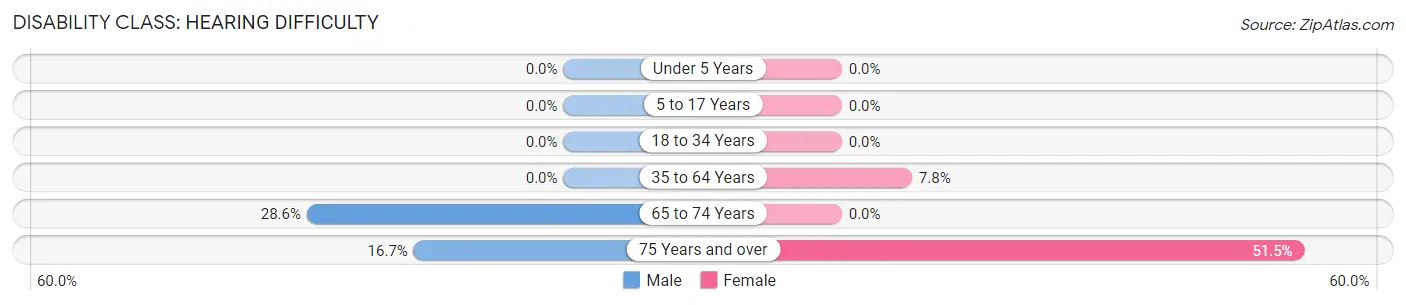
| Age Bracket | Male | Female |
| Under 5 Years | 0 (0.0%) | 0 (0.0%) |
| 5 to 17 Years | 0 (0.0%) | 0 (0.0%) |
| 18 to 34 Years | 0 (0.0%) | 0 (0.0%) |
| 35 to 64 Years | 0 (0.0%) | 5 (7.8%) |
| 65 to 74 Years | 6 (28.6%) | 0 (0.0%) |
| 75 Years and over | 2 (16.7%) | 17 (51.5%) |
Disability Class: Vision Difficulty
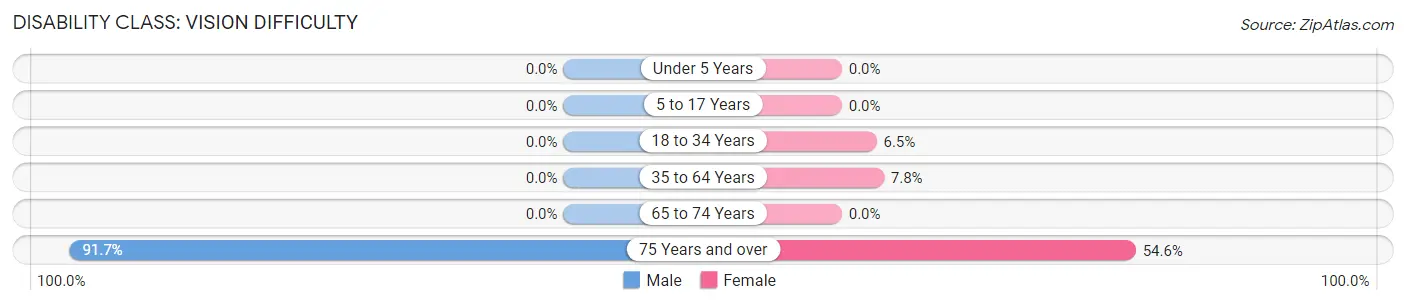
| Age Bracket | Male | Female |
| Under 5 Years | 0 (0.0%) | 0 (0.0%) |
| 5 to 17 Years | 0 (0.0%) | 0 (0.0%) |
| 18 to 34 Years | 0 (0.0%) | 2 (6.5%) |
| 35 to 64 Years | 0 (0.0%) | 5 (7.8%) |
| 65 to 74 Years | 0 (0.0%) | 0 (0.0%) |
| 75 Years and over | 11 (91.7%) | 18 (54.5%) |
Disability Class: Cognitive Difficulty
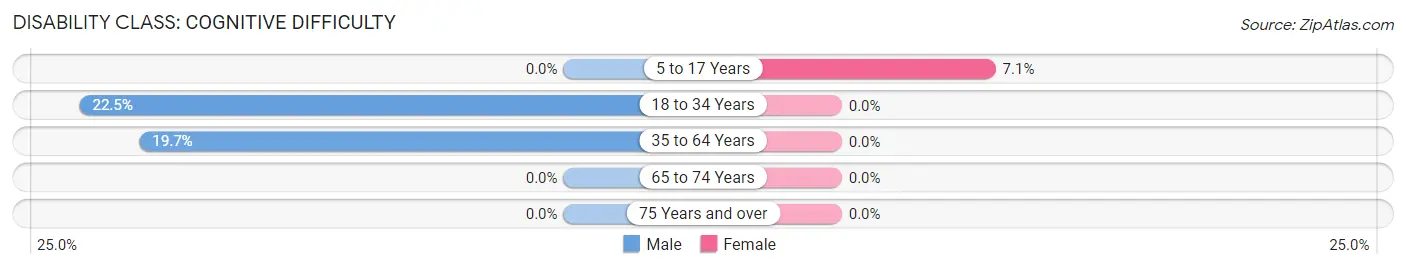
| Age Bracket | Male | Female |
| 5 to 17 Years | 0 (0.0%) | 1 (7.1%) |
| 18 to 34 Years | 11 (22.5%) | 0 (0.0%) |
| 35 to 64 Years | 12 (19.7%) | 0 (0.0%) |
| 65 to 74 Years | 0 (0.0%) | 0 (0.0%) |
| 75 Years and over | 0 (0.0%) | 0 (0.0%) |
Disability Class: Ambulatory Difficulty
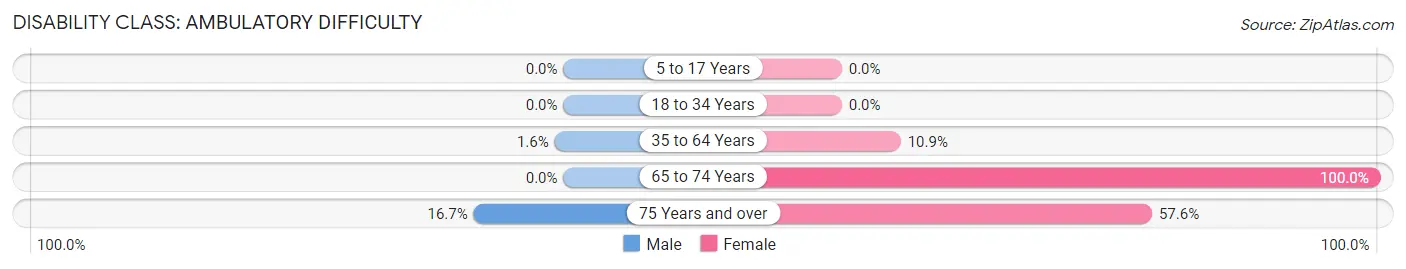
| Age Bracket | Male | Female |
| 5 to 17 Years | 0 (0.0%) | 0 (0.0%) |
| 18 to 34 Years | 0 (0.0%) | 0 (0.0%) |
| 35 to 64 Years | 1 (1.6%) | 7 (10.9%) |
| 65 to 74 Years | 0 (0.0%) | 1 (100.0%) |
| 75 Years and over | 2 (16.7%) | 19 (57.6%) |
Disability Class: Self-Care Difficulty
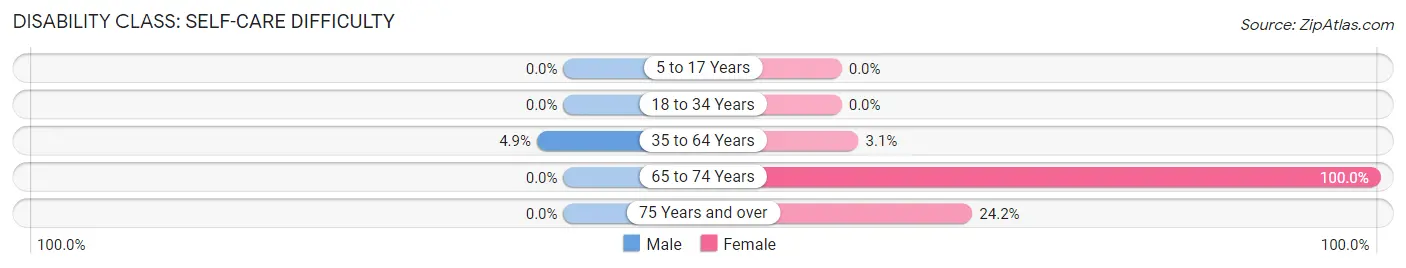
| Age Bracket | Male | Female |
| 5 to 17 Years | 0 (0.0%) | 0 (0.0%) |
| 18 to 34 Years | 0 (0.0%) | 0 (0.0%) |
| 35 to 64 Years | 3 (4.9%) | 2 (3.1%) |
| 65 to 74 Years | 0 (0.0%) | 1 (100.0%) |
| 75 Years and over | 0 (0.0%) | 8 (24.2%) |
Technology Access in Turkey Creek
Computing Device Access in Turkey Creek
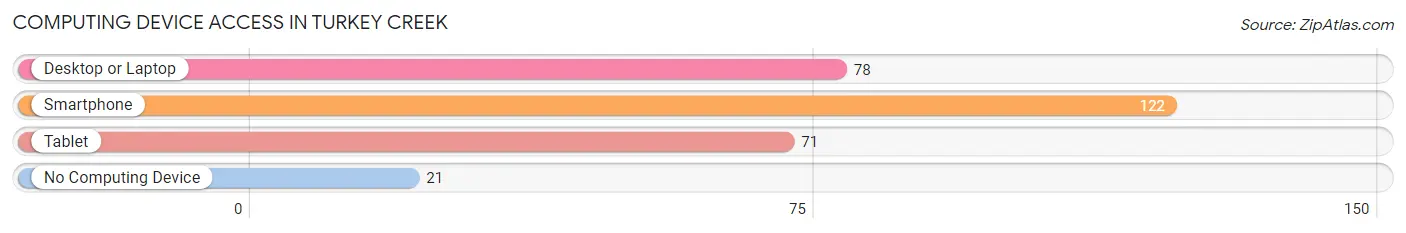
| Device Type | # Households | % Households |
| Desktop or Laptop | 78 | 53.4% |
| Smartphone | 122 | 83.6% |
| Tablet | 71 | 48.6% |
| No Computing Device | 21 | 14.4% |
| Total | 146 | 100.0% |
Internet Access in Turkey Creek
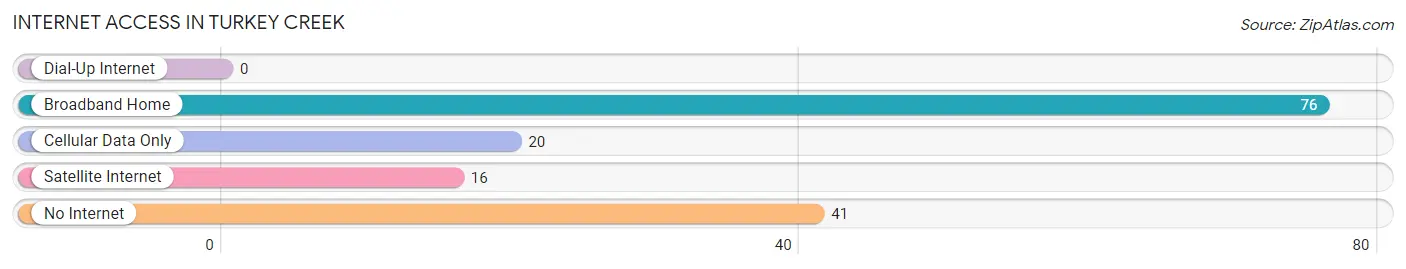
| Internet Type | # Households | % Households |
| Dial-Up Internet | 0 | 0.0% |
| Broadband Home | 76 | 52.0% |
| Cellular Data Only | 20 | 13.7% |
| Satellite Internet | 16 | 11.0% |
| No Internet | 41 | 28.1% |
| Total | 146 | 100.0% |
Turkey Creek Summary
History
The small town of Turkey Creek, Louisiana is located in the northern part of the state, in the parish of LaSalle. It is situated on the banks of the Red River, and is part of the larger Natchitoches Parish. The town was founded in 1845 by a group of settlers from the nearby town of Natchitoches. The settlers were looking for a place to settle and start a new life, and they chose the area around Turkey Creek because of its fertile soil and abundant wildlife.
The town was named after the wild turkeys that were abundant in the area. The settlers quickly established a thriving community, and the town grew rapidly. By the late 1800s, the town had a population of over 500 people. The town was home to a variety of businesses, including a general store, a blacksmith shop, a sawmill, and a cotton gin.
The town was also home to a number of churches, including the First Baptist Church of Turkey Creek, which was founded in 1848. The church was a major part of the community, and it served as a place of worship for the townspeople.
In the early 1900s, the town began to decline. The population began to dwindle, and many of the businesses closed. The town was eventually abandoned, and by the 1950s, it was a ghost town.
In the late 1970s, the town was rediscovered by a group of local historians. They began to restore the town, and by the 1980s, it had become a popular tourist destination. Today, the town is home to a variety of businesses, including a general store, a restaurant, and a bed and breakfast.
Geography
Turkey Creek is located in the northern part of LaSalle Parish, in the state of Louisiana. It is situated on the banks of the Red River, and is part of the larger Natchitoches Parish. The town is located about 25 miles north of Natchitoches, and about 50 miles south of Shreveport.
The town is situated in a rural area, and is surrounded by farmland and forests. The terrain is mostly flat, with some rolling hills. The climate is humid subtropical, with hot summers and mild winters.
Economy
The economy of Turkey Creek is largely based on tourism. The town is a popular destination for visitors who are interested in exploring the history of the area. The town is also home to a variety of businesses, including a general store, a restaurant, and a bed and breakfast.
The town is also home to a number of small farms, which produce a variety of crops, including corn, soybeans, and cotton. The town is also home to a number of small businesses, including a sawmill, a blacksmith shop, and a cotton gin.
Demographics
As of the 2010 census, the population of Turkey Creek was 545. The racial makeup of the town was 97.3% White, 0.7% African American, 0.2% Native American, 0.2% Asian, and 1.6% from other races. The median household income was $30,000, and the median family income was $35,000.
Conclusion
Turkey Creek, Louisiana is a small town located in the northern part of the state. It was founded in 1845 by a group of settlers from the nearby town of Natchitoches, and was named after the wild turkeys that were abundant in the area. The town was once a thriving community, but it eventually declined and was abandoned by the 1950s. In the late 1970s, the town was rediscovered by a group of local historians, and it has since become a popular tourist destination. The town is home to a variety of businesses, including a general store, a restaurant, and a bed and breakfast. The economy of the town is largely based on tourism, and the population of the town was 545 as of the 2010 census.
Common Questions
What is Per Capita Income in Turkey Creek?
Per Capita income in Turkey Creek is $25,699.
What is the Median Family Income in Turkey Creek?
Median Family Income in Turkey Creek is $51,528.
What is the Median Household income in Turkey Creek?
Median Household Income in Turkey Creek is $50,278.
What is Income or Wage Gap in Turkey Creek?
Income or Wage Gap in Turkey Creek is 76.2%.
Women in Turkey Creek earn 23.8 cents for every dollar earned by a man.
What is Inequality or Gini Index in Turkey Creek?
Inequality or Gini Index in Turkey Creek is 0.44.
What is the Total Population of Turkey Creek?
Total Population of Turkey Creek is 374.
What is the Total Male Population of Turkey Creek?
Total Male Population of Turkey Creek is 210.
What is the Total Female Population of Turkey Creek?
Total Female Population of Turkey Creek is 164.
What is the Ratio of Males per 100 Females in Turkey Creek?
There are 128.05 Males per 100 Females in Turkey Creek.
What is the Ratio of Females per 100 Males in Turkey Creek?
There are 78.10 Females per 100 Males in Turkey Creek.
What is the Median Population Age in Turkey Creek?
Median Population Age in Turkey Creek is 35.4 Years.
What is the Average Family Size in Turkey Creek
Average Family Size in Turkey Creek is 3.2 People.
What is the Average Household Size in Turkey Creek
Average Household Size in Turkey Creek is 2.6 People.
How Large is the Labor Force in Turkey Creek?
There are 131 People in the Labor Forcein in Turkey Creek.
What is the Percentage of People in the Labor Force in Turkey Creek?
48.2% of People are in the Labor Force in Turkey Creek.
What is the Unemployment Rate in Turkey Creek?
Unemployment Rate in Turkey Creek is 3.1%.