Cameron, LA Map & Demographics
Cameron Map
Cameron Overview
$21,493
PER CAPITA INCOME
0.36
INEQUALITY / GINI INDEX
191
TOTAL POPULATION
115
MALE POPULATION
76
FEMALE POPULATION
151.32
MALES / 100 FEMALES
66.09
FEMALES / 100 MALES
38.7
MEDIAN AGE
2.8
AVG FAMILY SIZE
2.4
AVG HOUSEHOLD SIZE
85
LABOR FORCE [ PEOPLE ]
53.5%
PERCENT IN LABOR FORCE
18.8%
UNEMPLOYMENT RATE
Cameron Zip Codes
Cameron Area Codes
Income in Cameron
Income Overview in Cameron
| Characteristic | Number | Measure |
| Per Capita Income | 191 | $21,493 |
| Median Family Income | 48 | $0 |
| Mean Family Income | 48 | $39,704 |
| Median Household Income | 70 | $0 |
| Mean Household Income | 70 | $46,834 |
| Income Deficit | 48 | $0 |
| Wage / Income Gap (%) | 191 | 0.00% |
| Wage / Income Gap ($) | 191 | 100.00¢ per $1 |
| Gini / Inequality Index | 191 | 0.36 |
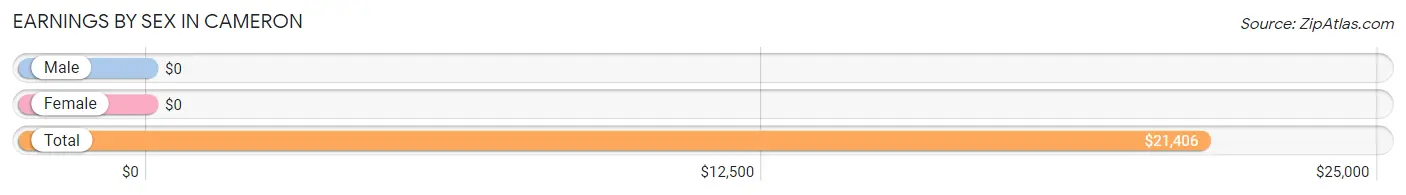
Earnings by Sex in Cameron
| Sex | Number | Average Earnings |
| Male | 60 (67.4%) | $0 |
| Female | 29 (32.6%) | $0 |
| Total | 89 (100.0%) | $21,406 |
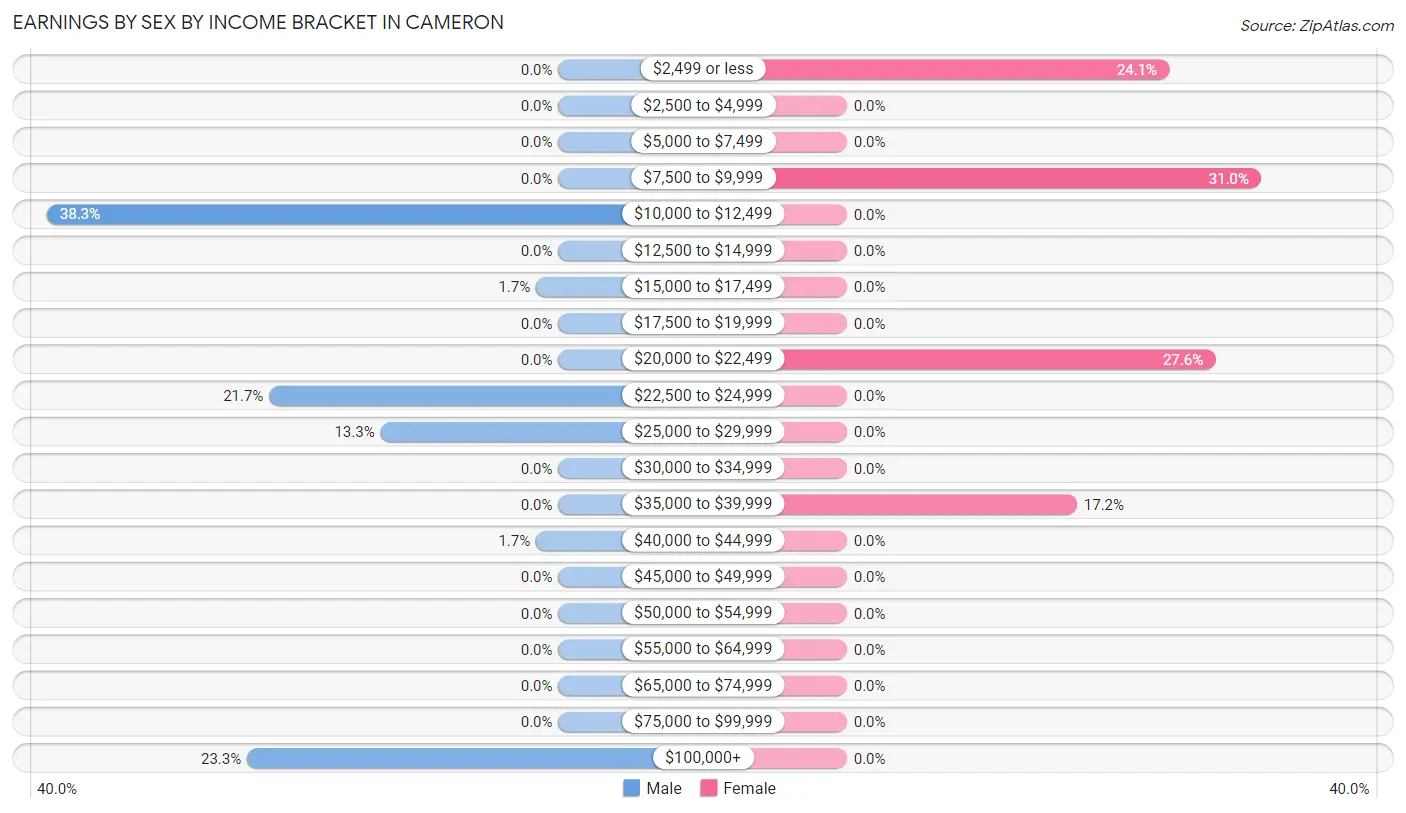
Earnings by Sex by Income Bracket in Cameron
The most common earnings brackets in Cameron are $10,000 to $12,499 for men (23 | 38.3%) and $7,500 to $9,999 for women (9 | 31.0%).
| Income | Male | Female |
| $2,499 or less | 0 (0.0%) | 7 (24.1%) |
| $2,500 to $4,999 | 0 (0.0%) | 0 (0.0%) |
| $5,000 to $7,499 | 0 (0.0%) | 0 (0.0%) |
| $7,500 to $9,999 | 0 (0.0%) | 9 (31.0%) |
| $10,000 to $12,499 | 23 (38.3%) | 0 (0.0%) |
| $12,500 to $14,999 | 0 (0.0%) | 0 (0.0%) |
| $15,000 to $17,499 | 1 (1.7%) | 0 (0.0%) |
| $17,500 to $19,999 | 0 (0.0%) | 0 (0.0%) |
| $20,000 to $22,499 | 0 (0.0%) | 8 (27.6%) |
| $22,500 to $24,999 | 13 (21.7%) | 0 (0.0%) |
| $25,000 to $29,999 | 8 (13.3%) | 0 (0.0%) |
| $30,000 to $34,999 | 0 (0.0%) | 0 (0.0%) |
| $35,000 to $39,999 | 0 (0.0%) | 5 (17.2%) |
| $40,000 to $44,999 | 1 (1.7%) | 0 (0.0%) |
| $45,000 to $49,999 | 0 (0.0%) | 0 (0.0%) |
| $50,000 to $54,999 | 0 (0.0%) | 0 (0.0%) |
| $55,000 to $64,999 | 0 (0.0%) | 0 (0.0%) |
| $65,000 to $74,999 | 0 (0.0%) | 0 (0.0%) |
| $75,000 to $99,999 | 0 (0.0%) | 0 (0.0%) |
| $100,000+ | 14 (23.3%) | 0 (0.0%) |
| Total | 60 (100.0%) | 29 (100.0%) |
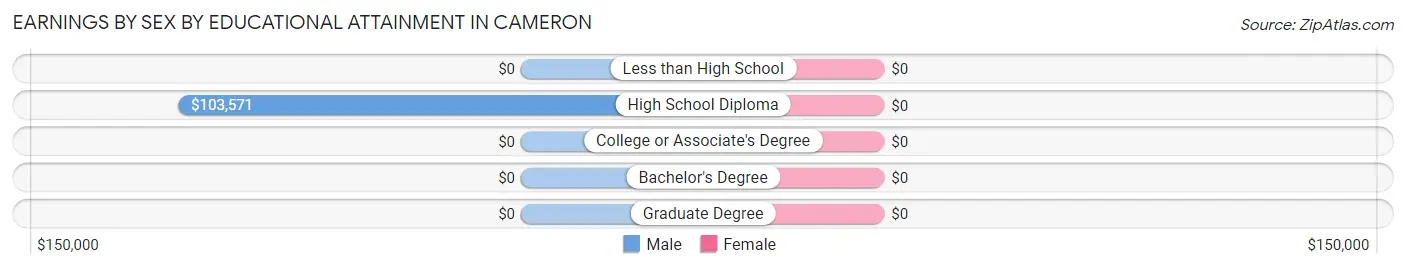
Earnings by Sex by Educational Attainment in Cameron
| Educational Attainment | Male Income | Female Income |
| Less than High School | - | - |
| High School Diploma | $103,571 | $0 |
| College or Associate's Degree | - | - |
| Bachelor's Degree | - | - |
| Graduate Degree | - | - |
| Total | - | - |
Family Income in Cameron
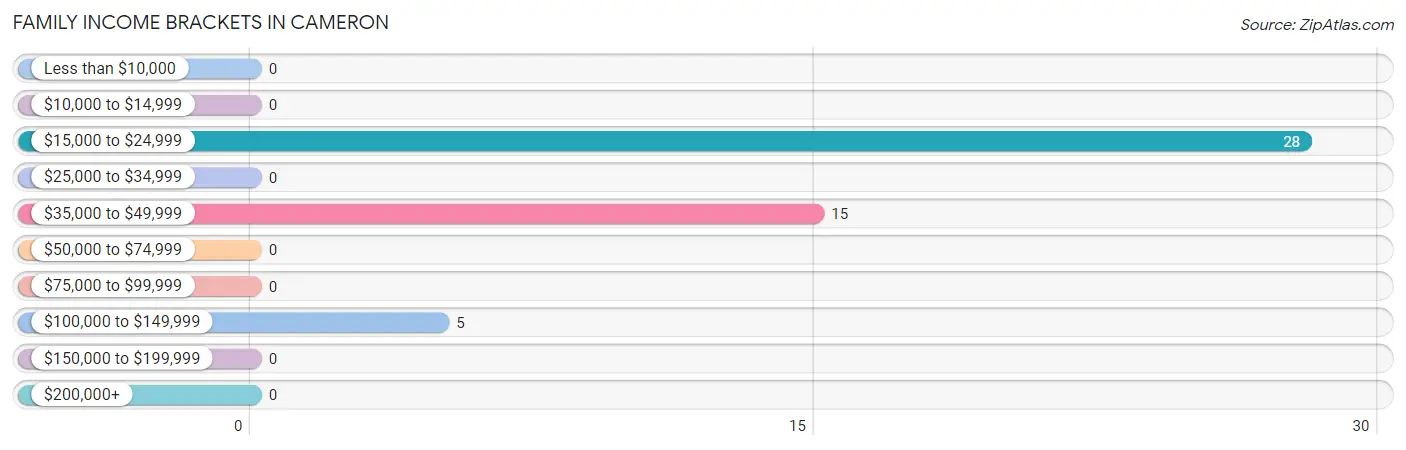
Family Income Brackets in Cameron
According to the Cameron family income data, there are 28 families falling into the $15,000 to $24,999 income range, which is the most common income bracket and makes up 58.3% of all families.
| Income Bracket | # Families | % Families |
| Less than $10,000 | 0 | 0.0% |
| $10,000 to $14,999 | 0 | 0.0% |
| $15,000 to $24,999 | 28 | 58.3% |
| $25,000 to $34,999 | 0 | 0.0% |
| $35,000 to $49,999 | 15 | 31.3% |
| $50,000 to $74,999 | 0 | 0.0% |
| $75,000 to $99,999 | 0 | 0.0% |
| $100,000 to $149,999 | 5 | 10.4% |
| $150,000 to $199,999 | 0 | 0.0% |
| $200,000+ | 0 | 0.0% |
Family Income by Famaliy Size in Cameron
| Income Bracket | # Families | Median Income |
| 2-Person Families | 39 (81.2%) | $0 |
| 3-Person Families | 0 (0.0%) | $0 |
| 4-Person Families | 9 (18.8%) | $0 |
| 5-Person Families | 0 (0.0%) | $0 |
| 6-Person Families | 0 (0.0%) | $0 |
| 7+ Person Families | 0 (0.0%) | $0 |
| Total | 48 (100.0%) | $0 |
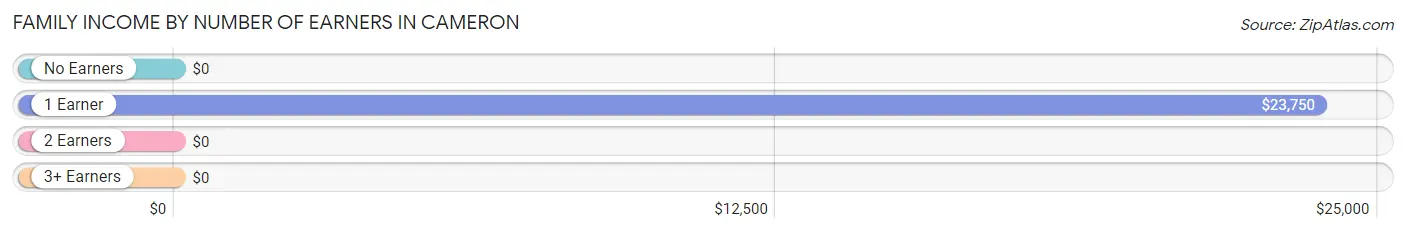
Family Income by Number of Earners in Cameron
| Number of Earners | # Families | Median Income |
| No Earners | 5 (10.4%) | $0 |
| 1 Earner | 27 (56.2%) | $23,750 |
| 2 Earners | 7 (14.6%) | $0 |
| 3+ Earners | 9 (18.8%) | $0 |
| Total | 48 (100.0%) | $0 |
Household Income in Cameron
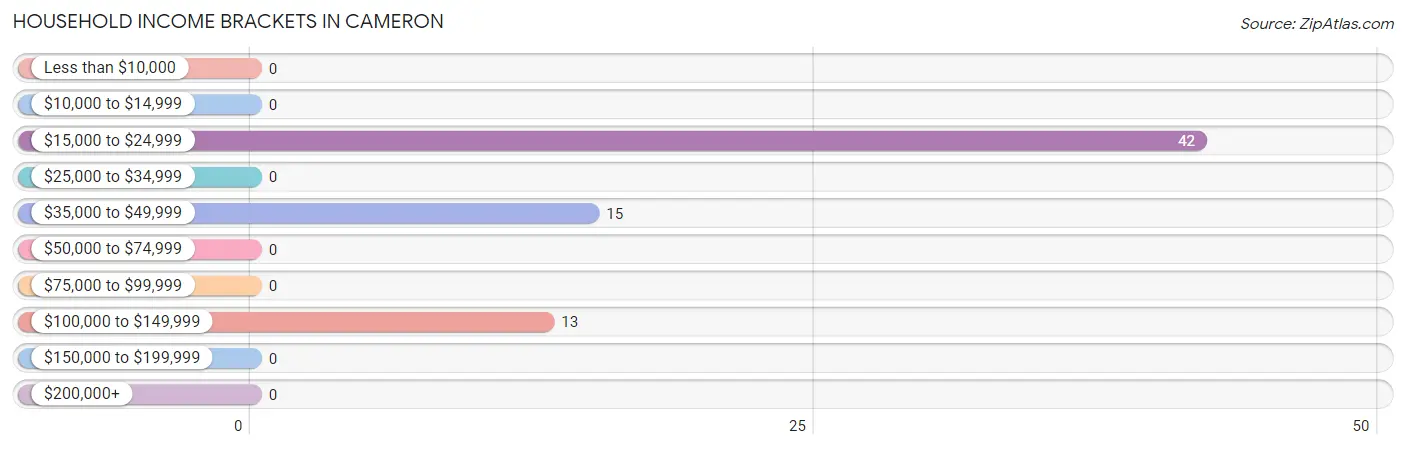
Household Income Brackets in Cameron
With 42 households falling in the category, the $15,000 to $24,999 income range is the most frequent in Cameron, accounting for 60.0% of all households.
| Income Bracket | # Households | % Households |
| Less than $10,000 | 0 | 0.0% |
| $10,000 to $14,999 | 0 | 0.0% |
| $15,000 to $24,999 | 42 | 60.0% |
| $25,000 to $34,999 | 0 | 0.0% |
| $35,000 to $49,999 | 15 | 21.4% |
| $50,000 to $74,999 | 0 | 0.0% |
| $75,000 to $99,999 | 0 | 0.0% |
| $100,000 to $149,999 | 13 | 18.6% |
| $150,000 to $199,999 | 0 | 0.0% |
| $200,000+ | 0 | 0.0% |
Household Income by Householder Age in Cameron
| Income Bracket | # Households | Median Income |
| 15 to 24 Years | 0 (0.0%) | $0 |
| 25 to 44 Years | 24 (34.3%) | $0 |
| 45 to 64 Years | 19 (27.1%) | $0 |
| 65+ Years | 27 (38.6%) | $0 |
| Total | 70 (100.0%) | $0 |
Poverty in Cameron
Income Below Poverty by Sex and Age in Cameron
With 28.7% poverty level for males and 21.6% for females among the residents of Cameron, under 5 year old males and 35 to 44 year old females are the most vulnerable to poverty, with 11 males (100.0%) and 9 females (52.9%) in their respective age groups living below the poverty level.
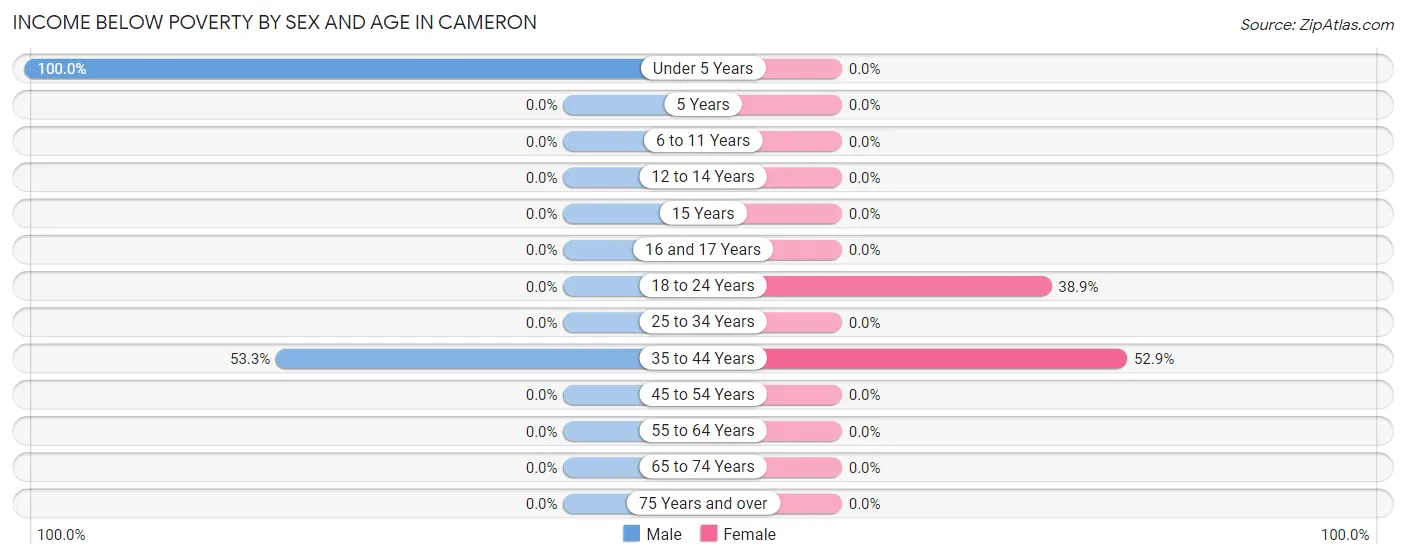
| Age Bracket | Male | Female |
| Under 5 Years | 11 (100.0%) | 0 (0.0%) |
| 5 Years | 0 (0.0%) | 0 (0.0%) |
| 6 to 11 Years | 0 (0.0%) | 0 (0.0%) |
| 12 to 14 Years | 0 (0.0%) | 0 (0.0%) |
| 15 Years | 0 (0.0%) | 0 (0.0%) |
| 16 and 17 Years | 0 (0.0%) | 0 (0.0%) |
| 18 to 24 Years | 0 (0.0%) | 7 (38.9%) |
| 25 to 34 Years | 0 (0.0%) | 0 (0.0%) |
| 35 to 44 Years | 16 (53.3%) | 9 (52.9%) |
| 45 to 54 Years | 0 (0.0%) | 0 (0.0%) |
| 55 to 64 Years | 0 (0.0%) | 0 (0.0%) |
| 65 to 74 Years | 0 (0.0%) | 0 (0.0%) |
| 75 Years and over | 0 (0.0%) | 0 (0.0%) |
| Total | 27 (28.7%) | 16 (21.6%) |
Income Above Poverty by Sex and Age in Cameron
According to the poverty statistics in Cameron, males aged 25 to 34 years and females aged 12 to 14 years are the age groups that are most secure financially, with 100.0% of males and 100.0% of females in these age groups living above the poverty line.
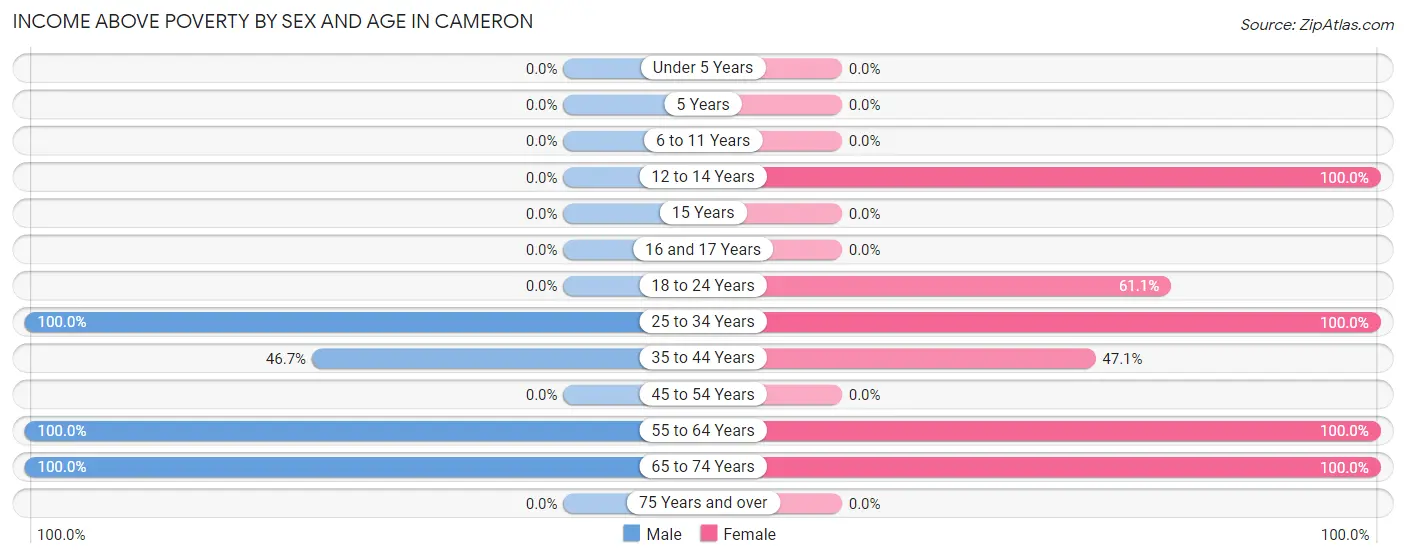
| Age Bracket | Male | Female |
| Under 5 Years | 0 (0.0%) | 0 (0.0%) |
| 5 Years | 0 (0.0%) | 0 (0.0%) |
| 6 to 11 Years | 0 (0.0%) | 0 (0.0%) |
| 12 to 14 Years | 0 (0.0%) | 21 (100.0%) |
| 15 Years | 0 (0.0%) | 0 (0.0%) |
| 16 and 17 Years | 0 (0.0%) | 0 (0.0%) |
| 18 to 24 Years | 0 (0.0%) | 11 (61.1%) |
| 25 to 34 Years | 7 (100.0%) | 5 (100.0%) |
| 35 to 44 Years | 14 (46.7%) | 8 (47.1%) |
| 45 to 54 Years | 0 (0.0%) | 0 (0.0%) |
| 55 to 64 Years | 19 (100.0%) | 7 (100.0%) |
| 65 to 74 Years | 27 (100.0%) | 6 (100.0%) |
| 75 Years and over | 0 (0.0%) | 0 (0.0%) |
| Total | 67 (71.3%) | 58 (78.4%) |
Income Below Poverty Among Married-Couple Families in Cameron
The poverty statistics for married-couple families in Cameron show that 31.0% or 9 of the total 29 families live below the poverty line. Families with 1 or 2 children have the highest poverty rate of 100.0%, comprising of 9 families. On the other hand, families with no children have the lowest poverty rate of 0.0%, which includes 0 families.
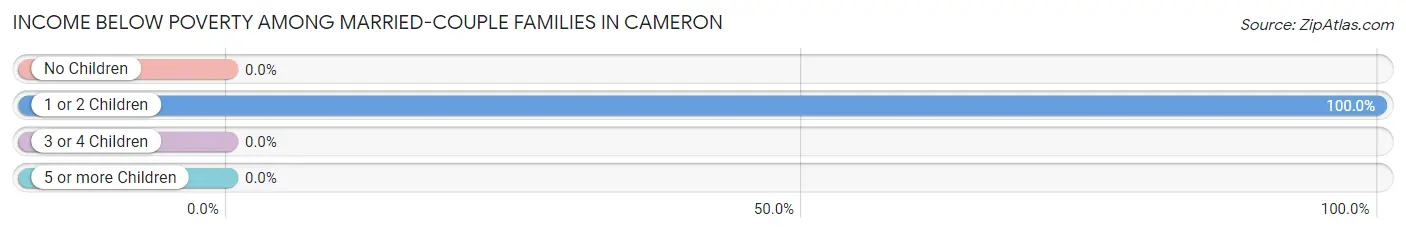
| Children | Above Poverty | Below Poverty |
| No Children | 20 (100.0%) | 0 (0.0%) |
| 1 or 2 Children | 0 (0.0%) | 9 (100.0%) |
| 3 or 4 Children | 0 (0.0%) | 0 (0.0%) |
| 5 or more Children | 0 (0.0%) | 0 (0.0%) |
| Total | 20 (69.0%) | 9 (31.0%) |
Income Below Poverty Among Single-Parent Households in Cameron
| Children | Single Father | Single Mother |
| No Children | 0 (0.0%) | 0 (0.0%) |
| 1 or 2 Children | 0 (0.0%) | 0 (0.0%) |
| 3 or 4 Children | 0 (0.0%) | 0 (0.0%) |
| 5 or more Children | 0 (0.0%) | 0 (0.0%) |
| Total | 0 (0.0%) | 0 (0.0%) |
Income Below Poverty Among Married-Couple vs Single-Parent Households in Cameron
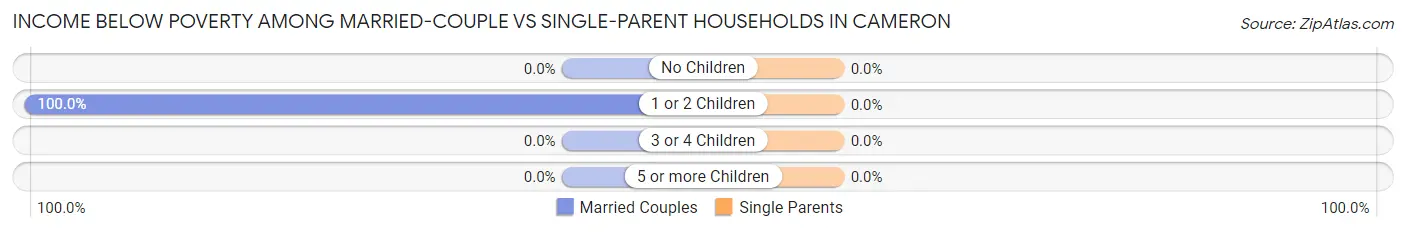
| Children | Married-Couple Families | Single-Parent Households |
| No Children | 0 (0.0%) | 0 (0.0%) |
| 1 or 2 Children | 9 (100.0%) | 0 (0.0%) |
| 3 or 4 Children | 0 (0.0%) | 0 (0.0%) |
| 5 or more Children | 0 (0.0%) | 0 (0.0%) |
| Total | 9 (31.0%) | 0 (0.0%) |
Race in Cameron
The most populous races in Cameron are White / Caucasian (179 | 93.7%), Black / African American (11 | 5.8%), and Hispanic or Latino (1 | 0.5%).
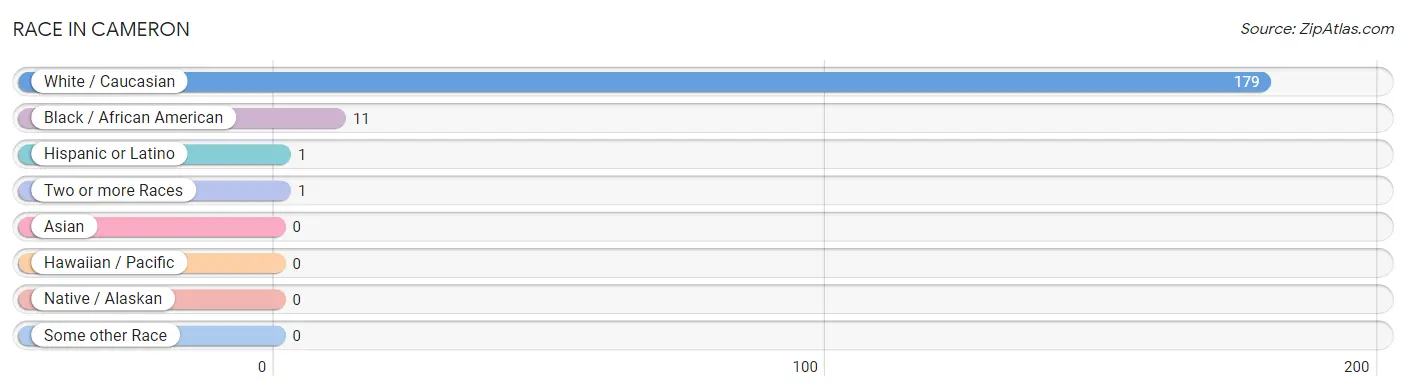
| Race | # Population | % Population |
| Asian | 0 | 0.0% |
| Black / African American | 11 | 5.8% |
| Hawaiian / Pacific | 0 | 0.0% |
| Hispanic or Latino | 1 | 0.5% |
| Native / Alaskan | 0 | 0.0% |
| White / Caucasian | 179 | 93.7% |
| Two or more Races | 1 | 0.5% |
| Some other Race | 0 | 0.0% |
| Total | 191 | 100.0% |
Ancestry in Cameron
The most populous ancestries reported in Cameron are German (27 | 14.1%), Irish (24 | 12.6%), Cajun (22 | 11.5%), French (15 | 7.9%), and Italian (6 | 3.1%), together accounting for 49.2% of all Cameron residents.
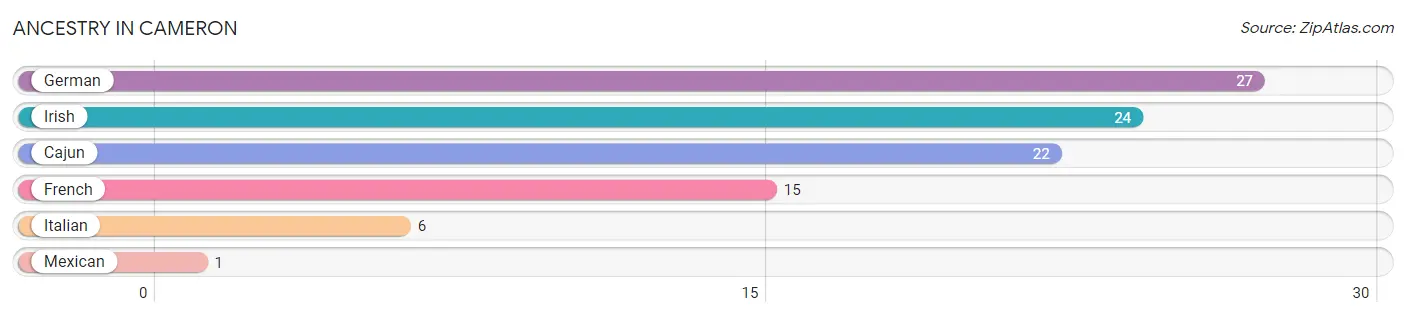
| Ancestry | # Population | % Population |
| Cajun | 22 | 11.5% |
| French | 15 | 7.9% |
| German | 27 | 14.1% |
| Irish | 24 | 12.6% |
| Italian | 6 | 3.1% |
| Mexican | 1 | 0.5% | View All 6 Rows |
Immigrants in Cameron
The most numerous immigrant groups reported in Cameron came from Central America (1 | 0.5%), Latin America (1 | 0.5%), and Mexico (1 | 0.5%), together accounting for 1.6% of all Cameron residents.
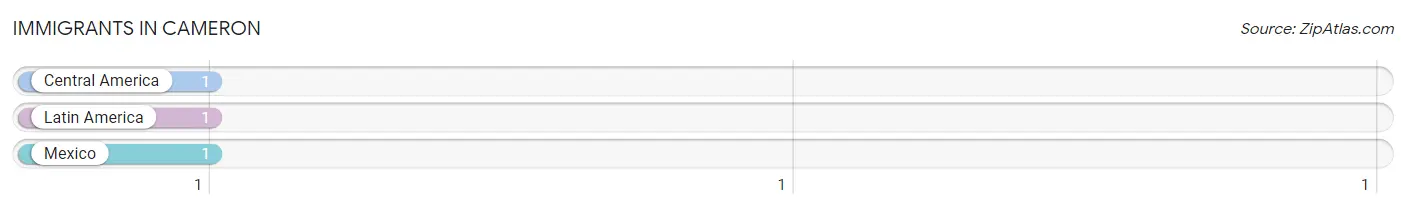
| Immigration Origin | # Population | % Population |
| Central America | 1 | 0.5% |
| Latin America | 1 | 0.5% |
| Mexico | 1 | 0.5% | View All 3 Rows |
Sex and Age in Cameron
Sex and Age in Cameron
The most populous age groups in Cameron are 65 to 69 Years (27 | 23.5%) for men and 10 to 14 Years (21 | 27.6%) for women.
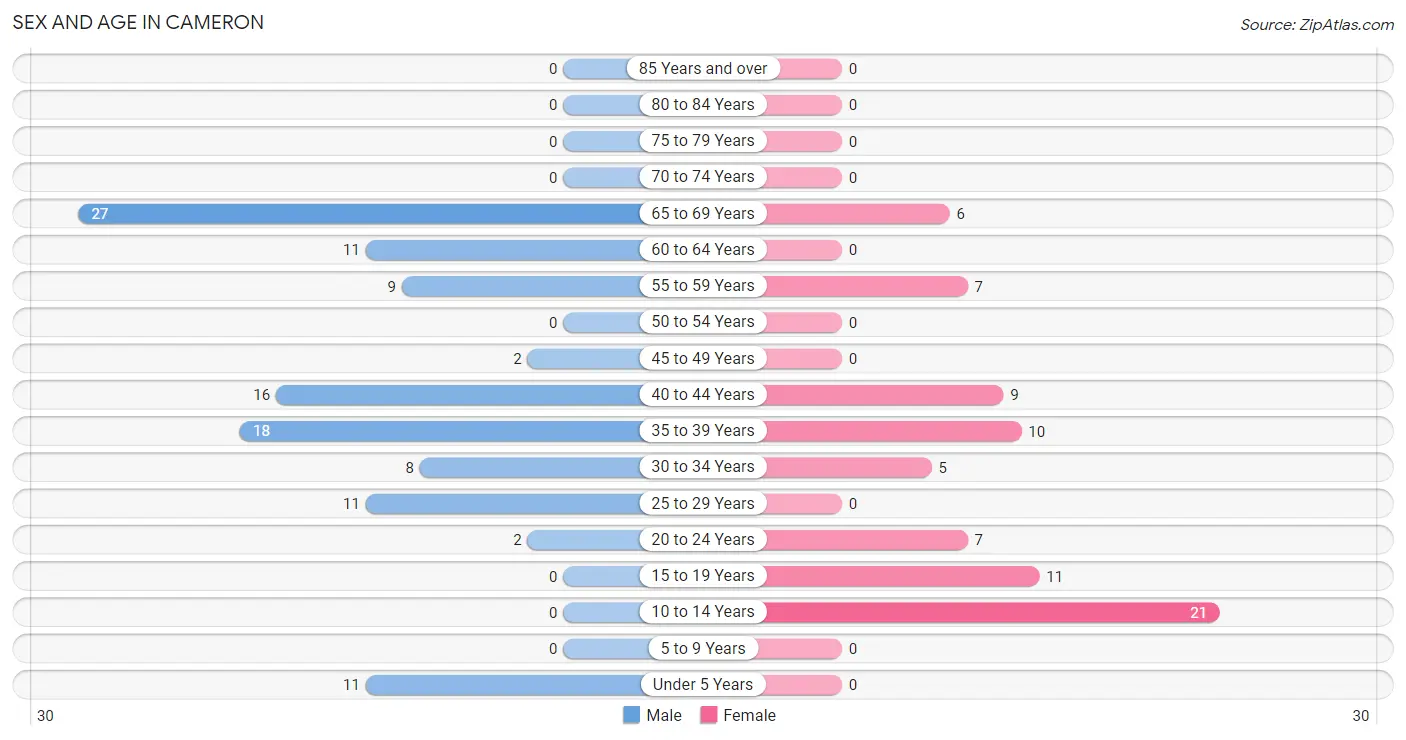
| Age Bracket | Male | Female |
| Under 5 Years | 11 (9.6%) | 0 (0.0%) |
| 5 to 9 Years | 0 (0.0%) | 0 (0.0%) |
| 10 to 14 Years | 0 (0.0%) | 21 (27.6%) |
| 15 to 19 Years | 0 (0.0%) | 11 (14.5%) |
| 20 to 24 Years | 2 (1.7%) | 7 (9.2%) |
| 25 to 29 Years | 11 (9.6%) | 0 (0.0%) |
| 30 to 34 Years | 8 (7.0%) | 5 (6.6%) |
| 35 to 39 Years | 18 (15.7%) | 10 (13.2%) |
| 40 to 44 Years | 16 (13.9%) | 9 (11.8%) |
| 45 to 49 Years | 2 (1.7%) | 0 (0.0%) |
| 50 to 54 Years | 0 (0.0%) | 0 (0.0%) |
| 55 to 59 Years | 9 (7.8%) | 7 (9.2%) |
| 60 to 64 Years | 11 (9.6%) | 0 (0.0%) |
| 65 to 69 Years | 27 (23.5%) | 6 (7.9%) |
| 70 to 74 Years | 0 (0.0%) | 0 (0.0%) |
| 75 to 79 Years | 0 (0.0%) | 0 (0.0%) |
| 80 to 84 Years | 0 (0.0%) | 0 (0.0%) |
| 85 Years and over | 0 (0.0%) | 0 (0.0%) |
| Total | 115 (100.0%) | 76 (100.0%) |
Families and Households in Cameron
Median Family Size in Cameron
The median family size in Cameron is 2.75 persons per family, with single female/mother families (8 | 16.7%) accounting for the largest median family size of 3.63 persons per family. On the other hand, single male/father families (11 | 22.9%) represent the smallest median family size with 2.00 persons per family.
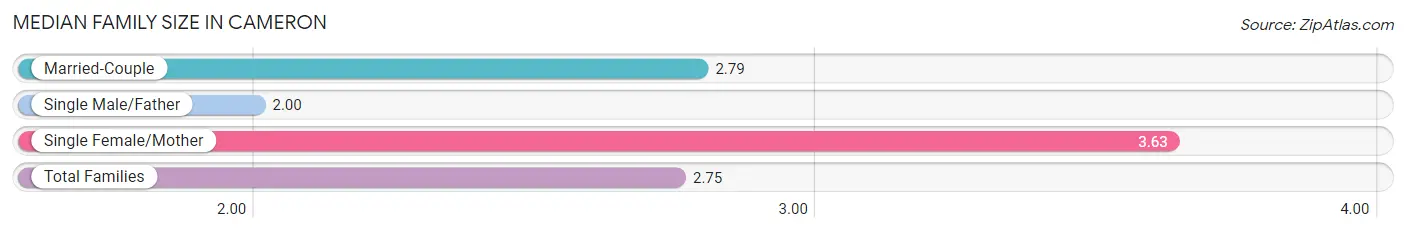
| Family Type | # Families | Family Size |
| Married-Couple | 29 (60.4%) | 2.79 |
| Single Male/Father | 11 (22.9%) | 2.00 |
| Single Female/Mother | 8 (16.7%) | 3.63 |
| Total Families | 48 (100.0%) | 2.75 |
Median Household Size in Cameron
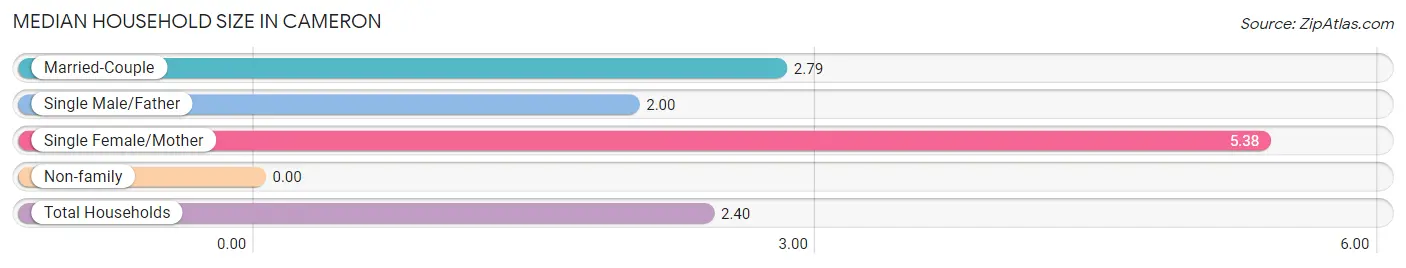
| Household Type | # Households | Household Size |
| Married-Couple | 29 (41.4%) | 2.79 |
| Single Male/Father | 11 (15.7%) | 2.00 |
| Single Female/Mother | 8 (11.4%) | 5.38 |
| Non-family | 22 (31.4%) | - |
| Total Households | 70 (100.0%) | 2.40 |
Household Size by Marriage Status in Cameron
Out of a total of 70 households in Cameron, 48 (68.6%) are family households, while 22 (31.4%) are nonfamily households. The most numerous type of family households are 2-person households, comprising 31, and the most common type of nonfamily households are 1-person households, comprising 22.
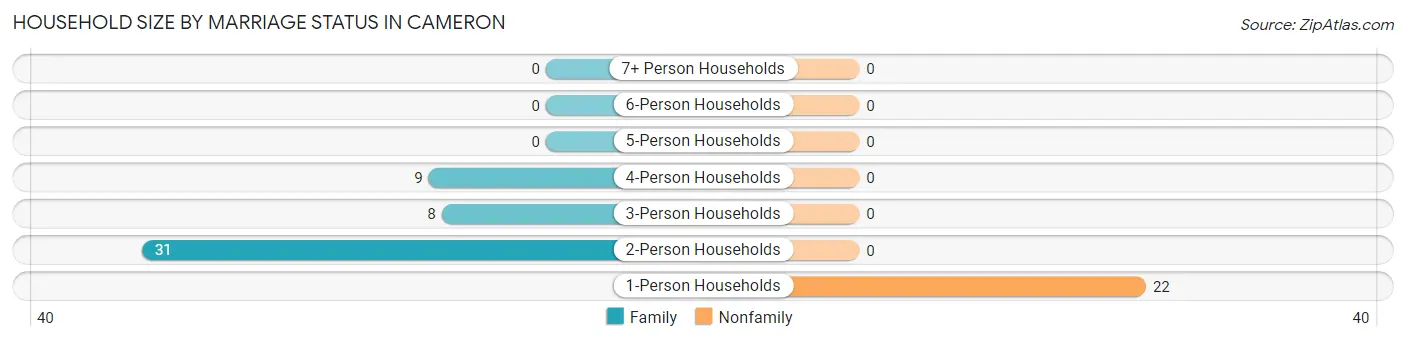
| Household Size | Family Households | Nonfamily Households |
| 1-Person Households | - | 22 (31.4%) |
| 2-Person Households | 31 (44.3%) | 0 (0.0%) |
| 3-Person Households | 8 (11.4%) | 0 (0.0%) |
| 4-Person Households | 9 (12.9%) | 0 (0.0%) |
| 5-Person Households | 0 (0.0%) | 0 (0.0%) |
| 6-Person Households | 0 (0.0%) | 0 (0.0%) |
| 7+ Person Households | 0 (0.0%) | 0 (0.0%) |
| Total | 48 (68.6%) | 22 (31.4%) |
Female Fertility in Cameron
Fertility by Age in Cameron
Average fertility rate in Cameron is 24.0 births per 1,000 women. Women in the age bracket of 35 to 50 years have the highest fertility rate with 53.0 births per 1,000 women. Women in the age bracket of 35 to 50 years acount for 100.0% of all women with births.
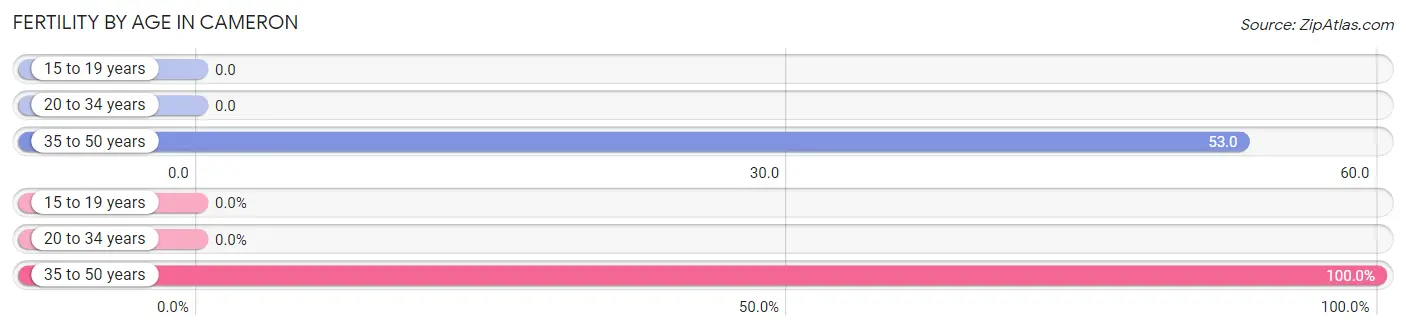
| Age Bracket | Women with Births | Births / 1,000 Women |
| 15 to 19 years | 0 (0.0%) | 0.0 |
| 20 to 34 years | 0 (0.0%) | 0.0 |
| 35 to 50 years | 1 (100.0%) | 53.0 |
| Total | 1 (100.0%) | 24.0 |
Fertility by Age by Marriage Status in Cameron
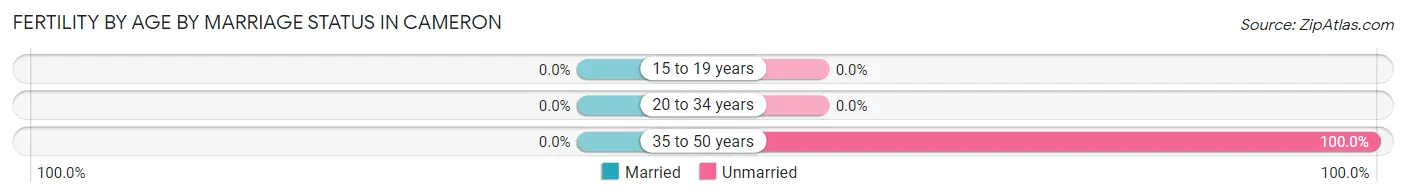
| Age Bracket | Married | Unmarried |
| 15 to 19 years | 0 (0.0%) | 0 (0.0%) |
| 20 to 34 years | 0 (0.0%) | 0 (0.0%) |
| 35 to 50 years | 0 (0.0%) | 1 (100.0%) |
| Total | 0 (0.0%) | 1 (100.0%) |
Fertility by Education in Cameron
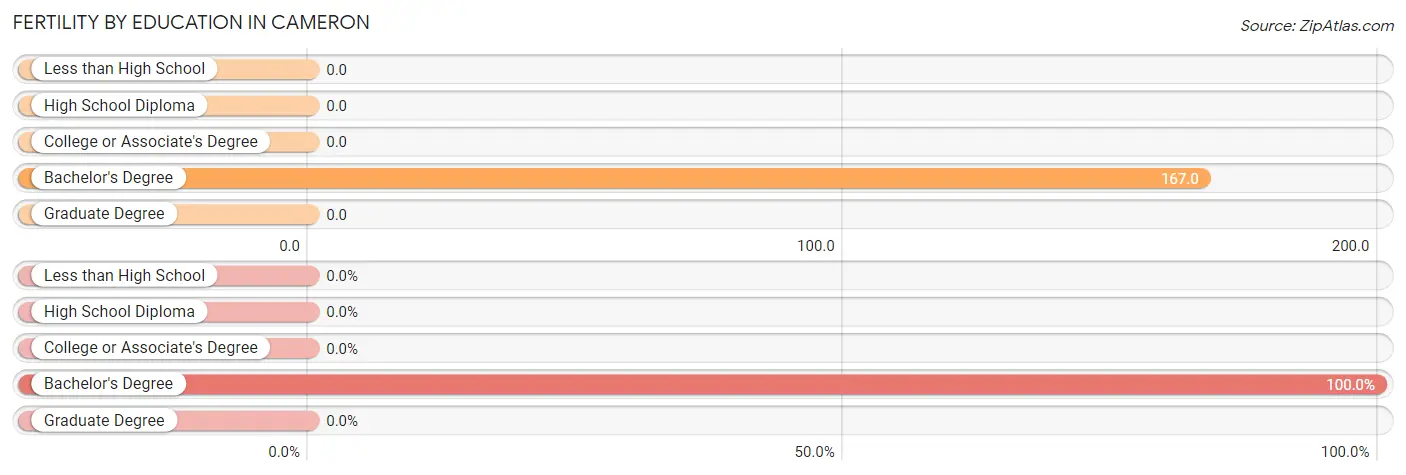
| Educational Attainment | Women with Births | Births / 1,000 Women |
| Less than High School | 0 (0.0%) | 0.0 |
| High School Diploma | 0 (0.0%) | 0.0 |
| College or Associate's Degree | 0 (0.0%) | 0.0 |
| Bachelor's Degree | 1 (100.0%) | 167.0 |
| Graduate Degree | 0 (0.0%) | 0.0 |
| Total | 1 (100.0%) | 24.0 |
Fertility by Education by Marriage Status in Cameron
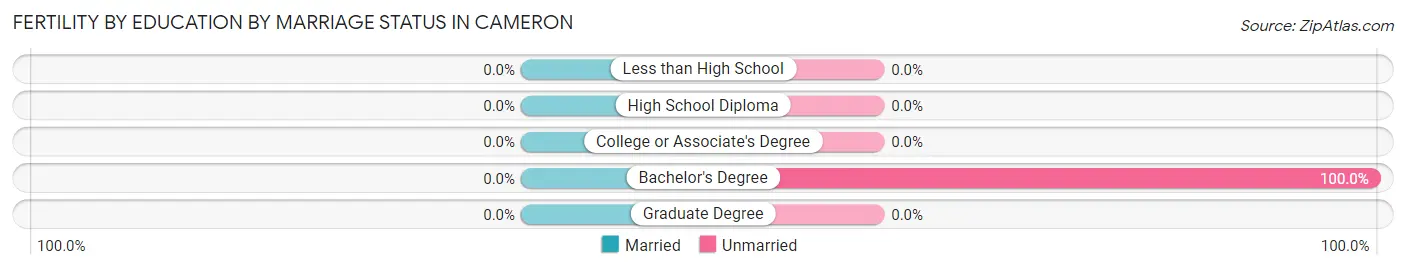
| Educational Attainment | Married | Unmarried |
| Less than High School | 0 (0.0%) | 0 (0.0%) |
| High School Diploma | 0 (0.0%) | 0 (0.0%) |
| College or Associate's Degree | 0 (0.0%) | 0 (0.0%) |
| Bachelor's Degree | 0 (0.0%) | 1 (100.0%) |
| Graduate Degree | 0 (0.0%) | 0 (0.0%) |
| Total | 0 (0.0%) | 1 (100.0%) |
Employment Characteristics in Cameron
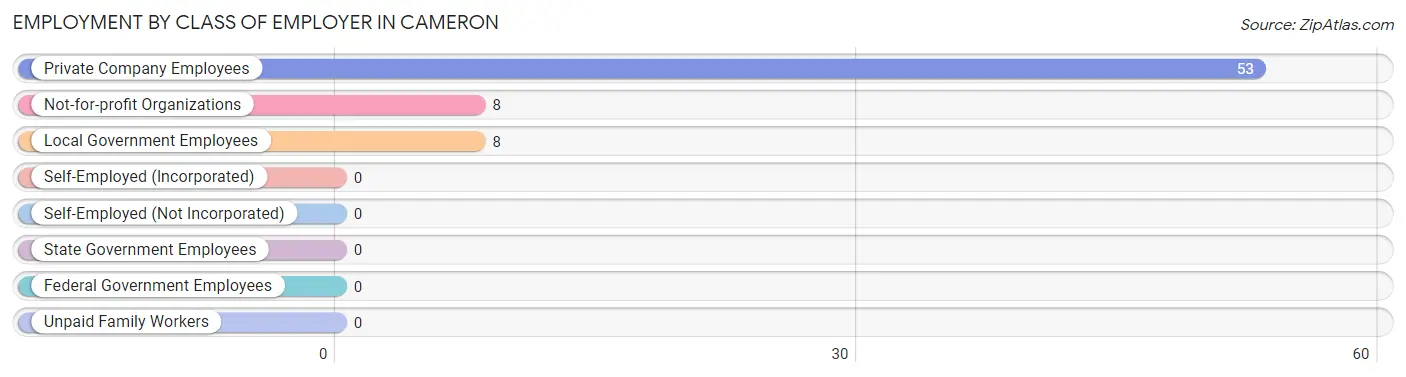
Employment by Class of Employer in Cameron
Among the 69 employed individuals in Cameron, private company employees (53 | 76.8%), not-for-profit organizations (8 | 11.6%), and local government employees (8 | 11.6%) make up the most common classes of employment.
| Employer Class | # Employees | % Employees |
| Private Company Employees | 53 | 76.8% |
| Self-Employed (Incorporated) | 0 | 0.0% |
| Self-Employed (Not Incorporated) | 0 | 0.0% |
| Not-for-profit Organizations | 8 | 11.6% |
| Local Government Employees | 8 | 11.6% |
| State Government Employees | 0 | 0.0% |
| Federal Government Employees | 0 | 0.0% |
| Unpaid Family Workers | 0 | 0.0% |
| Total | 69 | 100.0% |
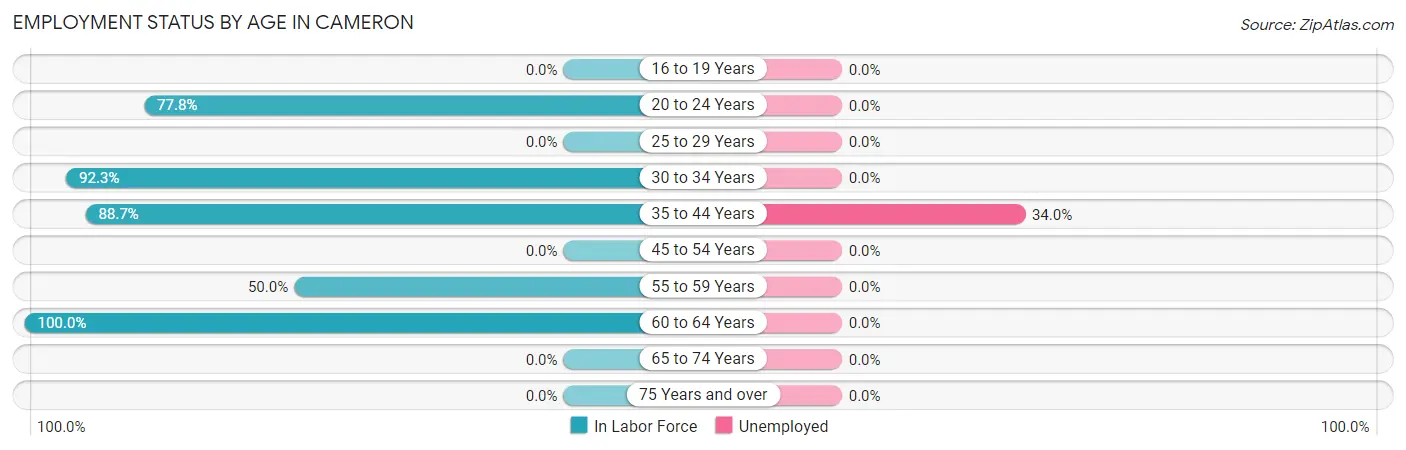
Employment Status by Age in Cameron
According to the labor force statistics for Cameron, out of the total population over 16 years of age (159), 53.5% or 85 individuals are in the labor force, with 18.8% or 16 of them unemployed. The age group with the highest labor force participation rate is 60 to 64 years, with 100.0% or 11 individuals in the labor force. Within the labor force, the 35 to 44 years age range has the highest percentage of unemployed individuals, with 34.0% or 16 of them being unemployed.
| Age Bracket | In Labor Force | Unemployed |
| 16 to 19 Years | 0 (0.0%) | 0 (0.0%) |
| 20 to 24 Years | 7 (77.8%) | 0 (0.0%) |
| 25 to 29 Years | 0 (0.0%) | 0 (0.0%) |
| 30 to 34 Years | 12 (92.3%) | 0 (0.0%) |
| 35 to 44 Years | 47 (88.7%) | 16 (34.0%) |
| 45 to 54 Years | 0 (0.0%) | 0 (0.0%) |
| 55 to 59 Years | 8 (50.0%) | 0 (0.0%) |
| 60 to 64 Years | 11 (100.0%) | 0 (0.0%) |
| 65 to 74 Years | 0 (0.0%) | 0 (0.0%) |
| 75 Years and over | 0 (0.0%) | 0 (0.0%) |
| Total | 85 (53.5%) | 16 (18.8%) |
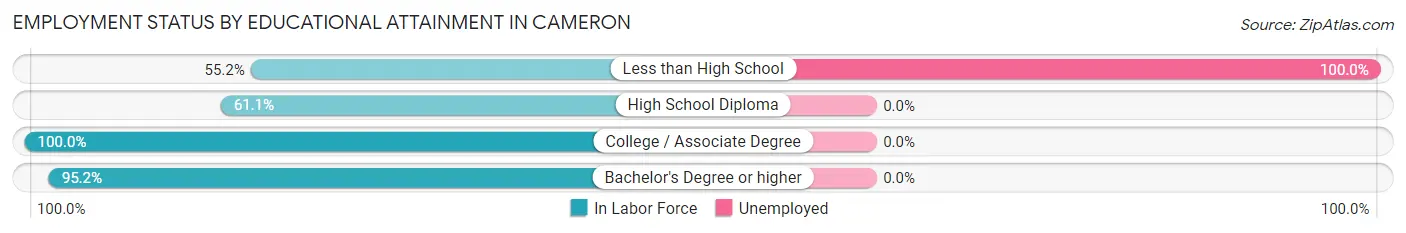
Employment Status by Educational Attainment in Cameron
According to labor force statistics for Cameron, 73.6% of individuals (78) out of the total population between 25 and 64 years of age (106) are in the labor force, with 20.5% or 16 of them being unemployed. The group with the highest labor force participation rate are those with the educational attainment of college / associate degree, with 100.0% or 20 individuals in the labor force. Within the labor force, individuals with less than high school education have the highest percentage of unemployment, with 100.0% or 16 of them being unemployed.
| Educational Attainment | In Labor Force | Unemployed |
| Less than High School | 16 (55.2%) | 29 (100.0%) |
| High School Diploma | 22 (61.1%) | 0 (0.0%) |
| College / Associate Degree | 20 (100.0%) | 0 (0.0%) |
| Bachelor's Degree or higher | 20 (95.2%) | 0 (0.0%) |
| Total | 78 (73.6%) | 22 (20.5%) |
Employment Occupations by Sex in Cameron
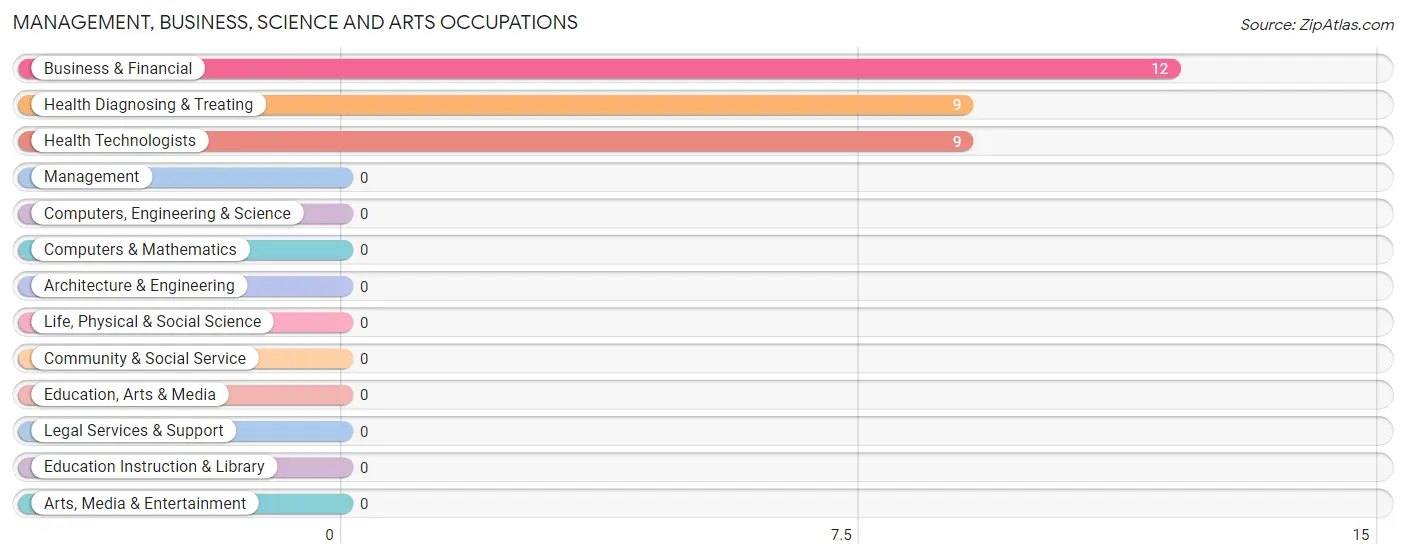
Management, Business, Science and Arts Occupations
The most common Management, Business, Science and Arts occupations in Cameron are Business & Financial (12 | 17.4%), Health Diagnosing & Treating (9 | 13.0%), and Health Technologists (9 | 13.0%).
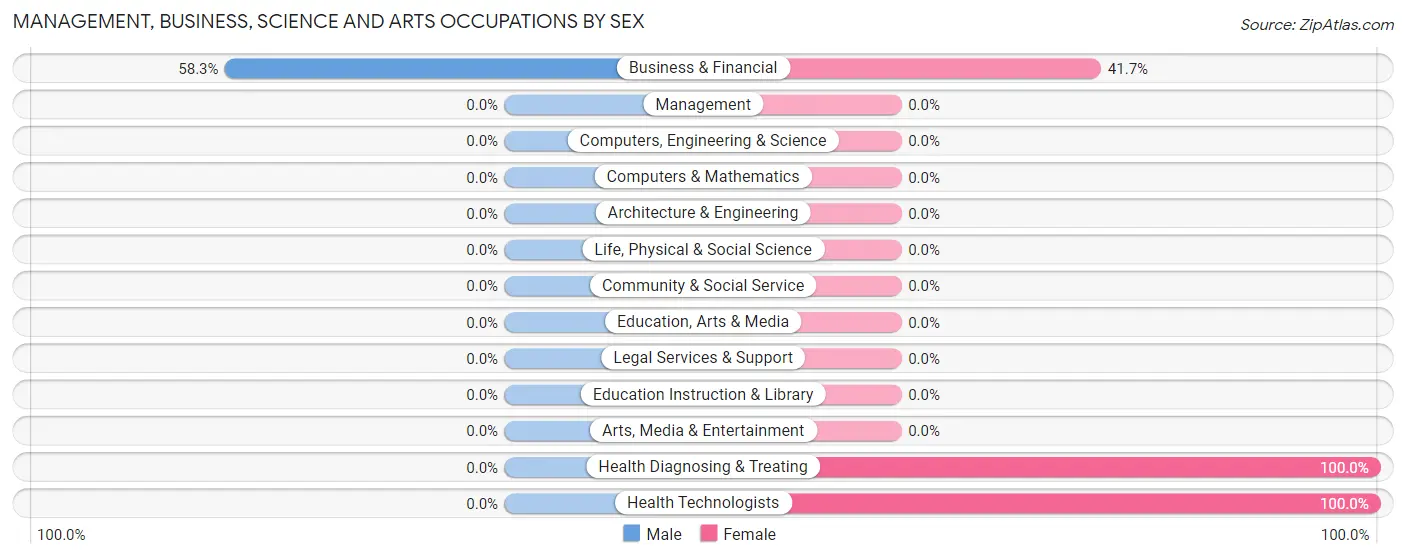
Management, Business, Science and Arts Occupations by Sex
| Occupation | Male | Female |
| Management | 0 (0.0%) | 0 (0.0%) |
| Business & Financial | 7 (58.3%) | 5 (41.7%) |
| Computers, Engineering & Science | 0 (0.0%) | 0 (0.0%) |
| Computers & Mathematics | 0 (0.0%) | 0 (0.0%) |
| Architecture & Engineering | 0 (0.0%) | 0 (0.0%) |
| Life, Physical & Social Science | 0 (0.0%) | 0 (0.0%) |
| Community & Social Service | 0 (0.0%) | 0 (0.0%) |
| Education, Arts & Media | 0 (0.0%) | 0 (0.0%) |
| Legal Services & Support | 0 (0.0%) | 0 (0.0%) |
| Education Instruction & Library | 0 (0.0%) | 0 (0.0%) |
| Arts, Media & Entertainment | 0 (0.0%) | 0 (0.0%) |
| Health Diagnosing & Treating | 0 (0.0%) | 9 (100.0%) |
| Health Technologists | 0 (0.0%) | 9 (100.0%) |
| Total (Category) | 7 (33.3%) | 14 (66.7%) |
| Total (Overall) | 40 (58.0%) | 29 (42.0%) |
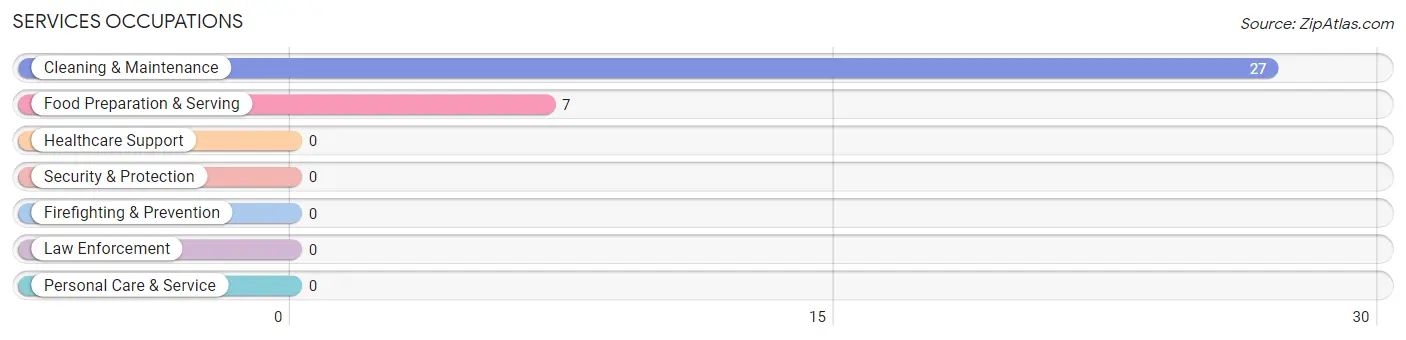
Services Occupations
The most common Services occupations in Cameron are Cleaning & Maintenance (27 | 39.1%), and Food Preparation & Serving (7 | 10.1%).
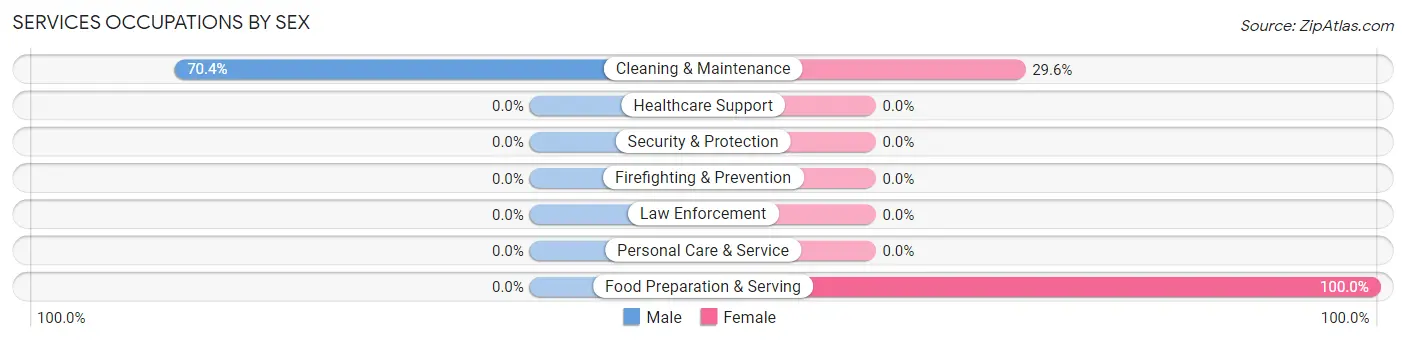
Services Occupations by Sex
| Occupation | Male | Female |
| Healthcare Support | 0 (0.0%) | 0 (0.0%) |
| Security & Protection | 0 (0.0%) | 0 (0.0%) |
| Firefighting & Prevention | 0 (0.0%) | 0 (0.0%) |
| Law Enforcement | 0 (0.0%) | 0 (0.0%) |
| Food Preparation & Serving | 0 (0.0%) | 7 (100.0%) |
| Cleaning & Maintenance | 19 (70.4%) | 8 (29.6%) |
| Personal Care & Service | 0 (0.0%) | 0 (0.0%) |
| Total (Category) | 19 (55.9%) | 15 (44.1%) |
| Total (Overall) | 40 (58.0%) | 29 (42.0%) |
Sales and Office Occupations
Sales and Office Occupations by Sex
| Occupation | Male | Female |
| Sales & Related | 0 (0.0%) | 0 (0.0%) |
| Office & Administration | 0 (0.0%) | 0 (0.0%) |
| Total (Category) | 0 (0.0%) | 0 (0.0%) |
| Total (Overall) | 40 (58.0%) | 29 (42.0%) |
Natural Resources, Construction and Maintenance Occupations
The most common Natural Resources, Construction and Maintenance occupations in Cameron are , and Installation, Maintenance & Repair (14 | 20.3%).
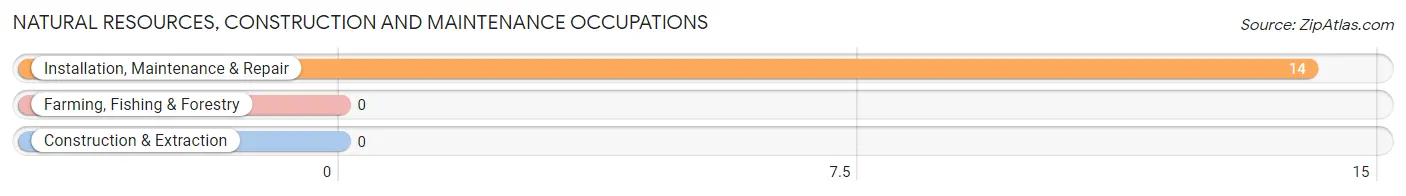
Natural Resources, Construction and Maintenance Occupations by Sex
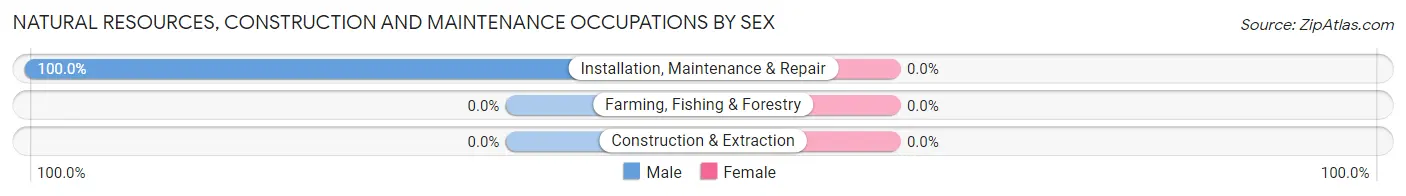
| Occupation | Male | Female |
| Farming, Fishing & Forestry | 0 (0.0%) | 0 (0.0%) |
| Construction & Extraction | 0 (0.0%) | 0 (0.0%) |
| Installation, Maintenance & Repair | 14 (100.0%) | 0 (0.0%) |
| Total (Category) | 14 (100.0%) | 0 (0.0%) |
| Total (Overall) | 40 (58.0%) | 29 (42.0%) |
Production, Transportation and Moving Occupations
Production, Transportation and Moving Occupations by Sex
| Occupation | Male | Female |
| Production | 0 (0.0%) | 0 (0.0%) |
| Transportation | 0 (0.0%) | 0 (0.0%) |
| Material Moving | 0 (0.0%) | 0 (0.0%) |
| Total (Category) | 0 (0.0%) | 0 (0.0%) |
| Total (Overall) | 40 (58.0%) | 29 (42.0%) |
Employment Industries by Sex in Cameron
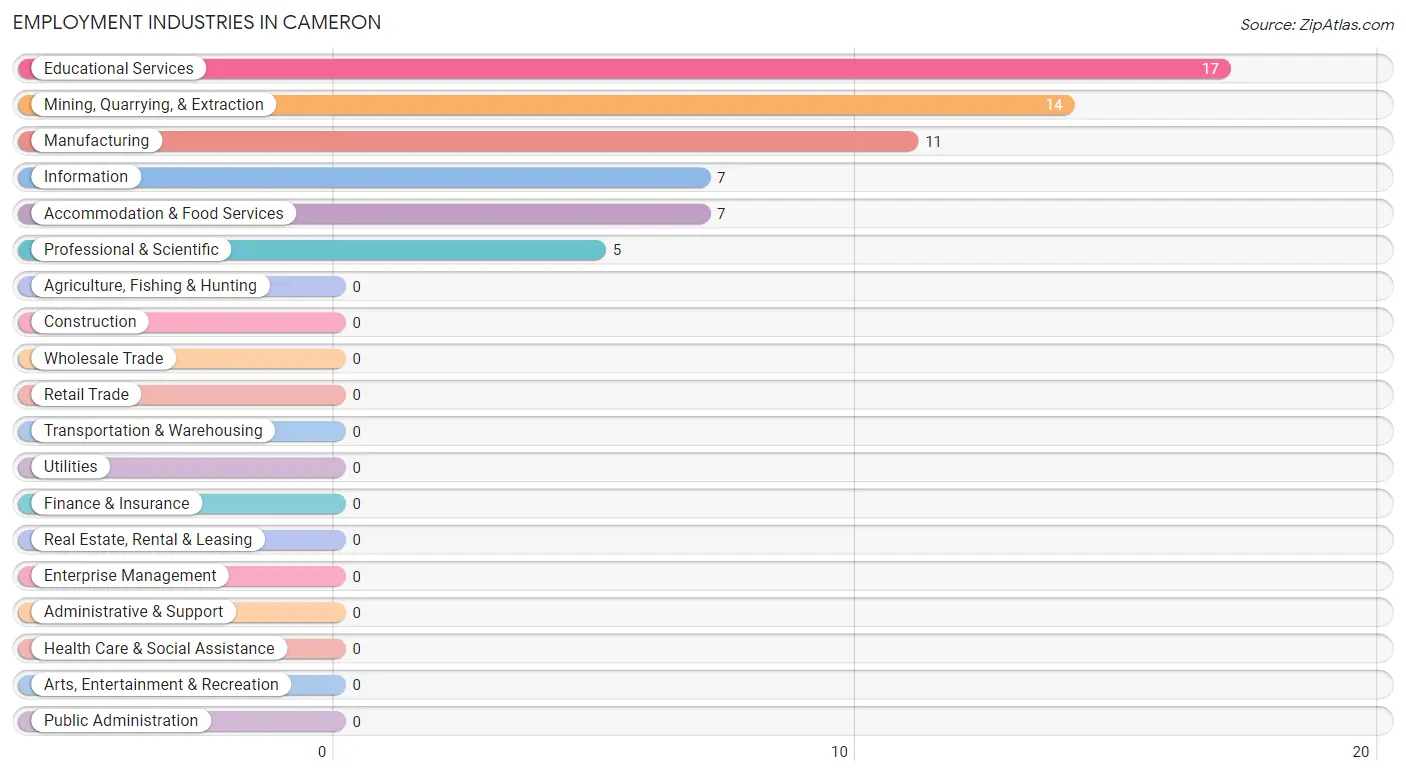
Employment Industries in Cameron
The major employment industries in Cameron include Educational Services (17 | 24.6%), Mining, Quarrying, & Extraction (14 | 20.3%), Manufacturing (11 | 15.9%), Information (7 | 10.1%), and Accommodation & Food Services (7 | 10.1%).
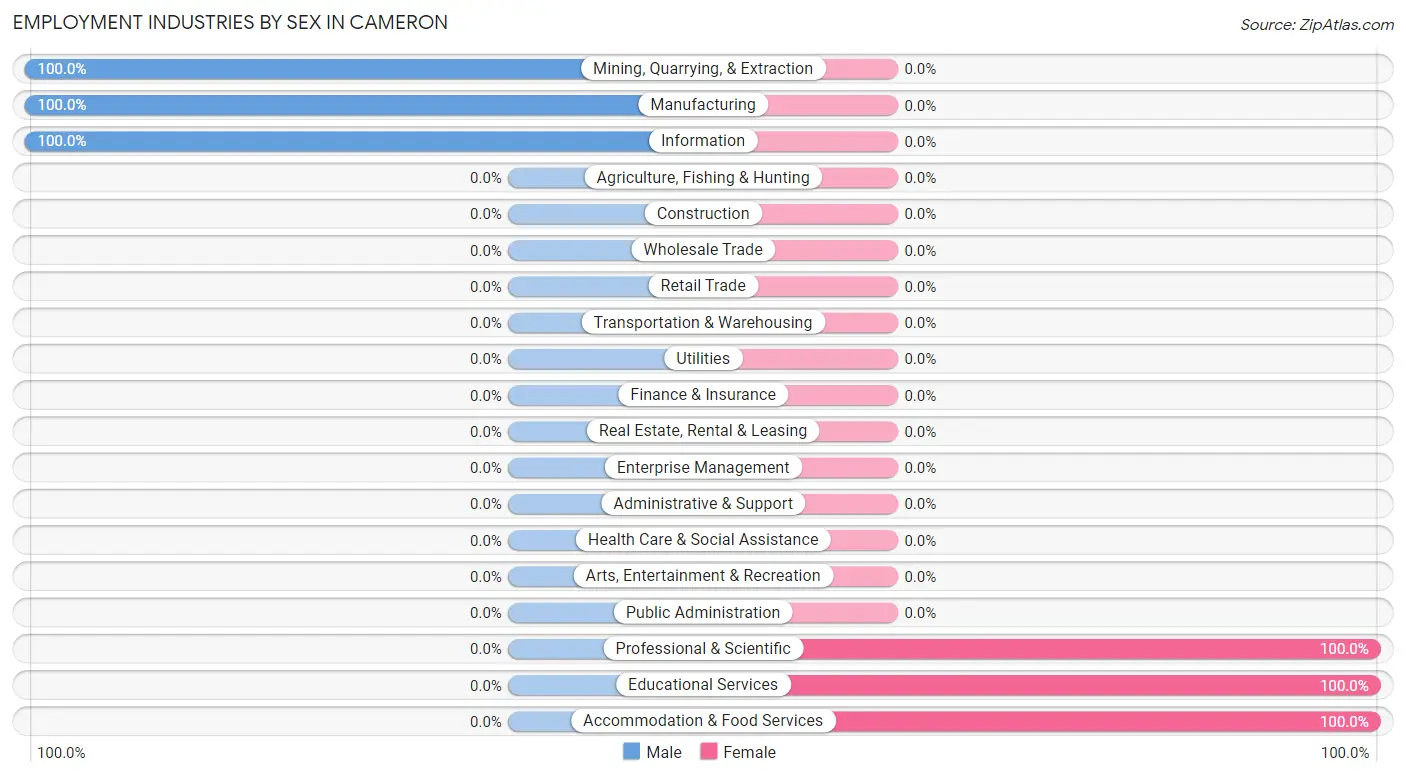
Employment Industries by Sex in Cameron
The Cameron industries that see more men than women are Mining, Quarrying, & Extraction (100.0%), Manufacturing (100.0%), and Information (100.0%), whereas the industries that tend to have a higher number of women are Professional & Scientific (100.0%), Educational Services (100.0%), and Accommodation & Food Services (100.0%).
| Industry | Male | Female |
| Agriculture, Fishing & Hunting | 0 (0.0%) | 0 (0.0%) |
| Mining, Quarrying, & Extraction | 14 (100.0%) | 0 (0.0%) |
| Construction | 0 (0.0%) | 0 (0.0%) |
| Manufacturing | 11 (100.0%) | 0 (0.0%) |
| Wholesale Trade | 0 (0.0%) | 0 (0.0%) |
| Retail Trade | 0 (0.0%) | 0 (0.0%) |
| Transportation & Warehousing | 0 (0.0%) | 0 (0.0%) |
| Utilities | 0 (0.0%) | 0 (0.0%) |
| Information | 7 (100.0%) | 0 (0.0%) |
| Finance & Insurance | 0 (0.0%) | 0 (0.0%) |
| Real Estate, Rental & Leasing | 0 (0.0%) | 0 (0.0%) |
| Professional & Scientific | 0 (0.0%) | 5 (100.0%) |
| Enterprise Management | 0 (0.0%) | 0 (0.0%) |
| Administrative & Support | 0 (0.0%) | 0 (0.0%) |
| Educational Services | 0 (0.0%) | 17 (100.0%) |
| Health Care & Social Assistance | 0 (0.0%) | 0 (0.0%) |
| Arts, Entertainment & Recreation | 0 (0.0%) | 0 (0.0%) |
| Accommodation & Food Services | 0 (0.0%) | 7 (100.0%) |
| Public Administration | 0 (0.0%) | 0 (0.0%) |
| Total | 40 (58.0%) | 29 (42.0%) |
Education in Cameron
School Enrollment in Cameron
The most common levels of schooling among the 44 students in Cameron are middle school (21 | 47.7%), college / undergraduate (12 | 27.3%), and high school (11 | 25.0%).
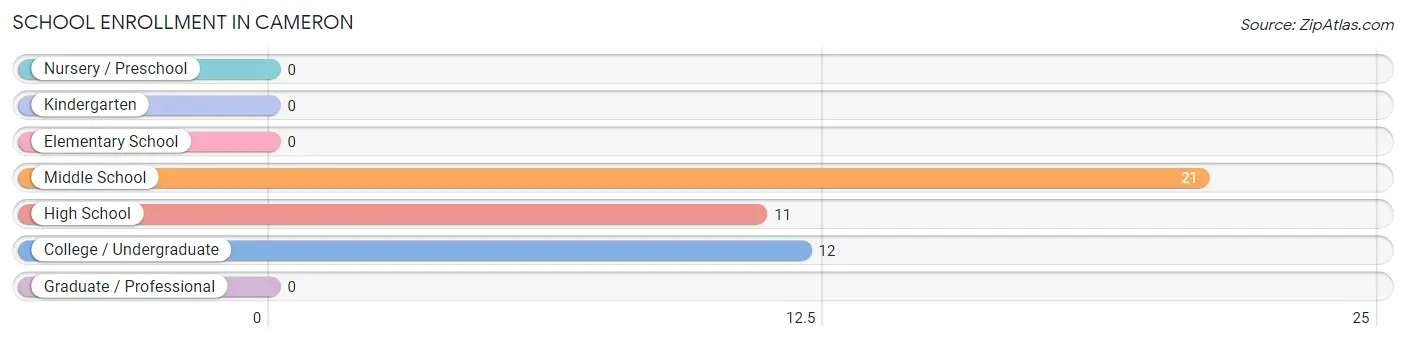
| School Level | # Students | % Students |
| Nursery / Preschool | 0 | 0.0% |
| Kindergarten | 0 | 0.0% |
| Elementary School | 0 | 0.0% |
| Middle School | 21 | 47.7% |
| High School | 11 | 25.0% |
| College / Undergraduate | 12 | 27.3% |
| Graduate / Professional | 0 | 0.0% |
| Total | 44 | 100.0% |
School Enrollment by Age by Funding Source in Cameron
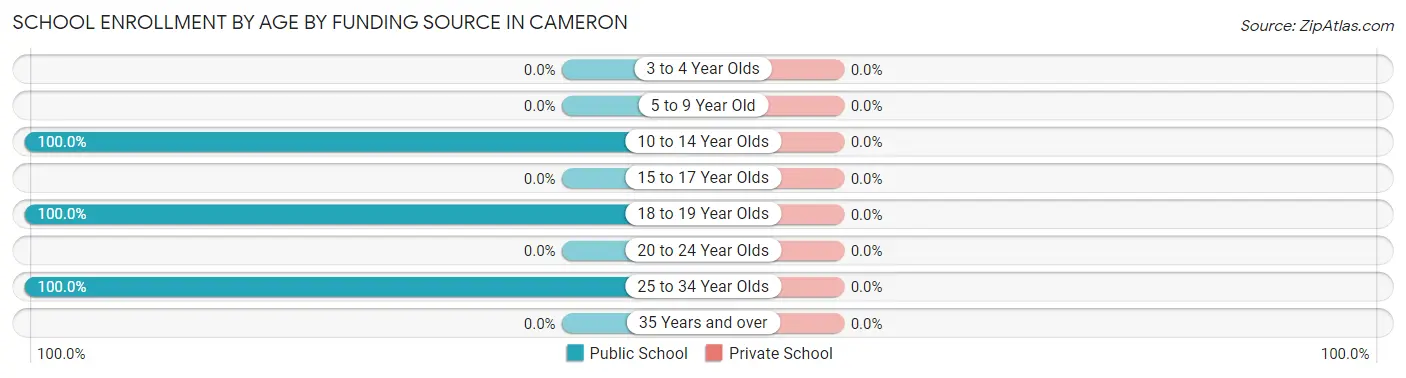
| Age Bracket | Public School | Private School |
| 3 to 4 Year Olds | 0 (0.0%) | 0 (0.0%) |
| 5 to 9 Year Old | 0 (0.0%) | 0 (0.0%) |
| 10 to 14 Year Olds | 21 (100.0%) | 0 (0.0%) |
| 15 to 17 Year Olds | 0 (0.0%) | 0 (0.0%) |
| 18 to 19 Year Olds | 11 (100.0%) | 0 (0.0%) |
| 20 to 24 Year Olds | 0 (0.0%) | 0 (0.0%) |
| 25 to 34 Year Olds | 12 (100.0%) | 0 (0.0%) |
| 35 Years and over | 0 (0.0%) | 0 (0.0%) |
| Total | 44 (100.0%) | 0 (0.0%) |
Educational Attainment by Field of Study in Cameron
Business (13 | 40.6%), education (11 | 34.4%), literature & languages (7 | 21.9%), and communications (1 | 3.1%) are the most common fields of study among 32 individuals in Cameron who have obtained a bachelor's degree or higher.
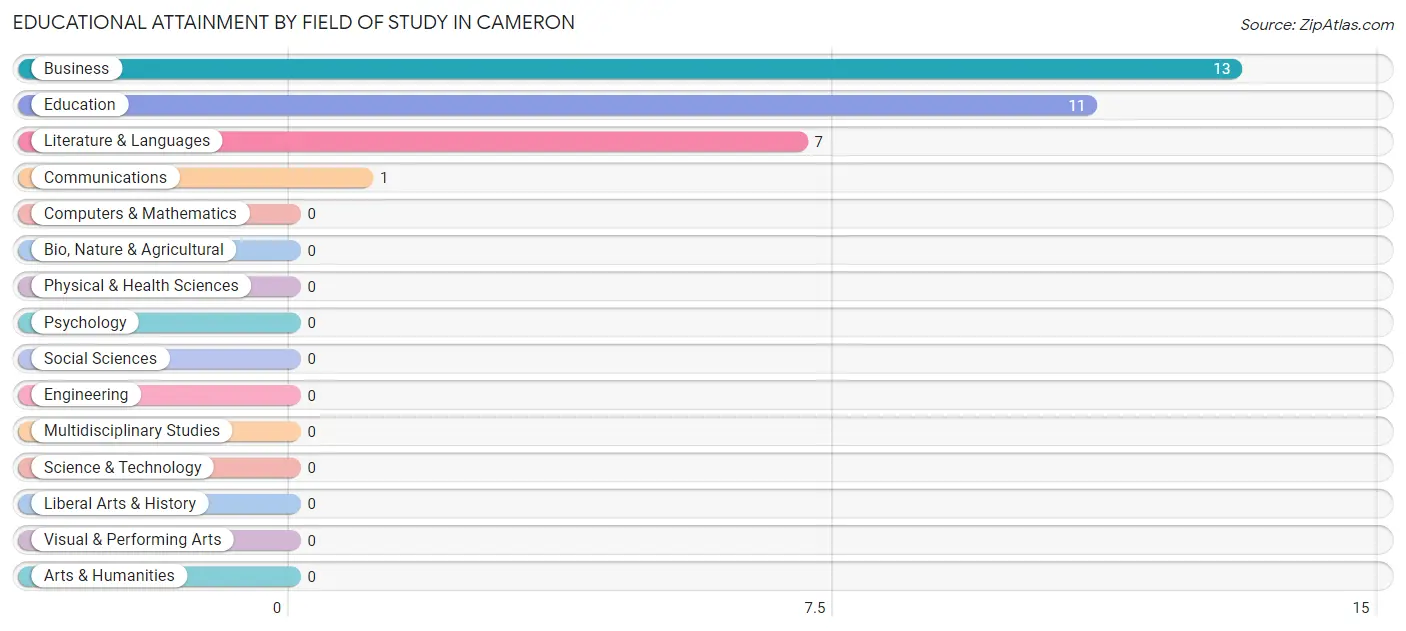
| Field of Study | # Graduates | % Graduates |
| Computers & Mathematics | 0 | 0.0% |
| Bio, Nature & Agricultural | 0 | 0.0% |
| Physical & Health Sciences | 0 | 0.0% |
| Psychology | 0 | 0.0% |
| Social Sciences | 0 | 0.0% |
| Engineering | 0 | 0.0% |
| Multidisciplinary Studies | 0 | 0.0% |
| Science & Technology | 0 | 0.0% |
| Business | 13 | 40.6% |
| Education | 11 | 34.4% |
| Literature & Languages | 7 | 21.9% |
| Liberal Arts & History | 0 | 0.0% |
| Visual & Performing Arts | 0 | 0.0% |
| Communications | 1 | 3.1% |
| Arts & Humanities | 0 | 0.0% |
| Total | 32 | 100.0% |
Transportation & Commute in Cameron
Vehicle Availability by Sex in Cameron
The most prevalent vehicle ownership categories in Cameron are males with 2 vehicles (29, accounting for 72.5%) and females with 2 vehicles (13, making up 100.0%).
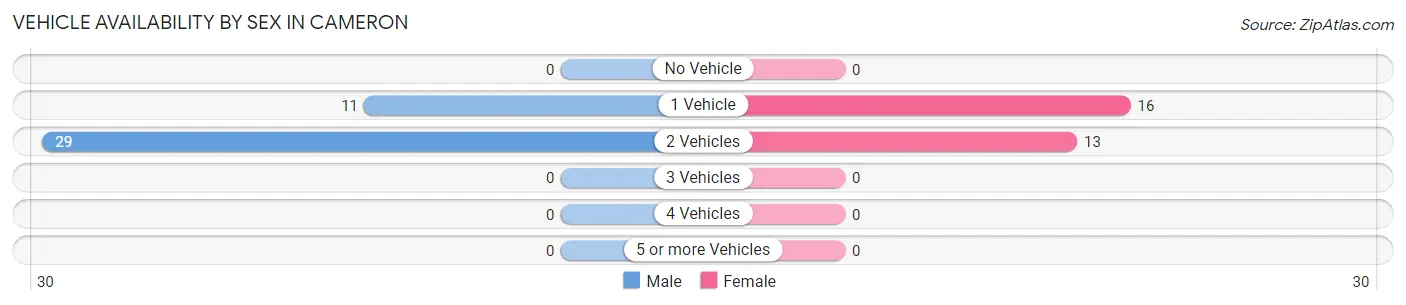
| Vehicles Available | Male | Female |
| No Vehicle | 0 (0.0%) | 0 (0.0%) |
| 1 Vehicle | 11 (27.5%) | 16 (55.2%) |
| 2 Vehicles | 29 (72.5%) | 13 (44.8%) |
| 3 Vehicles | 0 (0.0%) | 0 (0.0%) |
| 4 Vehicles | 0 (0.0%) | 0 (0.0%) |
| 5 or more Vehicles | 0 (0.0%) | 0 (0.0%) |
| Total | 40 (100.0%) | 29 (100.0%) |
Commute Time in Cameron
The most frequently occuring commute durations in Cameron are 5 to 9 minutes (30 commuters, 48.4%), 45 to 59 minutes (9 commuters, 14.5%), and 15 to 19 minutes (8 commuters, 12.9%).
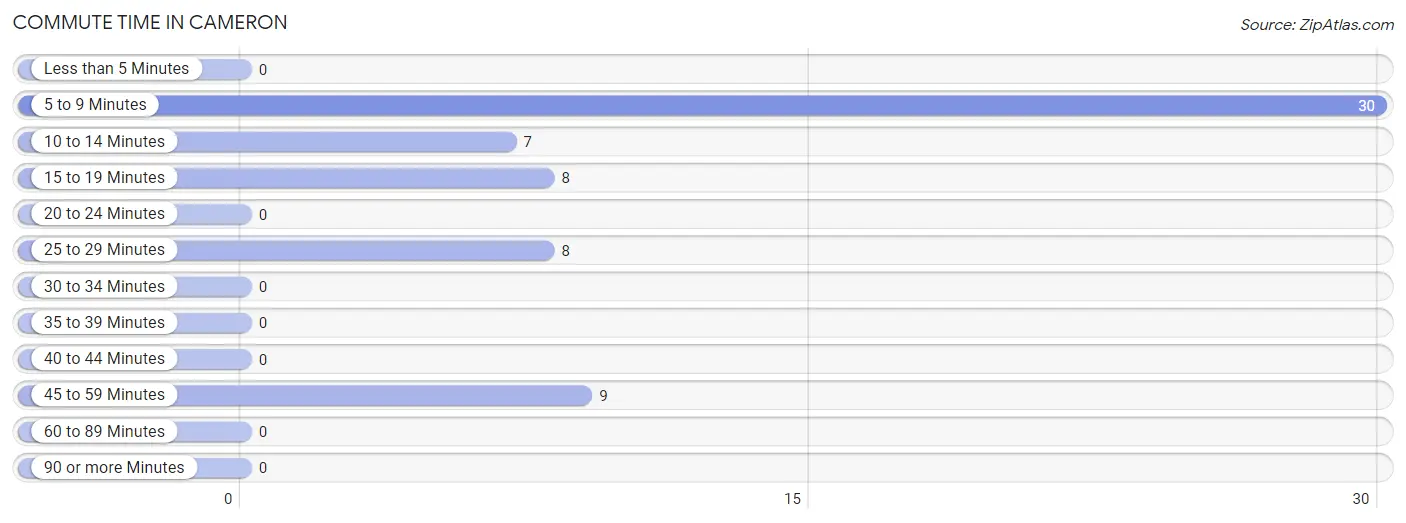
| Commute Time | # Commuters | % Commuters |
| Less than 5 Minutes | 0 | 0.0% |
| 5 to 9 Minutes | 30 | 48.4% |
| 10 to 14 Minutes | 7 | 11.3% |
| 15 to 19 Minutes | 8 | 12.9% |
| 20 to 24 Minutes | 0 | 0.0% |
| 25 to 29 Minutes | 8 | 12.9% |
| 30 to 34 Minutes | 0 | 0.0% |
| 35 to 39 Minutes | 0 | 0.0% |
| 40 to 44 Minutes | 0 | 0.0% |
| 45 to 59 Minutes | 9 | 14.5% |
| 60 to 89 Minutes | 0 | 0.0% |
| 90 or more Minutes | 0 | 0.0% |
Commute Time by Sex in Cameron
The most common commute times in Cameron are 5 to 9 minutes (25 commuters, 75.8%) for males and 45 to 59 minutes (9 commuters, 31.0%) for females.
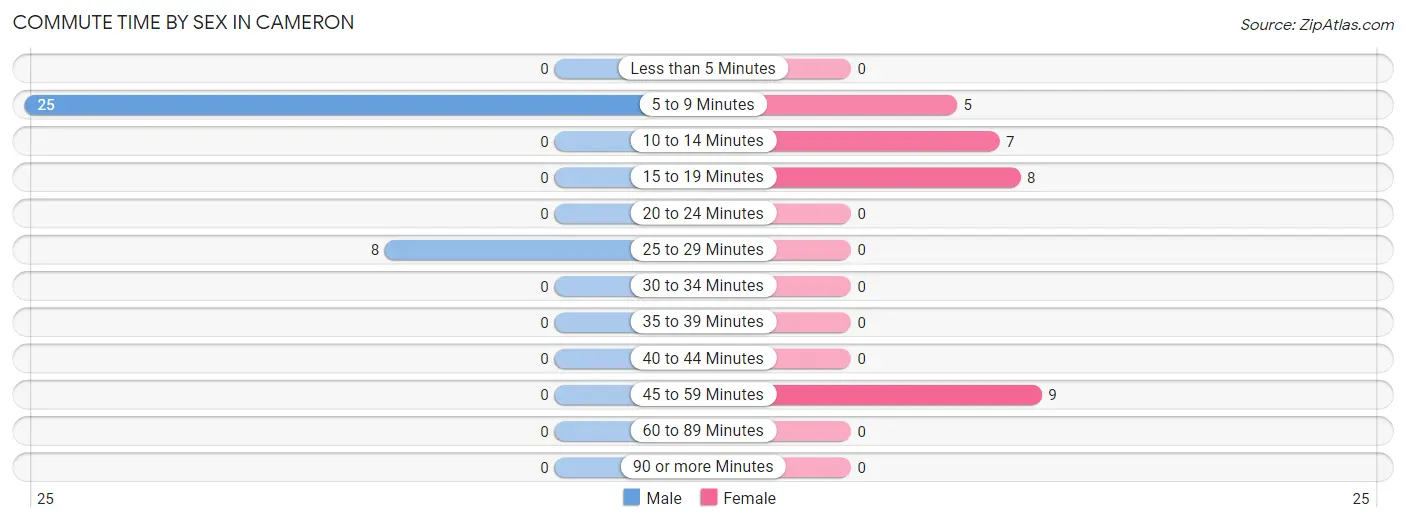
| Commute Time | Male | Female |
| Less than 5 Minutes | 0 (0.0%) | 0 (0.0%) |
| 5 to 9 Minutes | 25 (75.8%) | 5 (17.2%) |
| 10 to 14 Minutes | 0 (0.0%) | 7 (24.1%) |
| 15 to 19 Minutes | 0 (0.0%) | 8 (27.6%) |
| 20 to 24 Minutes | 0 (0.0%) | 0 (0.0%) |
| 25 to 29 Minutes | 8 (24.2%) | 0 (0.0%) |
| 30 to 34 Minutes | 0 (0.0%) | 0 (0.0%) |
| 35 to 39 Minutes | 0 (0.0%) | 0 (0.0%) |
| 40 to 44 Minutes | 0 (0.0%) | 0 (0.0%) |
| 45 to 59 Minutes | 0 (0.0%) | 9 (31.0%) |
| 60 to 89 Minutes | 0 (0.0%) | 0 (0.0%) |
| 90 or more Minutes | 0 (0.0%) | 0 (0.0%) |
Time of Departure to Work by Sex in Cameron
The most frequent times of departure to work in Cameron are 6:30 AM to 6:59 AM (25, 75.8%) for males and 6:30 AM to 6:59 AM (9, 31.0%) for females.
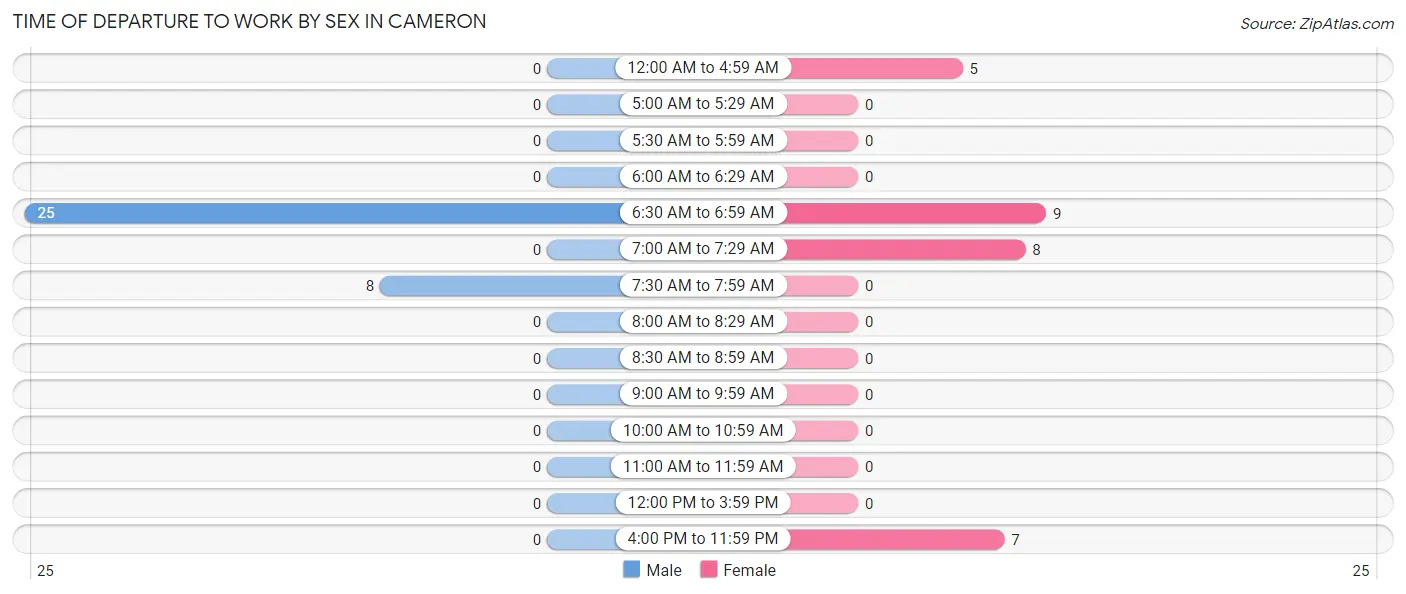
| Time of Departure | Male | Female |
| 12:00 AM to 4:59 AM | 0 (0.0%) | 5 (17.2%) |
| 5:00 AM to 5:29 AM | 0 (0.0%) | 0 (0.0%) |
| 5:30 AM to 5:59 AM | 0 (0.0%) | 0 (0.0%) |
| 6:00 AM to 6:29 AM | 0 (0.0%) | 0 (0.0%) |
| 6:30 AM to 6:59 AM | 25 (75.8%) | 9 (31.0%) |
| 7:00 AM to 7:29 AM | 0 (0.0%) | 8 (27.6%) |
| 7:30 AM to 7:59 AM | 8 (24.2%) | 0 (0.0%) |
| 8:00 AM to 8:29 AM | 0 (0.0%) | 0 (0.0%) |
| 8:30 AM to 8:59 AM | 0 (0.0%) | 0 (0.0%) |
| 9:00 AM to 9:59 AM | 0 (0.0%) | 0 (0.0%) |
| 10:00 AM to 10:59 AM | 0 (0.0%) | 0 (0.0%) |
| 11:00 AM to 11:59 AM | 0 (0.0%) | 0 (0.0%) |
| 12:00 PM to 3:59 PM | 0 (0.0%) | 0 (0.0%) |
| 4:00 PM to 11:59 PM | 0 (0.0%) | 7 (24.1%) |
| Total | 33 (100.0%) | 29 (100.0%) |
Housing Occupancy in Cameron
Occupancy by Ownership in Cameron
Of the total 70 dwellings in Cameron, owner-occupied units account for 70 (100.0%), while renter-occupied units make up 0 (0.0%).
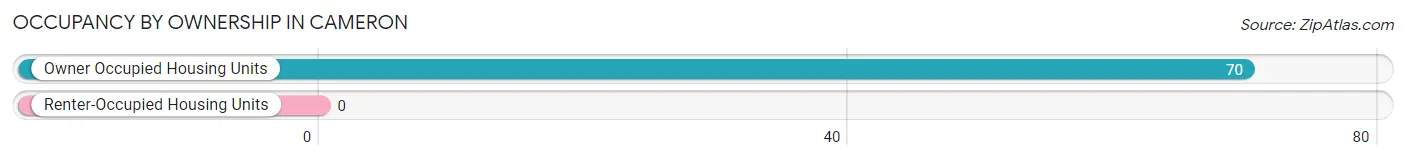
| Occupancy | # Housing Units | % Housing Units |
| Owner Occupied Housing Units | 70 | 100.0% |
| Renter-Occupied Housing Units | 0 | 0.0% |
| Total Occupied Housing Units | 70 | 100.0% |
Occupancy by Household Size in Cameron
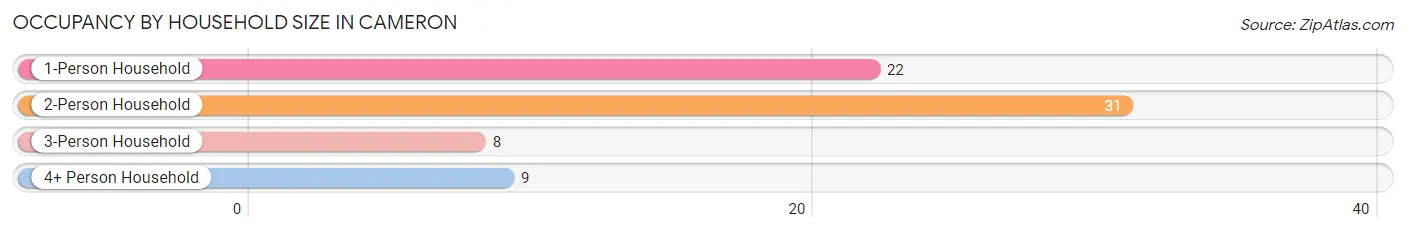
| Household Size | # Housing Units | % Housing Units |
| 1-Person Household | 22 | 31.4% |
| 2-Person Household | 31 | 44.3% |
| 3-Person Household | 8 | 11.4% |
| 4+ Person Household | 9 | 12.9% |
| Total Housing Units | 70 | 100.0% |
Occupancy by Ownership by Household Size in Cameron
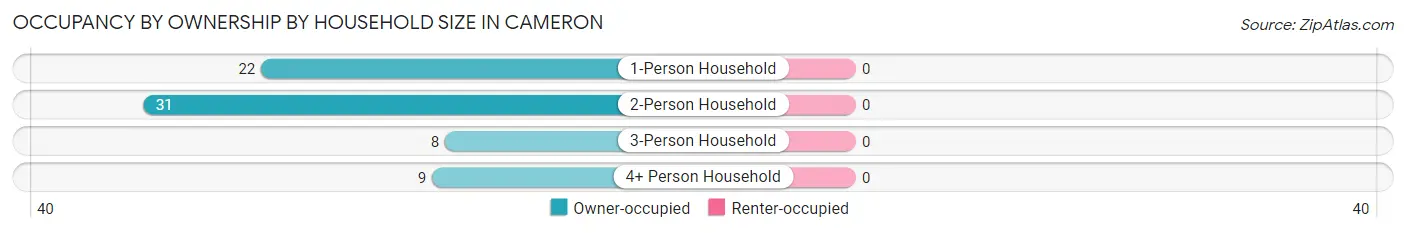
| Household Size | Owner-occupied | Renter-occupied |
| 1-Person Household | 22 (100.0%) | 0 (0.0%) |
| 2-Person Household | 31 (100.0%) | 0 (0.0%) |
| 3-Person Household | 8 (100.0%) | 0 (0.0%) |
| 4+ Person Household | 9 (100.0%) | 0 (0.0%) |
| Total Housing Units | 70 (100.0%) | 0 (0.0%) |
Occupancy by Educational Attainment in Cameron
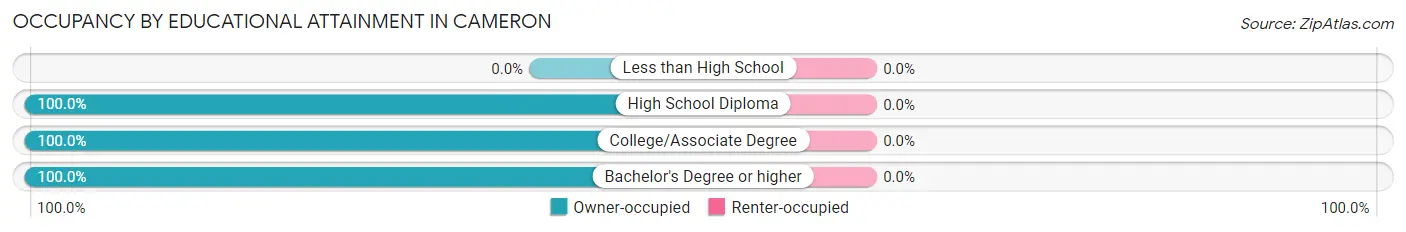
| Household Size | Owner-occupied | Renter-occupied |
| Less than High School | 0 (0.0%) | 0 (0.0%) |
| High School Diploma | 30 (100.0%) | 0 (0.0%) |
| College/Associate Degree | 20 (100.0%) | 0 (0.0%) |
| Bachelor's Degree or higher | 20 (100.0%) | 0 (0.0%) |
Occupancy by Age of Householder in Cameron
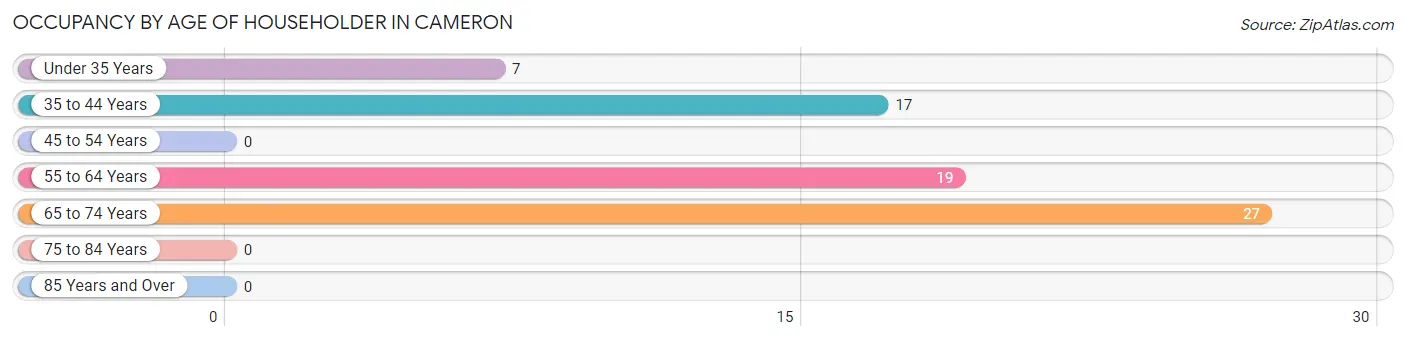
| Age Bracket | # Households | % Households |
| Under 35 Years | 7 | 10.0% |
| 35 to 44 Years | 17 | 24.3% |
| 45 to 54 Years | 0 | 0.0% |
| 55 to 64 Years | 19 | 27.1% |
| 65 to 74 Years | 27 | 38.6% |
| 75 to 84 Years | 0 | 0.0% |
| 85 Years and Over | 0 | 0.0% |
| Total | 70 | 100.0% |
Housing Finances in Cameron
Median Income by Occupancy in Cameron
| Occupancy Type | # Households | Median Income |
| Owner-Occupied | 70 (100.0%) | $0 |
| Renter-Occupied | 0 (0.0%) | $0 |
| Average | 70 (100.0%) | $0 |
Occupancy by Householder Income Bracket in Cameron
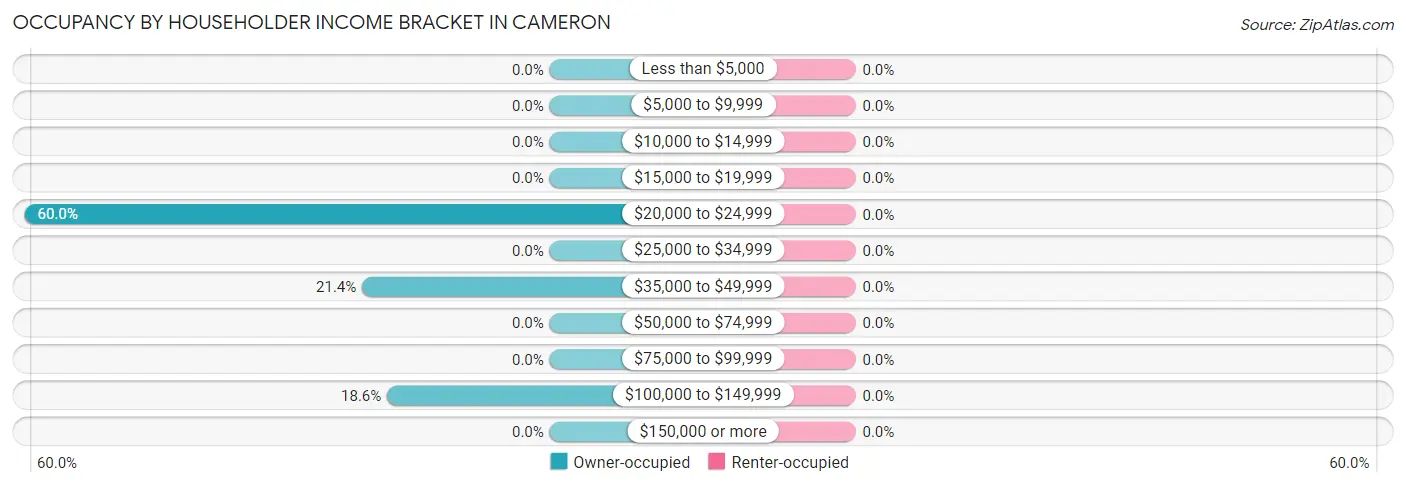
| Income Bracket | Owner-occupied | Renter-occupied |
| Less than $5,000 | 0 (0.0%) | 0 (0.0%) |
| $5,000 to $9,999 | 0 (0.0%) | 0 (0.0%) |
| $10,000 to $14,999 | 0 (0.0%) | 0 (0.0%) |
| $15,000 to $19,999 | 0 (0.0%) | 0 (0.0%) |
| $20,000 to $24,999 | 42 (60.0%) | 0 (0.0%) |
| $25,000 to $34,999 | 0 (0.0%) | 0 (0.0%) |
| $35,000 to $49,999 | 15 (21.4%) | 0 (0.0%) |
| $50,000 to $74,999 | 0 (0.0%) | 0 (0.0%) |
| $75,000 to $99,999 | 0 (0.0%) | 0 (0.0%) |
| $100,000 to $149,999 | 13 (18.6%) | 0 (0.0%) |
| $150,000 or more | 0 (0.0%) | 0 (0.0%) |
| Total | 70 (100.0%) | 0 (0.0%) |
Monthly Housing Cost Tiers in Cameron
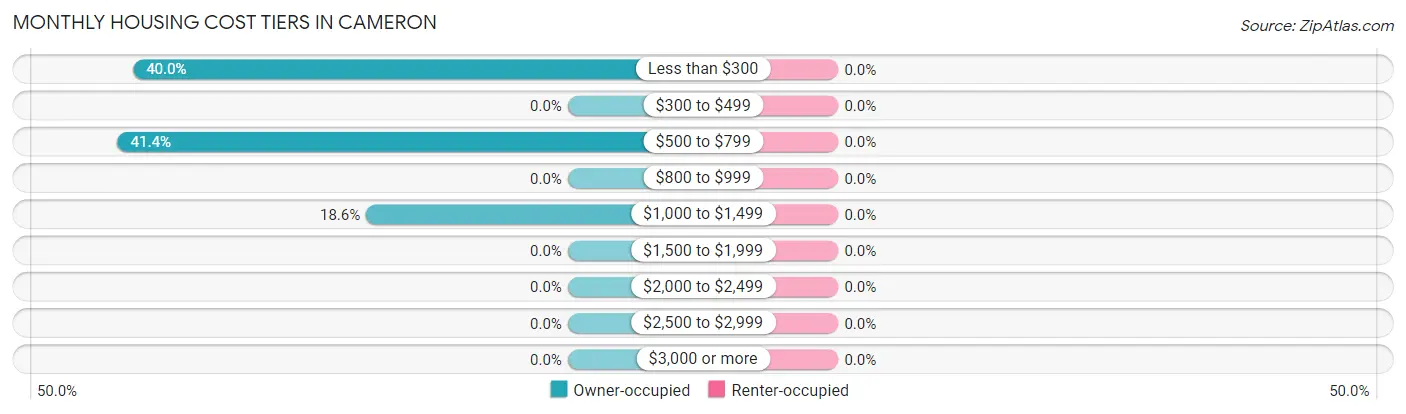
| Monthly Cost | Owner-occupied | Renter-occupied |
| Less than $300 | 28 (40.0%) | 0 (0.0%) |
| $300 to $499 | 0 (0.0%) | 0 (0.0%) |
| $500 to $799 | 29 (41.4%) | 0 (0.0%) |
| $800 to $999 | 0 (0.0%) | 0 (0.0%) |
| $1,000 to $1,499 | 13 (18.6%) | 0 (0.0%) |
| $1,500 to $1,999 | 0 (0.0%) | 0 (0.0%) |
| $2,000 to $2,499 | 0 (0.0%) | 0 (0.0%) |
| $2,500 to $2,999 | 0 (0.0%) | 0 (0.0%) |
| $3,000 or more | 0 (0.0%) | 0 (0.0%) |
| Total | 70 (100.0%) | 0 (0.0%) |
Physical Housing Characteristics in Cameron
Housing Structures in Cameron
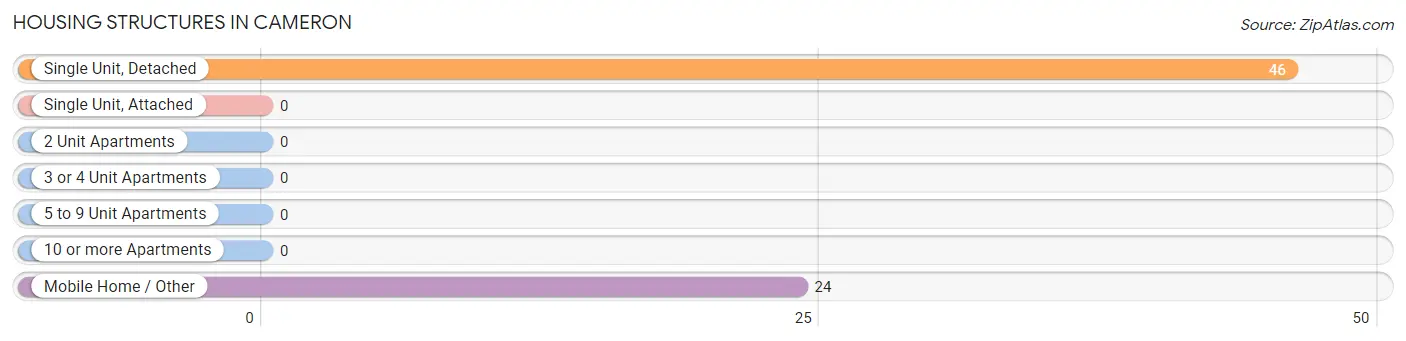
| Structure Type | # Housing Units | % Housing Units |
| Single Unit, Detached | 46 | 65.7% |
| Single Unit, Attached | 0 | 0.0% |
| 2 Unit Apartments | 0 | 0.0% |
| 3 or 4 Unit Apartments | 0 | 0.0% |
| 5 to 9 Unit Apartments | 0 | 0.0% |
| 10 or more Apartments | 0 | 0.0% |
| Mobile Home / Other | 24 | 34.3% |
| Total | 70 | 100.0% |
Housing Structures by Occupancy in Cameron
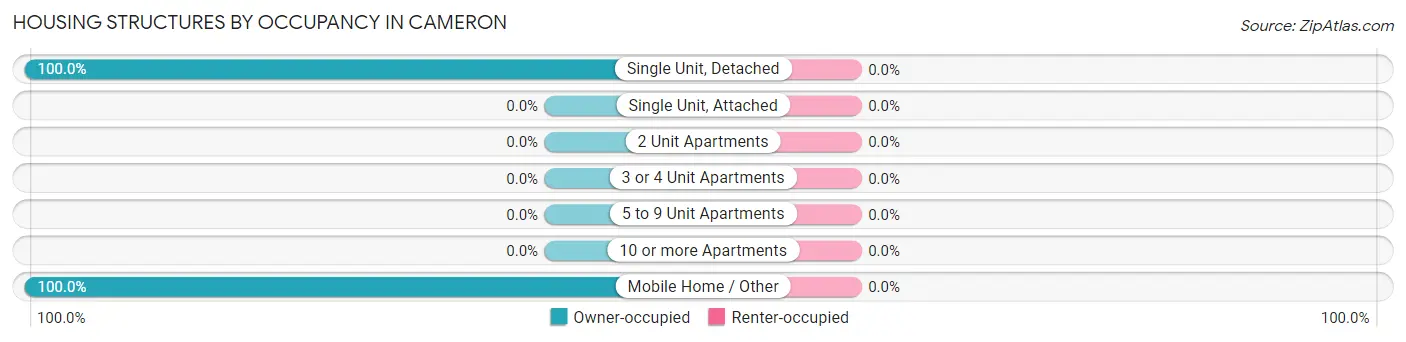
| Structure Type | Owner-occupied | Renter-occupied |
| Single Unit, Detached | 46 (100.0%) | 0 (0.0%) |
| Single Unit, Attached | 0 (0.0%) | 0 (0.0%) |
| 2 Unit Apartments | 0 (0.0%) | 0 (0.0%) |
| 3 or 4 Unit Apartments | 0 (0.0%) | 0 (0.0%) |
| 5 to 9 Unit Apartments | 0 (0.0%) | 0 (0.0%) |
| 10 or more Apartments | 0 (0.0%) | 0 (0.0%) |
| Mobile Home / Other | 24 (100.0%) | 0 (0.0%) |
| Total | 70 (100.0%) | 0 (0.0%) |
Housing Structures by Number of Rooms in Cameron
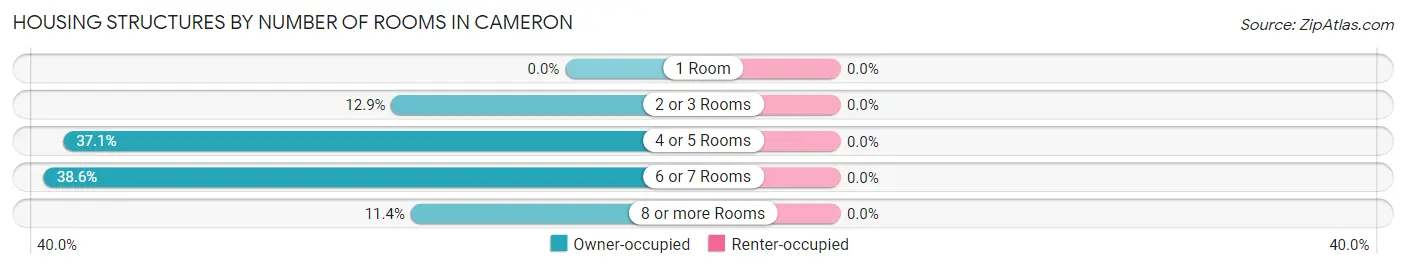
| Number of Rooms | Owner-occupied | Renter-occupied |
| 1 Room | 0 (0.0%) | 0 (0.0%) |
| 2 or 3 Rooms | 9 (12.9%) | 0 (0.0%) |
| 4 or 5 Rooms | 26 (37.1%) | 0 (0.0%) |
| 6 or 7 Rooms | 27 (38.6%) | 0 (0.0%) |
| 8 or more Rooms | 8 (11.4%) | 0 (0.0%) |
| Total | 70 (100.0%) | 0 (0.0%) |
Housing Structure by Heating Type in Cameron
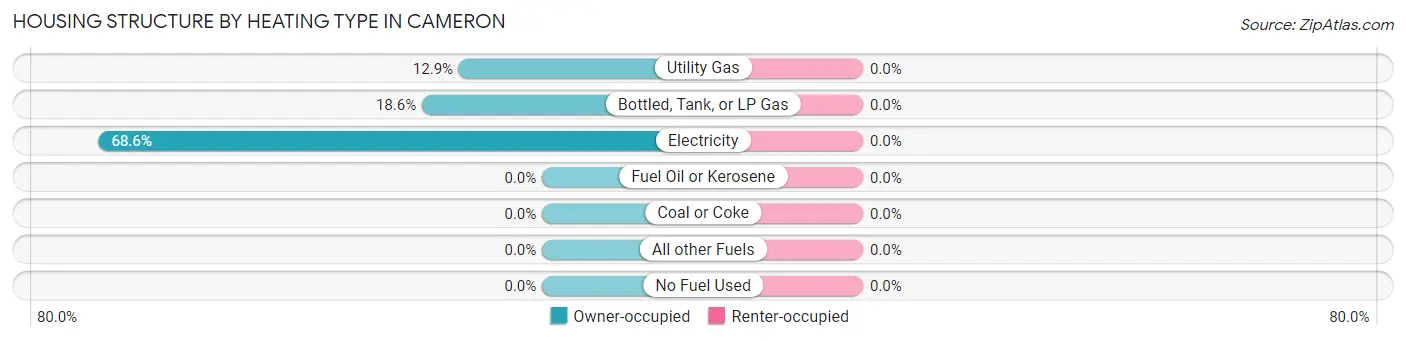
| Heating Type | Owner-occupied | Renter-occupied |
| Utility Gas | 9 (12.9%) | 0 (0.0%) |
| Bottled, Tank, or LP Gas | 13 (18.6%) | 0 (0.0%) |
| Electricity | 48 (68.6%) | 0 (0.0%) |
| Fuel Oil or Kerosene | 0 (0.0%) | 0 (0.0%) |
| Coal or Coke | 0 (0.0%) | 0 (0.0%) |
| All other Fuels | 0 (0.0%) | 0 (0.0%) |
| No Fuel Used | 0 (0.0%) | 0 (0.0%) |
| Total | 70 (100.0%) | 0 (0.0%) |
Household Vehicle Usage in Cameron
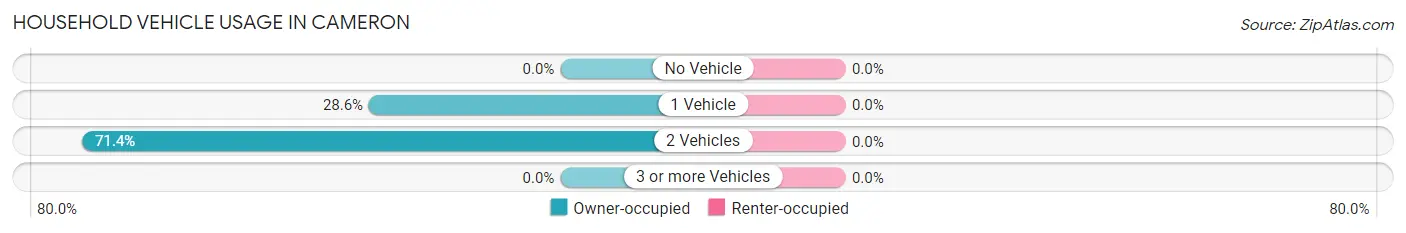
| Vehicles per Household | Owner-occupied | Renter-occupied |
| No Vehicle | 0 (0.0%) | 0 (0.0%) |
| 1 Vehicle | 20 (28.6%) | 0 (0.0%) |
| 2 Vehicles | 50 (71.4%) | 0 (0.0%) |
| 3 or more Vehicles | 0 (0.0%) | 0 (0.0%) |
| Total | 70 (100.0%) | 0 (0.0%) |
Real Estate & Mortgages in Cameron
Real Estate and Mortgage Overview in Cameron
| Characteristic | Without Mortgage | With Mortgage |
| Housing Units | 55 | 15 |
| Median Property Value | - | - |
| Median Household Income | - | - |
| Monthly Housing Costs | - | - |
| Real Estate Taxes | - | - |
Property Value by Mortgage Status in Cameron
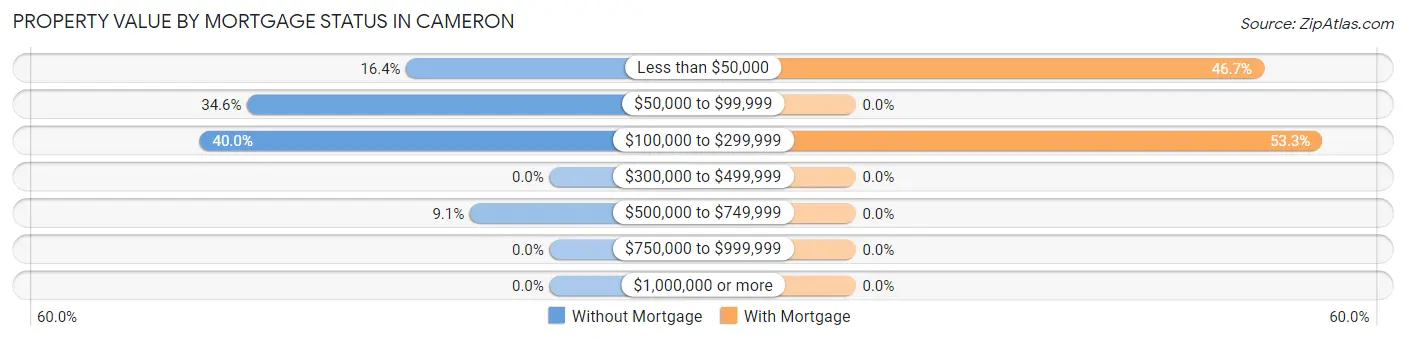
| Property Value | Without Mortgage | With Mortgage |
| Less than $50,000 | 9 (16.4%) | 7 (46.7%) |
| $50,000 to $99,999 | 19 (34.5%) | 0 (0.0%) |
| $100,000 to $299,999 | 22 (40.0%) | 8 (53.3%) |
| $300,000 to $499,999 | 0 (0.0%) | 0 (0.0%) |
| $500,000 to $749,999 | 5 (9.1%) | 0 (0.0%) |
| $750,000 to $999,999 | 0 (0.0%) | 0 (0.0%) |
| $1,000,000 or more | 0 (0.0%) | 0 (0.0%) |
| Total | 55 (100.0%) | 15 (100.0%) |
Household Income by Mortgage Status in Cameron
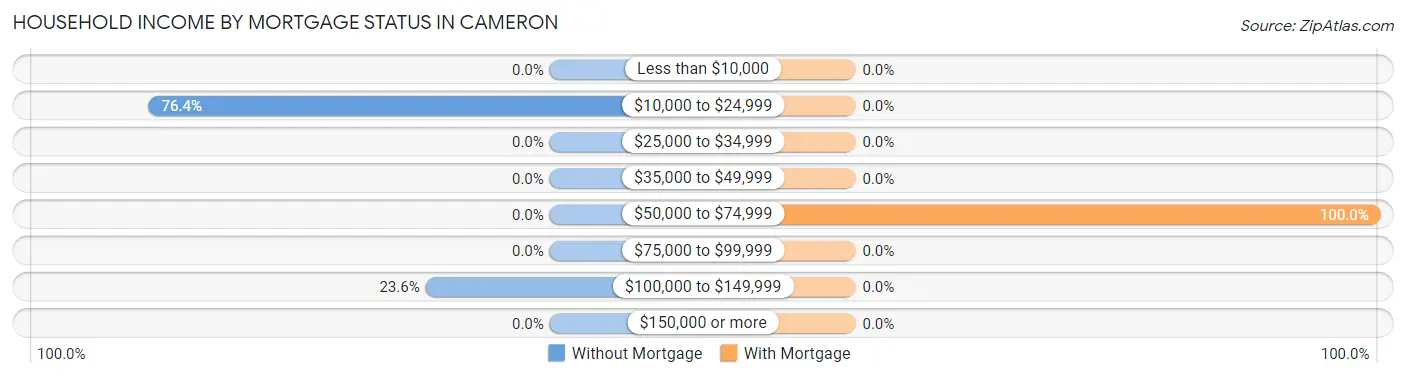
| Household Income | Without Mortgage | With Mortgage |
| Less than $10,000 | 0 (0.0%) | 0 (0.0%) |
| $10,000 to $24,999 | 42 (76.4%) | 0 (0.0%) |
| $25,000 to $34,999 | 0 (0.0%) | 0 (0.0%) |
| $35,000 to $49,999 | 0 (0.0%) | 0 (0.0%) |
| $50,000 to $74,999 | 0 (0.0%) | 15 (100.0%) |
| $75,000 to $99,999 | 0 (0.0%) | 0 (0.0%) |
| $100,000 to $149,999 | 13 (23.6%) | 0 (0.0%) |
| $150,000 or more | 0 (0.0%) | 0 (0.0%) |
| Total | 55 (100.0%) | 15 (100.0%) |
Property Value to Household Income Ratio in Cameron
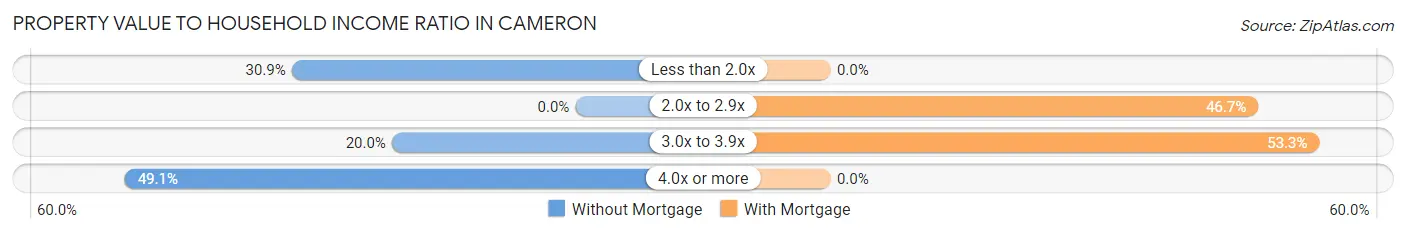
| Value-to-Income Ratio | Without Mortgage | With Mortgage |
| Less than 2.0x | 17 (30.9%) | 0 (0.0%) |
| 2.0x to 2.9x | 0 (0.0%) | 7 (46.7%) |
| 3.0x to 3.9x | 11 (20.0%) | 8 (53.3%) |
| 4.0x or more | 27 (49.1%) | 0 (0.0%) |
| Total | 55 (100.0%) | 15 (100.0%) |
Real Estate Taxes by Mortgage Status in Cameron
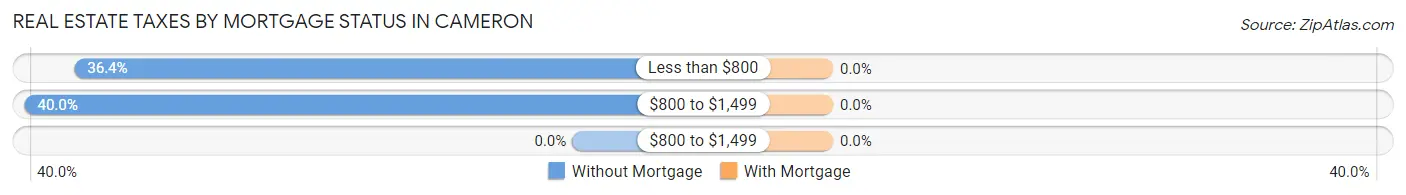
| Property Taxes | Without Mortgage | With Mortgage |
| Less than $800 | 20 (36.4%) | 0 (0.0%) |
| $800 to $1,499 | 22 (40.0%) | 0 (0.0%) |
| $800 to $1,499 | 0 (0.0%) | 0 (0.0%) |
| Total | 55 (100.0%) | 15 (100.0%) |
Health & Disability in Cameron
Health Insurance Coverage by Age in Cameron
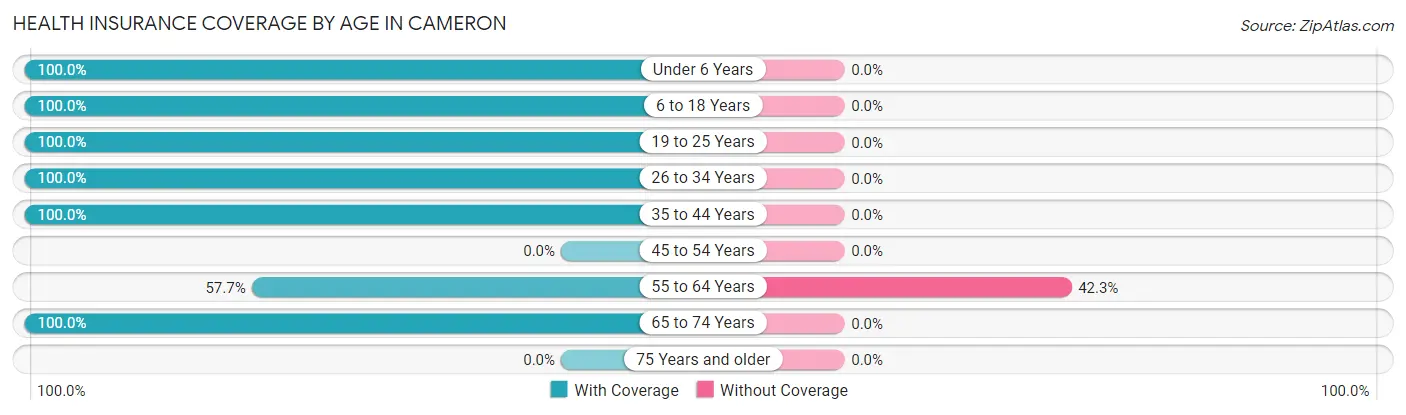
| Age Bracket | With Coverage | Without Coverage |
| Under 6 Years | 11 (100.0%) | 0 (0.0%) |
| 6 to 18 Years | 32 (100.0%) | 0 (0.0%) |
| 19 to 25 Years | 7 (100.0%) | 0 (0.0%) |
| 26 to 34 Years | 12 (100.0%) | 0 (0.0%) |
| 35 to 44 Years | 47 (100.0%) | 0 (0.0%) |
| 45 to 54 Years | 0 (0.0%) | 0 (0.0%) |
| 55 to 64 Years | 15 (57.7%) | 11 (42.3%) |
| 65 to 74 Years | 33 (100.0%) | 0 (0.0%) |
| 75 Years and older | 0 (0.0%) | 0 (0.0%) |
| Total | 157 (93.4%) | 11 (6.6%) |
Health Insurance Coverage by Citizenship Status in Cameron
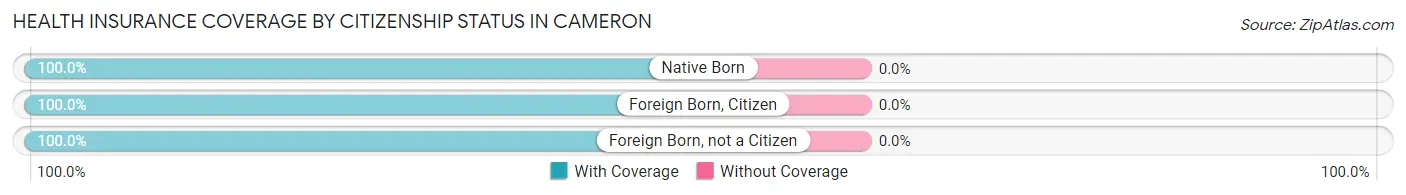
| Citizenship Status | With Coverage | Without Coverage |
| Native Born | 11 (100.0%) | 0 (0.0%) |
| Foreign Born, Citizen | 32 (100.0%) | 0 (0.0%) |
| Foreign Born, not a Citizen | 7 (100.0%) | 0 (0.0%) |
Health Insurance Coverage by Household Income in Cameron
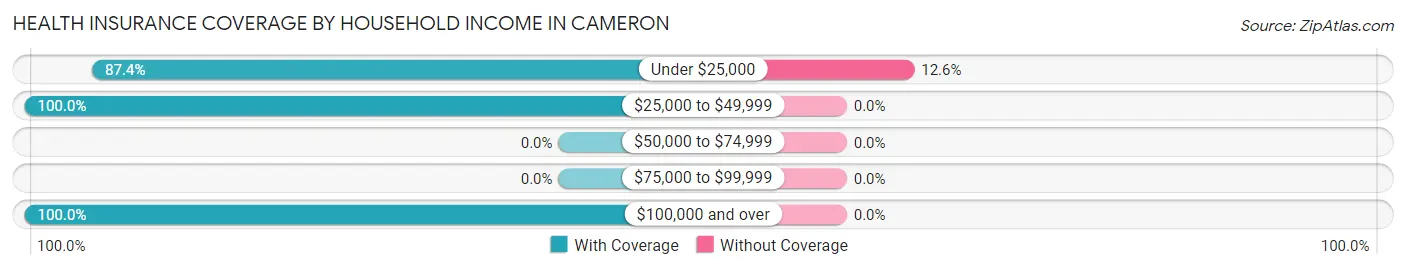
| Household Income | With Coverage | Without Coverage |
| Under $25,000 | 76 (87.4%) | 11 (12.6%) |
| $25,000 to $49,999 | 27 (100.0%) | 0 (0.0%) |
| $50,000 to $74,999 | 0 (0.0%) | 0 (0.0%) |
| $75,000 to $99,999 | 0 (0.0%) | 0 (0.0%) |
| $100,000 and over | 54 (100.0%) | 0 (0.0%) |
Public vs Private Health Insurance Coverage by Age in Cameron
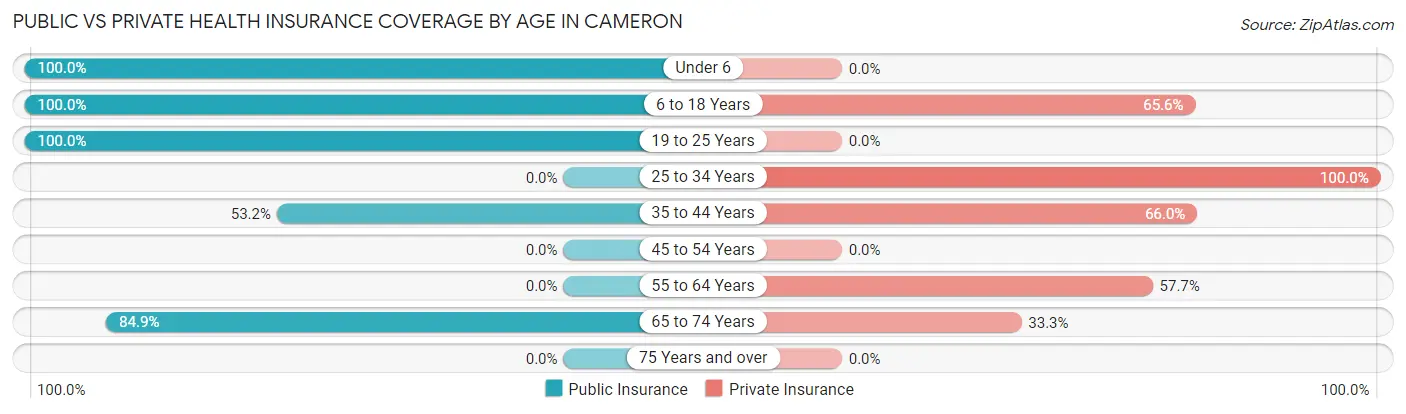
| Age Bracket | Public Insurance | Private Insurance |
| Under 6 | 11 (100.0%) | 0 (0.0%) |
| 6 to 18 Years | 32 (100.0%) | 21 (65.6%) |
| 19 to 25 Years | 7 (100.0%) | 0 (0.0%) |
| 25 to 34 Years | 0 (0.0%) | 12 (100.0%) |
| 35 to 44 Years | 25 (53.2%) | 31 (66.0%) |
| 45 to 54 Years | 0 (0.0%) | 0 (0.0%) |
| 55 to 64 Years | 0 (0.0%) | 15 (57.7%) |
| 65 to 74 Years | 28 (84.9%) | 11 (33.3%) |
| 75 Years and over | 0 (0.0%) | 0 (0.0%) |
| Total | 103 (61.3%) | 90 (53.6%) |
Disability Status by Sex by Age in Cameron
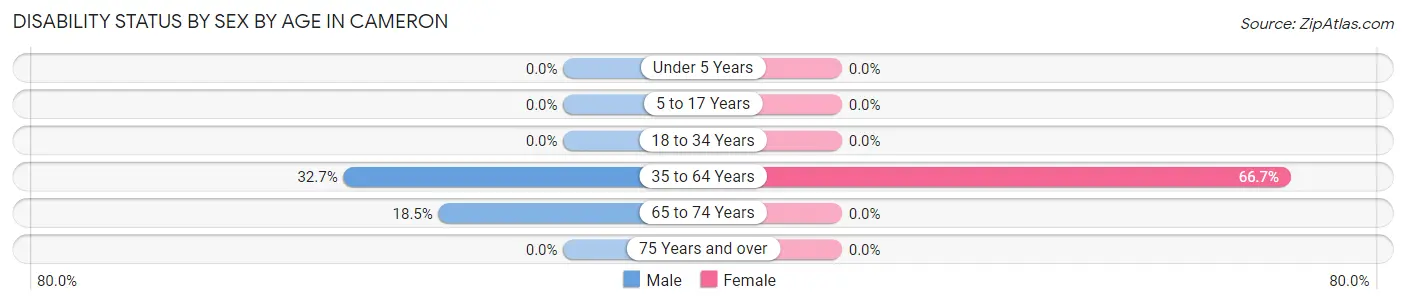
| Age Bracket | Male | Female |
| Under 5 Years | 0 (0.0%) | 0 (0.0%) |
| 5 to 17 Years | 0 (0.0%) | 0 (0.0%) |
| 18 to 34 Years | 0 (0.0%) | 0 (0.0%) |
| 35 to 64 Years | 16 (32.7%) | 16 (66.7%) |
| 65 to 74 Years | 5 (18.5%) | 0 (0.0%) |
| 75 Years and over | 0 (0.0%) | 0 (0.0%) |
Disability Class by Sex by Age in Cameron
Disability Class: Hearing Difficulty
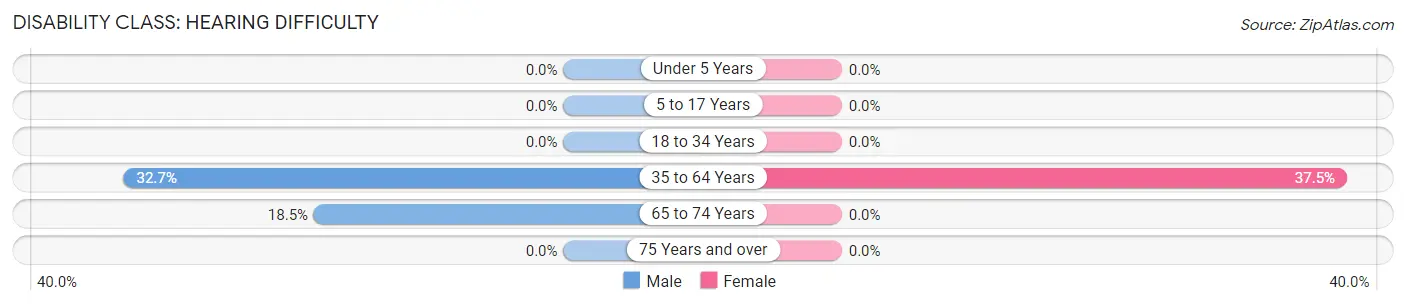
| Age Bracket | Male | Female |
| Under 5 Years | 0 (0.0%) | 0 (0.0%) |
| 5 to 17 Years | 0 (0.0%) | 0 (0.0%) |
| 18 to 34 Years | 0 (0.0%) | 0 (0.0%) |
| 35 to 64 Years | 16 (32.7%) | 9 (37.5%) |
| 65 to 74 Years | 5 (18.5%) | 0 (0.0%) |
| 75 Years and over | 0 (0.0%) | 0 (0.0%) |
Disability Class: Vision Difficulty
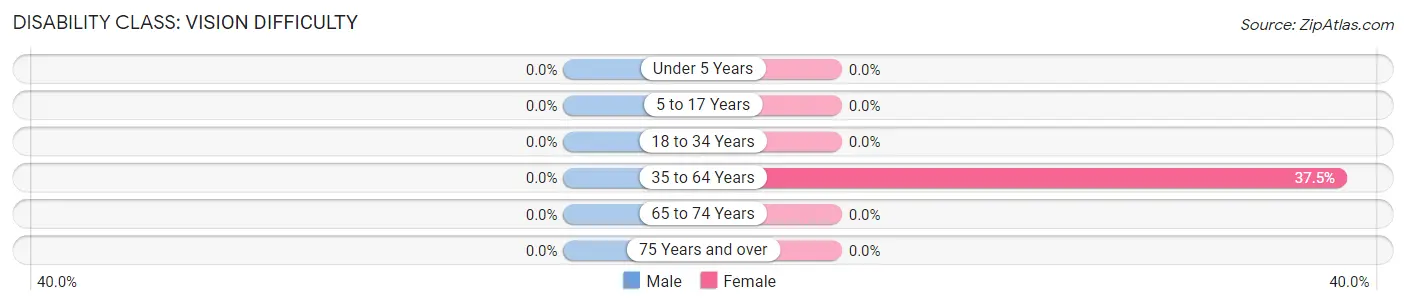
| Age Bracket | Male | Female |
| Under 5 Years | 0 (0.0%) | 0 (0.0%) |
| 5 to 17 Years | 0 (0.0%) | 0 (0.0%) |
| 18 to 34 Years | 0 (0.0%) | 0 (0.0%) |
| 35 to 64 Years | 0 (0.0%) | 9 (37.5%) |
| 65 to 74 Years | 0 (0.0%) | 0 (0.0%) |
| 75 Years and over | 0 (0.0%) | 0 (0.0%) |
Disability Class: Cognitive Difficulty
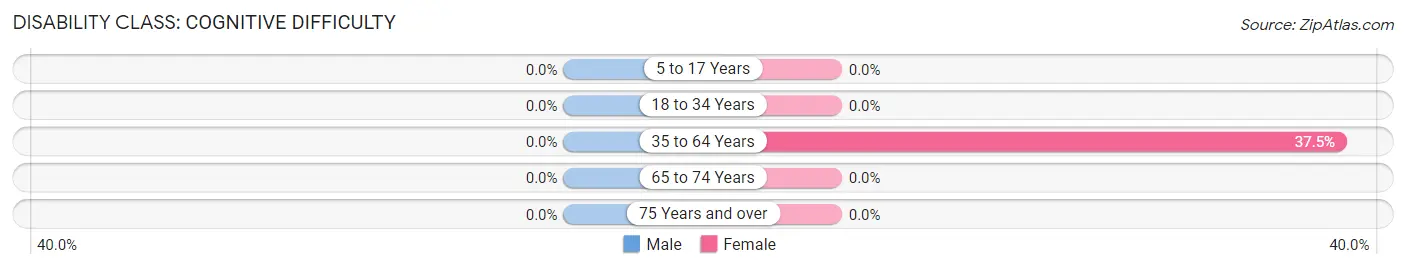
| Age Bracket | Male | Female |
| 5 to 17 Years | 0 (0.0%) | 0 (0.0%) |
| 18 to 34 Years | 0 (0.0%) | 0 (0.0%) |
| 35 to 64 Years | 0 (0.0%) | 9 (37.5%) |
| 65 to 74 Years | 0 (0.0%) | 0 (0.0%) |
| 75 Years and over | 0 (0.0%) | 0 (0.0%) |
Disability Class: Ambulatory Difficulty
| Age Bracket | Male | Female |
| 5 to 17 Years | 0 (0.0%) | 0 (0.0%) |
| 18 to 34 Years | 0 (0.0%) | 0 (0.0%) |
| 35 to 64 Years | 0 (0.0%) | 0 (0.0%) |
| 65 to 74 Years | 0 (0.0%) | 0 (0.0%) |
| 75 Years and over | 0 (0.0%) | 0 (0.0%) |
Disability Class: Self-Care Difficulty
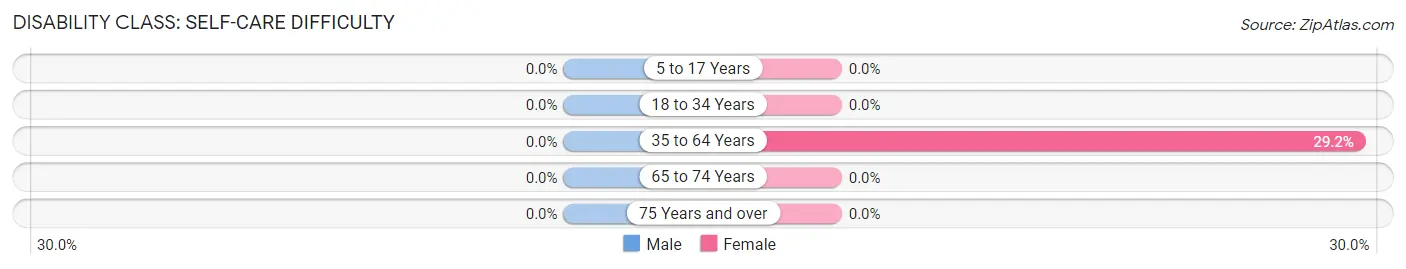
| Age Bracket | Male | Female |
| 5 to 17 Years | 0 (0.0%) | 0 (0.0%) |
| 18 to 34 Years | 0 (0.0%) | 0 (0.0%) |
| 35 to 64 Years | 0 (0.0%) | 7 (29.2%) |
| 65 to 74 Years | 0 (0.0%) | 0 (0.0%) |
| 75 Years and over | 0 (0.0%) | 0 (0.0%) |
Technology Access in Cameron
Computing Device Access in Cameron
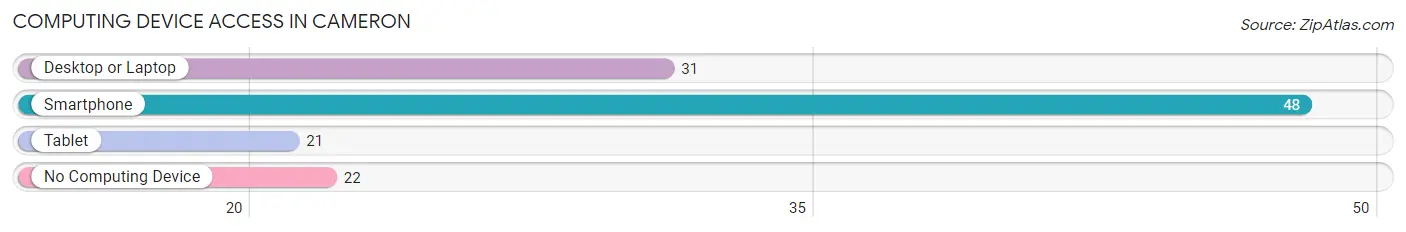
| Device Type | # Households | % Households |
| Desktop or Laptop | 31 | 44.3% |
| Smartphone | 48 | 68.6% |
| Tablet | 21 | 30.0% |
| No Computing Device | 22 | 31.4% |
| Total | 70 | 100.0% |
Internet Access in Cameron
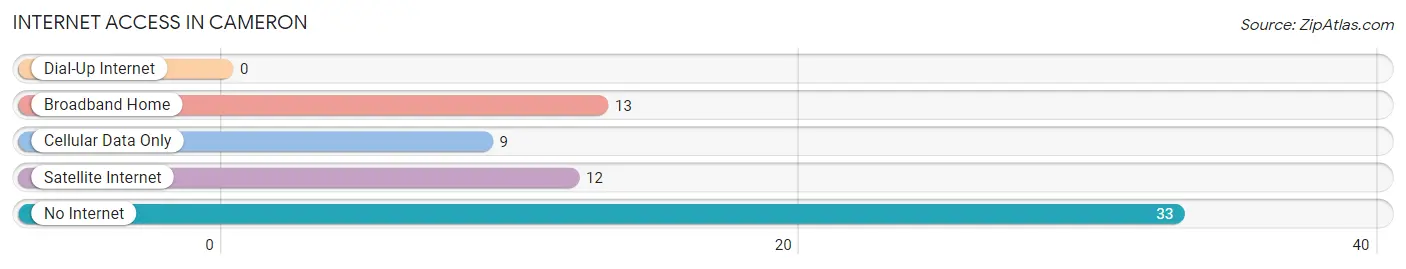
| Internet Type | # Households | % Households |
| Dial-Up Internet | 0 | 0.0% |
| Broadband Home | 13 | 18.6% |
| Cellular Data Only | 9 | 12.9% |
| Satellite Internet | 12 | 17.1% |
| No Internet | 33 | 47.1% |
| Total | 70 | 100.0% |
Cameron Summary
Cameron, Louisiana is a small town located in the southwestern corner of the state, in Cameron Parish. It is situated on the Gulf of Mexico, and is bordered by the Calcasieu River to the north and the Sabine River to the east. The town has a population of approximately 2,000 people, and is the parish seat of Cameron Parish.
History
Cameron was founded in 1845 by a group of settlers from the nearby town of Grand Chenier. The town was named after the nearby Cameron Prairie, which was named after a local Native American chief. The town was originally a small fishing village, and the main industry was shrimping. In the late 19th century, the town began to grow as the oil and gas industry began to develop in the area. The town was incorporated in 1901, and the first mayor was elected in 1902.
In the early 20th century, the town began to experience a period of growth and prosperity. The oil and gas industry continued to expand, and the town became a center for the industry. The town also became a popular tourist destination, and many people came to visit the nearby beaches and enjoy the local seafood.
In the late 20th century, the town began to experience a period of decline. The oil and gas industry began to decline, and the town's population began to decrease. In the early 21st century, the town began to experience a period of revitalization. The town has become a popular destination for tourists, and the local economy has begun to diversify.
Geography
Cameron is located in the southwestern corner of Louisiana, in Cameron Parish. The town is situated on the Gulf of Mexico, and is bordered by the Calcasieu River to the north and the Sabine River to the east. The town is located approximately 30 miles south of Lake Charles, and is approximately 50 miles east of Beaumont, Texas.
The town is located in a flat, marshy area, and is surrounded by wetlands and bayous. The town is located in a humid subtropical climate, and experiences hot, humid summers and mild winters. The average annual temperature is approximately 70 degrees Fahrenheit, and the average annual precipitation is approximately 50 inches.
Economy
The economy of Cameron is largely based on the oil and gas industry. The town is home to several oil and gas companies, and the industry is the main source of employment in the area. The town is also home to several seafood processing plants, and the local seafood industry is an important part of the local economy.
The town is also home to several tourist attractions, and tourism is an important part of the local economy. The town is home to several beaches, and the nearby Calcasieu River is a popular destination for fishing and boating. The town is also home to several restaurants, bars, and shops, and the local retail industry is an important part of the local economy.
Demographics
As of the 2010 census, the population of Cameron was 2,000. The town is approximately 70% white, 20% African American, and 10% Hispanic. The median household income is approximately $35,000, and the median home value is approximately $100,000. The town has a poverty rate of approximately 20%, and the unemployment rate is approximately 5%.
Common Questions
What is Per Capita Income in Cameron?
Per Capita income in Cameron is $21,493.
What is Inequality or Gini Index in Cameron?
Inequality or Gini Index in Cameron is 0.36.
What is the Total Population of Cameron?
Total Population of Cameron is 191.
What is the Total Male Population of Cameron?
Total Male Population of Cameron is 115.
What is the Total Female Population of Cameron?
Total Female Population of Cameron is 76.
What is the Ratio of Males per 100 Females in Cameron?
There are 151.32 Males per 100 Females in Cameron.
What is the Ratio of Females per 100 Males in Cameron?
There are 66.09 Females per 100 Males in Cameron.
What is the Median Population Age in Cameron?
Median Population Age in Cameron is 38.7 Years.
What is the Average Family Size in Cameron
Average Family Size in Cameron is 2.8 People.
What is the Average Household Size in Cameron
Average Household Size in Cameron is 2.4 People.
How Large is the Labor Force in Cameron?
There are 85 People in the Labor Forcein in Cameron.
What is the Percentage of People in the Labor Force in Cameron?
53.5% of People are in the Labor Force in Cameron.
What is the Unemployment Rate in Cameron?
Unemployment Rate in Cameron is 18.8%.