Zip Codes with the Highest Percentage of Population Employed in Life, Physical & Social Science in Lenexa, KS
RELATED REPORTS & OPTIONS
Life, Physical & Social Science
Lenexa
Compare Zip Codes
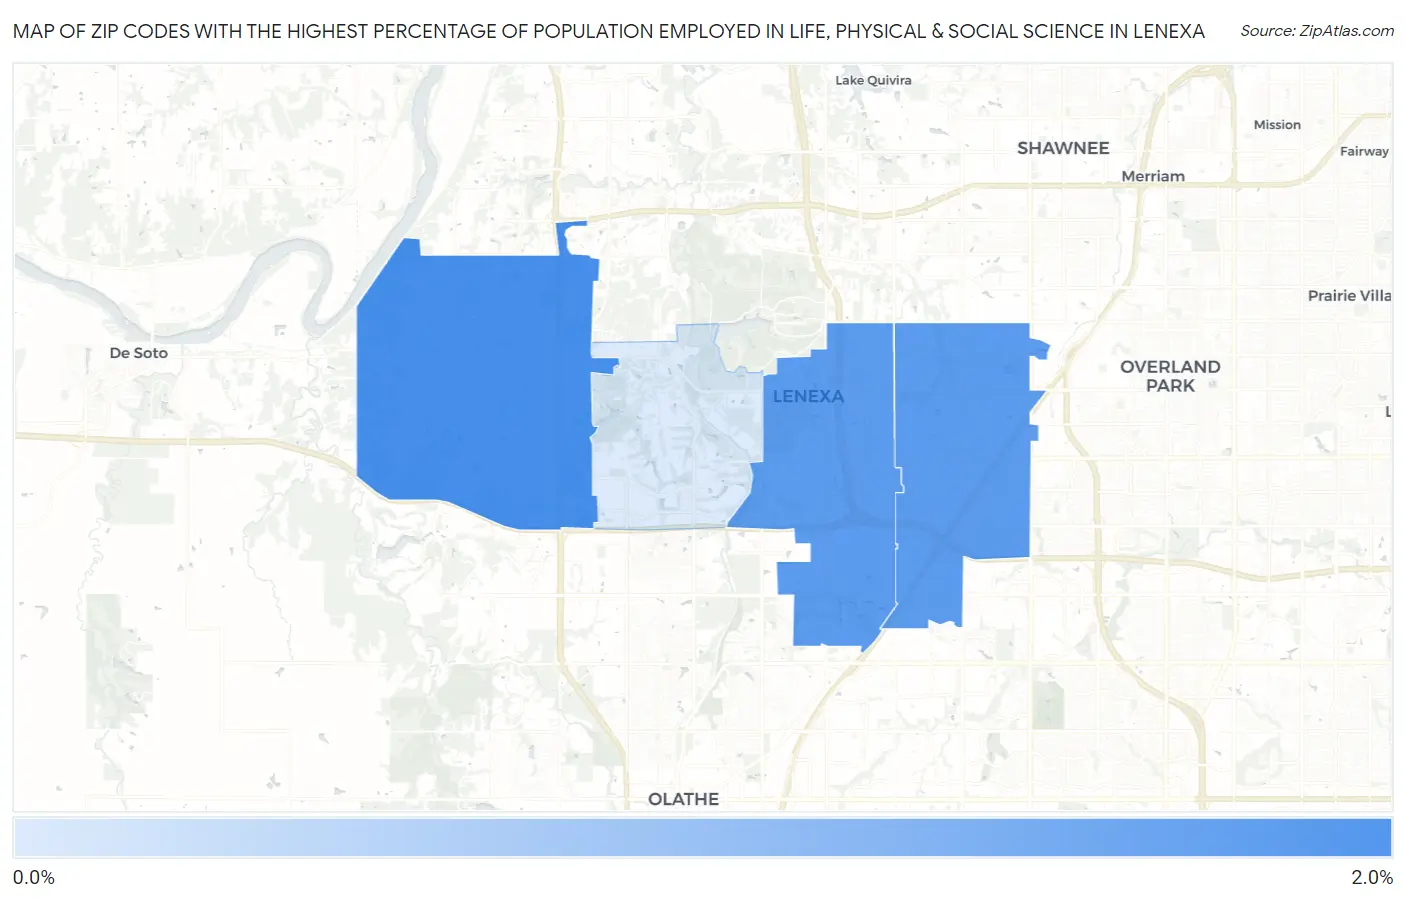
Map of Zip Codes with the Highest Percentage of Population Employed in Life, Physical & Social Science in Lenexa
0.59%
1.9%
Zip Codes with the Highest Percentage of Population Employed in Life, Physical & Social Science in Lenexa, KS
| Zip Code | % Employed | vs State | vs National | |
| 1. | 66227 | 1.9% | 0.94%(+0.974)#65 | 1.1%(+0.824)#3,929 |
| 2. | 66215 | 1.8% | 0.94%(+0.812)#74 | 1.1%(+0.661)#4,503 |
| 3. | 66219 | 1.7% | 0.94%(+0.809)#75 | 1.1%(+0.659)#4,509 |
| 4. | 66220 | 0.59% | 0.94%(-0.351)#222 | 1.1%(-0.502)#13,429 |
1
Common Questions
What are the Top 3 Zip Codes with the Highest Percentage of Population Employed in Life, Physical & Social Science in Lenexa, KS?
Top 3 Zip Codes with the Highest Percentage of Population Employed in Life, Physical & Social Science in Lenexa, KS are:
What zip code has the Highest Percentage of Population Employed in Life, Physical & Social Science in Lenexa, KS?
66227 has the Highest Percentage of Population Employed in Life, Physical & Social Science in Lenexa, KS with 1.9%.
What is the Percentage of Population Employed in Life, Physical & Social Science in Lenexa, KS?
Percentage of Population Employed in Life, Physical & Social Science in Lenexa is 1.4%.
What is the Percentage of Population Employed in Life, Physical & Social Science in Kansas?
Percentage of Population Employed in Life, Physical & Social Science in Kansas is 0.94%.
What is the Percentage of Population Employed in Life, Physical & Social Science in the United States?
Percentage of Population Employed in Life, Physical & Social Science in the United States is 1.1%.