Burlington, KS Map & Demographics
Burlington Map
Burlington Overview
$28,361
PER CAPITA INCOME
$59,426
AVG FAMILY INCOME
$47,388
AVG HOUSEHOLD INCOME
13.7%
WAGE / INCOME GAP [ % ]
86.3¢/ $1
WAGE / INCOME GAP [ $ ]
0.40
INEQUALITY / GINI INDEX
2,617
TOTAL POPULATION
1,291
MALE POPULATION
1,326
FEMALE POPULATION
97.36
MALES / 100 FEMALES
102.71
FEMALES / 100 MALES
41.3
MEDIAN AGE
3.1
AVG FAMILY SIZE
2.5
AVG HOUSEHOLD SIZE
1,183
LABOR FORCE [ PEOPLE ]
59.6%
PERCENT IN LABOR FORCE
5.9%
UNEMPLOYMENT RATE
Burlington Zip Codes
Burlington Area Codes
Income in Burlington
Income Overview in Burlington
Per Capita Income in Burlington is $28,361, while median incomes of families and households are $59,426 and $47,388 respectively.
| Characteristic | Number | Measure |
| Per Capita Income | 2,617 | $28,361 |
| Median Family Income | 665 | $59,426 |
| Mean Family Income | 665 | $81,303 |
| Median Household Income | 1,010 | $47,388 |
| Mean Household Income | 1,010 | $70,100 |
| Income Deficit | 665 | $0 |
| Wage / Income Gap (%) | 2,617 | 13.71% |
| Wage / Income Gap ($) | 2,617 | 86.29¢ per $1 |
| Gini / Inequality Index | 2,617 | 0.40 |
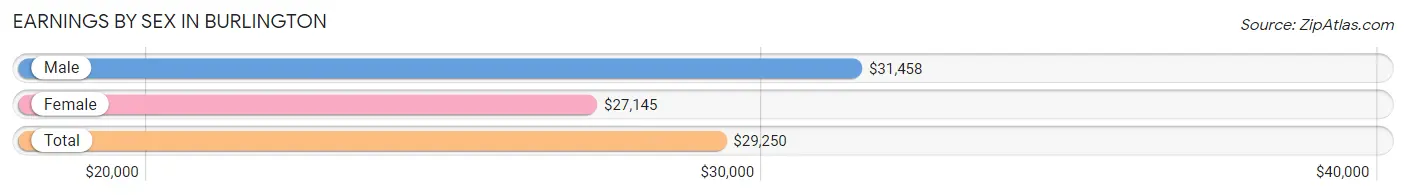
Earnings by Sex in Burlington
Average Earnings in Burlington are $29,250, $31,458 for men and $27,145 for women, a difference of 13.7%.
| Sex | Number | Average Earnings |
| Male | 614 (48.2%) | $31,458 |
| Female | 659 (51.8%) | $27,145 |
| Total | 1,273 (100.0%) | $29,250 |
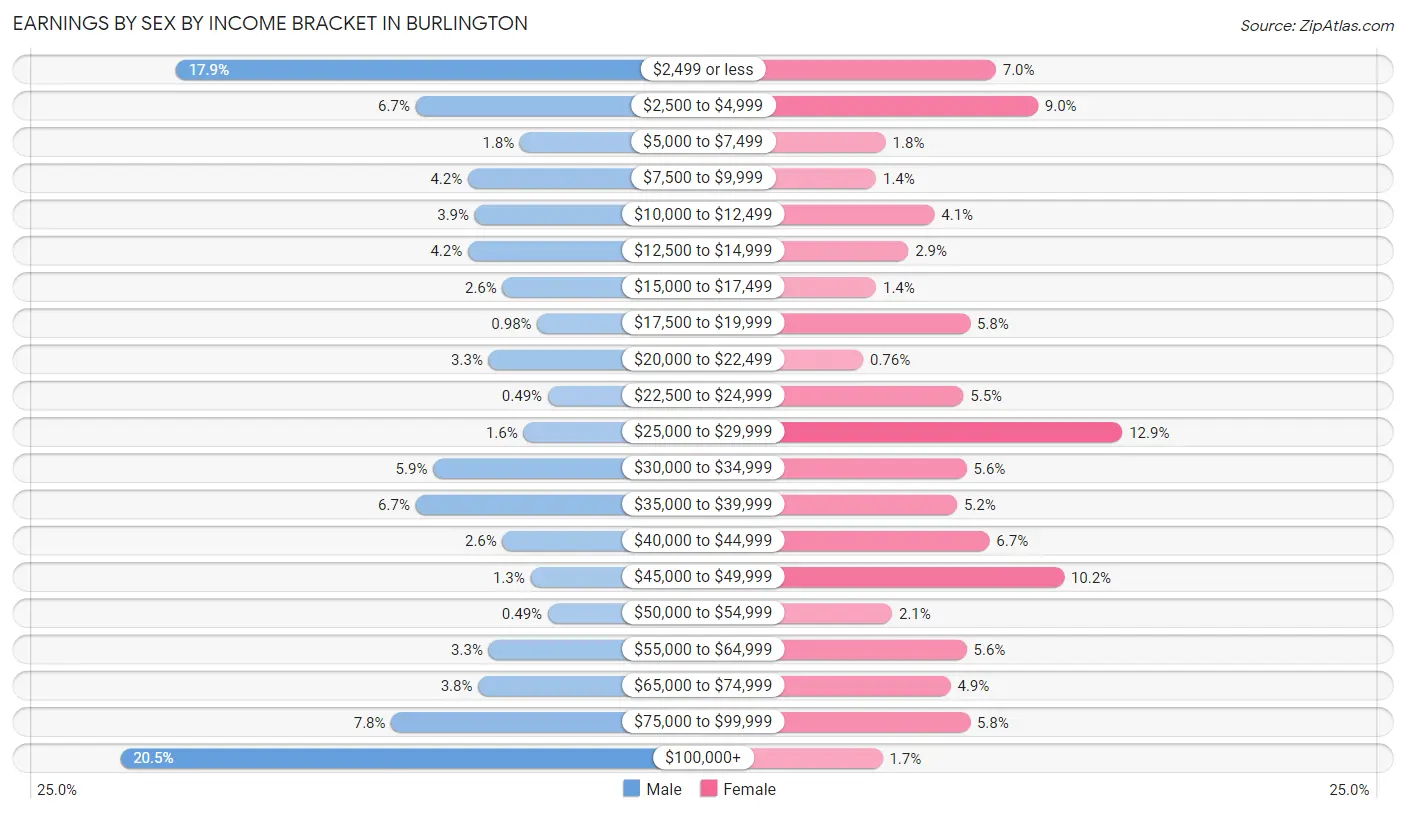
Earnings by Sex by Income Bracket in Burlington
The most common earnings brackets in Burlington are $100,000+ for men (126 | 20.5%) and $25,000 to $29,999 for women (85 | 12.9%).
| Income | Male | Female |
| $2,499 or less | 110 (17.9%) | 46 (7.0%) |
| $2,500 to $4,999 | 41 (6.7%) | 59 (8.9%) |
| $5,000 to $7,499 | 11 (1.8%) | 12 (1.8%) |
| $7,500 to $9,999 | 26 (4.2%) | 9 (1.4%) |
| $10,000 to $12,499 | 24 (3.9%) | 27 (4.1%) |
| $12,500 to $14,999 | 26 (4.2%) | 19 (2.9%) |
| $15,000 to $17,499 | 16 (2.6%) | 9 (1.4%) |
| $17,500 to $19,999 | 6 (1.0%) | 38 (5.8%) |
| $20,000 to $22,499 | 20 (3.3%) | 5 (0.8%) |
| $22,500 to $24,999 | 3 (0.5%) | 36 (5.5%) |
| $25,000 to $29,999 | 10 (1.6%) | 85 (12.9%) |
| $30,000 to $34,999 | 36 (5.9%) | 37 (5.6%) |
| $35,000 to $39,999 | 41 (6.7%) | 34 (5.2%) |
| $40,000 to $44,999 | 16 (2.6%) | 44 (6.7%) |
| $45,000 to $49,999 | 8 (1.3%) | 67 (10.2%) |
| $50,000 to $54,999 | 3 (0.5%) | 14 (2.1%) |
| $55,000 to $64,999 | 20 (3.3%) | 37 (5.6%) |
| $65,000 to $74,999 | 23 (3.7%) | 32 (4.9%) |
| $75,000 to $99,999 | 48 (7.8%) | 38 (5.8%) |
| $100,000+ | 126 (20.5%) | 11 (1.7%) |
| Total | 614 (100.0%) | 659 (100.0%) |
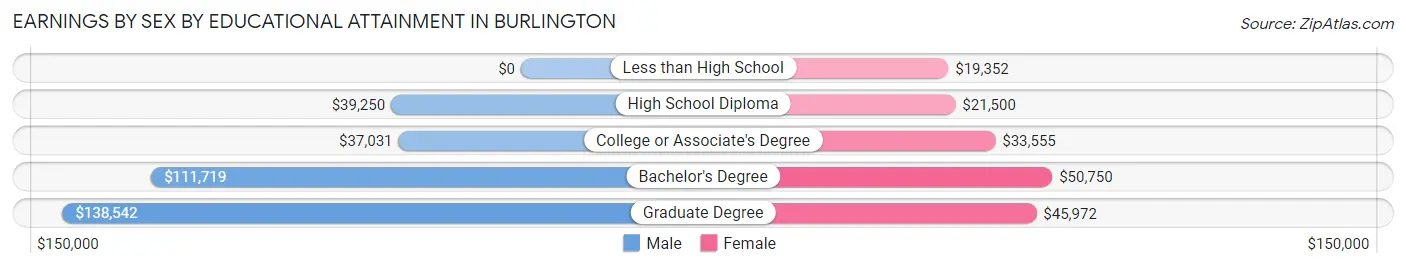
Earnings by Sex by Educational Attainment in Burlington
Average earnings in Burlington are $39,798 for men and $34,258 for women, a difference of 13.9%. Men with an educational attainment of graduate degree enjoy the highest average annual earnings of $138,542, while those with college or associate's degree education earn the least with $37,031. Women with an educational attainment of bachelor's degree earn the most with the average annual earnings of $50,750, while those with less than high school education have the smallest earnings of $19,352.
| Educational Attainment | Male Income | Female Income |
| Less than High School | - | - |
| High School Diploma | $39,250 | $21,500 |
| College or Associate's Degree | $37,031 | $33,555 |
| Bachelor's Degree | $111,719 | $50,750 |
| Graduate Degree | $138,542 | $45,972 |
| Total | $39,798 | $34,258 |
Family Income in Burlington
Family Income Brackets in Burlington
According to the Burlington family income data, there are 140 families falling into the $100,000 to $149,999 income range, which is the most common income bracket and makes up 21.0% of all families. Conversely, the $15,000 to $24,999 income bracket is the least frequent group with only 4 families (0.6%) belonging to this category.
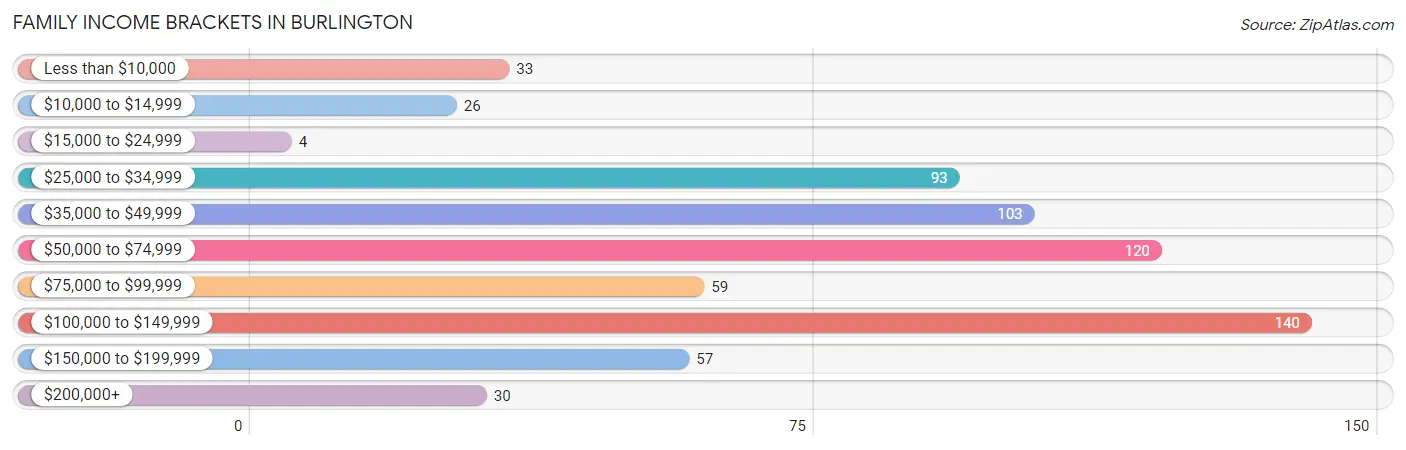
| Income Bracket | # Families | % Families |
| Less than $10,000 | 33 | 5.0% |
| $10,000 to $14,999 | 26 | 3.9% |
| $15,000 to $24,999 | 4 | 0.6% |
| $25,000 to $34,999 | 93 | 14.0% |
| $35,000 to $49,999 | 103 | 15.5% |
| $50,000 to $74,999 | 120 | 18.0% |
| $75,000 to $99,999 | 59 | 8.9% |
| $100,000 to $149,999 | 140 | 21.1% |
| $150,000 to $199,999 | 57 | 8.6% |
| $200,000+ | 30 | 4.5% |
Family Income by Famaliy Size in Burlington
5-person families (22 | 3.3%) account for the highest median family income in Burlington with $57,000 per family, while 2-person families (325 | 48.9%) have the highest median income of $26,702 per family member.
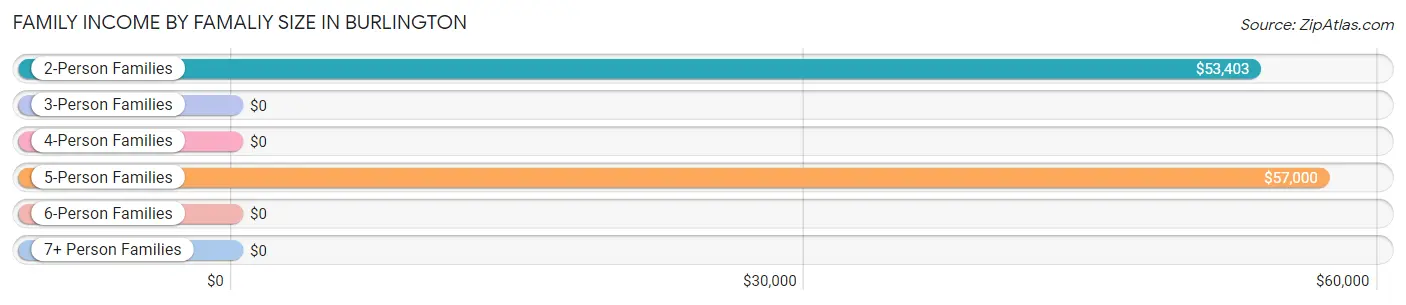
| Income Bracket | # Families | Median Income |
| 2-Person Families | 325 (48.9%) | $53,403 |
| 3-Person Families | 165 (24.8%) | $0 |
| 4-Person Families | 111 (16.7%) | $0 |
| 5-Person Families | 22 (3.3%) | $57,000 |
| 6-Person Families | 17 (2.6%) | $0 |
| 7+ Person Families | 25 (3.8%) | $0 |
| Total | 665 (100.0%) | $59,426 |
Family Income by Number of Earners in Burlington
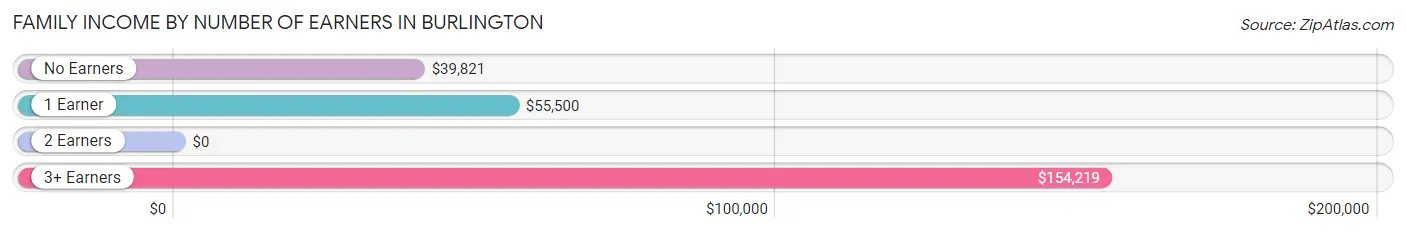
| Number of Earners | # Families | Median Income |
| No Earners | 141 (21.2%) | $39,821 |
| 1 Earner | 232 (34.9%) | $55,500 |
| 2 Earners | 261 (39.3%) | $0 |
| 3+ Earners | 31 (4.7%) | $154,219 |
| Total | 665 (100.0%) | $59,426 |
Household Income in Burlington
Household Income Brackets in Burlington
With 226 households falling in the category, the $35,000 to $49,999 income range is the most frequent in Burlington, accounting for 22.4% of all households. In contrast, only 20 households (2.0%) fall into the less than $10,000 income bracket, making it the least populous group.
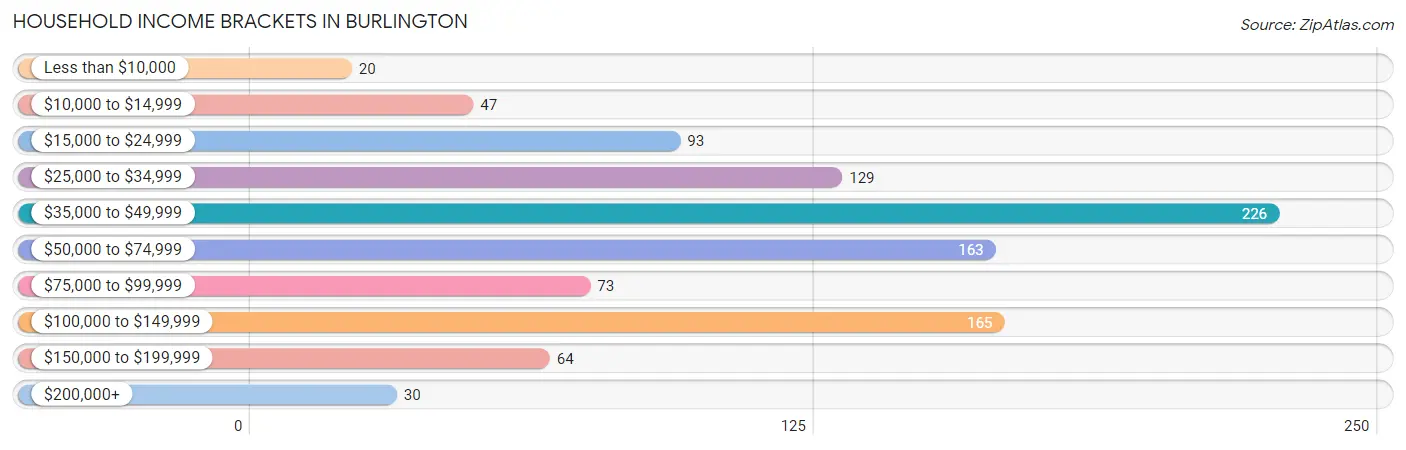
| Income Bracket | # Households | % Households |
| Less than $10,000 | 20 | 2.0% |
| $10,000 to $14,999 | 47 | 4.7% |
| $15,000 to $24,999 | 93 | 9.2% |
| $25,000 to $34,999 | 129 | 12.8% |
| $35,000 to $49,999 | 226 | 22.4% |
| $50,000 to $74,999 | 163 | 16.1% |
| $75,000 to $99,999 | 73 | 7.2% |
| $100,000 to $149,999 | 165 | 16.3% |
| $150,000 to $199,999 | 64 | 6.3% |
| $200,000+ | 30 | 3.0% |
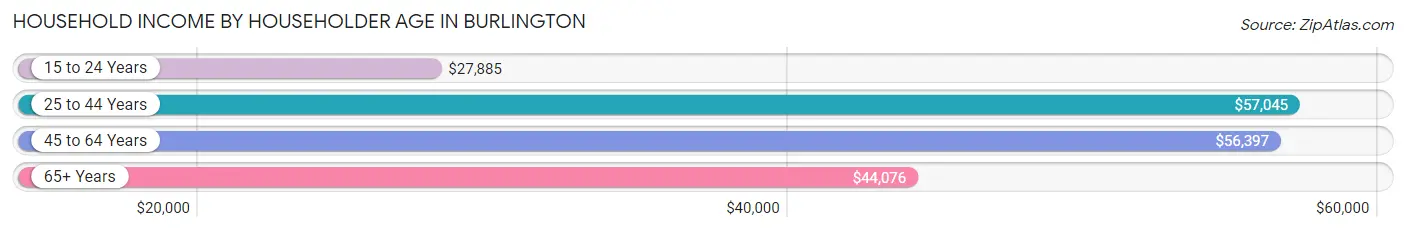
Household Income by Householder Age in Burlington
The median household income in Burlington is $47,388, with the highest median household income of $57,045 found in the 25 to 44 years age bracket for the primary householder. A total of 310 households (30.7%) fall into this category. Meanwhile, the 15 to 24 years age bracket for the primary householder has the lowest median household income of $27,885, with 36 households (3.6%) in this group.
| Income Bracket | # Households | Median Income |
| 15 to 24 Years | 36 (3.6%) | $27,885 |
| 25 to 44 Years | 310 (30.7%) | $57,045 |
| 45 to 64 Years | 393 (38.9%) | $56,397 |
| 65+ Years | 271 (26.8%) | $44,076 |
| Total | 1,010 (100.0%) | $47,388 |
Poverty in Burlington
Income Below Poverty by Sex and Age in Burlington
With 14.1% poverty level for males and 15.7% for females among the residents of Burlington, 18 to 24 year old males and 18 to 24 year old females are the most vulnerable to poverty, with 61 males (57.6%) and 39 females (60.9%) in their respective age groups living below the poverty level.
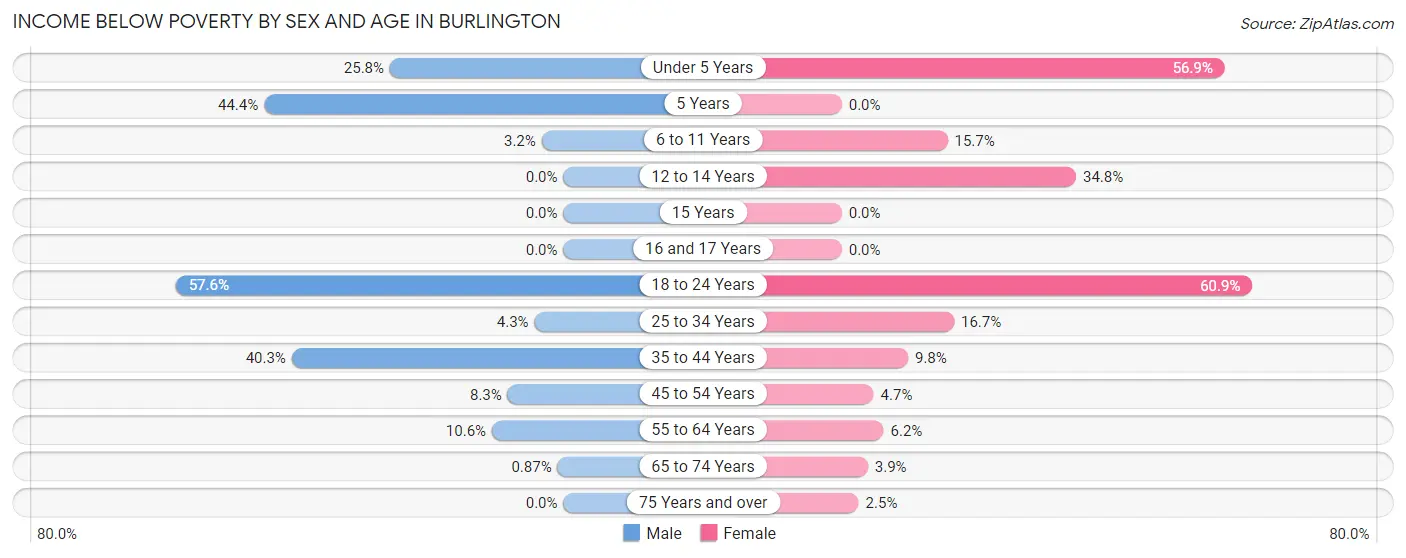
| Age Bracket | Male | Female |
| Under 5 Years | 17 (25.8%) | 58 (56.9%) |
| 5 Years | 8 (44.4%) | 0 (0.0%) |
| 6 to 11 Years | 4 (3.2%) | 19 (15.7%) |
| 12 to 14 Years | 0 (0.0%) | 24 (34.8%) |
| 15 Years | 0 (0.0%) | 0 (0.0%) |
| 16 and 17 Years | 0 (0.0%) | 0 (0.0%) |
| 18 to 24 Years | 61 (57.6%) | 39 (60.9%) |
| 25 to 34 Years | 6 (4.3%) | 16 (16.7%) |
| 35 to 44 Years | 48 (40.3%) | 19 (9.8%) |
| 45 to 54 Years | 13 (8.3%) | 7 (4.7%) |
| 55 to 64 Years | 19 (10.6%) | 10 (6.2%) |
| 65 to 74 Years | 1 (0.9%) | 6 (3.9%) |
| 75 Years and over | 0 (0.0%) | 2 (2.5%) |
| Total | 177 (14.1%) | 200 (15.7%) |
Income Above Poverty by Sex and Age in Burlington
According to the poverty statistics in Burlington, males aged 12 to 14 years and females aged 5 years are the age groups that are most secure financially, with 100.0% of males and 100.0% of females in these age groups living above the poverty line.
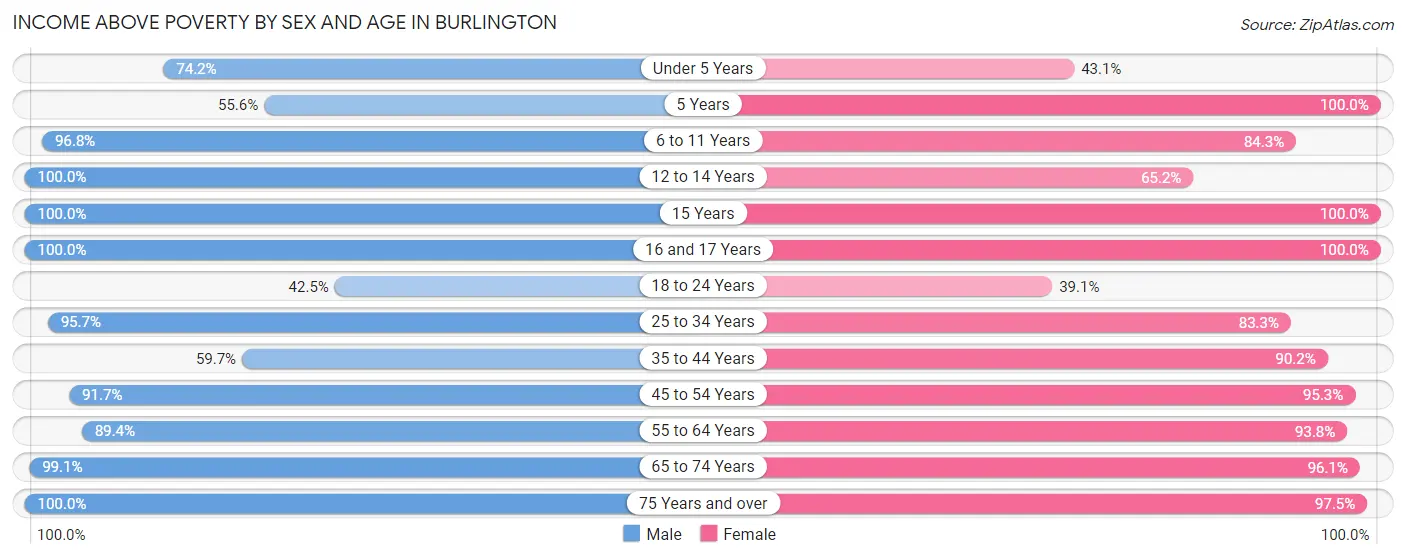
| Age Bracket | Male | Female |
| Under 5 Years | 49 (74.2%) | 44 (43.1%) |
| 5 Years | 10 (55.6%) | 7 (100.0%) |
| 6 to 11 Years | 120 (96.8%) | 102 (84.3%) |
| 12 to 14 Years | 61 (100.0%) | 45 (65.2%) |
| 15 Years | 25 (100.0%) | 24 (100.0%) |
| 16 and 17 Years | 65 (100.0%) | 57 (100.0%) |
| 18 to 24 Years | 45 (42.4%) | 25 (39.1%) |
| 25 to 34 Years | 134 (95.7%) | 80 (83.3%) |
| 35 to 44 Years | 71 (59.7%) | 174 (90.2%) |
| 45 to 54 Years | 144 (91.7%) | 141 (95.3%) |
| 55 to 64 Years | 160 (89.4%) | 151 (93.8%) |
| 65 to 74 Years | 114 (99.1%) | 149 (96.1%) |
| 75 Years and over | 79 (100.0%) | 78 (97.5%) |
| Total | 1,077 (85.9%) | 1,077 (84.3%) |
Income Below Poverty Among Married-Couple Families in Burlington
The poverty statistics for married-couple families in Burlington show that 1.6% or 6 of the total 382 families live below the poverty line. Families with 1 or 2 children have the highest poverty rate of 5.4%, comprising of 6 families. On the other hand, families with no children have the lowest poverty rate of 0.0%, which includes 0 families.
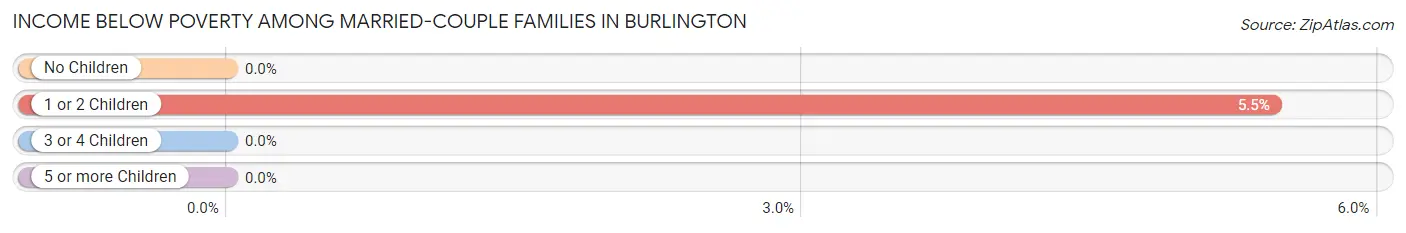
| Children | Above Poverty | Below Poverty |
| No Children | 226 (100.0%) | 0 (0.0%) |
| 1 or 2 Children | 104 (94.6%) | 6 (5.4%) |
| 3 or 4 Children | 22 (100.0%) | 0 (0.0%) |
| 5 or more Children | 24 (100.0%) | 0 (0.0%) |
| Total | 376 (98.4%) | 6 (1.6%) |
Income Below Poverty Among Single-Parent Households in Burlington
According to the poverty data in Burlington, 20.3% or 26 single-father households and 18.7% or 29 single-mother households are living below the poverty line. Among single-father households, those with 1 or 2 children have the highest poverty rate, with 26 households (44.1%) experiencing poverty. Likewise, among single-mother households, those with 3 or 4 children have the highest poverty rate, with 20 households (47.6%) falling below the poverty line.
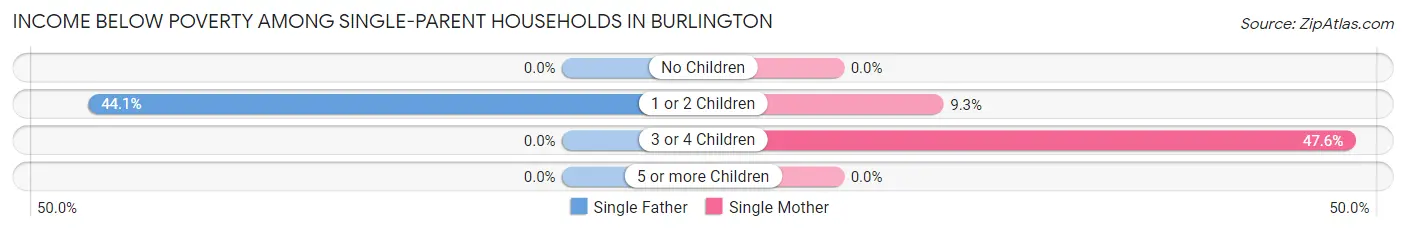
| Children | Single Father | Single Mother |
| No Children | 0 (0.0%) | 0 (0.0%) |
| 1 or 2 Children | 26 (44.1%) | 9 (9.3%) |
| 3 or 4 Children | 0 (0.0%) | 20 (47.6%) |
| 5 or more Children | 0 (0.0%) | 0 (0.0%) |
| Total | 26 (20.3%) | 29 (18.7%) |
Income Below Poverty Among Married-Couple vs Single-Parent Households in Burlington
The poverty data for Burlington shows that 6 of the married-couple family households (1.6%) and 55 of the single-parent households (19.4%) are living below the poverty level. Within the married-couple family households, those with 1 or 2 children have the highest poverty rate, with 6 households (5.4%) falling below the poverty line. Among the single-parent households, those with 3 or 4 children have the highest poverty rate, with 20 household (40.8%) living below poverty.
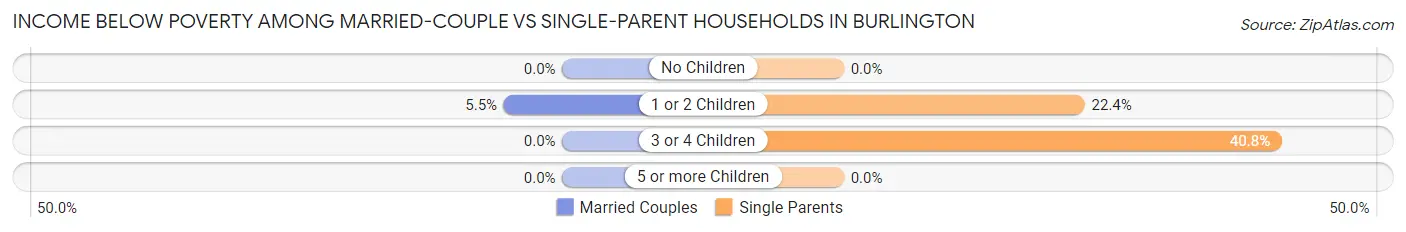
| Children | Married-Couple Families | Single-Parent Households |
| No Children | 0 (0.0%) | 0 (0.0%) |
| 1 or 2 Children | 6 (5.4%) | 35 (22.4%) |
| 3 or 4 Children | 0 (0.0%) | 20 (40.8%) |
| 5 or more Children | 0 (0.0%) | 0 (0.0%) |
| Total | 6 (1.6%) | 55 (19.4%) |
Race in Burlington
The most populous races in Burlington are White / Caucasian (2,380 | 90.9%), Two or more Races (176 | 6.7%), and Hispanic or Latino (116 | 4.4%).
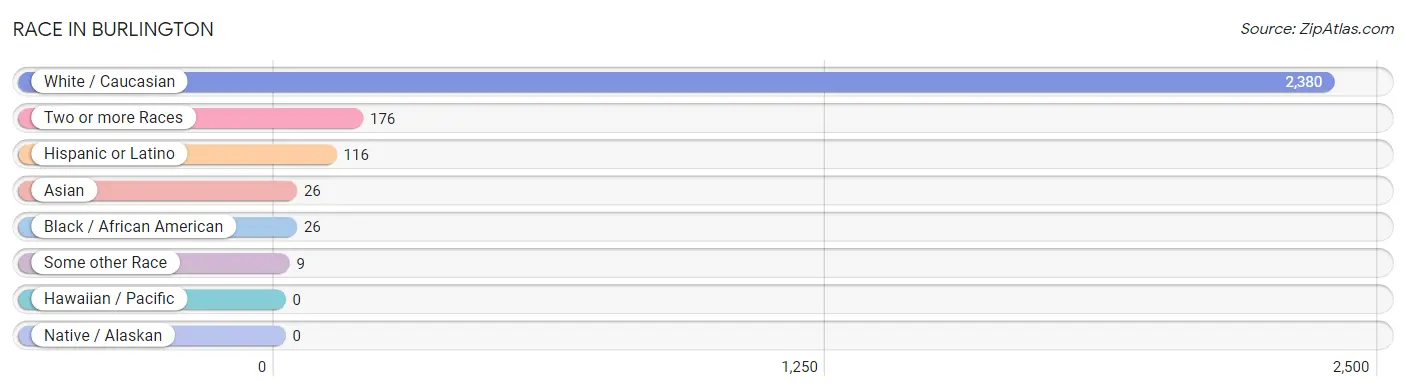
| Race | # Population | % Population |
| Asian | 26 | 1.0% |
| Black / African American | 26 | 1.0% |
| Hawaiian / Pacific | 0 | 0.0% |
| Hispanic or Latino | 116 | 4.4% |
| Native / Alaskan | 0 | 0.0% |
| White / Caucasian | 2,380 | 90.9% |
| Two or more Races | 176 | 6.7% |
| Some other Race | 9 | 0.3% |
| Total | 2,617 | 100.0% |
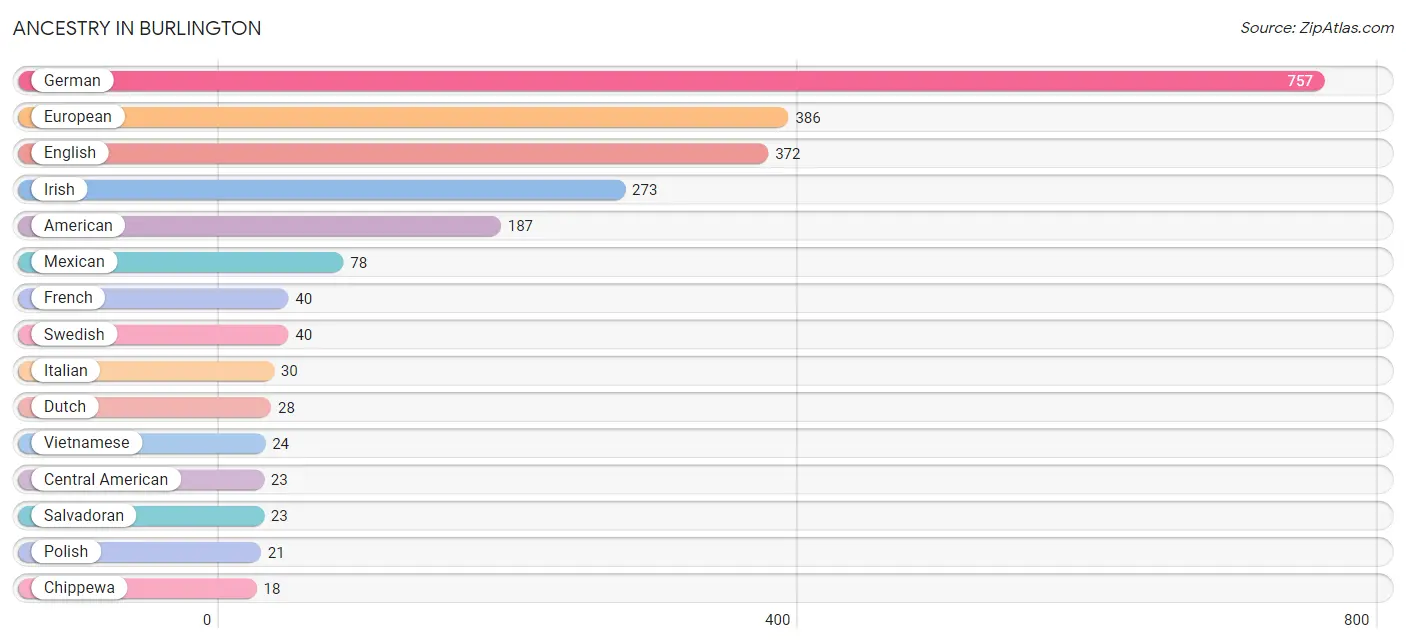
Ancestry in Burlington
The most populous ancestries reported in Burlington are German (757 | 28.9%), European (386 | 14.7%), English (372 | 14.2%), Irish (273 | 10.4%), and American (187 | 7.1%), together accounting for 75.5% of all Burlington residents.
| Ancestry | # Population | % Population |
| American | 187 | 7.1% |
| Belgian | 6 | 0.2% |
| British | 8 | 0.3% |
| Celtic | 17 | 0.6% |
| Central American | 23 | 0.9% |
| Cherokee | 13 | 0.5% |
| Chilean | 8 | 0.3% |
| Chippewa | 18 | 0.7% |
| Czech | 2 | 0.1% |
| Czechoslovakian | 10 | 0.4% |
| Danish | 6 | 0.2% |
| Dutch | 28 | 1.1% |
| Eastern European | 4 | 0.2% |
| English | 372 | 14.2% |
| European | 386 | 14.7% |
| French | 40 | 1.5% |
| German | 757 | 28.9% |
| Indian (Asian) | 2 | 0.1% |
| Irish | 273 | 10.4% |
| Italian | 30 | 1.1% |
| Mexican | 78 | 3.0% |
| Norwegian | 2 | 0.1% |
| Polish | 21 | 0.8% |
| Russian | 5 | 0.2% |
| Salvadoran | 23 | 0.9% |
| Scandinavian | 1 | 0.0% |
| Scottish | 16 | 0.6% |
| Shoshone | 18 | 0.7% |
| South American | 8 | 0.3% |
| South American Indian | 8 | 0.3% |
| Spaniard | 7 | 0.3% |
| Swedish | 40 | 1.5% |
| Swiss | 14 | 0.5% |
| Vietnamese | 24 | 0.9% |
| Welsh | 5 | 0.2% | View All 35 Rows |
Immigrants in Burlington
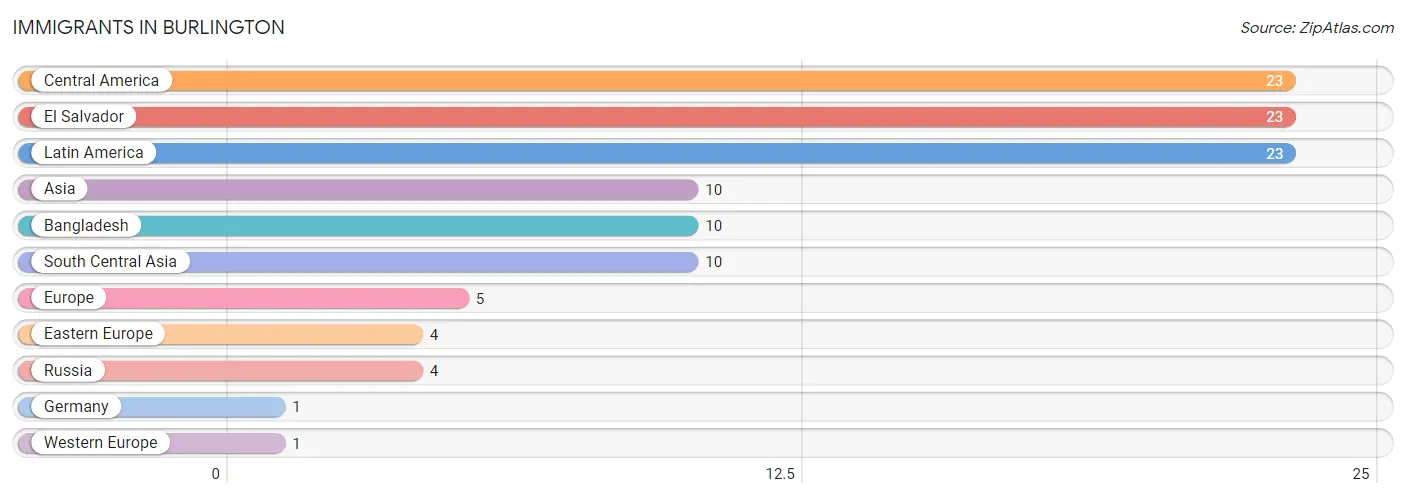
The most numerous immigrant groups reported in Burlington came from Central America (23 | 0.9%), El Salvador (23 | 0.9%), Latin America (23 | 0.9%), Asia (10 | 0.4%), and Bangladesh (10 | 0.4%), together accounting for 3.4% of all Burlington residents.
| Immigration Origin | # Population | % Population |
| Asia | 10 | 0.4% |
| Bangladesh | 10 | 0.4% |
| Central America | 23 | 0.9% |
| Eastern Europe | 4 | 0.2% |
| El Salvador | 23 | 0.9% |
| Europe | 5 | 0.2% |
| Germany | 1 | 0.0% |
| Latin America | 23 | 0.9% |
| Russia | 4 | 0.2% |
| South Central Asia | 10 | 0.4% |
| Western Europe | 1 | 0.0% | View All 11 Rows |
Sex and Age in Burlington
Sex and Age in Burlington
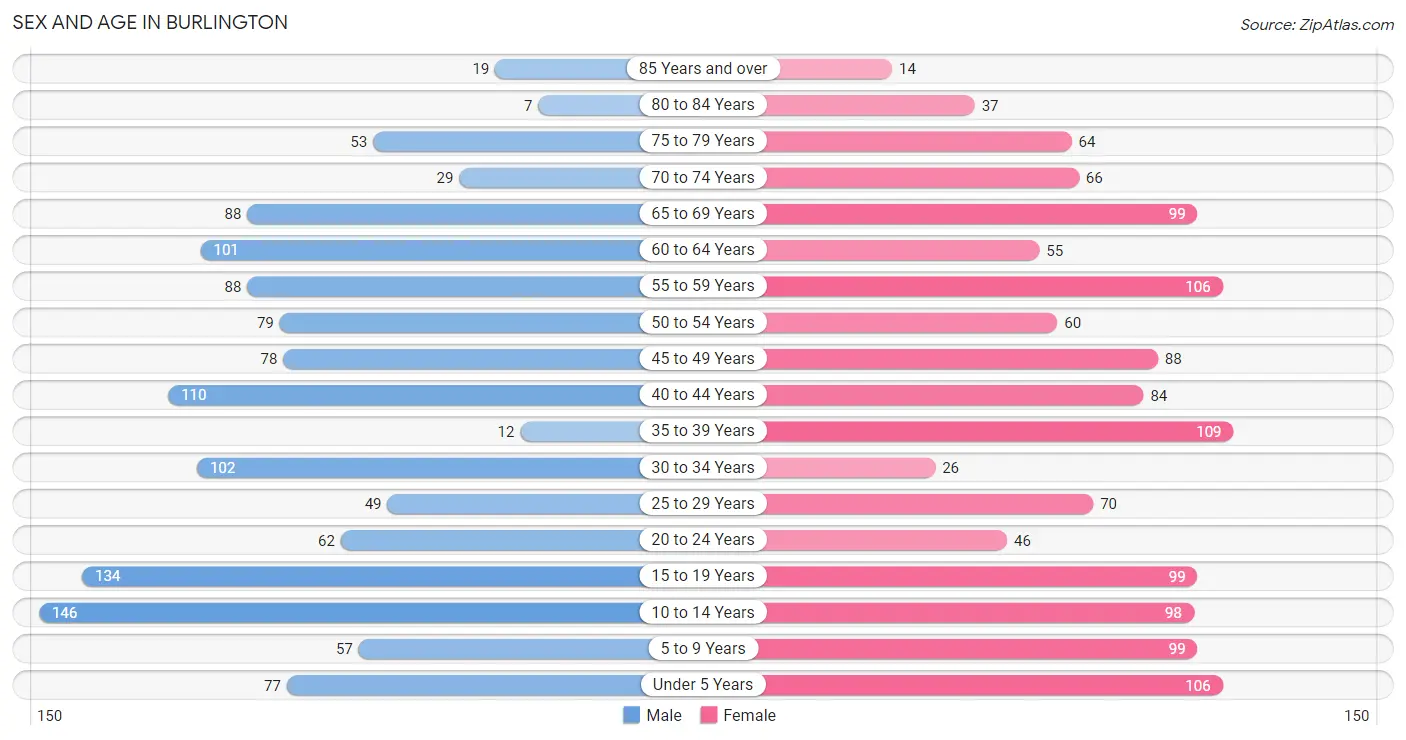
The most populous age groups in Burlington are 10 to 14 Years (146 | 11.3%) for men and 35 to 39 Years (109 | 8.2%) for women.
| Age Bracket | Male | Female |
| Under 5 Years | 77 (6.0%) | 106 (8.0%) |
| 5 to 9 Years | 57 (4.4%) | 99 (7.5%) |
| 10 to 14 Years | 146 (11.3%) | 98 (7.4%) |
| 15 to 19 Years | 134 (10.4%) | 99 (7.5%) |
| 20 to 24 Years | 62 (4.8%) | 46 (3.5%) |
| 25 to 29 Years | 49 (3.8%) | 70 (5.3%) |
| 30 to 34 Years | 102 (7.9%) | 26 (2.0%) |
| 35 to 39 Years | 12 (0.9%) | 109 (8.2%) |
| 40 to 44 Years | 110 (8.5%) | 84 (6.3%) |
| 45 to 49 Years | 78 (6.0%) | 88 (6.6%) |
| 50 to 54 Years | 79 (6.1%) | 60 (4.5%) |
| 55 to 59 Years | 88 (6.8%) | 106 (8.0%) |
| 60 to 64 Years | 101 (7.8%) | 55 (4.2%) |
| 65 to 69 Years | 88 (6.8%) | 99 (7.5%) |
| 70 to 74 Years | 29 (2.2%) | 66 (5.0%) |
| 75 to 79 Years | 53 (4.1%) | 64 (4.8%) |
| 80 to 84 Years | 7 (0.5%) | 37 (2.8%) |
| 85 Years and over | 19 (1.5%) | 14 (1.1%) |
| Total | 1,291 (100.0%) | 1,326 (100.0%) |
Families and Households in Burlington
Median Family Size in Burlington
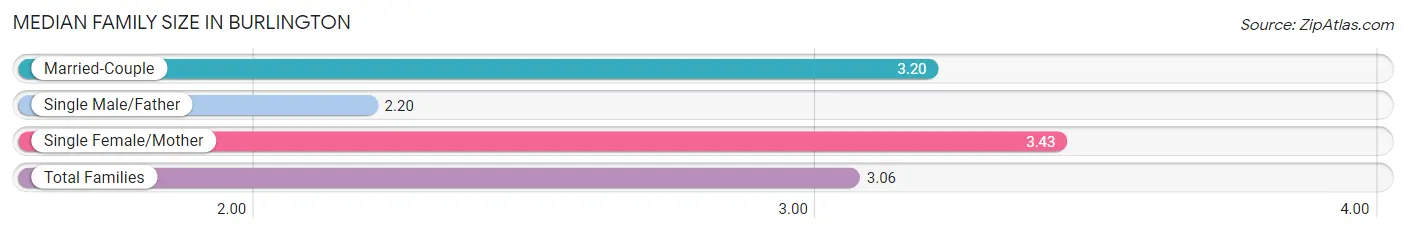
The median family size in Burlington is 3.06 persons per family, with single female/mother families (155 | 23.3%) accounting for the largest median family size of 3.43 persons per family. On the other hand, single male/father families (128 | 19.3%) represent the smallest median family size with 2.20 persons per family.
| Family Type | # Families | Family Size |
| Married-Couple | 382 (57.4%) | 3.20 |
| Single Male/Father | 128 (19.3%) | 2.20 |
| Single Female/Mother | 155 (23.3%) | 3.43 |
| Total Families | 665 (100.0%) | 3.06 |
Median Household Size in Burlington
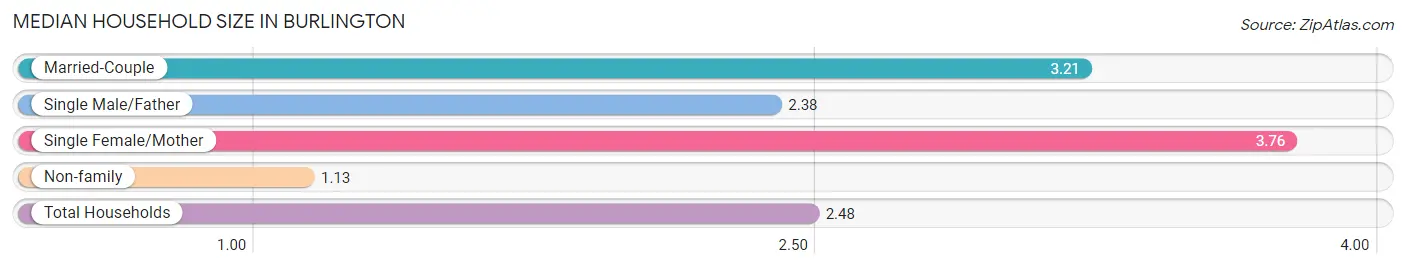
The median household size in Burlington is 2.48 persons per household, with single female/mother households (155 | 15.3%) accounting for the largest median household size of 3.76 persons per household. non-family households (345 | 34.2%) represent the smallest median household size with 1.13 persons per household.
| Household Type | # Households | Household Size |
| Married-Couple | 382 (37.8%) | 3.21 |
| Single Male/Father | 128 (12.7%) | 2.38 |
| Single Female/Mother | 155 (15.3%) | 3.76 |
| Non-family | 345 (34.2%) | 1.13 |
| Total Households | 1,010 (100.0%) | 2.48 |
Household Size by Marriage Status in Burlington
Out of a total of 1,010 households in Burlington, 665 (65.8%) are family households, while 345 (34.2%) are nonfamily households. The most numerous type of family households are 2-person households, comprising 314, and the most common type of nonfamily households are 1-person households, comprising 319.
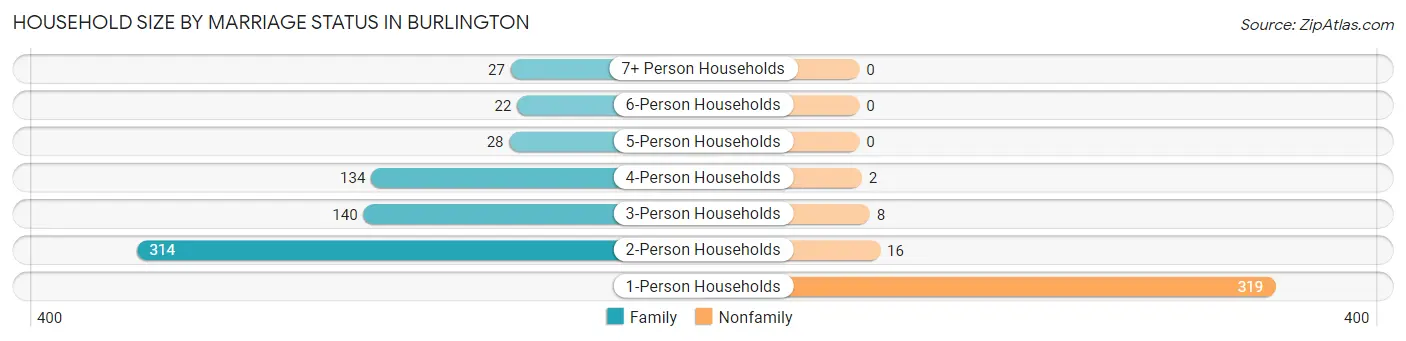
| Household Size | Family Households | Nonfamily Households |
| 1-Person Households | - | 319 (31.6%) |
| 2-Person Households | 314 (31.1%) | 16 (1.6%) |
| 3-Person Households | 140 (13.9%) | 8 (0.8%) |
| 4-Person Households | 134 (13.3%) | 2 (0.2%) |
| 5-Person Households | 28 (2.8%) | 0 (0.0%) |
| 6-Person Households | 22 (2.2%) | 0 (0.0%) |
| 7+ Person Households | 27 (2.7%) | 0 (0.0%) |
| Total | 665 (65.8%) | 345 (34.2%) |
Female Fertility in Burlington
Fertility by Age in Burlington
Average fertility rate in Burlington is 68.0 births per 1,000 women. Women in the age bracket of 20 to 34 years have the highest fertility rate with 254.0 births per 1,000 women. Women in the age bracket of 20 to 34 years acount for 100.0% of all women with births.
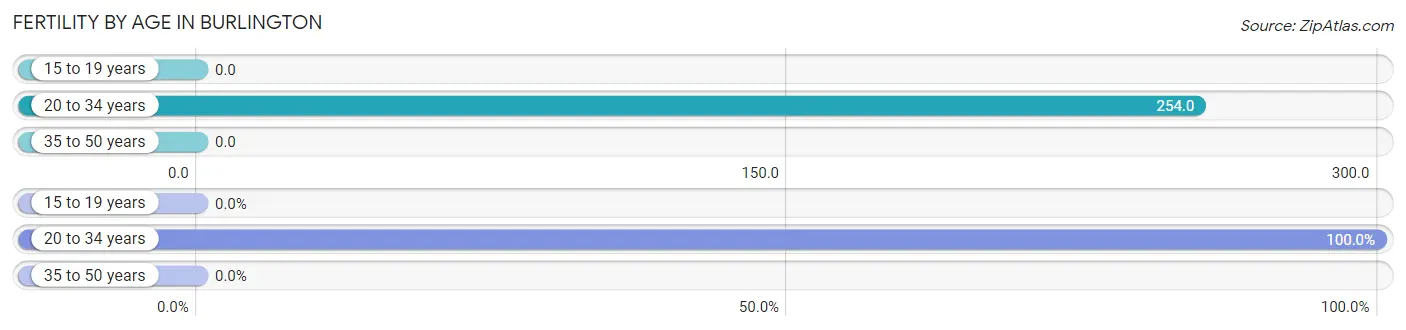
| Age Bracket | Women with Births | Births / 1,000 Women |
| 15 to 19 years | 0 (0.0%) | 0.0 |
| 20 to 34 years | 36 (100.0%) | 254.0 |
| 35 to 50 years | 0 (0.0%) | 0.0 |
| Total | 36 (100.0%) | 68.0 |
Fertility by Age by Marriage Status in Burlington
72.2% of women with births (36) in Burlington are married. The highest percentage of unmarried women with births falls into 20 to 34 years age bracket with 27.8% of them unmarried at the time of birth, while the lowest percentage of unmarried women with births belong to 20 to 34 years age bracket with 27.8% of them unmarried.
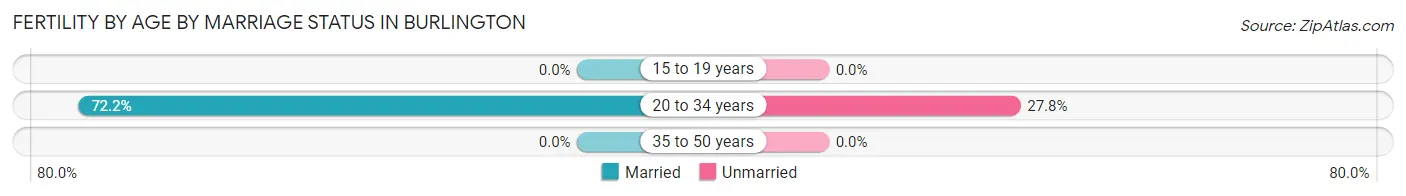
| Age Bracket | Married | Unmarried |
| 15 to 19 years | 0 (0.0%) | 0 (0.0%) |
| 20 to 34 years | 26 (72.2%) | 10 (27.8%) |
| 35 to 50 years | 0 (0.0%) | 0 (0.0%) |
| Total | 26 (72.2%) | 10 (27.8%) |
Fertility by Education in Burlington
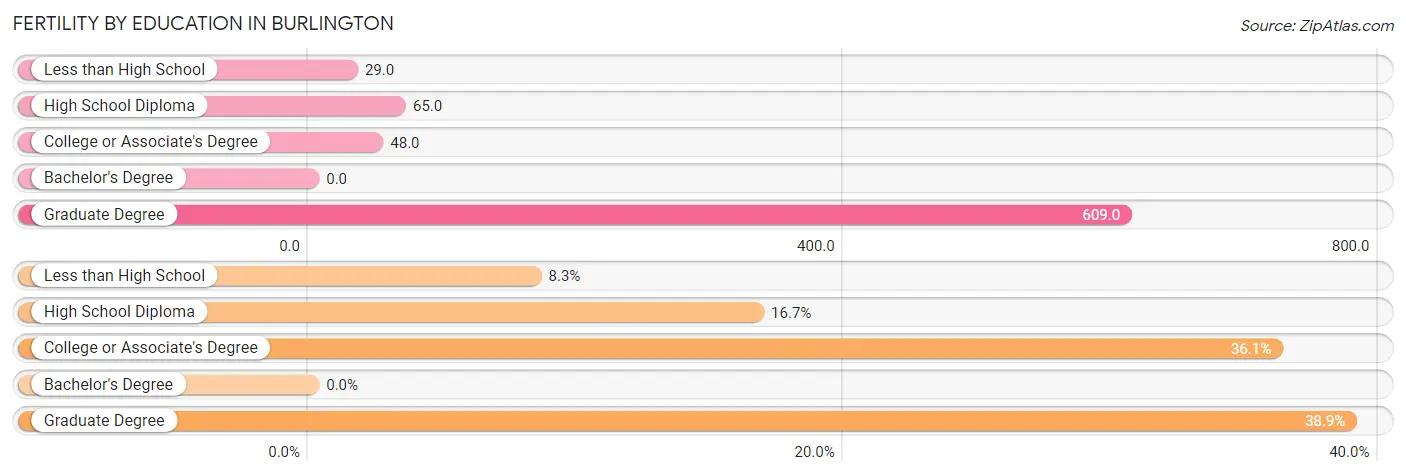
| Educational Attainment | Women with Births | Births / 1,000 Women |
| Less than High School | 3 (8.3%) | 29.0 |
| High School Diploma | 6 (16.7%) | 65.0 |
| College or Associate's Degree | 13 (36.1%) | 48.0 |
| Bachelor's Degree | 0 (0.0%) | 0.0 |
| Graduate Degree | 14 (38.9%) | 609.0 |
| Total | 36 (100.0%) | 68.0 |
Fertility by Education by Marriage Status in Burlington
27.8% of women with births in Burlington are unmarried. Women with the educational attainment of less than high school are most likely to be married with 100.0% of them married at childbirth, while women with the educational attainment of high school diploma are least likely to be married with 100.0% of them unmarried at childbirth.
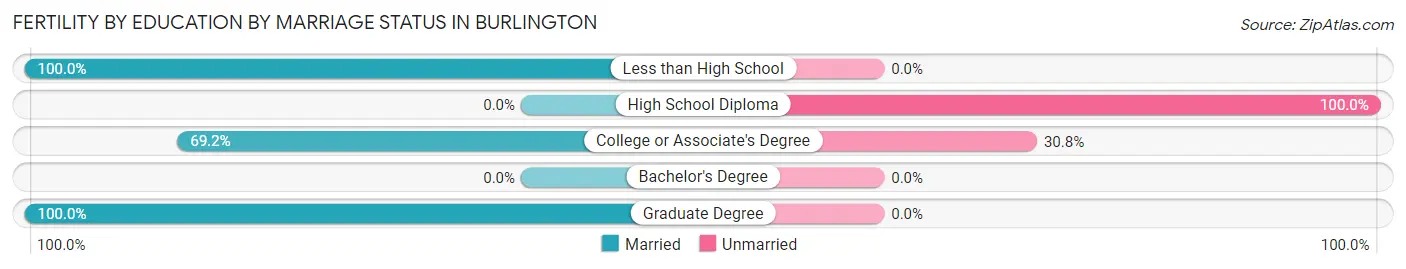
| Educational Attainment | Married | Unmarried |
| Less than High School | 3 (100.0%) | 0 (0.0%) |
| High School Diploma | 0 (0.0%) | 6 (100.0%) |
| College or Associate's Degree | 9 (69.2%) | 4 (30.8%) |
| Bachelor's Degree | 0 (0.0%) | 0 (0.0%) |
| Graduate Degree | 14 (100.0%) | 0 (0.0%) |
| Total | 26 (72.2%) | 10 (27.8%) |
Employment Characteristics in Burlington
Employment by Class of Employer in Burlington
Among the 1,082 employed individuals in Burlington, private company employees (683 | 63.1%), local government employees (129 | 11.9%), and not-for-profit organizations (95 | 8.8%) make up the most common classes of employment.
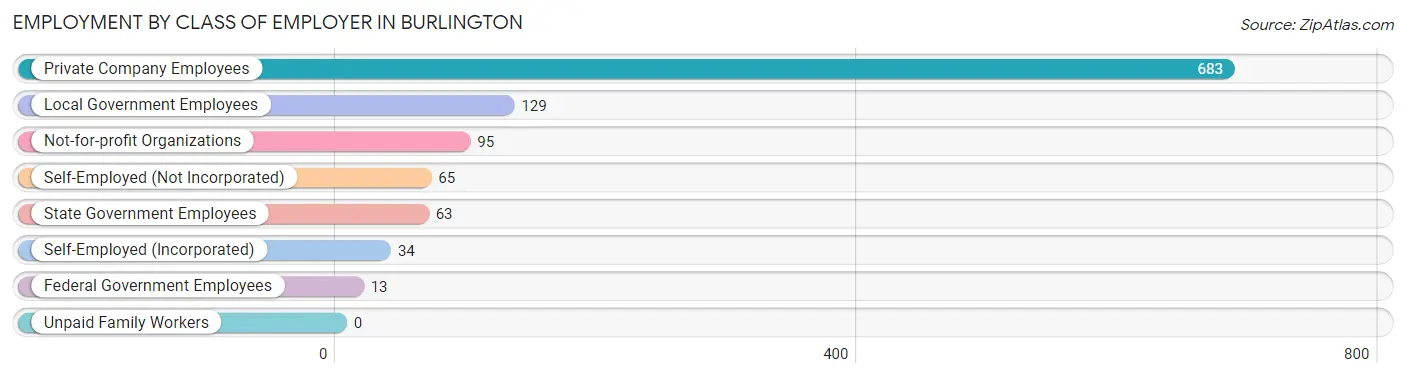
| Employer Class | # Employees | % Employees |
| Private Company Employees | 683 | 63.1% |
| Self-Employed (Incorporated) | 34 | 3.1% |
| Self-Employed (Not Incorporated) | 65 | 6.0% |
| Not-for-profit Organizations | 95 | 8.8% |
| Local Government Employees | 129 | 11.9% |
| State Government Employees | 63 | 5.8% |
| Federal Government Employees | 13 | 1.2% |
| Unpaid Family Workers | 0 | 0.0% |
| Total | 1,082 | 100.0% |
Employment Status by Age in Burlington
According to the labor force statistics for Burlington, out of the total population over 16 years of age (1,985), 59.6% or 1,183 individuals are in the labor force, with 5.9% or 70 of them unemployed. The age group with the highest labor force participation rate is 30 to 34 years, with 84.4% or 108 individuals in the labor force. Within the labor force, the 20 to 24 years age range has the highest percentage of unemployed individuals, with 31.1% or 23 of them being unemployed.
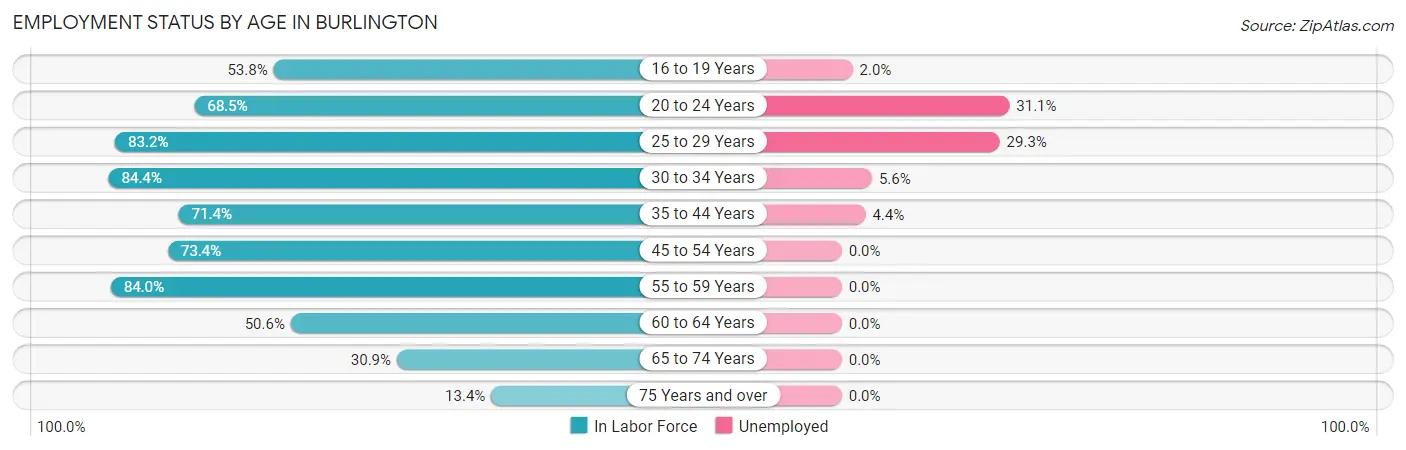
| Age Bracket | In Labor Force | Unemployed |
| 16 to 19 Years | 99 (53.8%) | 2 (2.0%) |
| 20 to 24 Years | 74 (68.5%) | 23 (31.1%) |
| 25 to 29 Years | 99 (83.2%) | 29 (29.3%) |
| 30 to 34 Years | 108 (84.4%) | 6 (5.6%) |
| 35 to 44 Years | 225 (71.4%) | 10 (4.4%) |
| 45 to 54 Years | 224 (73.4%) | 0 (0.0%) |
| 55 to 59 Years | 163 (84.0%) | 0 (0.0%) |
| 60 to 64 Years | 79 (50.6%) | 0 (0.0%) |
| 65 to 74 Years | 87 (30.9%) | 0 (0.0%) |
| 75 Years and over | 26 (13.4%) | 0 (0.0%) |
| Total | 1,183 (59.6%) | 70 (5.9%) |
Employment Status by Educational Attainment in Burlington
According to labor force statistics for Burlington, 73.8% of individuals (898) out of the total population between 25 and 64 years of age (1,217) are in the labor force, with 5.0% or 45 of them being unemployed. The group with the highest labor force participation rate are those with the educational attainment of bachelor's degree or higher, with 91.6% or 218 individuals in the labor force. Within the labor force, individuals with college / associate degree education have the highest percentage of unemployment, with 9.5% or 39 of them being unemployed.
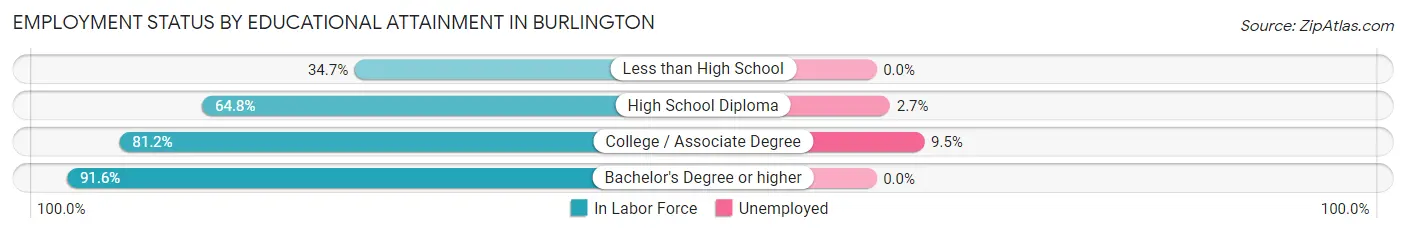
| Educational Attainment | In Labor Force | Unemployed |
| Less than High School | 43 (34.7%) | 0 (0.0%) |
| High School Diploma | 226 (64.8%) | 9 (2.7%) |
| College / Associate Degree | 411 (81.2%) | 48 (9.5%) |
| Bachelor's Degree or higher | 218 (91.6%) | 0 (0.0%) |
| Total | 898 (73.8%) | 61 (5.0%) |
Employment Occupations by Sex in Burlington
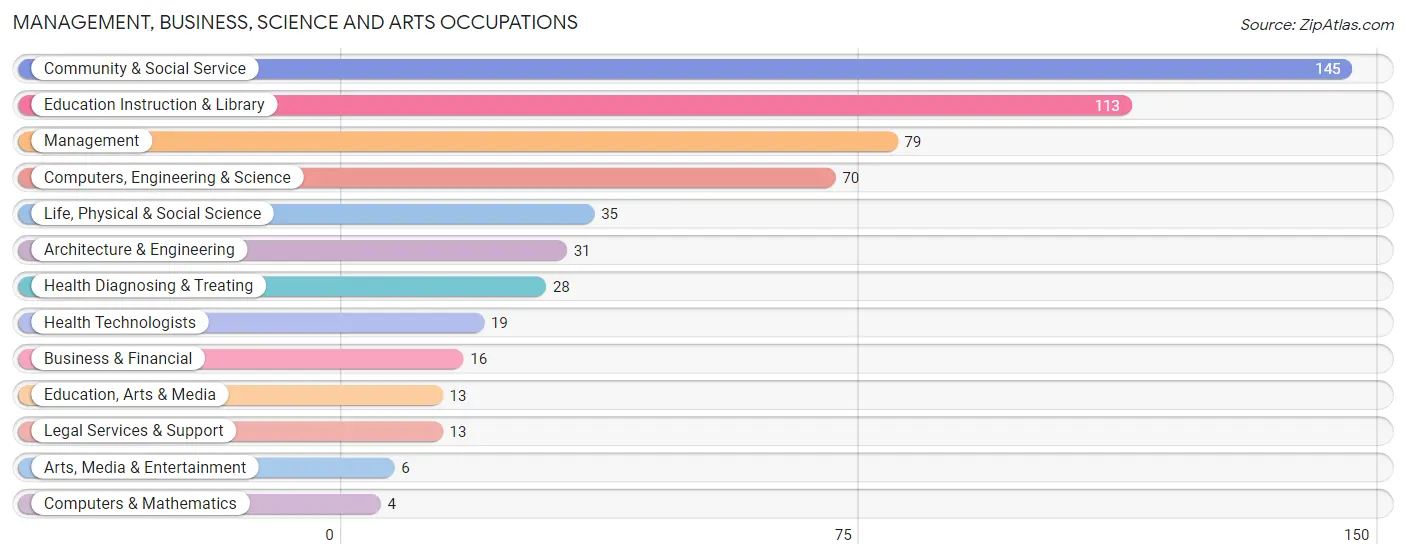
Management, Business, Science and Arts Occupations
The most common Management, Business, Science and Arts occupations in Burlington are Community & Social Service (145 | 13.0%), Education Instruction & Library (113 | 10.1%), Management (79 | 7.1%), Computers, Engineering & Science (70 | 6.3%), and Life, Physical & Social Science (35 | 3.1%).
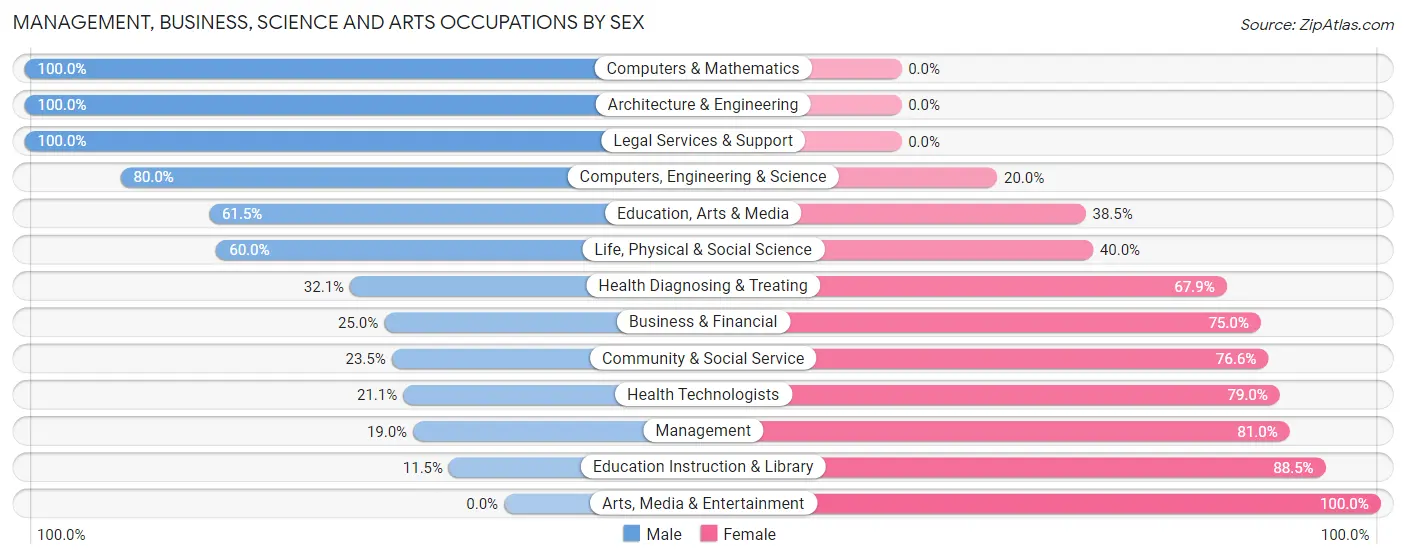
Management, Business, Science and Arts Occupations by Sex
Within the Management, Business, Science and Arts occupations in Burlington, the most male-oriented occupations are Computers & Mathematics (100.0%), Architecture & Engineering (100.0%), and Legal Services & Support (100.0%), while the most female-oriented occupations are Arts, Media & Entertainment (100.0%), Education Instruction & Library (88.5%), and Management (81.0%).
| Occupation | Male | Female |
| Management | 15 (19.0%) | 64 (81.0%) |
| Business & Financial | 4 (25.0%) | 12 (75.0%) |
| Computers, Engineering & Science | 56 (80.0%) | 14 (20.0%) |
| Computers & Mathematics | 4 (100.0%) | 0 (0.0%) |
| Architecture & Engineering | 31 (100.0%) | 0 (0.0%) |
| Life, Physical & Social Science | 21 (60.0%) | 14 (40.0%) |
| Community & Social Service | 34 (23.4%) | 111 (76.5%) |
| Education, Arts & Media | 8 (61.5%) | 5 (38.5%) |
| Legal Services & Support | 13 (100.0%) | 0 (0.0%) |
| Education Instruction & Library | 13 (11.5%) | 100 (88.5%) |
| Arts, Media & Entertainment | 0 (0.0%) | 6 (100.0%) |
| Health Diagnosing & Treating | 9 (32.1%) | 19 (67.9%) |
| Health Technologists | 4 (21.0%) | 15 (78.9%) |
| Total (Category) | 118 (34.9%) | 220 (65.1%) |
| Total (Overall) | 502 (45.1%) | 612 (54.9%) |
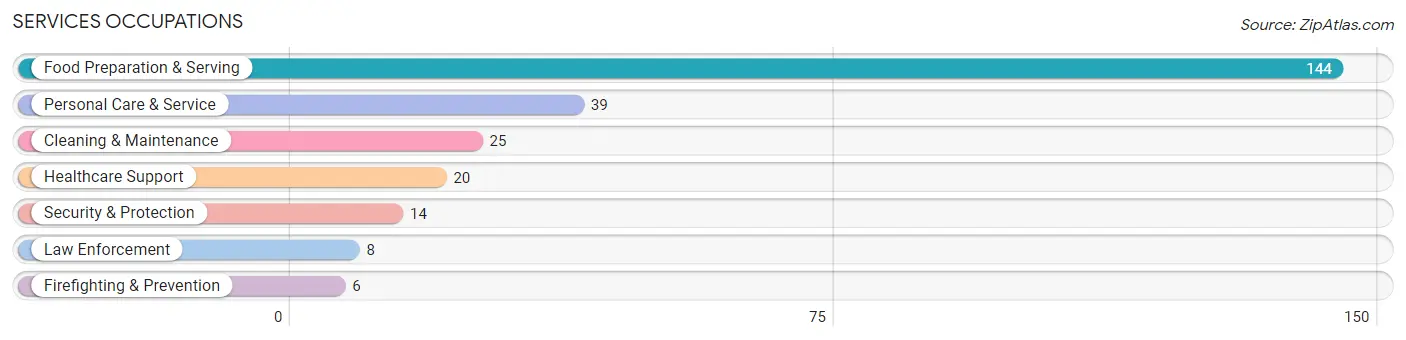
Services Occupations
The most common Services occupations in Burlington are Food Preparation & Serving (144 | 12.9%), Personal Care & Service (39 | 3.5%), Cleaning & Maintenance (25 | 2.2%), Healthcare Support (20 | 1.8%), and Security & Protection (14 | 1.3%).
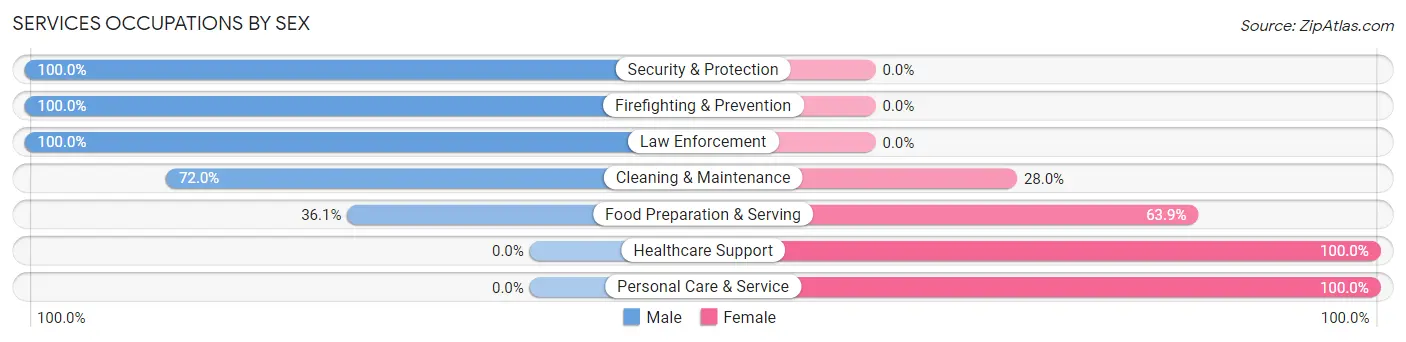
Services Occupations by Sex
Within the Services occupations in Burlington, the most male-oriented occupations are Security & Protection (100.0%), Firefighting & Prevention (100.0%), and Law Enforcement (100.0%), while the most female-oriented occupations are Healthcare Support (100.0%), Personal Care & Service (100.0%), and Food Preparation & Serving (63.9%).
| Occupation | Male | Female |
| Healthcare Support | 0 (0.0%) | 20 (100.0%) |
| Security & Protection | 14 (100.0%) | 0 (0.0%) |
| Firefighting & Prevention | 6 (100.0%) | 0 (0.0%) |
| Law Enforcement | 8 (100.0%) | 0 (0.0%) |
| Food Preparation & Serving | 52 (36.1%) | 92 (63.9%) |
| Cleaning & Maintenance | 18 (72.0%) | 7 (28.0%) |
| Personal Care & Service | 0 (0.0%) | 39 (100.0%) |
| Total (Category) | 84 (34.7%) | 158 (65.3%) |
| Total (Overall) | 502 (45.1%) | 612 (54.9%) |
Sales and Office Occupations
The most common Sales and Office occupations in Burlington are Office & Administration (161 | 14.4%), and Sales & Related (72 | 6.5%).

Sales and Office Occupations by Sex
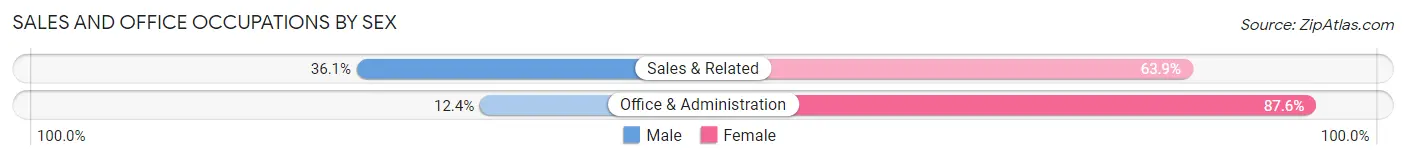
| Occupation | Male | Female |
| Sales & Related | 26 (36.1%) | 46 (63.9%) |
| Office & Administration | 20 (12.4%) | 141 (87.6%) |
| Total (Category) | 46 (19.7%) | 187 (80.3%) |
| Total (Overall) | 502 (45.1%) | 612 (54.9%) |
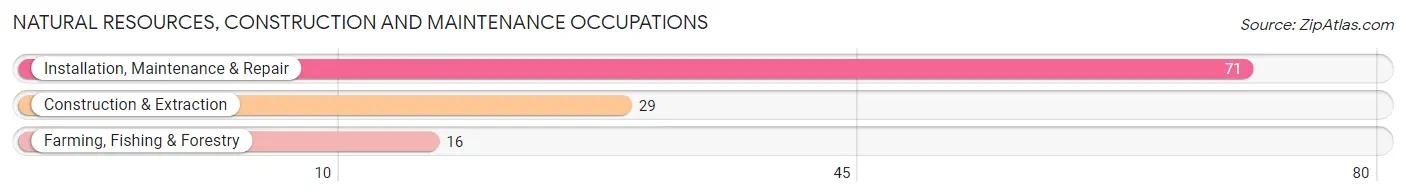
Natural Resources, Construction and Maintenance Occupations
The most common Natural Resources, Construction and Maintenance occupations in Burlington are Installation, Maintenance & Repair (71 | 6.4%), Construction & Extraction (29 | 2.6%), and Farming, Fishing & Forestry (16 | 1.4%).
Natural Resources, Construction and Maintenance Occupations by Sex
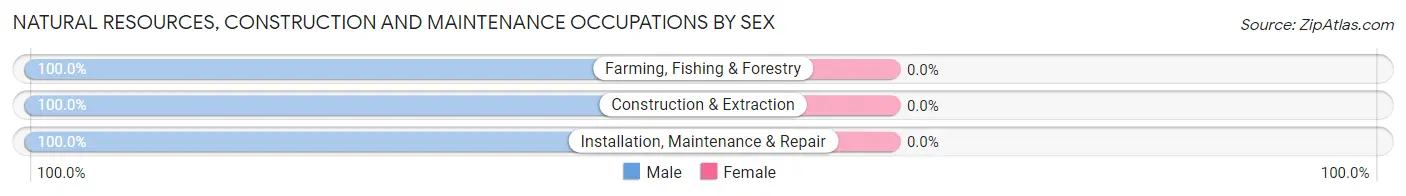
| Occupation | Male | Female |
| Farming, Fishing & Forestry | 16 (100.0%) | 0 (0.0%) |
| Construction & Extraction | 29 (100.0%) | 0 (0.0%) |
| Installation, Maintenance & Repair | 71 (100.0%) | 0 (0.0%) |
| Total (Category) | 116 (100.0%) | 0 (0.0%) |
| Total (Overall) | 502 (45.1%) | 612 (54.9%) |
Production, Transportation and Moving Occupations
The most common Production, Transportation and Moving occupations in Burlington are Production (79 | 7.1%), Material Moving (66 | 5.9%), and Transportation (40 | 3.6%).
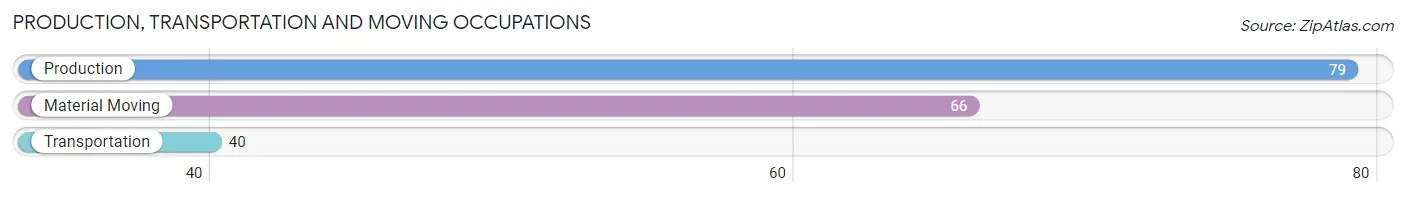
Production, Transportation and Moving Occupations by Sex
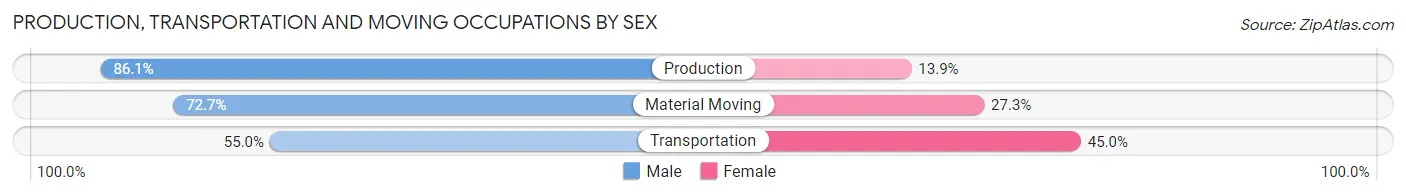
| Occupation | Male | Female |
| Production | 68 (86.1%) | 11 (13.9%) |
| Transportation | 22 (55.0%) | 18 (45.0%) |
| Material Moving | 48 (72.7%) | 18 (27.3%) |
| Total (Category) | 138 (74.6%) | 47 (25.4%) |
| Total (Overall) | 502 (45.1%) | 612 (54.9%) |
Employment Industries by Sex in Burlington
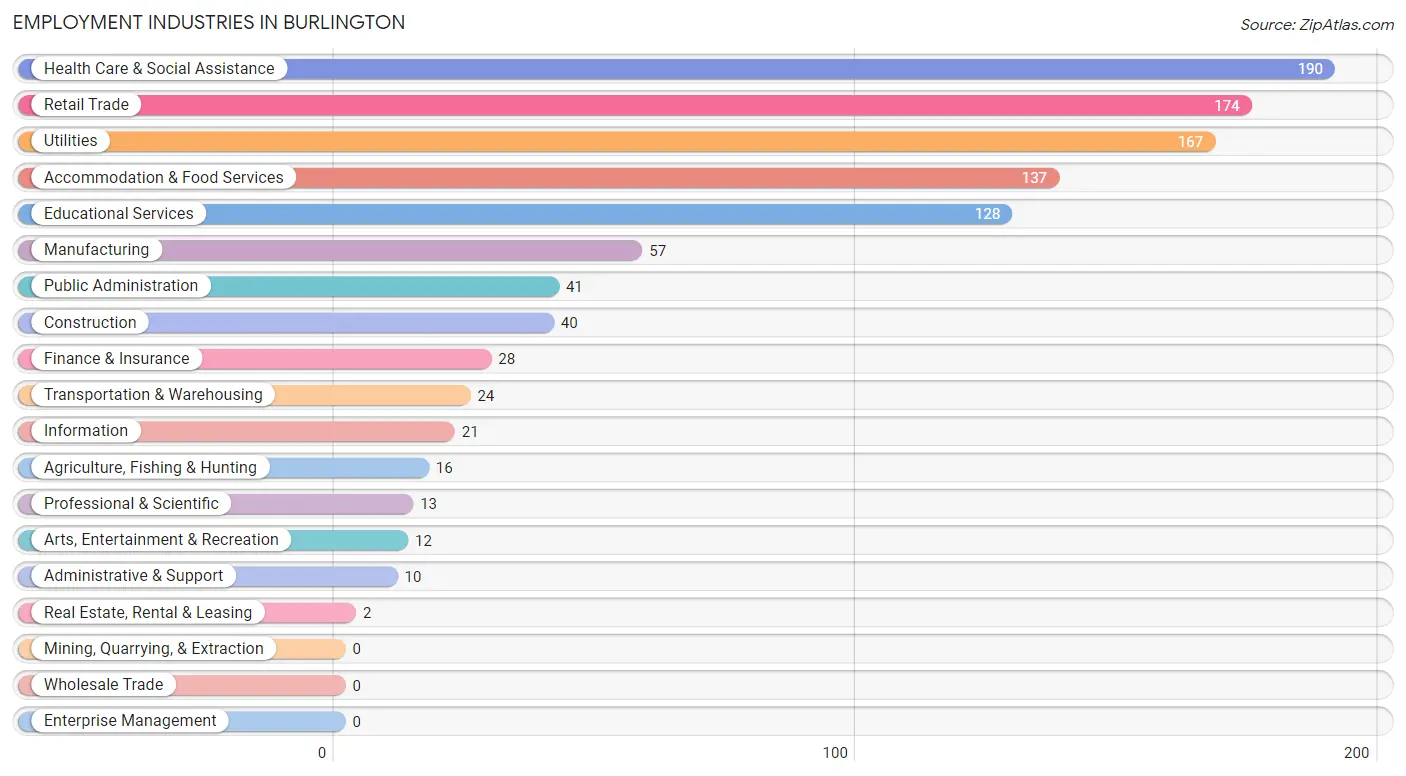
Employment Industries in Burlington
The major employment industries in Burlington include Health Care & Social Assistance (190 | 17.1%), Retail Trade (174 | 15.6%), Utilities (167 | 15.0%), Accommodation & Food Services (137 | 12.3%), and Educational Services (128 | 11.5%).
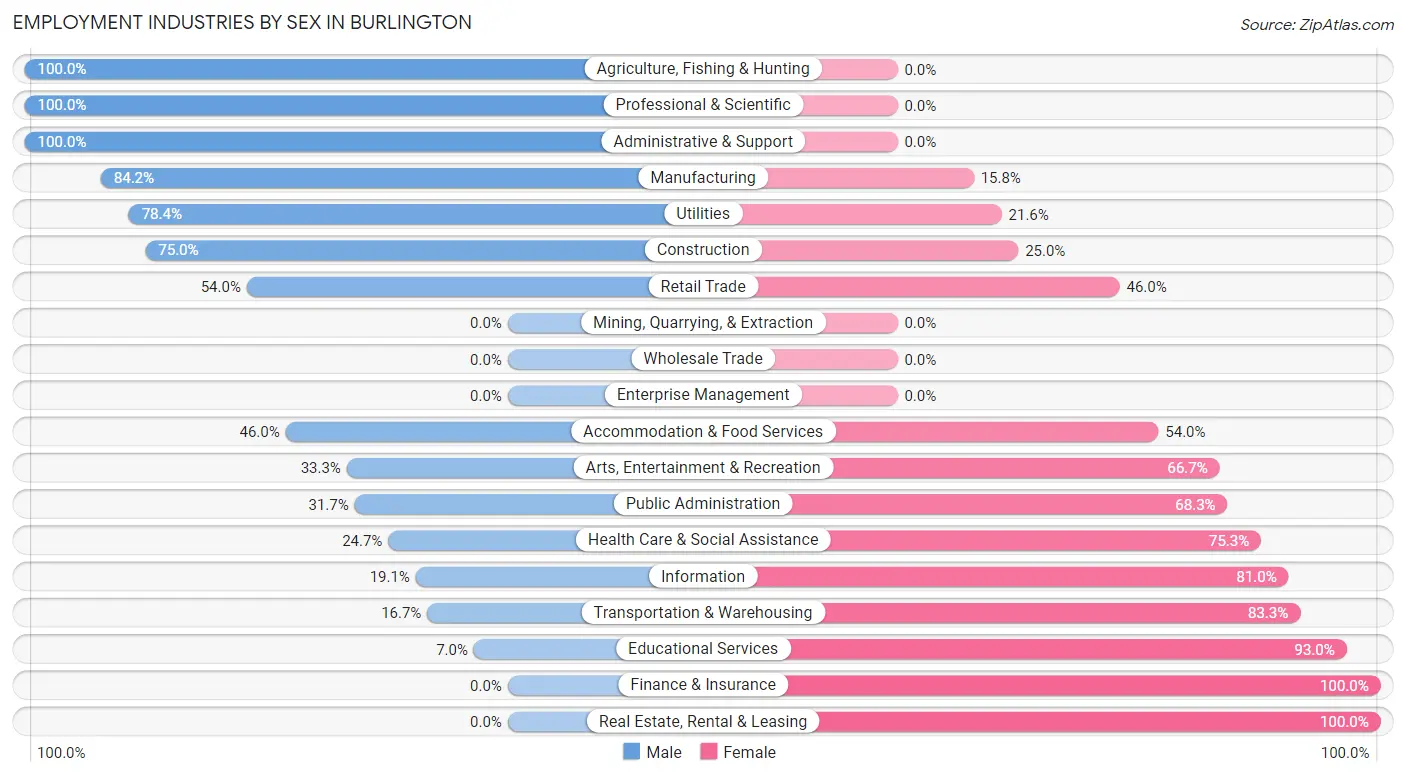
Employment Industries by Sex in Burlington
The Burlington industries that see more men than women are Agriculture, Fishing & Hunting (100.0%), Professional & Scientific (100.0%), and Administrative & Support (100.0%), whereas the industries that tend to have a higher number of women are Finance & Insurance (100.0%), Real Estate, Rental & Leasing (100.0%), and Educational Services (93.0%).
| Industry | Male | Female |
| Agriculture, Fishing & Hunting | 16 (100.0%) | 0 (0.0%) |
| Mining, Quarrying, & Extraction | 0 (0.0%) | 0 (0.0%) |
| Construction | 30 (75.0%) | 10 (25.0%) |
| Manufacturing | 48 (84.2%) | 9 (15.8%) |
| Wholesale Trade | 0 (0.0%) | 0 (0.0%) |
| Retail Trade | 94 (54.0%) | 80 (46.0%) |
| Transportation & Warehousing | 4 (16.7%) | 20 (83.3%) |
| Utilities | 131 (78.4%) | 36 (21.6%) |
| Information | 4 (19.1%) | 17 (80.9%) |
| Finance & Insurance | 0 (0.0%) | 28 (100.0%) |
| Real Estate, Rental & Leasing | 0 (0.0%) | 2 (100.0%) |
| Professional & Scientific | 13 (100.0%) | 0 (0.0%) |
| Enterprise Management | 0 (0.0%) | 0 (0.0%) |
| Administrative & Support | 10 (100.0%) | 0 (0.0%) |
| Educational Services | 9 (7.0%) | 119 (93.0%) |
| Health Care & Social Assistance | 47 (24.7%) | 143 (75.3%) |
| Arts, Entertainment & Recreation | 4 (33.3%) | 8 (66.7%) |
| Accommodation & Food Services | 63 (46.0%) | 74 (54.0%) |
| Public Administration | 13 (31.7%) | 28 (68.3%) |
| Total | 502 (45.1%) | 612 (54.9%) |
Education in Burlington
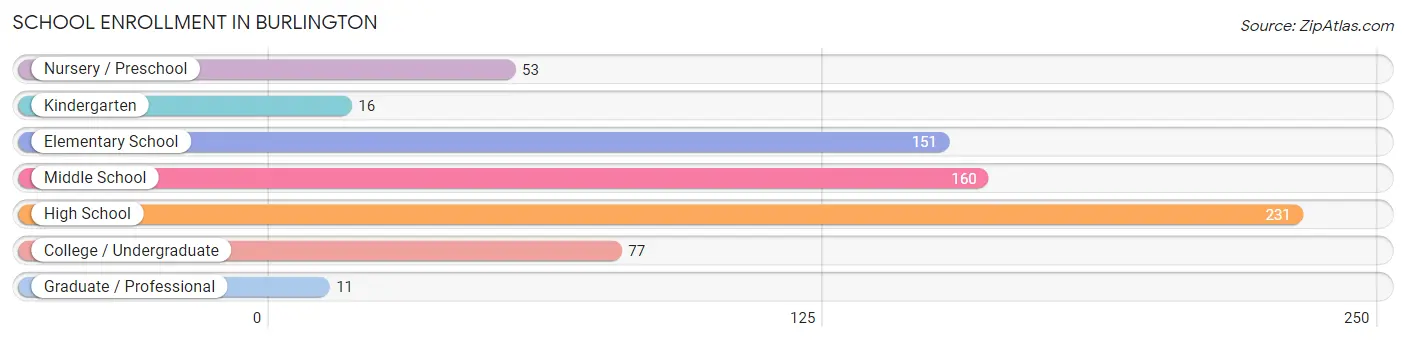
School Enrollment in Burlington
The most common levels of schooling among the 699 students in Burlington are high school (231 | 33.1%), middle school (160 | 22.9%), and elementary school (151 | 21.6%).
| School Level | # Students | % Students |
| Nursery / Preschool | 53 | 7.6% |
| Kindergarten | 16 | 2.3% |
| Elementary School | 151 | 21.6% |
| Middle School | 160 | 22.9% |
| High School | 231 | 33.1% |
| College / Undergraduate | 77 | 11.0% |
| Graduate / Professional | 11 | 1.6% |
| Total | 699 | 100.0% |
School Enrollment by Age by Funding Source in Burlington
Out of a total of 699 students who are enrolled in schools in Burlington, 58 (8.3%) attend a private institution, while the remaining 641 (91.7%) are enrolled in public schools. The age group of 25 to 34 year olds has the highest likelihood of being enrolled in private schools, with 1 (100.0% in the age bracket) enrolled. Conversely, the age group of 15 to 17 year olds has the lowest likelihood of being enrolled in a private school, with 171 (100.0% in the age bracket) attending a public institution.
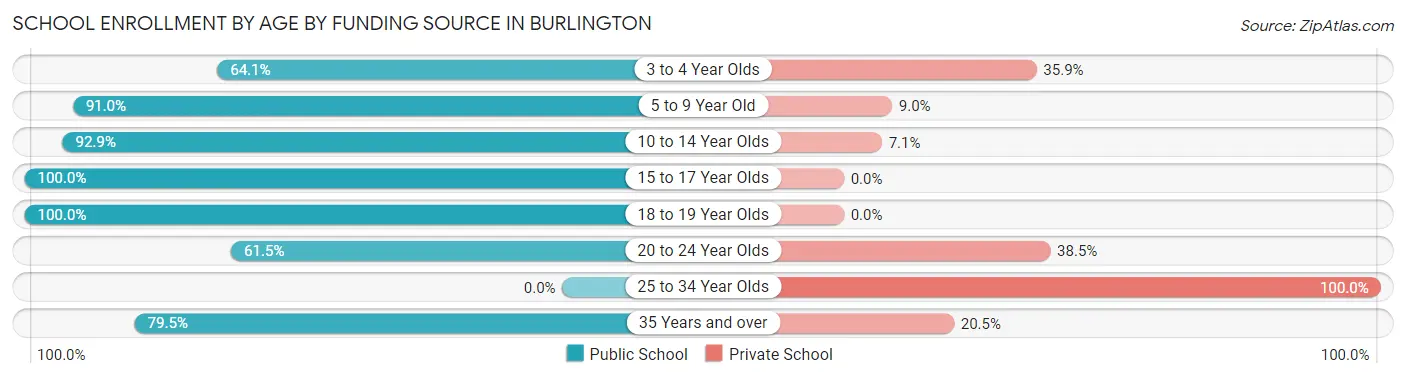
| Age Bracket | Public School | Private School |
| 3 to 4 Year Olds | 25 (64.1%) | 14 (35.9%) |
| 5 to 9 Year Old | 142 (91.0%) | 14 (9.0%) |
| 10 to 14 Year Olds | 210 (92.9%) | 16 (7.1%) |
| 15 to 17 Year Olds | 171 (100.0%) | 0 (0.0%) |
| 18 to 19 Year Olds | 54 (100.0%) | 0 (0.0%) |
| 20 to 24 Year Olds | 8 (61.5%) | 5 (38.5%) |
| 25 to 34 Year Olds | 0 (0.0%) | 1 (100.0%) |
| 35 Years and over | 31 (79.5%) | 8 (20.5%) |
| Total | 641 (91.7%) | 58 (8.3%) |
Educational Attainment by Field of Study in Burlington
Education (97 | 23.4%), business (80 | 19.3%), science & technology (76 | 18.3%), engineering (36 | 8.7%), and arts & humanities (24 | 5.8%) are the most common fields of study among 415 individuals in Burlington who have obtained a bachelor's degree or higher.
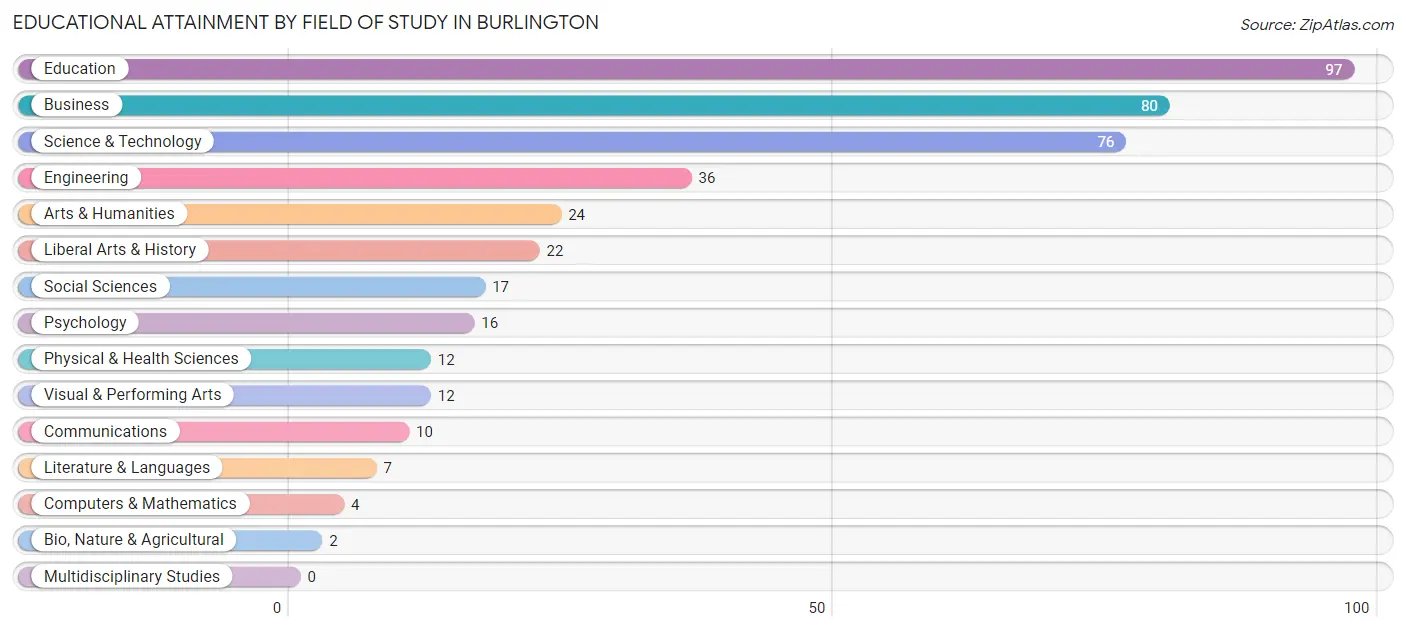
| Field of Study | # Graduates | % Graduates |
| Computers & Mathematics | 4 | 1.0% |
| Bio, Nature & Agricultural | 2 | 0.5% |
| Physical & Health Sciences | 12 | 2.9% |
| Psychology | 16 | 3.9% |
| Social Sciences | 17 | 4.1% |
| Engineering | 36 | 8.7% |
| Multidisciplinary Studies | 0 | 0.0% |
| Science & Technology | 76 | 18.3% |
| Business | 80 | 19.3% |
| Education | 97 | 23.4% |
| Literature & Languages | 7 | 1.7% |
| Liberal Arts & History | 22 | 5.3% |
| Visual & Performing Arts | 12 | 2.9% |
| Communications | 10 | 2.4% |
| Arts & Humanities | 24 | 5.8% |
| Total | 415 | 100.0% |
Transportation & Commute in Burlington
Vehicle Availability by Sex in Burlington
The most prevalent vehicle ownership categories in Burlington are males with 2 vehicles (172, accounting for 36.9%) and females with 2 vehicles (141, making up 29.7%).
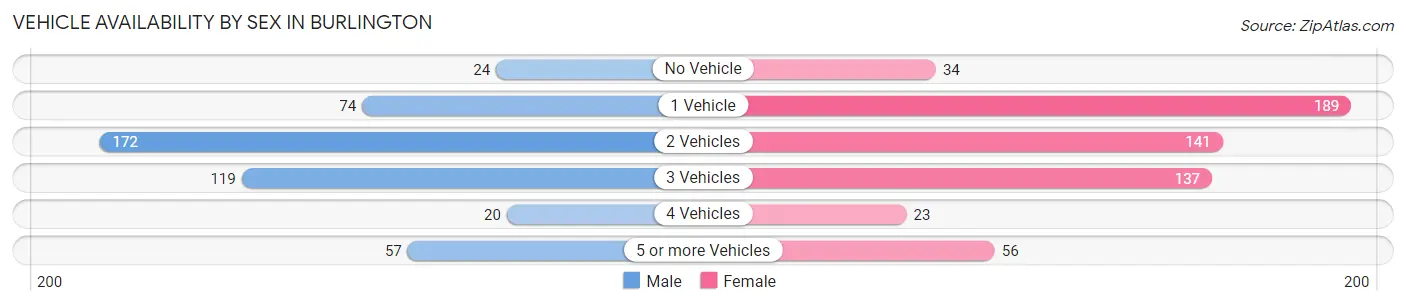
| Vehicles Available | Male | Female |
| No Vehicle | 24 (5.1%) | 34 (5.9%) |
| 1 Vehicle | 74 (15.9%) | 189 (32.6%) |
| 2 Vehicles | 172 (36.9%) | 141 (24.3%) |
| 3 Vehicles | 119 (25.5%) | 137 (23.6%) |
| 4 Vehicles | 20 (4.3%) | 23 (4.0%) |
| 5 or more Vehicles | 57 (12.2%) | 56 (9.7%) |
| Total | 466 (100.0%) | 580 (100.0%) |
Commute Time in Burlington
The most frequently occuring commute durations in Burlington are 5 to 9 minutes (389 commuters, 37.1%), less than 5 minutes (181 commuters, 17.3%), and 20 to 24 minutes (155 commuters, 14.8%).
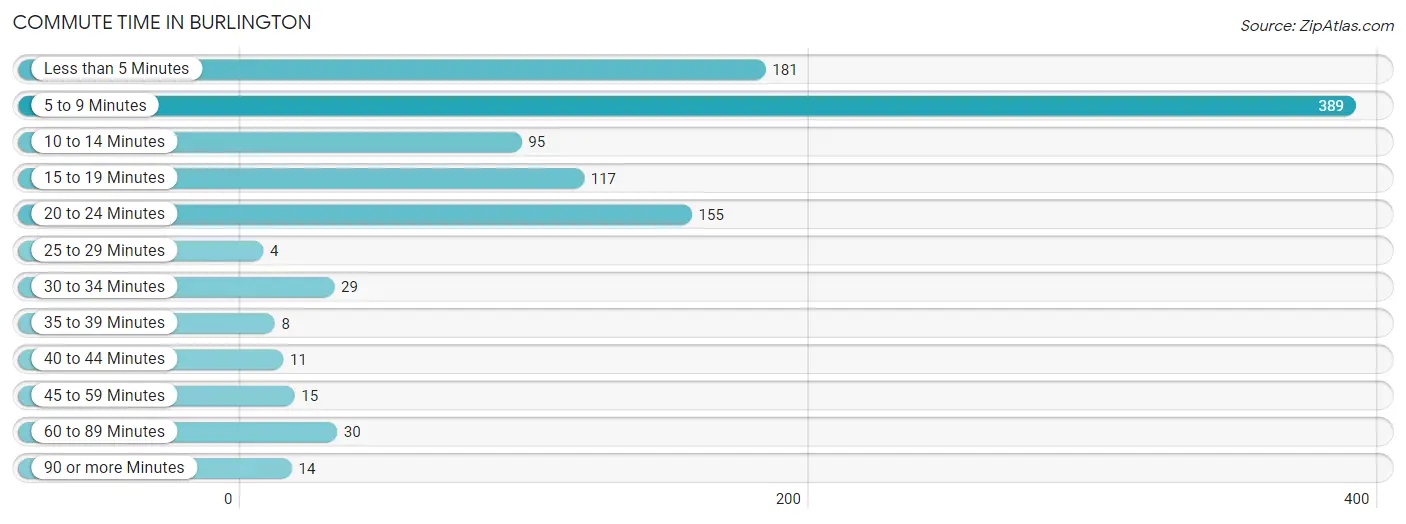
| Commute Time | # Commuters | % Commuters |
| Less than 5 Minutes | 181 | 17.3% |
| 5 to 9 Minutes | 389 | 37.1% |
| 10 to 14 Minutes | 95 | 9.1% |
| 15 to 19 Minutes | 117 | 11.2% |
| 20 to 24 Minutes | 155 | 14.8% |
| 25 to 29 Minutes | 4 | 0.4% |
| 30 to 34 Minutes | 29 | 2.8% |
| 35 to 39 Minutes | 8 | 0.8% |
| 40 to 44 Minutes | 11 | 1.1% |
| 45 to 59 Minutes | 15 | 1.4% |
| 60 to 89 Minutes | 30 | 2.9% |
| 90 or more Minutes | 14 | 1.3% |
Commute Time by Sex in Burlington
The most common commute times in Burlington are 5 to 9 minutes (155 commuters, 32.1%) for males and 5 to 9 minutes (234 commuters, 41.4%) for females.
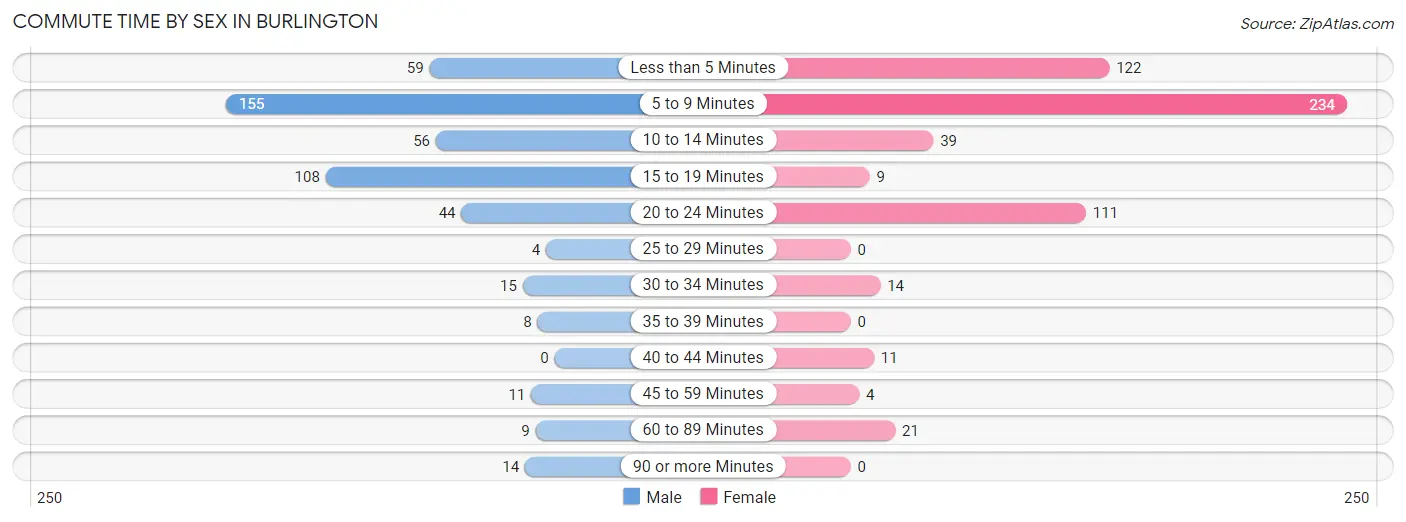
| Commute Time | Male | Female |
| Less than 5 Minutes | 59 (12.2%) | 122 (21.6%) |
| 5 to 9 Minutes | 155 (32.1%) | 234 (41.4%) |
| 10 to 14 Minutes | 56 (11.6%) | 39 (6.9%) |
| 15 to 19 Minutes | 108 (22.4%) | 9 (1.6%) |
| 20 to 24 Minutes | 44 (9.1%) | 111 (19.7%) |
| 25 to 29 Minutes | 4 (0.8%) | 0 (0.0%) |
| 30 to 34 Minutes | 15 (3.1%) | 14 (2.5%) |
| 35 to 39 Minutes | 8 (1.7%) | 0 (0.0%) |
| 40 to 44 Minutes | 0 (0.0%) | 11 (1.9%) |
| 45 to 59 Minutes | 11 (2.3%) | 4 (0.7%) |
| 60 to 89 Minutes | 9 (1.9%) | 21 (3.7%) |
| 90 or more Minutes | 14 (2.9%) | 0 (0.0%) |
Time of Departure to Work by Sex in Burlington
The most frequent times of departure to work in Burlington are 7:30 AM to 7:59 AM (79, 16.4%) for males and 7:30 AM to 7:59 AM (175, 31.0%) for females.
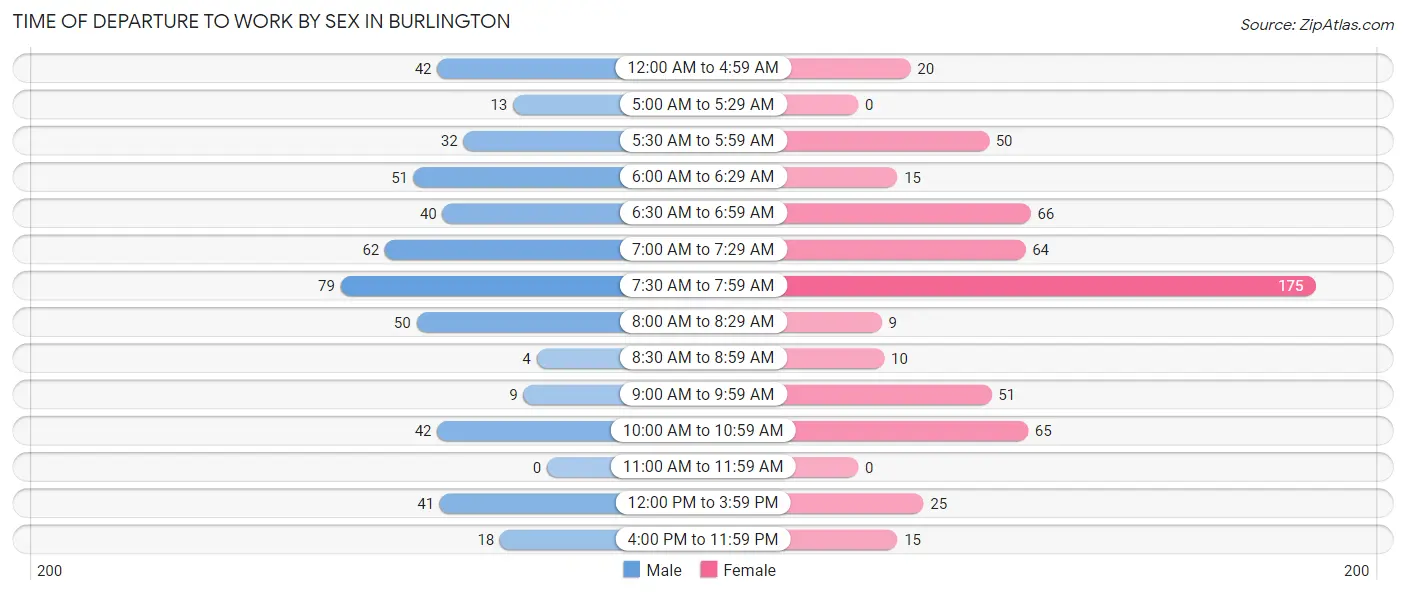
| Time of Departure | Male | Female |
| 12:00 AM to 4:59 AM | 42 (8.7%) | 20 (3.5%) |
| 5:00 AM to 5:29 AM | 13 (2.7%) | 0 (0.0%) |
| 5:30 AM to 5:59 AM | 32 (6.6%) | 50 (8.8%) |
| 6:00 AM to 6:29 AM | 51 (10.6%) | 15 (2.6%) |
| 6:30 AM to 6:59 AM | 40 (8.3%) | 66 (11.7%) |
| 7:00 AM to 7:29 AM | 62 (12.8%) | 64 (11.3%) |
| 7:30 AM to 7:59 AM | 79 (16.4%) | 175 (31.0%) |
| 8:00 AM to 8:29 AM | 50 (10.3%) | 9 (1.6%) |
| 8:30 AM to 8:59 AM | 4 (0.8%) | 10 (1.8%) |
| 9:00 AM to 9:59 AM | 9 (1.9%) | 51 (9.0%) |
| 10:00 AM to 10:59 AM | 42 (8.7%) | 65 (11.5%) |
| 11:00 AM to 11:59 AM | 0 (0.0%) | 0 (0.0%) |
| 12:00 PM to 3:59 PM | 41 (8.5%) | 25 (4.4%) |
| 4:00 PM to 11:59 PM | 18 (3.7%) | 15 (2.6%) |
| Total | 483 (100.0%) | 565 (100.0%) |
Housing Occupancy in Burlington
Occupancy by Ownership in Burlington
Of the total 1,010 dwellings in Burlington, owner-occupied units account for 588 (58.2%), while renter-occupied units make up 422 (41.8%).
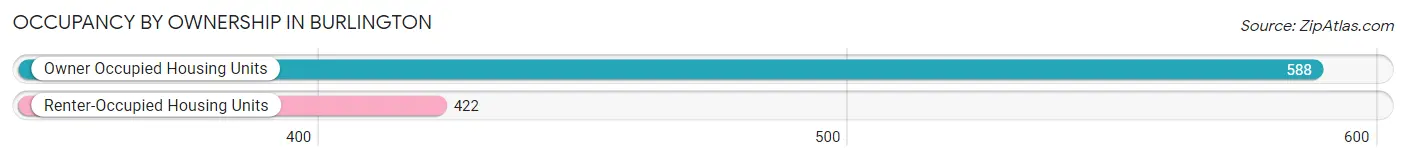
| Occupancy | # Housing Units | % Housing Units |
| Owner Occupied Housing Units | 588 | 58.2% |
| Renter-Occupied Housing Units | 422 | 41.8% |
| Total Occupied Housing Units | 1,010 | 100.0% |
Occupancy by Household Size in Burlington
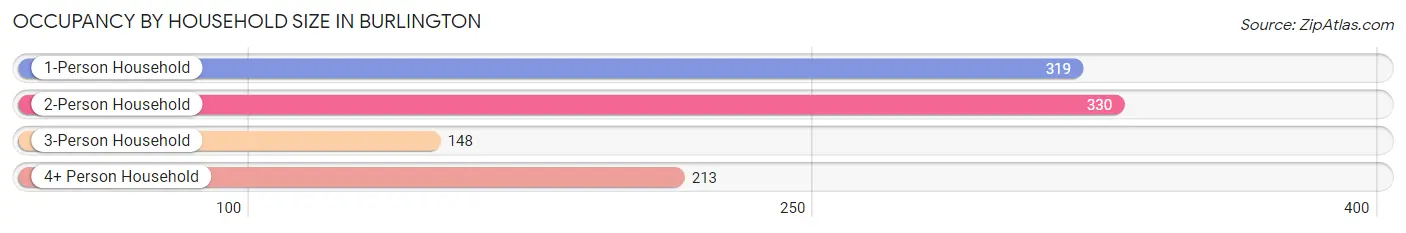
| Household Size | # Housing Units | % Housing Units |
| 1-Person Household | 319 | 31.6% |
| 2-Person Household | 330 | 32.7% |
| 3-Person Household | 148 | 14.6% |
| 4+ Person Household | 213 | 21.1% |
| Total Housing Units | 1,010 | 100.0% |
Occupancy by Ownership by Household Size in Burlington
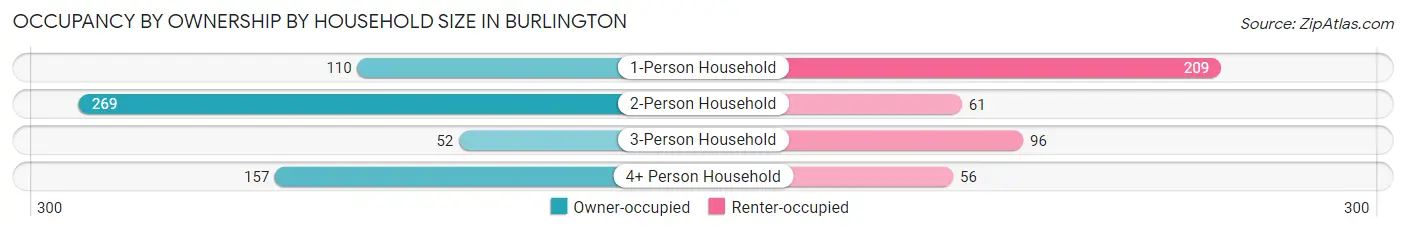
| Household Size | Owner-occupied | Renter-occupied |
| 1-Person Household | 110 (34.5%) | 209 (65.5%) |
| 2-Person Household | 269 (81.5%) | 61 (18.5%) |
| 3-Person Household | 52 (35.1%) | 96 (64.9%) |
| 4+ Person Household | 157 (73.7%) | 56 (26.3%) |
| Total Housing Units | 588 (58.2%) | 422 (41.8%) |
Occupancy by Educational Attainment in Burlington
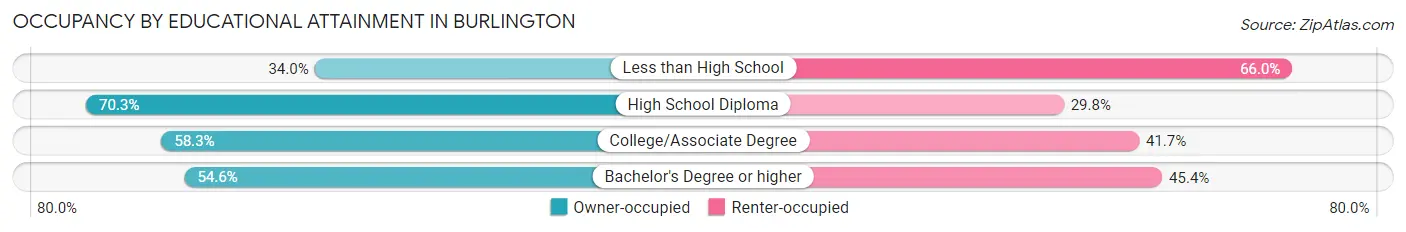
| Household Size | Owner-occupied | Renter-occupied |
| Less than High School | 33 (34.0%) | 64 (66.0%) |
| High School Diploma | 196 (70.3%) | 83 (29.7%) |
| College/Associate Degree | 200 (58.3%) | 143 (41.7%) |
| Bachelor's Degree or higher | 159 (54.6%) | 132 (45.4%) |
Occupancy by Age of Householder in Burlington
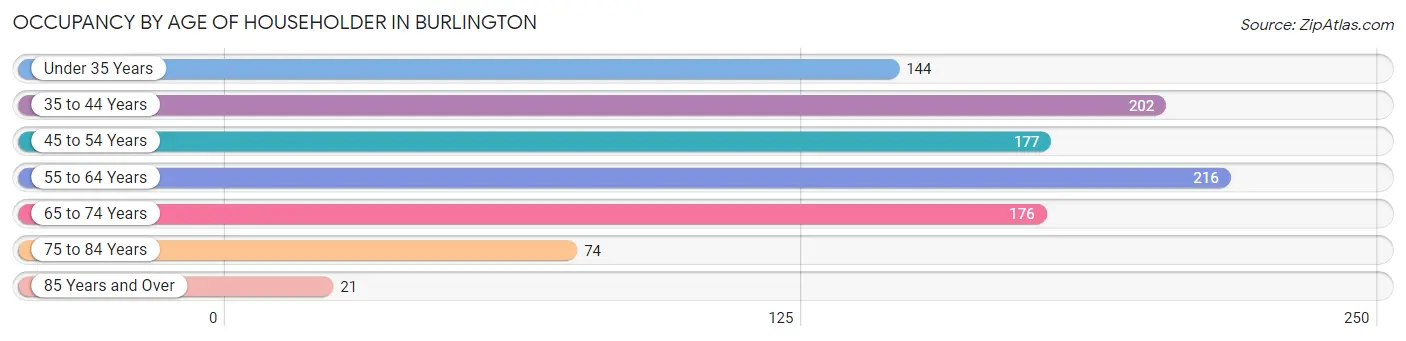
| Age Bracket | # Households | % Households |
| Under 35 Years | 144 | 14.3% |
| 35 to 44 Years | 202 | 20.0% |
| 45 to 54 Years | 177 | 17.5% |
| 55 to 64 Years | 216 | 21.4% |
| 65 to 74 Years | 176 | 17.4% |
| 75 to 84 Years | 74 | 7.3% |
| 85 Years and Over | 21 | 2.1% |
| Total | 1,010 | 100.0% |
Housing Finances in Burlington
Median Income by Occupancy in Burlington
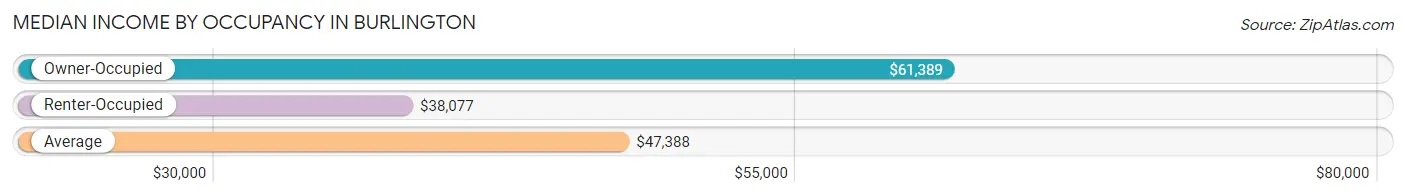
| Occupancy Type | # Households | Median Income |
| Owner-Occupied | 588 (58.2%) | $61,389 |
| Renter-Occupied | 422 (41.8%) | $38,077 |
| Average | 1,010 (100.0%) | $47,388 |
Occupancy by Householder Income Bracket in Burlington
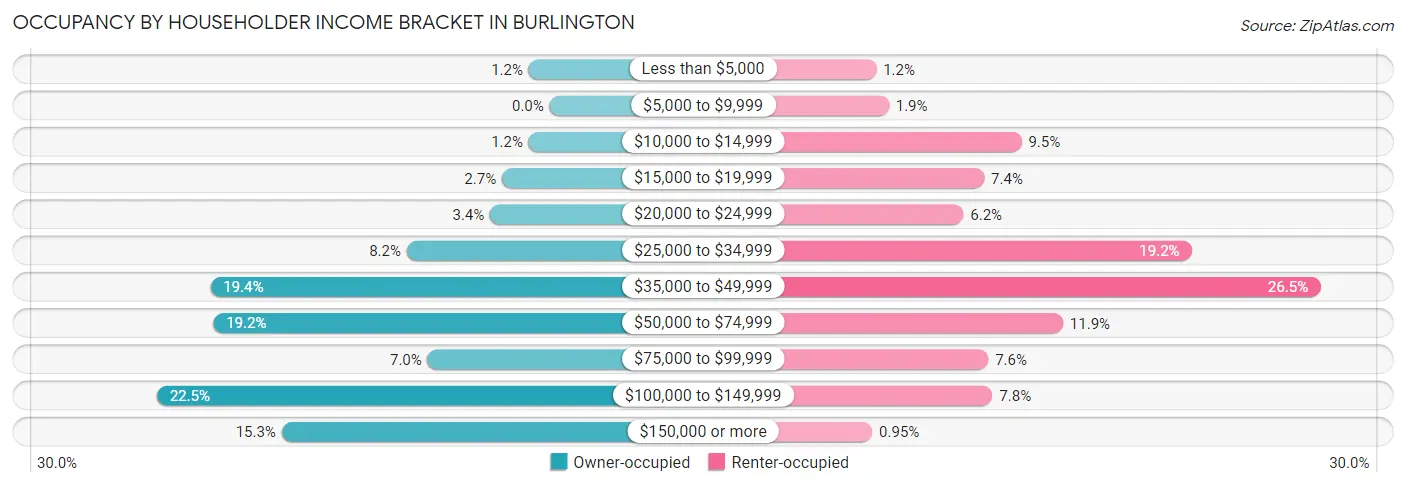
| Income Bracket | Owner-occupied | Renter-occupied |
| Less than $5,000 | 7 (1.2%) | 5 (1.2%) |
| $5,000 to $9,999 | 0 (0.0%) | 8 (1.9%) |
| $10,000 to $14,999 | 7 (1.2%) | 40 (9.5%) |
| $15,000 to $19,999 | 16 (2.7%) | 31 (7.3%) |
| $20,000 to $24,999 | 20 (3.4%) | 26 (6.2%) |
| $25,000 to $34,999 | 48 (8.2%) | 81 (19.2%) |
| $35,000 to $49,999 | 114 (19.4%) | 112 (26.5%) |
| $50,000 to $74,999 | 113 (19.2%) | 50 (11.8%) |
| $75,000 to $99,999 | 41 (7.0%) | 32 (7.6%) |
| $100,000 to $149,999 | 132 (22.5%) | 33 (7.8%) |
| $150,000 or more | 90 (15.3%) | 4 (0.9%) |
| Total | 588 (100.0%) | 422 (100.0%) |
Monthly Housing Cost Tiers in Burlington
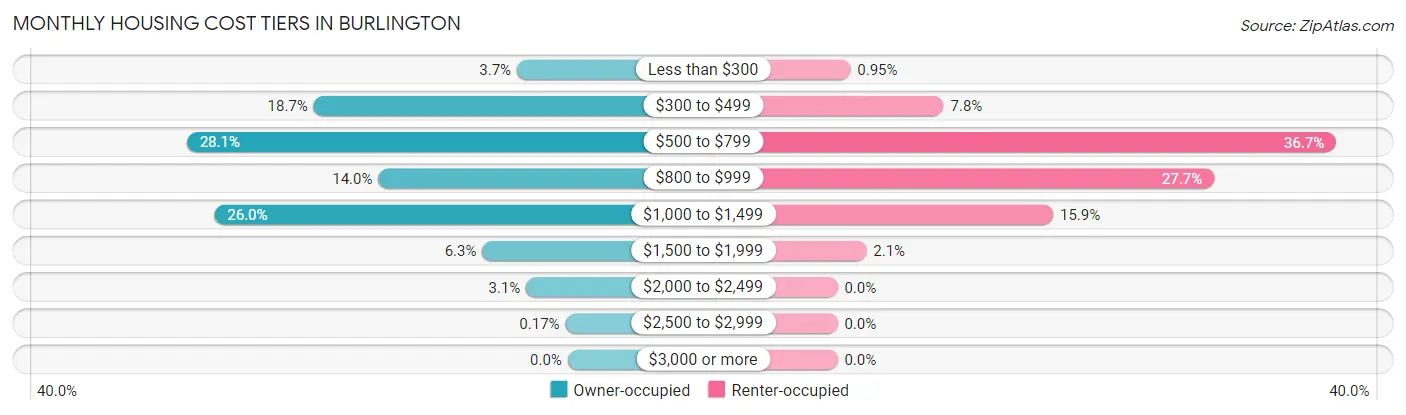
| Monthly Cost | Owner-occupied | Renter-occupied |
| Less than $300 | 22 (3.7%) | 4 (0.9%) |
| $300 to $499 | 110 (18.7%) | 33 (7.8%) |
| $500 to $799 | 165 (28.1%) | 155 (36.7%) |
| $800 to $999 | 82 (14.0%) | 117 (27.7%) |
| $1,000 to $1,499 | 153 (26.0%) | 67 (15.9%) |
| $1,500 to $1,999 | 37 (6.3%) | 9 (2.1%) |
| $2,000 to $2,499 | 18 (3.1%) | 0 (0.0%) |
| $2,500 to $2,999 | 1 (0.2%) | 0 (0.0%) |
| $3,000 or more | 0 (0.0%) | 0 (0.0%) |
| Total | 588 (100.0%) | 422 (100.0%) |
Physical Housing Characteristics in Burlington
Housing Structures in Burlington
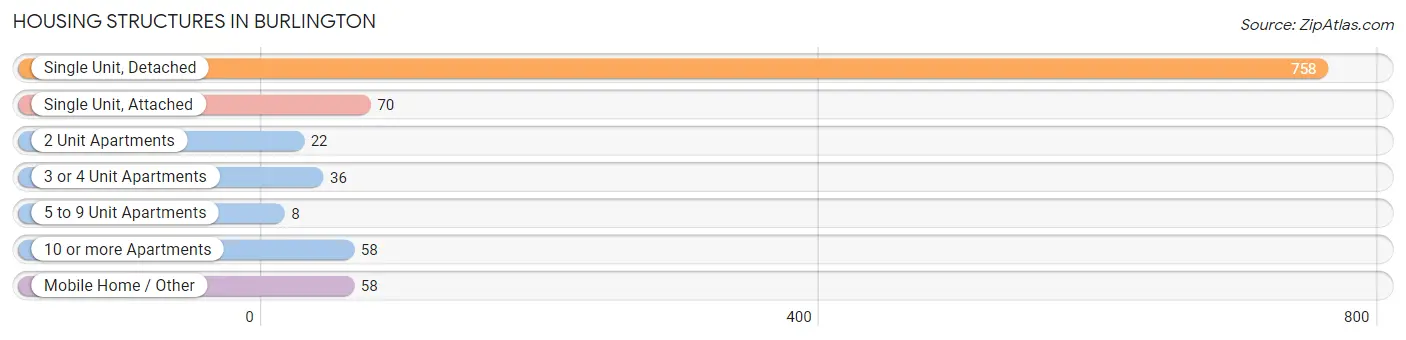
| Structure Type | # Housing Units | % Housing Units |
| Single Unit, Detached | 758 | 75.0% |
| Single Unit, Attached | 70 | 6.9% |
| 2 Unit Apartments | 22 | 2.2% |
| 3 or 4 Unit Apartments | 36 | 3.6% |
| 5 to 9 Unit Apartments | 8 | 0.8% |
| 10 or more Apartments | 58 | 5.7% |
| Mobile Home / Other | 58 | 5.7% |
| Total | 1,010 | 100.0% |
Housing Structures by Occupancy in Burlington
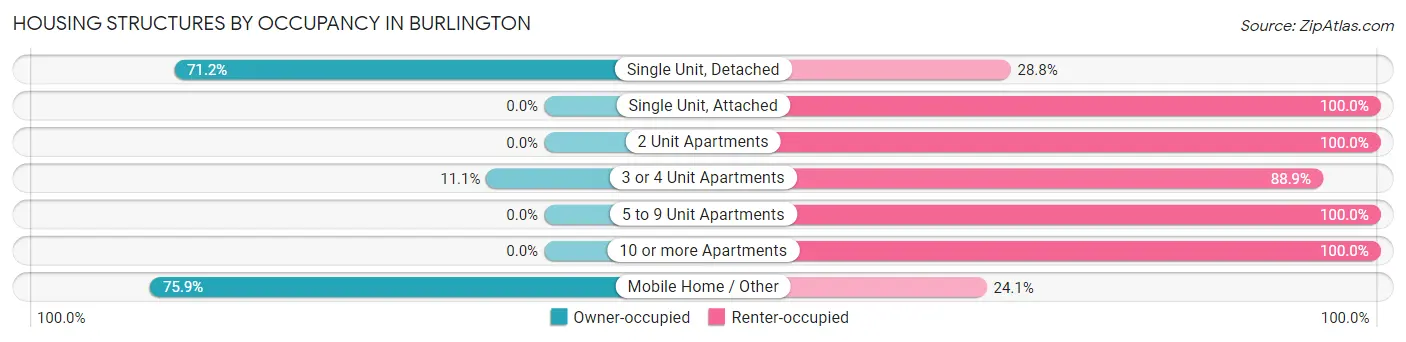
| Structure Type | Owner-occupied | Renter-occupied |
| Single Unit, Detached | 540 (71.2%) | 218 (28.8%) |
| Single Unit, Attached | 0 (0.0%) | 70 (100.0%) |
| 2 Unit Apartments | 0 (0.0%) | 22 (100.0%) |
| 3 or 4 Unit Apartments | 4 (11.1%) | 32 (88.9%) |
| 5 to 9 Unit Apartments | 0 (0.0%) | 8 (100.0%) |
| 10 or more Apartments | 0 (0.0%) | 58 (100.0%) |
| Mobile Home / Other | 44 (75.9%) | 14 (24.1%) |
| Total | 588 (58.2%) | 422 (41.8%) |
Housing Structures by Number of Rooms in Burlington
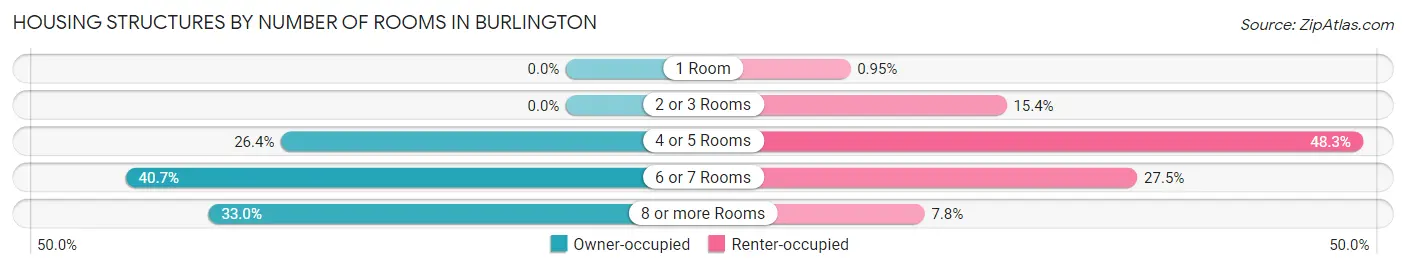
| Number of Rooms | Owner-occupied | Renter-occupied |
| 1 Room | 0 (0.0%) | 4 (0.9%) |
| 2 or 3 Rooms | 0 (0.0%) | 65 (15.4%) |
| 4 or 5 Rooms | 155 (26.4%) | 204 (48.3%) |
| 6 or 7 Rooms | 239 (40.6%) | 116 (27.5%) |
| 8 or more Rooms | 194 (33.0%) | 33 (7.8%) |
| Total | 588 (100.0%) | 422 (100.0%) |
Housing Structure by Heating Type in Burlington
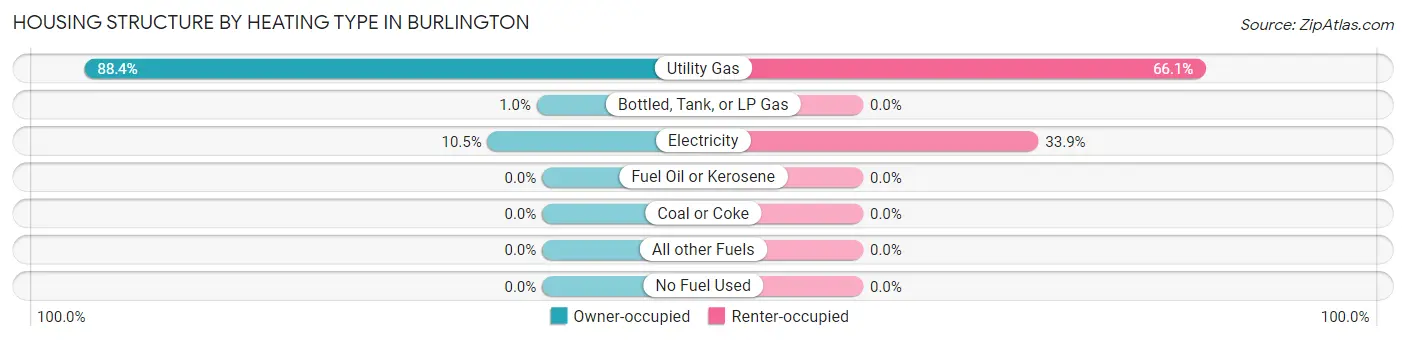
| Heating Type | Owner-occupied | Renter-occupied |
| Utility Gas | 520 (88.4%) | 279 (66.1%) |
| Bottled, Tank, or LP Gas | 6 (1.0%) | 0 (0.0%) |
| Electricity | 62 (10.5%) | 143 (33.9%) |
| Fuel Oil or Kerosene | 0 (0.0%) | 0 (0.0%) |
| Coal or Coke | 0 (0.0%) | 0 (0.0%) |
| All other Fuels | 0 (0.0%) | 0 (0.0%) |
| No Fuel Used | 0 (0.0%) | 0 (0.0%) |
| Total | 588 (100.0%) | 422 (100.0%) |
Household Vehicle Usage in Burlington
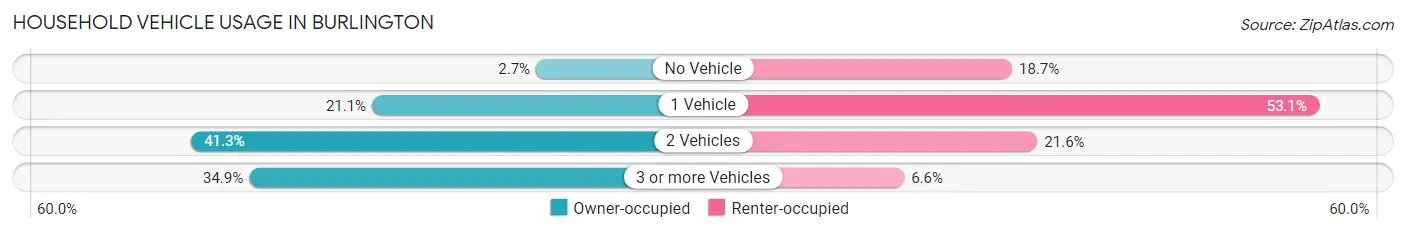
| Vehicles per Household | Owner-occupied | Renter-occupied |
| No Vehicle | 16 (2.7%) | 79 (18.7%) |
| 1 Vehicle | 124 (21.1%) | 224 (53.1%) |
| 2 Vehicles | 243 (41.3%) | 91 (21.6%) |
| 3 or more Vehicles | 205 (34.9%) | 28 (6.6%) |
| Total | 588 (100.0%) | 422 (100.0%) |
Real Estate & Mortgages in Burlington
Real Estate and Mortgage Overview in Burlington
| Characteristic | Without Mortgage | With Mortgage |
| Housing Units | 295 | 293 |
| Median Property Value | $133,900 | $113,700 |
| Median Household Income | $58,698 | $39 |
| Monthly Housing Costs | $524 | $0 |
| Real Estate Taxes | $1,277 | $19 |
Property Value by Mortgage Status in Burlington
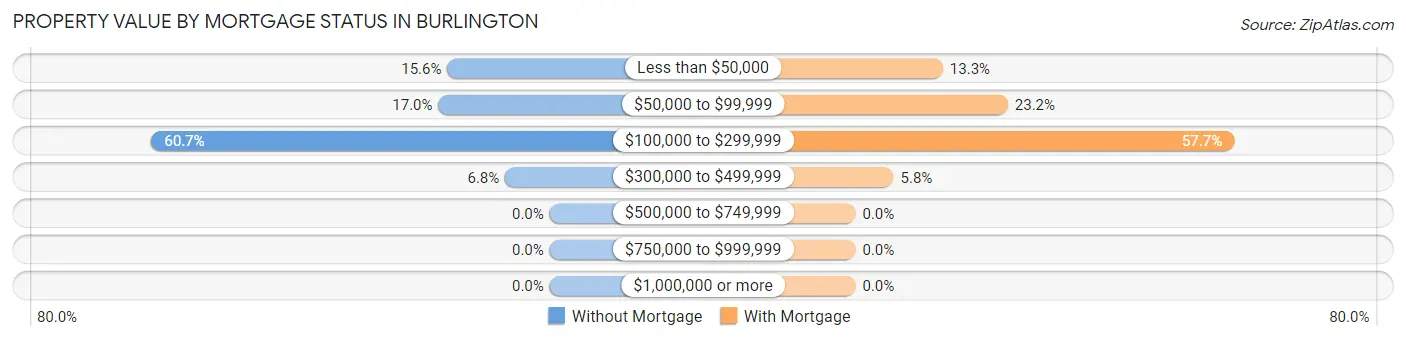
| Property Value | Without Mortgage | With Mortgage |
| Less than $50,000 | 46 (15.6%) | 39 (13.3%) |
| $50,000 to $99,999 | 50 (17.0%) | 68 (23.2%) |
| $100,000 to $299,999 | 179 (60.7%) | 169 (57.7%) |
| $300,000 to $499,999 | 20 (6.8%) | 17 (5.8%) |
| $500,000 to $749,999 | 0 (0.0%) | 0 (0.0%) |
| $750,000 to $999,999 | 0 (0.0%) | 0 (0.0%) |
| $1,000,000 or more | 0 (0.0%) | 0 (0.0%) |
| Total | 295 (100.0%) | 293 (100.0%) |
Household Income by Mortgage Status in Burlington
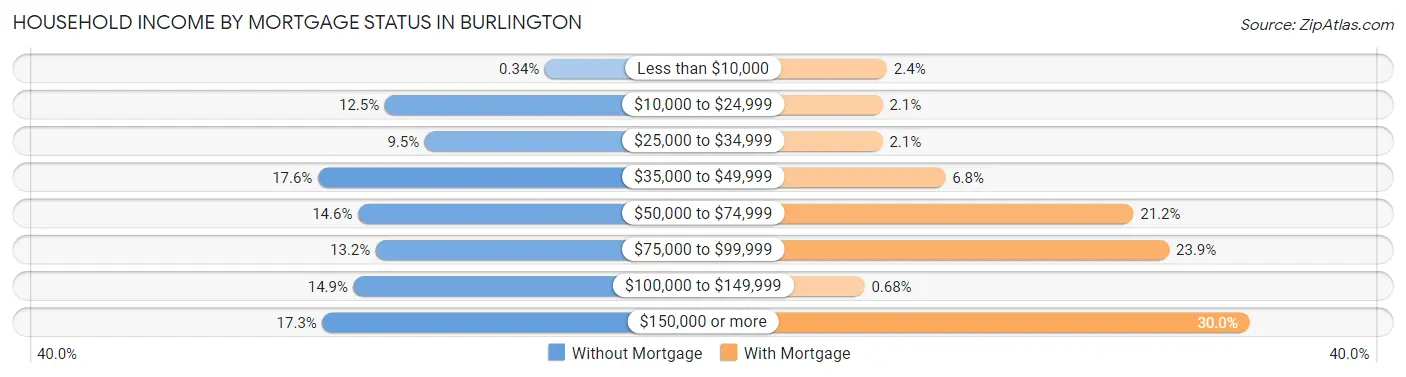
| Household Income | Without Mortgage | With Mortgage |
| Less than $10,000 | 1 (0.3%) | 7 (2.4%) |
| $10,000 to $24,999 | 37 (12.5%) | 6 (2.1%) |
| $25,000 to $34,999 | 28 (9.5%) | 6 (2.1%) |
| $35,000 to $49,999 | 52 (17.6%) | 20 (6.8%) |
| $50,000 to $74,999 | 43 (14.6%) | 62 (21.2%) |
| $75,000 to $99,999 | 39 (13.2%) | 70 (23.9%) |
| $100,000 to $149,999 | 44 (14.9%) | 2 (0.7%) |
| $150,000 or more | 51 (17.3%) | 88 (30.0%) |
| Total | 295 (100.0%) | 293 (100.0%) |
Property Value to Household Income Ratio in Burlington
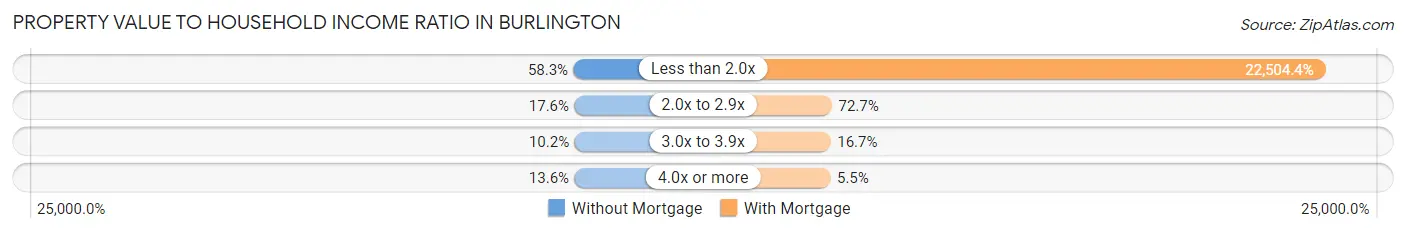
| Value-to-Income Ratio | Without Mortgage | With Mortgage |
| Less than 2.0x | 172 (58.3%) | 65,938 (22,504.4%) |
| 2.0x to 2.9x | 52 (17.6%) | 213 (72.7%) |
| 3.0x to 3.9x | 30 (10.2%) | 49 (16.7%) |
| 4.0x or more | 40 (13.6%) | 16 (5.5%) |
| Total | 295 (100.0%) | 293 (100.0%) |
Real Estate Taxes by Mortgage Status in Burlington
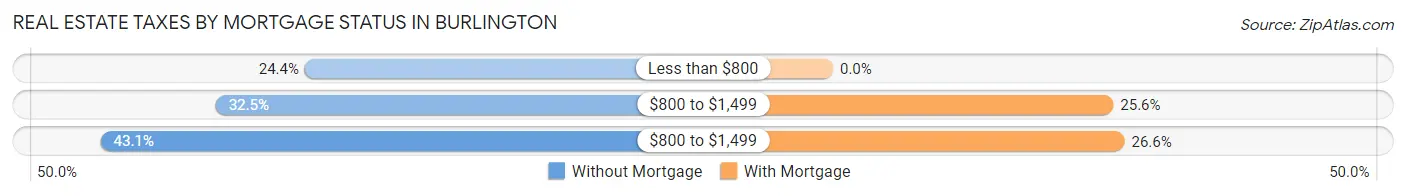
| Property Taxes | Without Mortgage | With Mortgage |
| Less than $800 | 72 (24.4%) | 0 (0.0%) |
| $800 to $1,499 | 96 (32.5%) | 75 (25.6%) |
| $800 to $1,499 | 127 (43.0%) | 78 (26.6%) |
| Total | 295 (100.0%) | 293 (100.0%) |
Health & Disability in Burlington
Health Insurance Coverage by Age in Burlington
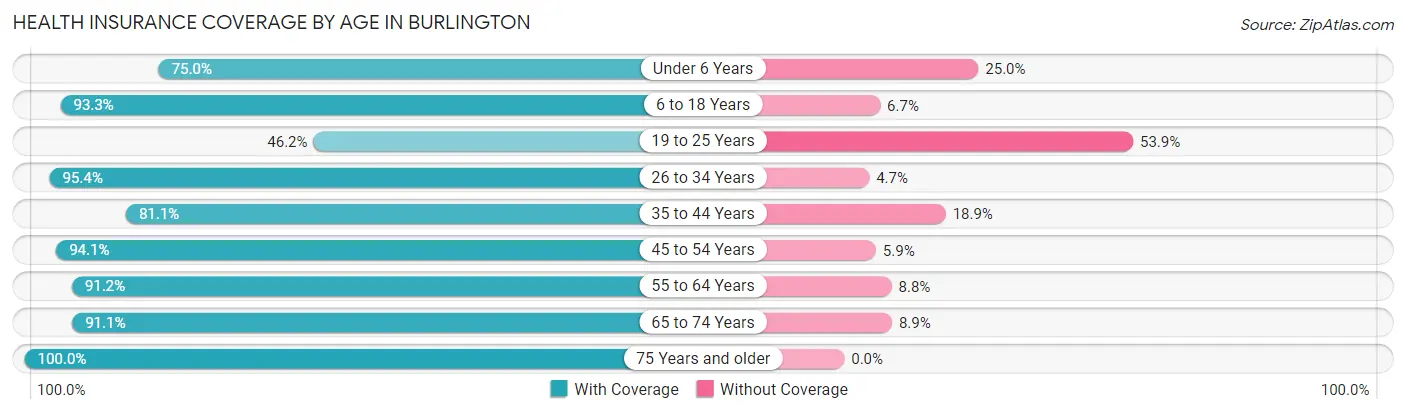
| Age Bracket | With Coverage | Without Coverage |
| Under 6 Years | 156 (75.0%) | 52 (25.0%) |
| 6 to 18 Years | 530 (93.3%) | 38 (6.7%) |
| 19 to 25 Years | 78 (46.2%) | 91 (53.8%) |
| 26 to 34 Years | 205 (95.4%) | 10 (4.6%) |
| 35 to 44 Years | 253 (81.1%) | 59 (18.9%) |
| 45 to 54 Years | 287 (94.1%) | 18 (5.9%) |
| 55 to 64 Years | 310 (91.2%) | 30 (8.8%) |
| 65 to 74 Years | 246 (91.1%) | 24 (8.9%) |
| 75 Years and older | 159 (100.0%) | 0 (0.0%) |
| Total | 2,224 (87.4%) | 322 (12.7%) |
Health Insurance Coverage by Citizenship Status in Burlington
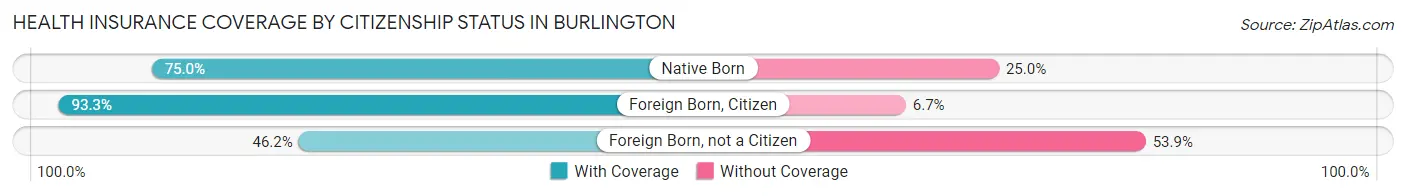
| Citizenship Status | With Coverage | Without Coverage |
| Native Born | 156 (75.0%) | 52 (25.0%) |
| Foreign Born, Citizen | 530 (93.3%) | 38 (6.7%) |
| Foreign Born, not a Citizen | 78 (46.2%) | 91 (53.8%) |
Health Insurance Coverage by Household Income in Burlington
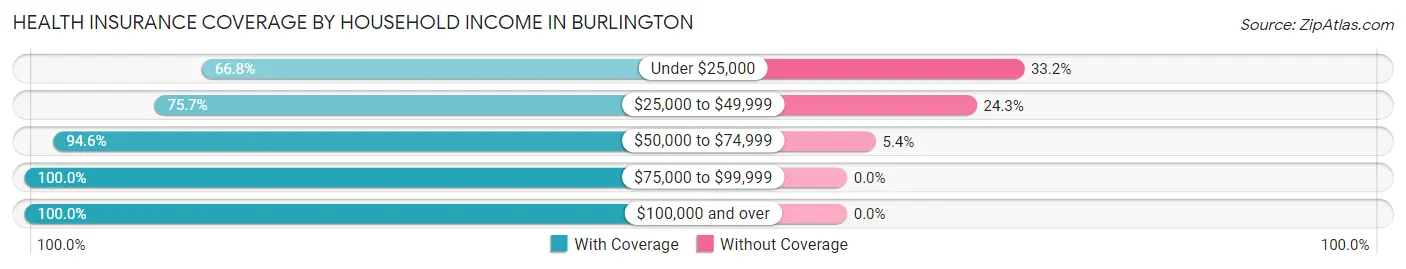
| Household Income | With Coverage | Without Coverage |
| Under $25,000 | 163 (66.8%) | 81 (33.2%) |
| $25,000 to $49,999 | 641 (75.7%) | 206 (24.3%) |
| $50,000 to $74,999 | 492 (94.6%) | 28 (5.4%) |
| $75,000 to $99,999 | 165 (100.0%) | 0 (0.0%) |
| $100,000 and over | 727 (100.0%) | 0 (0.0%) |
Public vs Private Health Insurance Coverage by Age in Burlington
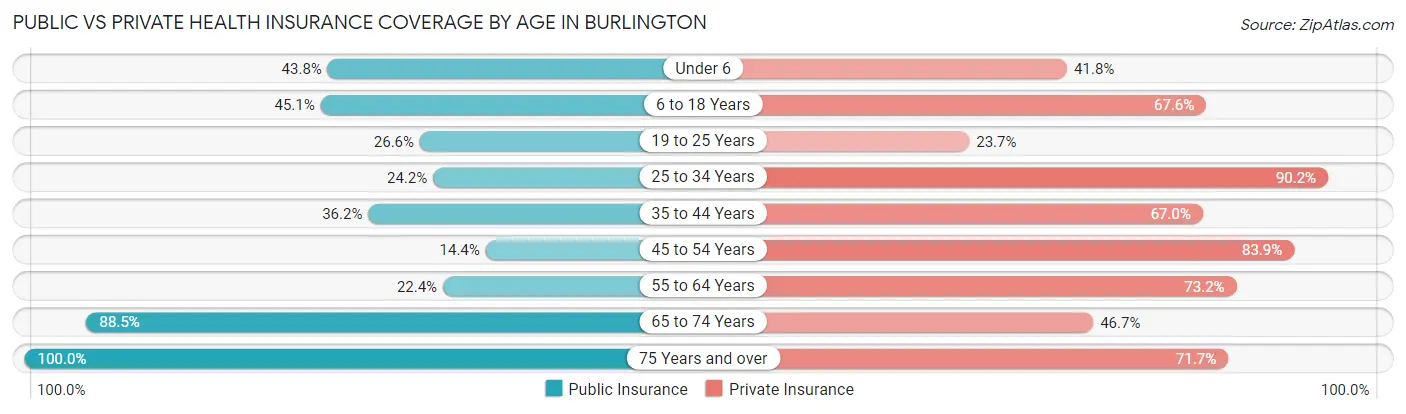
| Age Bracket | Public Insurance | Private Insurance |
| Under 6 | 91 (43.8%) | 87 (41.8%) |
| 6 to 18 Years | 256 (45.1%) | 384 (67.6%) |
| 19 to 25 Years | 45 (26.6%) | 40 (23.7%) |
| 25 to 34 Years | 52 (24.2%) | 194 (90.2%) |
| 35 to 44 Years | 113 (36.2%) | 209 (67.0%) |
| 45 to 54 Years | 44 (14.4%) | 256 (83.9%) |
| 55 to 64 Years | 76 (22.4%) | 249 (73.2%) |
| 65 to 74 Years | 239 (88.5%) | 126 (46.7%) |
| 75 Years and over | 159 (100.0%) | 114 (71.7%) |
| Total | 1,075 (42.2%) | 1,659 (65.2%) |
Disability Status by Sex by Age in Burlington
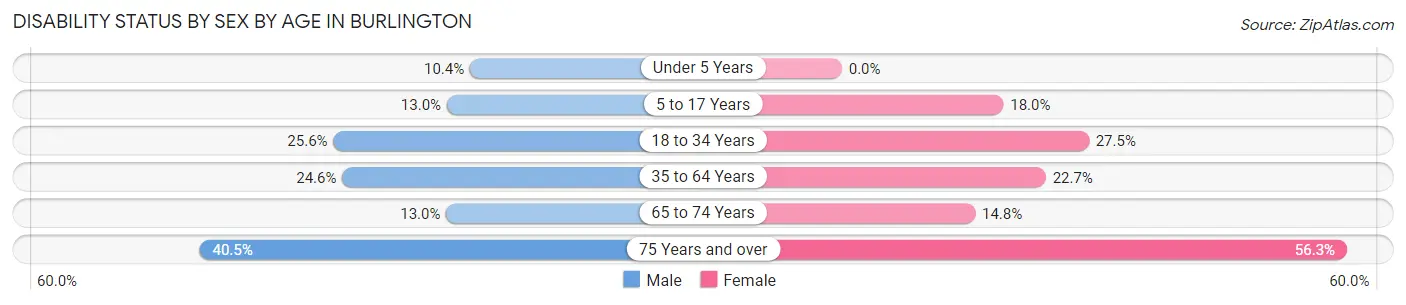
| Age Bracket | Male | Female |
| Under 5 Years | 8 (10.4%) | 0 (0.0%) |
| 5 to 17 Years | 38 (13.0%) | 50 (18.0%) |
| 18 to 34 Years | 63 (25.6%) | 44 (27.5%) |
| 35 to 64 Years | 112 (24.6%) | 114 (22.7%) |
| 65 to 74 Years | 15 (13.0%) | 23 (14.8%) |
| 75 Years and over | 32 (40.5%) | 45 (56.2%) |
Disability Class by Sex by Age in Burlington
Disability Class: Hearing Difficulty
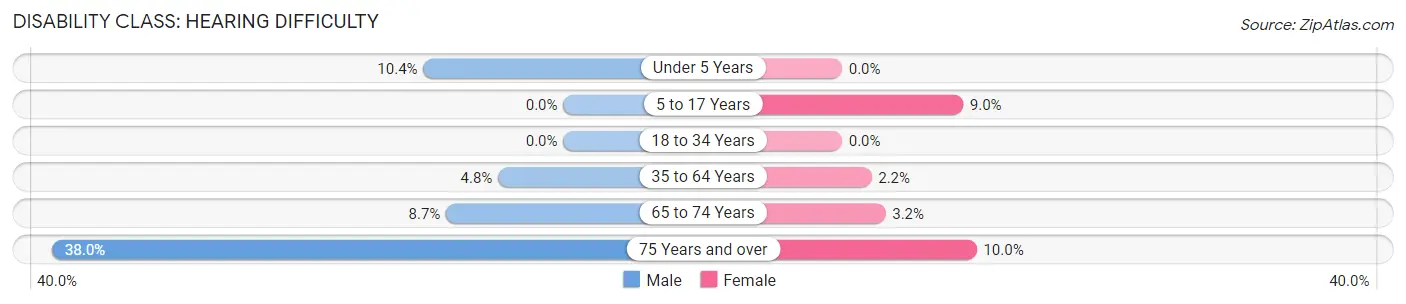
| Age Bracket | Male | Female |
| Under 5 Years | 8 (10.4%) | 0 (0.0%) |
| 5 to 17 Years | 0 (0.0%) | 25 (9.0%) |
| 18 to 34 Years | 0 (0.0%) | 0 (0.0%) |
| 35 to 64 Years | 22 (4.8%) | 11 (2.2%) |
| 65 to 74 Years | 10 (8.7%) | 5 (3.2%) |
| 75 Years and over | 30 (38.0%) | 8 (10.0%) |
Disability Class: Vision Difficulty
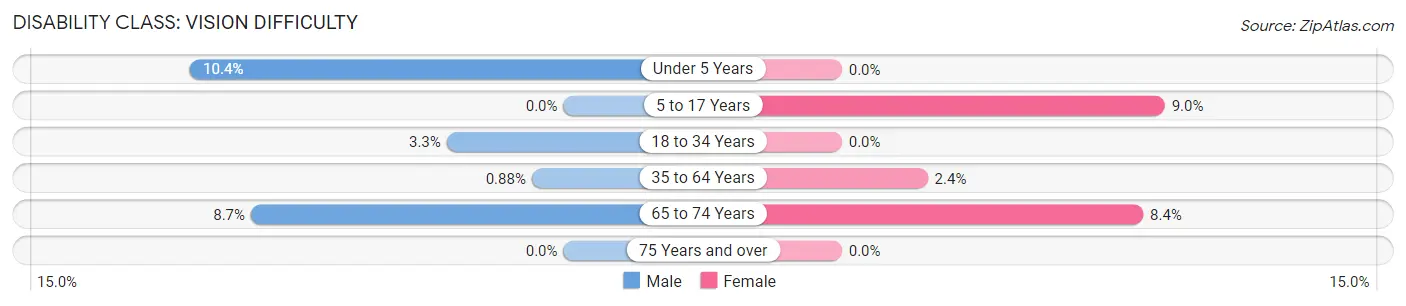
| Age Bracket | Male | Female |
| Under 5 Years | 8 (10.4%) | 0 (0.0%) |
| 5 to 17 Years | 0 (0.0%) | 25 (9.0%) |
| 18 to 34 Years | 8 (3.3%) | 0 (0.0%) |
| 35 to 64 Years | 4 (0.9%) | 12 (2.4%) |
| 65 to 74 Years | 10 (8.7%) | 13 (8.4%) |
| 75 Years and over | 0 (0.0%) | 0 (0.0%) |
Disability Class: Cognitive Difficulty
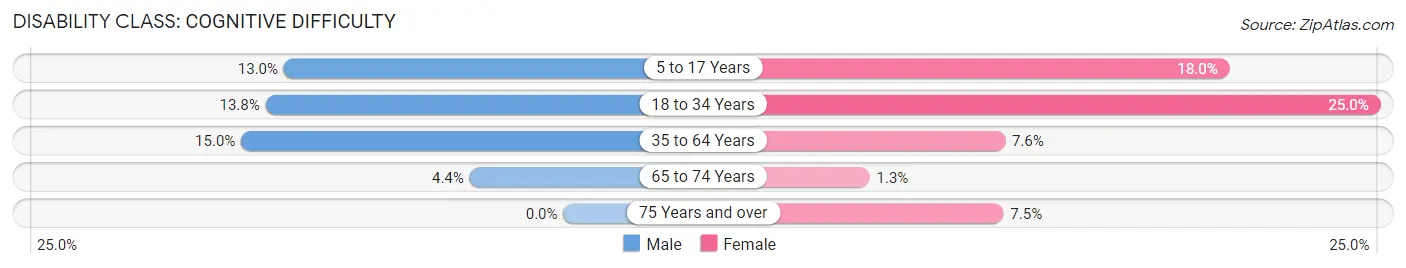
| Age Bracket | Male | Female |
| 5 to 17 Years | 38 (13.0%) | 50 (18.0%) |
| 18 to 34 Years | 34 (13.8%) | 40 (25.0%) |
| 35 to 64 Years | 68 (14.9%) | 38 (7.6%) |
| 65 to 74 Years | 5 (4.3%) | 2 (1.3%) |
| 75 Years and over | 0 (0.0%) | 6 (7.5%) |
Disability Class: Ambulatory Difficulty
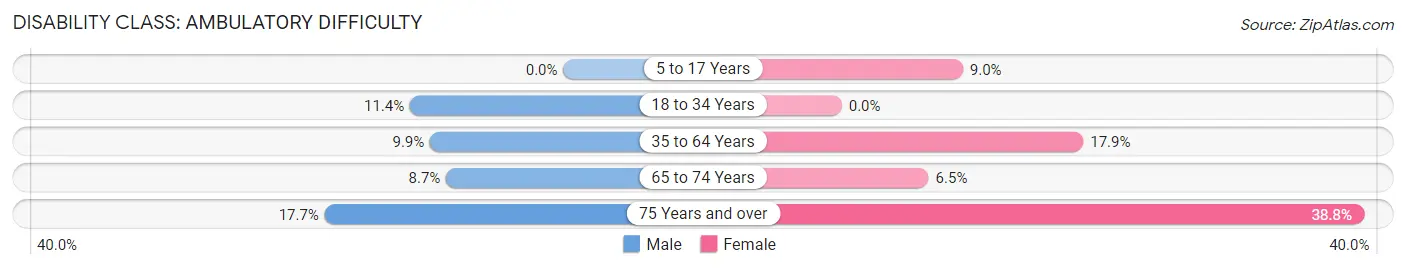
| Age Bracket | Male | Female |
| 5 to 17 Years | 0 (0.0%) | 25 (9.0%) |
| 18 to 34 Years | 28 (11.4%) | 0 (0.0%) |
| 35 to 64 Years | 45 (9.9%) | 90 (17.9%) |
| 65 to 74 Years | 10 (8.7%) | 10 (6.5%) |
| 75 Years and over | 14 (17.7%) | 31 (38.8%) |
Disability Class: Self-Care Difficulty
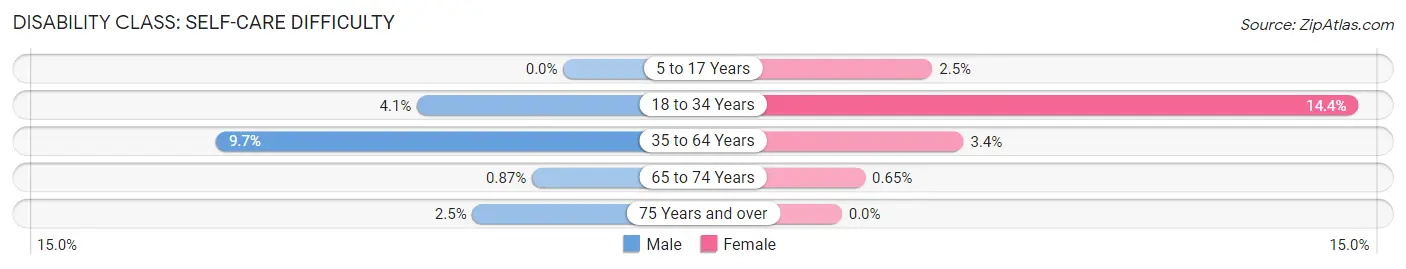
| Age Bracket | Male | Female |
| 5 to 17 Years | 0 (0.0%) | 7 (2.5%) |
| 18 to 34 Years | 10 (4.1%) | 23 (14.4%) |
| 35 to 64 Years | 44 (9.7%) | 17 (3.4%) |
| 65 to 74 Years | 1 (0.9%) | 1 (0.6%) |
| 75 Years and over | 2 (2.5%) | 0 (0.0%) |
Technology Access in Burlington
Computing Device Access in Burlington
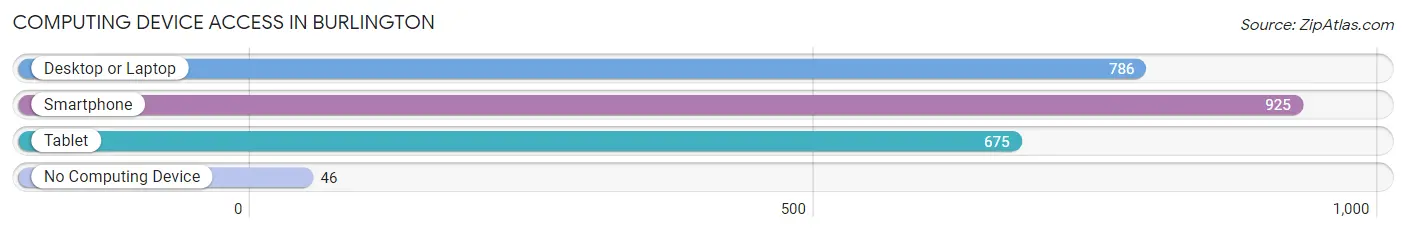
| Device Type | # Households | % Households |
| Desktop or Laptop | 786 | 77.8% |
| Smartphone | 925 | 91.6% |
| Tablet | 675 | 66.8% |
| No Computing Device | 46 | 4.5% |
| Total | 1,010 | 100.0% |
Internet Access in Burlington
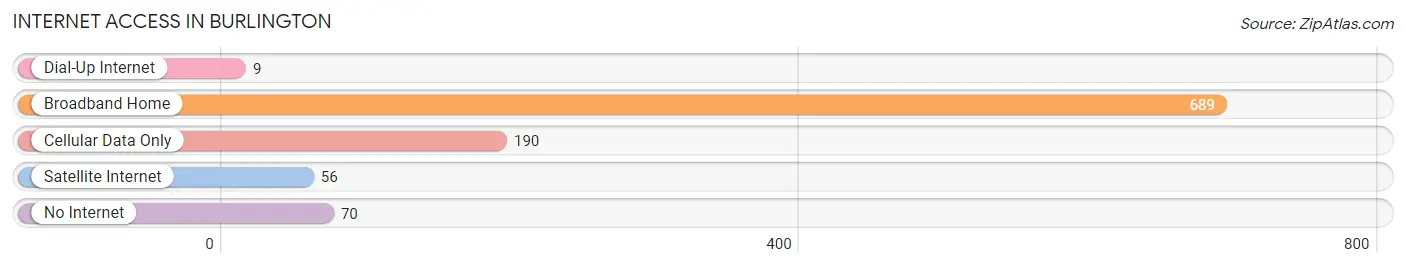
| Internet Type | # Households | % Households |
| Dial-Up Internet | 9 | 0.9% |
| Broadband Home | 689 | 68.2% |
| Cellular Data Only | 190 | 18.8% |
| Satellite Internet | 56 | 5.5% |
| No Internet | 70 | 6.9% |
| Total | 1,010 | 100.0% |
Burlington Summary
Burlington, Kansas is a small city located in Coffey County, Kansas. It is situated on the banks of the Neosho River, approximately 30 miles south of Topeka. The city has a population of 1,845 people, according to the 2010 census.
History
Burlington was founded in 1857 by a group of settlers from Burlington, Iowa. The town was originally named Burlington City, but the name was changed to Burlington in 1859. The city was incorporated in 1872.
The city was an important stop on the Santa Fe Trail, and was the site of a major battle between the Union and Confederate forces during the Civil War. The city was also the site of a major railroad junction, which connected the Santa Fe Trail to the Union Pacific Railroad.
Geography
Burlington is located in the eastern part of Coffey County, Kansas. It is situated on the banks of the Neosho River, approximately 30 miles south of Topeka. The city has a total area of 1.2 square miles, all of which is land.
The city has a humid continental climate, with hot summers and cold winters. The average temperature in the summer is around 80 degrees Fahrenheit, and the average temperature in the winter is around 30 degrees Fahrenheit.
Economy
The economy of Burlington is largely based on agriculture. The city is home to several large farms, which produce corn, soybeans, wheat, and other crops. The city also has several small businesses, including restaurants, retail stores, and service providers.
The city is also home to a number of manufacturing companies, including a plastics manufacturer, a metal fabrication company, and a food processing plant.
Demographics
According to the 2010 census, the population of Burlington was 1,845 people. The racial makeup of the city was 95.3% White, 0.7% African American, 0.3% Native American, 0.2% Asian, 0.1% Pacific Islander, 1.2% from other races, and 2.4% from two or more races. Hispanic or Latino of any race were 3.2% of the population.
The median income for a household in the city was $37,500, and the median income for a family was $45,000. The per capita income for the city was $18,845. About 11.2% of families and 14.2% of the population were below the poverty line, including 18.2% of those under age 18 and 8.3% of those age 65 or over.
Burlington is a small city with a rich history and a diverse economy. The city is home to a number of farms, businesses, and manufacturing companies, and has a population of 1,845 people. The city has a humid continental climate, with hot summers and cold winters. The median income for a household in the city is $37,500, and the median income for a family is $45,000.
Common Questions
What is Per Capita Income in Burlington?
Per Capita income in Burlington is $28,361.
What is the Median Family Income in Burlington?
Median Family Income in Burlington is $59,426.
What is the Median Household income in Burlington?
Median Household Income in Burlington is $47,388.
What is Income or Wage Gap in Burlington?
Income or Wage Gap in Burlington is 13.7%.
Women in Burlington earn 86.3 cents for every dollar earned by a man.
What is Inequality or Gini Index in Burlington?
Inequality or Gini Index in Burlington is 0.40.
What is the Total Population of Burlington?
Total Population of Burlington is 2,617.
What is the Total Male Population of Burlington?
Total Male Population of Burlington is 1,291.
What is the Total Female Population of Burlington?
Total Female Population of Burlington is 1,326.
What is the Ratio of Males per 100 Females in Burlington?
There are 97.36 Males per 100 Females in Burlington.
What is the Ratio of Females per 100 Males in Burlington?
There are 102.71 Females per 100 Males in Burlington.
What is the Median Population Age in Burlington?
Median Population Age in Burlington is 41.3 Years.
What is the Average Family Size in Burlington
Average Family Size in Burlington is 3.1 People.
What is the Average Household Size in Burlington
Average Household Size in Burlington is 2.5 People.
How Large is the Labor Force in Burlington?
There are 1,183 People in the Labor Forcein in Burlington.
What is the Percentage of People in the Labor Force in Burlington?
59.6% of People are in the Labor Force in Burlington.
What is the Unemployment Rate in Burlington?
Unemployment Rate in Burlington is 5.9%.