Zip Codes with the Highest Percentage of Population Employed in Life, Physical & Social Science in Kansas
RELATED REPORTS & OPTIONS
Life, Physical & Social Science
Kansas
Compare Zip Codes
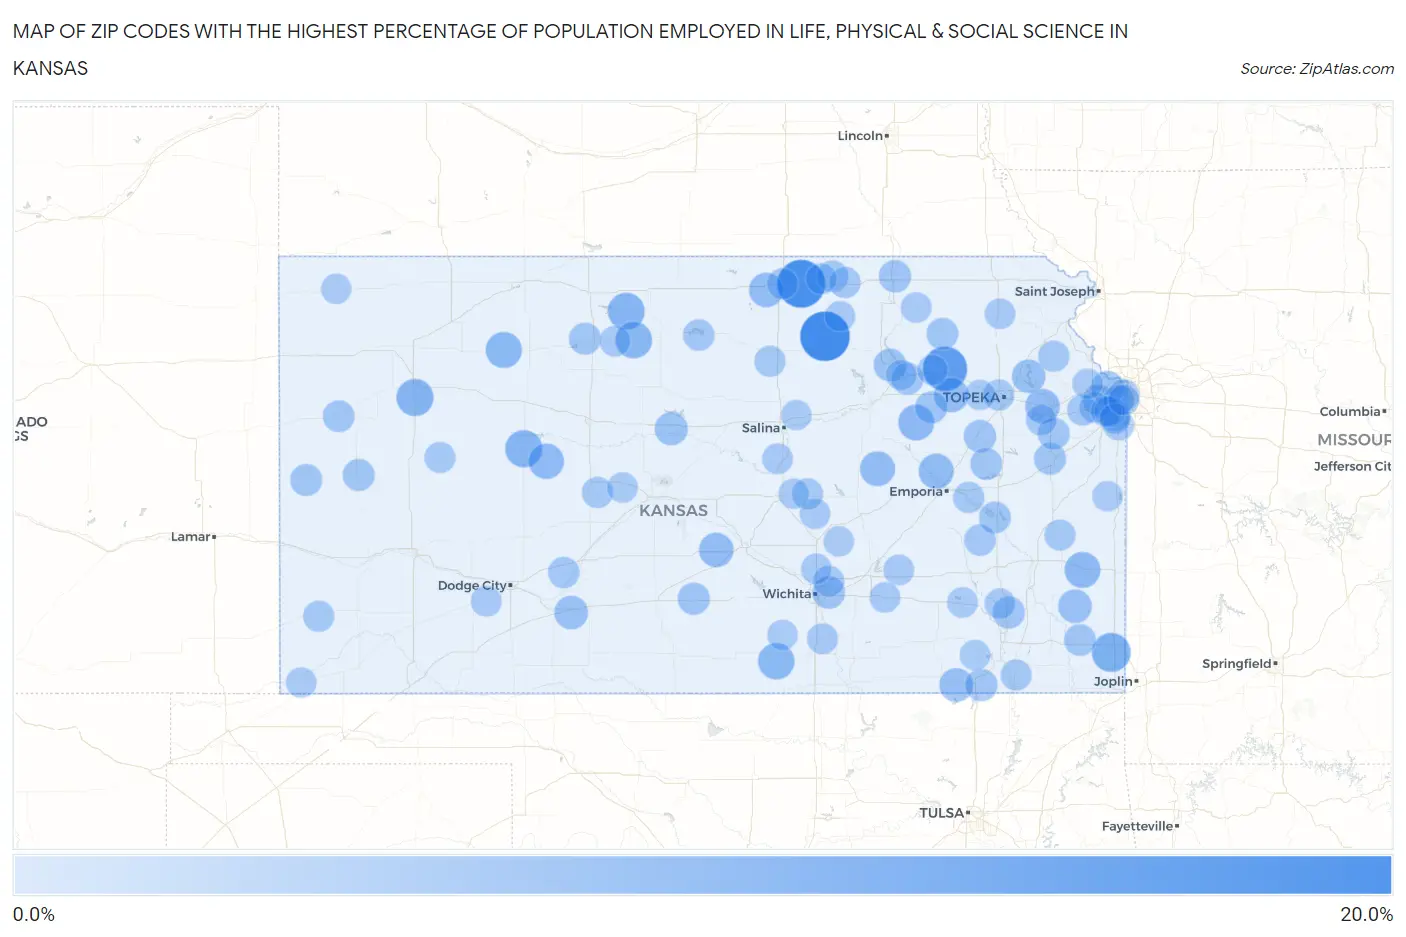
Map of Zip Codes with the Highest Percentage of Population Employed in Life, Physical & Social Science in Kansas
0.0%
20.0%
Zip Codes with the Highest Percentage of Population Employed in Life, Physical & Social Science in Kansas
| Zip Code | % Employed | vs State | vs National | |
| 1. | 67468 | 16.8% | 0.94%(+15.8)#1 | 1.1%(+15.7)#88 |
| 2. | 66940 | 15.5% | 0.94%(+14.5)#2 | 1.1%(+14.4)#97 |
| 3. | 66407 | 12.5% | 0.94%(+11.6)#3 | 1.1%(+11.4)#137 |
| 4. | 66781 | 8.1% | 0.94%(+7.11)#4 | 1.1%(+6.96)#318 |
| 5. | 67572 | 6.8% | 0.94%(+5.84)#5 | 1.1%(+5.69)#431 |
| 6. | 67748 | 6.7% | 0.94%(+5.80)#6 | 1.1%(+5.65)#438 |
| 7. | 67628 | 6.5% | 0.94%(+5.55)#7 | 1.1%(+5.40)#475 |
| 8. | 67623 | 6.4% | 0.94%(+5.47)#8 | 1.1%(+5.32)#487 |
| 9. | 67105 | 6.2% | 0.94%(+5.23)#9 | 1.1%(+5.08)#522 |
| 10. | 67650 | 5.9% | 0.94%(+4.99)#10 | 1.1%(+4.84)#555 |
| 11. | 66834 | 5.8% | 0.94%(+4.87)#11 | 1.1%(+4.72)#576 |
| 12. | 66779 | 5.8% | 0.94%(+4.82)#12 | 1.1%(+4.67)#582 |
| 13. | 67521 | 5.4% | 0.94%(+4.46)#13 | 1.1%(+4.31)#652 |
| 14. | 66835 | 5.2% | 0.94%(+4.21)#14 | 1.1%(+4.06)#720 |
| 15. | 66838 | 4.9% | 0.94%(+4.00)#15 | 1.1%(+3.85)#777 |
| 16. | 66049 | 4.7% | 0.94%(+3.81)#16 | 1.1%(+3.66)#832 |
| 17. | 66526 | 4.7% | 0.94%(+3.79)#17 | 1.1%(+3.64)#840 |
| 18. | 66966 | 4.7% | 0.94%(+3.75)#18 | 1.1%(+3.60)#854 |
| 19. | 67510 | 4.7% | 0.94%(+3.71)#19 | 1.1%(+3.56)#867 |
| 20. | 67360 | 4.1% | 0.94%(+3.16)#20 | 1.1%(+3.01)#1,101 |
| 21. | 67109 | 4.0% | 0.94%(+3.02)#21 | 1.1%(+2.87)#1,176 |
| 22. | 66780 | 3.9% | 0.94%(+3.01)#22 | 1.1%(+2.86)#1,183 |
| 23. | 66070 | 3.9% | 0.94%(+2.97)#23 | 1.1%(+2.82)#1,211 |
| 24. | 66112 | 3.5% | 0.94%(+2.59)#24 | 1.1%(+2.44)#1,407 |
| 25. | 67634 | 3.5% | 0.94%(+2.57)#25 | 1.1%(+2.42)#1,418 |
| 26. | 66503 | 3.2% | 0.94%(+2.28)#26 | 1.1%(+2.13)#1,654 |
| 27. | 67206 | 3.2% | 0.94%(+2.26)#27 | 1.1%(+2.11)#1,669 |
| 28. | 66413 | 3.1% | 0.94%(+2.16)#28 | 1.1%(+2.01)#1,758 |
| 29. | 66508 | 3.0% | 0.94%(+2.08)#29 | 1.1%(+1.93)#1,858 |
| 30. | 67333 | 3.0% | 0.94%(+2.04)#30 | 1.1%(+1.89)#1,897 |
| 31. | 66710 | 2.9% | 0.94%(+1.98)#31 | 1.1%(+1.83)#1,971 |
| 32. | 66401 | 2.9% | 0.94%(+1.92)#32 | 1.1%(+1.77)#2,044 |
| 33. | 67035 | 2.8% | 0.94%(+1.90)#33 | 1.1%(+1.75)#2,059 |
| 34. | 66502 | 2.8% | 0.94%(+1.88)#34 | 1.1%(+1.73)#2,084 |
| 35. | 67669 | 2.7% | 0.94%(+1.79)#35 | 1.1%(+1.64)#2,207 |
| 36. | 67861 | 2.7% | 0.94%(+1.79)#36 | 1.1%(+1.64)#2,211 |
| 37. | 66067 | 2.7% | 0.94%(+1.78)#37 | 1.1%(+1.63)#2,229 |
| 38. | 67879 | 2.7% | 0.94%(+1.74)#38 | 1.1%(+1.59)#2,268 |
| 39. | 66006 | 2.7% | 0.94%(+1.71)#39 | 1.1%(+1.56)#2,313 |
| 40. | 66753 | 2.6% | 0.94%(+1.62)#40 | 1.1%(+1.47)#2,467 |
| 41. | 66523 | 2.5% | 0.94%(+1.60)#41 | 1.1%(+1.45)#2,494 |
| 42. | 66839 | 2.5% | 0.94%(+1.60)#42 | 1.1%(+1.45)#2,499 |
| 43. | 67761 | 2.5% | 0.94%(+1.58)#43 | 1.1%(+1.43)#2,535 |
| 44. | 66521 | 2.5% | 0.94%(+1.56)#44 | 1.1%(+1.41)#2,572 |
| 45. | 66852 | 2.4% | 0.94%(+1.49)#45 | 1.1%(+1.34)#2,699 |
| 46. | 66958 | 2.4% | 0.94%(+1.45)#46 | 1.1%(+1.30)#2,767 |
| 47. | 67446 | 2.4% | 0.94%(+1.45)#47 | 1.1%(+1.30)#2,782 |
| 48. | 66226 | 2.3% | 0.94%(+1.37)#48 | 1.1%(+1.22)#2,931 |
| 49. | 66103 | 2.3% | 0.94%(+1.34)#49 | 1.1%(+1.19)#3,003 |
| 50. | 67563 | 2.2% | 0.94%(+1.28)#50 | 1.1%(+1.13)#3,125 |
| 51. | 66097 | 2.2% | 0.94%(+1.22)#51 | 1.1%(+1.07)#3,274 |
| 52. | 66968 | 2.1% | 0.94%(+1.19)#52 | 1.1%(+1.04)#3,343 |
| 53. | 66864 | 2.1% | 0.94%(+1.18)#53 | 1.1%(+1.03)#3,379 |
| 54. | 67575 | 2.1% | 0.94%(+1.16)#54 | 1.1%(+1.01)#3,427 |
| 55. | 66210 | 2.1% | 0.94%(+1.12)#55 | 1.1%(+0.970)#3,511 |
| 56. | 67436 | 2.1% | 0.94%(+1.12)#56 | 1.1%(+0.967)#3,524 |
| 57. | 67855 | 2.0% | 0.94%(+1.09)#57 | 1.1%(+0.941)#3,593 |
| 58. | 66935 | 2.0% | 0.94%(+1.06)#58 | 1.1%(+0.905)#3,694 |
| 59. | 67351 | 2.0% | 0.94%(+1.05)#59 | 1.1%(+0.899)#3,718 |
| 60. | 66039 | 2.0% | 0.94%(+1.04)#60 | 1.1%(+0.889)#3,743 |
| 61. | 67850 | 2.0% | 0.94%(+1.02)#61 | 1.1%(+0.870)#3,801 |
| 62. | 67226 | 2.0% | 0.94%(+1.02)#62 | 1.1%(+0.866)#3,807 |
| 63. | 66606 | 1.9% | 0.94%(+0.991)#63 | 1.1%(+0.840)#3,885 |
| 64. | 66944 | 1.9% | 0.94%(+0.983)#64 | 1.1%(+0.832)#3,906 |
| 65. | 66227 | 1.9% | 0.94%(+0.974)#65 | 1.1%(+0.824)#3,929 |
| 66. | 67428 | 1.9% | 0.94%(+0.963)#66 | 1.1%(+0.812)#3,967 |
| 67. | 66018 | 1.9% | 0.94%(+0.955)#67 | 1.1%(+0.804)#3,995 |
| 68. | 66223 | 1.8% | 0.94%(+0.904)#68 | 1.1%(+0.754)#4,159 |
| 69. | 67013 | 1.8% | 0.94%(+0.902)#69 | 1.1%(+0.752)#4,165 |
| 70. | 66047 | 1.8% | 0.94%(+0.868)#70 | 1.1%(+0.717)#4,297 |
| 71. | 66202 | 1.8% | 0.94%(+0.848)#71 | 1.1%(+0.698)#4,361 |
| 72. | 67675 | 1.8% | 0.94%(+0.845)#72 | 1.1%(+0.695)#4,380 |
| 73. | 66714 | 1.8% | 0.94%(+0.814)#73 | 1.1%(+0.663)#4,498 |
| 74. | 66215 | 1.8% | 0.94%(+0.812)#74 | 1.1%(+0.661)#4,503 |
| 75. | 66219 | 1.7% | 0.94%(+0.809)#75 | 1.1%(+0.659)#4,509 |
| 76. | 66213 | 1.7% | 0.94%(+0.795)#76 | 1.1%(+0.645)#4,569 |
| 77. | 67841 | 1.7% | 0.94%(+0.794)#77 | 1.1%(+0.643)#4,575 |
| 78. | 67456 | 1.7% | 0.94%(+0.784)#78 | 1.1%(+0.633)#4,617 |
| 79. | 66205 | 1.7% | 0.94%(+0.768)#79 | 1.1%(+0.617)#4,687 |
| 80. | 66427 | 1.7% | 0.94%(+0.749)#80 | 1.1%(+0.599)#4,781 |
| 81. | 67132 | 1.7% | 0.94%(+0.735)#81 | 1.1%(+0.585)#4,837 |
| 82. | 67047 | 1.7% | 0.94%(+0.719)#82 | 1.1%(+0.569)#4,899 |
| 83. | 67147 | 1.7% | 0.94%(+0.712)#83 | 1.1%(+0.562)#4,930 |
| 84. | 67511 | 1.6% | 0.94%(+0.699)#84 | 1.1%(+0.548)#5,002 |
| 85. | 66962 | 1.6% | 0.94%(+0.686)#85 | 1.1%(+0.535)#5,054 |
| 86. | 67074 | 1.6% | 0.94%(+0.679)#86 | 1.1%(+0.529)#5,076 |
| 87. | 67053 | 1.6% | 0.94%(+0.679)#87 | 1.1%(+0.529)#5,077 |
| 88. | 66516 | 1.6% | 0.94%(+0.672)#88 | 1.1%(+0.522)#5,102 |
| 89. | 67950 | 1.5% | 0.94%(+0.608)#89 | 1.1%(+0.457)#5,390 |
| 90. | 66040 | 1.5% | 0.94%(+0.602)#90 | 1.1%(+0.452)#5,422 |
| 91. | 67344 | 1.5% | 0.94%(+0.586)#91 | 1.1%(+0.436)#5,512 |
| 92. | 66007 | 1.5% | 0.94%(+0.581)#92 | 1.1%(+0.431)#5,535 |
| 93. | 67443 | 1.5% | 0.94%(+0.576)#93 | 1.1%(+0.426)#5,562 |
| 94. | 67731 | 1.5% | 0.94%(+0.560)#94 | 1.1%(+0.409)#5,659 |
| 95. | 67041 | 1.5% | 0.94%(+0.552)#95 | 1.1%(+0.402)#5,699 |
| 96. | 66506 | 1.5% | 0.94%(+0.551)#96 | 1.1%(+0.401)#5,701 |
| 97. | 67470 | 1.5% | 0.94%(+0.547)#97 | 1.1%(+0.396)#5,721 |
| 98. | 66615 | 1.5% | 0.94%(+0.531)#98 | 1.1%(+0.381)#5,819 |
| 99. | 67031 | 1.5% | 0.94%(+0.524)#99 | 1.1%(+0.374)#5,846 |
| 100. | 66547 | 1.4% | 0.94%(+0.485)#100 | 1.1%(+0.335)#6,051 |
Common Questions
What are the Top 10 Zip Codes with the Highest Percentage of Population Employed in Life, Physical & Social Science in Kansas?
Top 10 Zip Codes with the Highest Percentage of Population Employed in Life, Physical & Social Science in Kansas are:
What zip code has the Highest Percentage of Population Employed in Life, Physical & Social Science in Kansas?
67468 has the Highest Percentage of Population Employed in Life, Physical & Social Science in Kansas with 16.8%.
What is the Percentage of Population Employed in Life, Physical & Social Science in the State of Kansas?
Percentage of Population Employed in Life, Physical & Social Science in Kansas is 0.94%.
What is the Percentage of Population Employed in Life, Physical & Social Science in the United States?
Percentage of Population Employed in Life, Physical & Social Science in the United States is 1.1%.