St George, KS Map & Demographics
St George Map
St George Overview
$30,480
PER CAPITA INCOME
$87,292
AVG FAMILY INCOME
$85,469
AVG HOUSEHOLD INCOME
19.5%
WAGE / INCOME GAP [ % ]
80.5¢/ $1
WAGE / INCOME GAP [ $ ]
0.30
INEQUALITY / GINI INDEX
1,190
TOTAL POPULATION
609
MALE POPULATION
581
FEMALE POPULATION
104.82
MALES / 100 FEMALES
95.40
FEMALES / 100 MALES
31.0
MEDIAN AGE
3.2
AVG FAMILY SIZE
3.0
AVG HOUSEHOLD SIZE
653
LABOR FORCE [ PEOPLE ]
81.0%
PERCENT IN LABOR FORCE
Income in St George
Income Overview in St George
Per Capita Income in St George is $30,480, while median incomes of families and households are $87,292 and $85,469 respectively.
| Characteristic | Number | Measure |
| Per Capita Income | 1,190 | $30,480 |
| Median Family Income | 342 | $87,292 |
| Mean Family Income | 342 | $92,580 |
| Median Household Income | 401 | $85,469 |
| Mean Household Income | 401 | $85,404 |
| Income Deficit | 342 | $0 |
| Wage / Income Gap (%) | 1,190 | 19.54% |
| Wage / Income Gap ($) | 1,190 | 80.46¢ per $1 |
| Gini / Inequality Index | 1,190 | 0.30 |
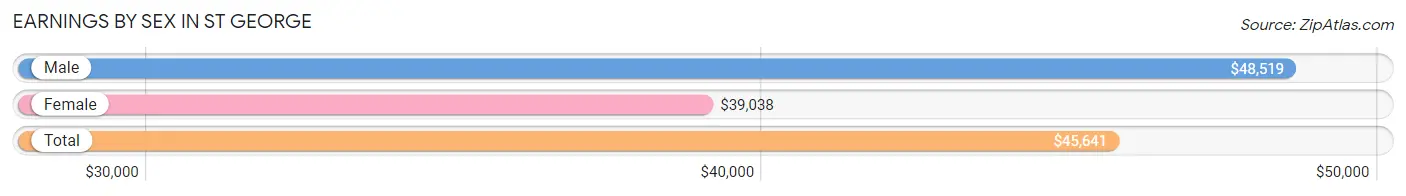
Earnings by Sex in St George
Average Earnings in St George are $45,641, $48,519 for men and $39,038 for women, a difference of 19.5%.
| Sex | Number | Average Earnings |
| Male | 384 (56.5%) | $48,519 |
| Female | 296 (43.5%) | $39,038 |
| Total | 680 (100.0%) | $45,641 |
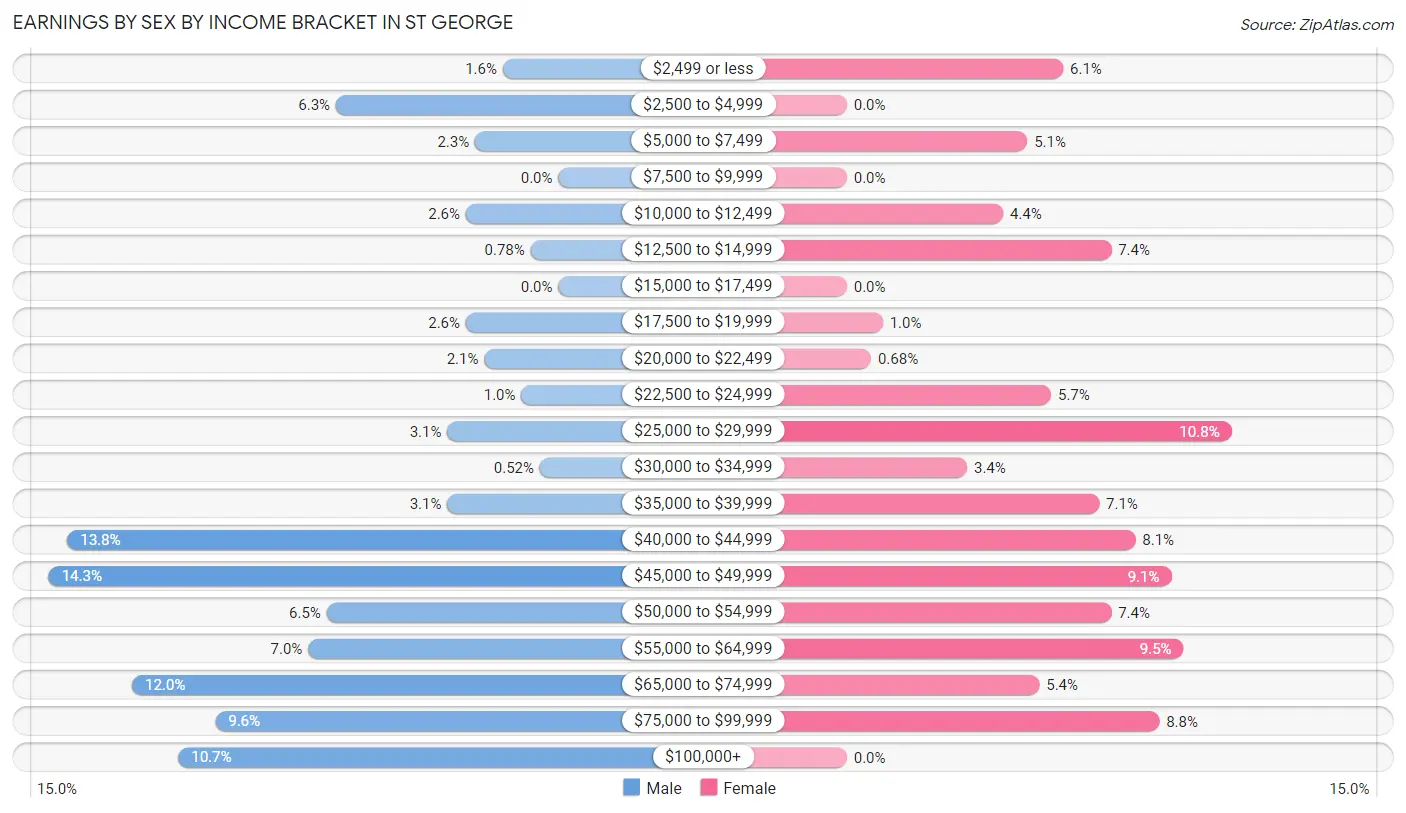
Earnings by Sex by Income Bracket in St George
The most common earnings brackets in St George are $45,000 to $49,999 for men (55 | 14.3%) and $25,000 to $29,999 for women (32 | 10.8%).
| Income | Male | Female |
| $2,499 or less | 6 (1.6%) | 18 (6.1%) |
| $2,500 to $4,999 | 24 (6.2%) | 0 (0.0%) |
| $5,000 to $7,499 | 9 (2.3%) | 15 (5.1%) |
| $7,500 to $9,999 | 0 (0.0%) | 0 (0.0%) |
| $10,000 to $12,499 | 10 (2.6%) | 13 (4.4%) |
| $12,500 to $14,999 | 3 (0.8%) | 22 (7.4%) |
| $15,000 to $17,499 | 0 (0.0%) | 0 (0.0%) |
| $17,500 to $19,999 | 10 (2.6%) | 3 (1.0%) |
| $20,000 to $22,499 | 8 (2.1%) | 2 (0.7%) |
| $22,500 to $24,999 | 4 (1.0%) | 17 (5.7%) |
| $25,000 to $29,999 | 12 (3.1%) | 32 (10.8%) |
| $30,000 to $34,999 | 2 (0.5%) | 10 (3.4%) |
| $35,000 to $39,999 | 12 (3.1%) | 21 (7.1%) |
| $40,000 to $44,999 | 53 (13.8%) | 24 (8.1%) |
| $45,000 to $49,999 | 55 (14.3%) | 27 (9.1%) |
| $50,000 to $54,999 | 25 (6.5%) | 22 (7.4%) |
| $55,000 to $64,999 | 27 (7.0%) | 28 (9.5%) |
| $65,000 to $74,999 | 46 (12.0%) | 16 (5.4%) |
| $75,000 to $99,999 | 37 (9.6%) | 26 (8.8%) |
| $100,000+ | 41 (10.7%) | 0 (0.0%) |
| Total | 384 (100.0%) | 296 (100.0%) |
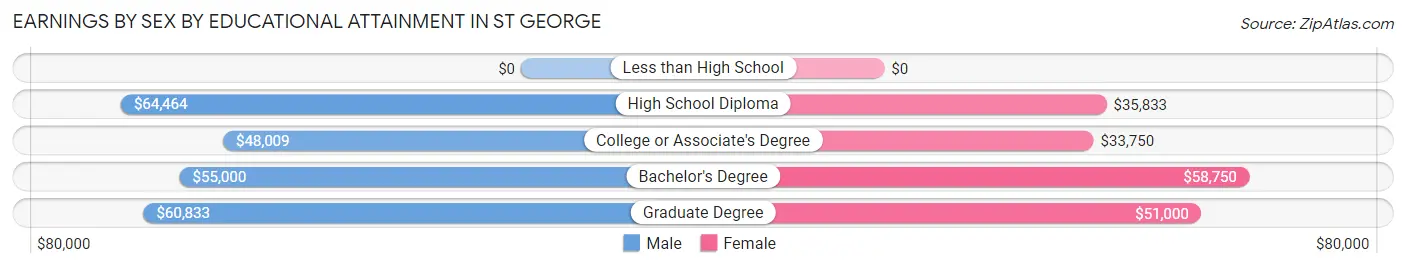
Earnings by Sex by Educational Attainment in St George
Average earnings in St George are $50,250 for men and $40,294 for women, a difference of 19.8%. Men with an educational attainment of high school diploma enjoy the highest average annual earnings of $64,464, while those with college or associate's degree education earn the least with $48,009. Women with an educational attainment of bachelor's degree earn the most with the average annual earnings of $58,750, while those with college or associate's degree education have the smallest earnings of $33,750.
| Educational Attainment | Male Income | Female Income |
| Less than High School | - | - |
| High School Diploma | $64,464 | $35,833 |
| College or Associate's Degree | $48,009 | $33,750 |
| Bachelor's Degree | $55,000 | $58,750 |
| Graduate Degree | $60,833 | $51,000 |
| Total | $50,250 | $40,294 |
Family Income in St George
Family Income Brackets in St George
According to the St George family income data, there are 115 families falling into the $100,000 to $149,999 income range, which is the most common income bracket and makes up 33.6% of all families.
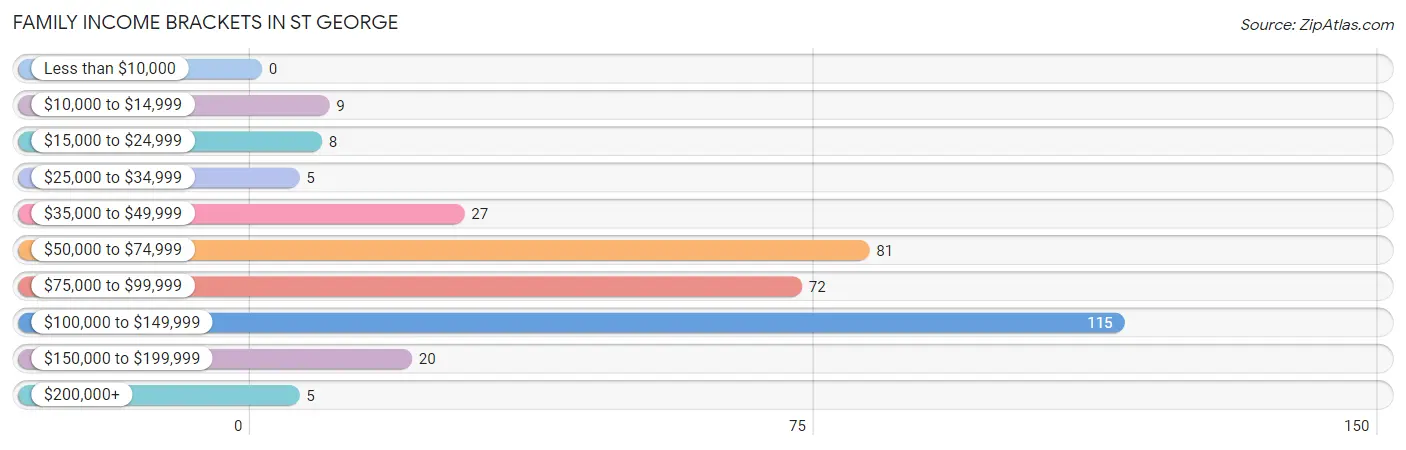
| Income Bracket | # Families | % Families |
| Less than $10,000 | 0 | 0.0% |
| $10,000 to $14,999 | 9 | 2.6% |
| $15,000 to $24,999 | 8 | 2.3% |
| $25,000 to $34,999 | 5 | 1.5% |
| $35,000 to $49,999 | 27 | 7.9% |
| $50,000 to $74,999 | 81 | 23.7% |
| $75,000 to $99,999 | 72 | 21.1% |
| $100,000 to $149,999 | 115 | 33.6% |
| $150,000 to $199,999 | 20 | 5.8% |
| $200,000+ | 5 | 1.5% |
Family Income by Famaliy Size in St George
5-person families (51 | 14.9%) account for the highest median family income in St George with $118,750 per family, while 2-person families (91 | 26.6%) have the highest median income of $30,375 per family member.
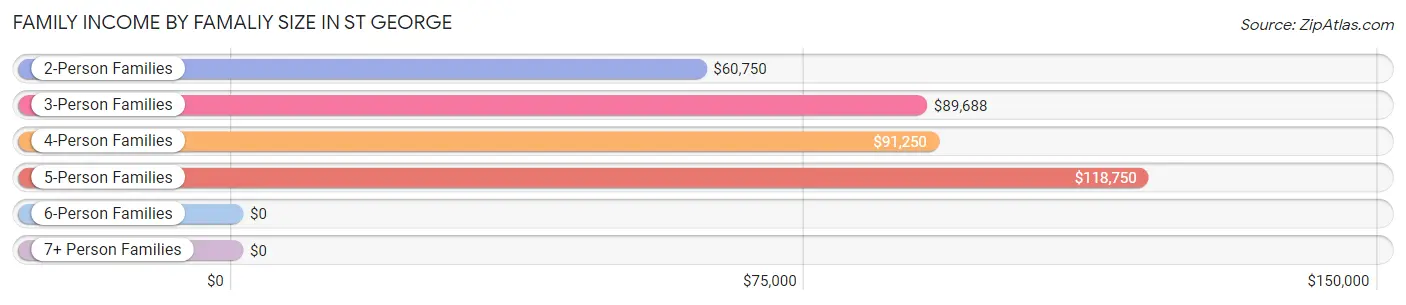
| Income Bracket | # Families | Median Income |
| 2-Person Families | 91 (26.6%) | $60,750 |
| 3-Person Families | 125 (36.5%) | $89,688 |
| 4-Person Families | 52 (15.2%) | $91,250 |
| 5-Person Families | 51 (14.9%) | $118,750 |
| 6-Person Families | 13 (3.8%) | $0 |
| 7+ Person Families | 10 (2.9%) | $0 |
| Total | 342 (100.0%) | $87,292 |
Family Income by Number of Earners in St George
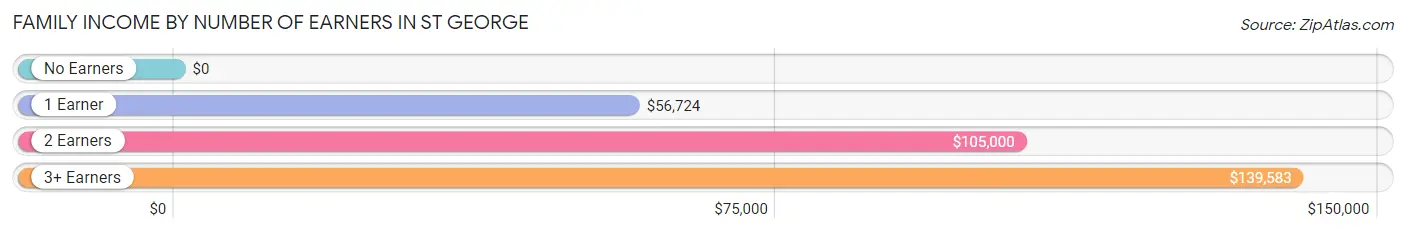
| Number of Earners | # Families | Median Income |
| No Earners | 19 (5.6%) | $0 |
| 1 Earner | 102 (29.8%) | $56,724 |
| 2 Earners | 190 (55.6%) | $105,000 |
| 3+ Earners | 31 (9.1%) | $139,583 |
| Total | 342 (100.0%) | $87,292 |
Household Income in St George
Household Income Brackets in St George
With 115 households falling in the category, the $100,000 to $149,999 income range is the most frequent in St George, accounting for 28.7% of all households. In contrast, only 2 households (0.5%) fall into the less than $10,000 income bracket, making it the least populous group.
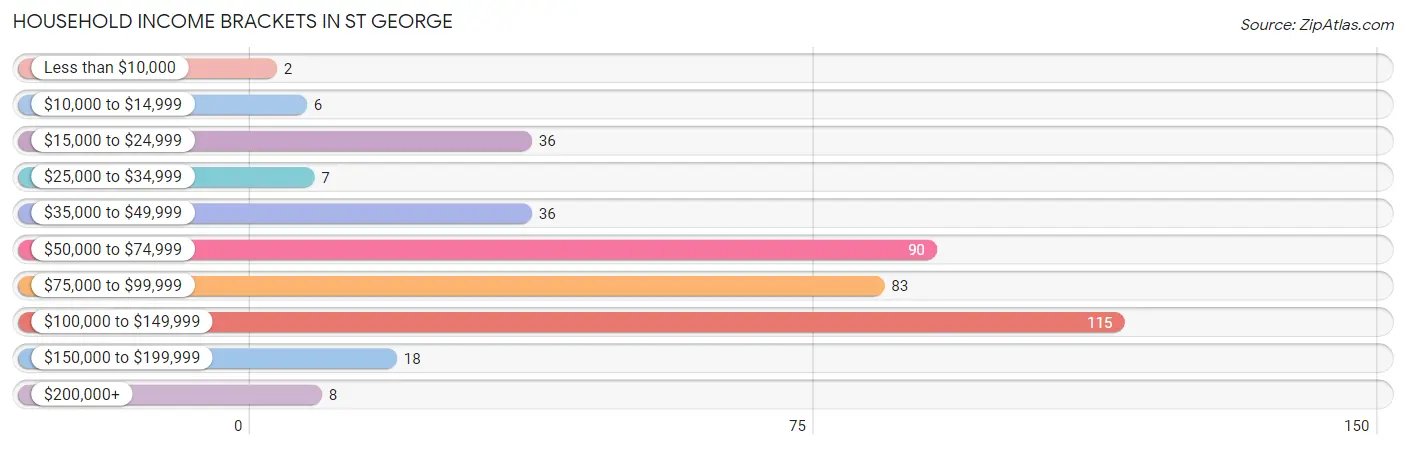
| Income Bracket | # Households | % Households |
| Less than $10,000 | 2 | 0.5% |
| $10,000 to $14,999 | 6 | 1.5% |
| $15,000 to $24,999 | 36 | 9.0% |
| $25,000 to $34,999 | 7 | 1.7% |
| $35,000 to $49,999 | 36 | 9.0% |
| $50,000 to $74,999 | 90 | 22.4% |
| $75,000 to $99,999 | 83 | 20.7% |
| $100,000 to $149,999 | 115 | 28.7% |
| $150,000 to $199,999 | 18 | 4.5% |
| $200,000+ | 8 | 2.0% |
Household Income by Householder Age in St George
The median household income in St George is $85,469, with the highest median household income of $87,500 found in the 25 to 44 years age bracket for the primary householder. A total of 254 households (63.3%) fall into this category. Meanwhile, the 15 to 24 years age bracket for the primary householder has the lowest median household income of $0, with 7 households (1.8%) in this group.
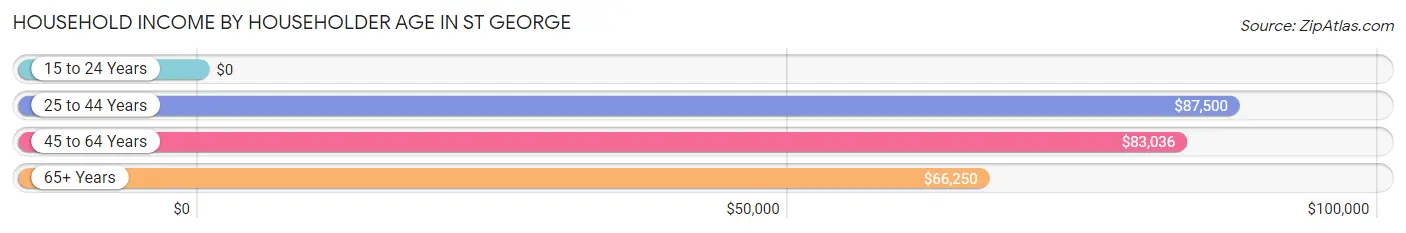
| Income Bracket | # Households | Median Income |
| 15 to 24 Years | 7 (1.8%) | $0 |
| 25 to 44 Years | 254 (63.3%) | $87,500 |
| 45 to 64 Years | 113 (28.2%) | $83,036 |
| 65+ Years | 27 (6.7%) | $66,250 |
| Total | 401 (100.0%) | $85,469 |
Poverty in St George
Income Below Poverty by Sex and Age in St George
With 6.4% poverty level for males and 8.1% for females among the residents of St George, 75 year old and over males and 75 year old and over females are the most vulnerable to poverty, with 4 males (66.7%) and 2 females (40.0%) in their respective age groups living below the poverty level.
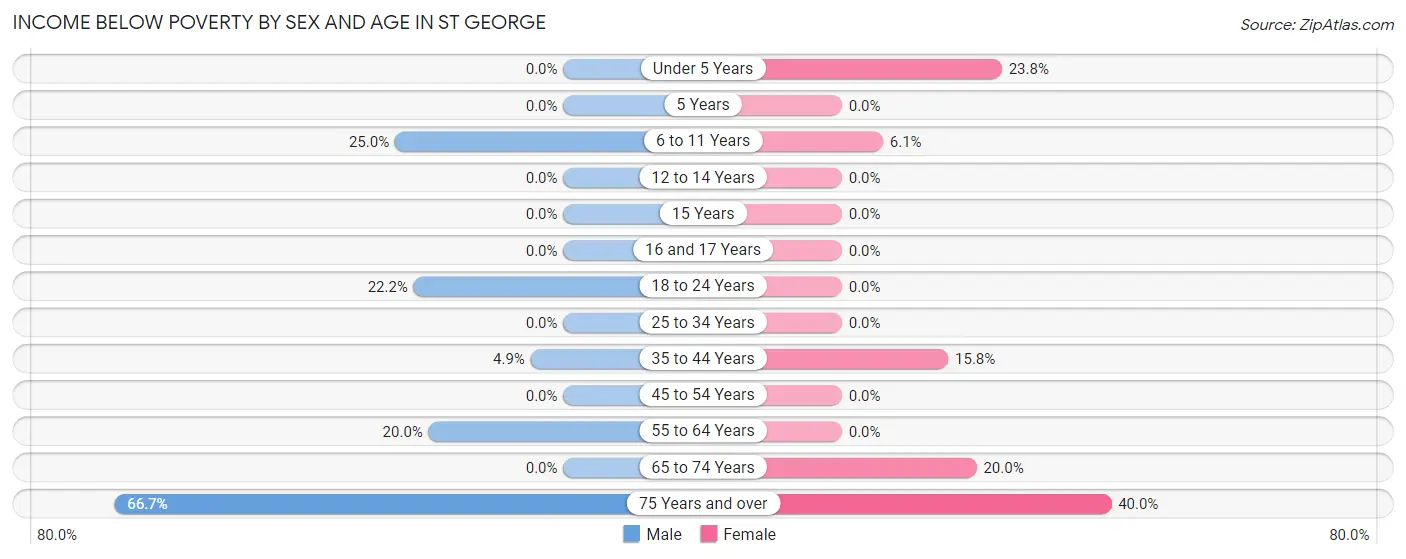
| Age Bracket | Male | Female |
| Under 5 Years | 0 (0.0%) | 19 (23.7%) |
| 5 Years | 0 (0.0%) | 0 (0.0%) |
| 6 to 11 Years | 23 (25.0%) | 5 (6.1%) |
| 12 to 14 Years | 0 (0.0%) | 0 (0.0%) |
| 15 Years | 0 (0.0%) | 0 (0.0%) |
| 16 and 17 Years | 0 (0.0%) | 0 (0.0%) |
| 18 to 24 Years | 4 (22.2%) | 0 (0.0%) |
| 25 to 34 Years | 0 (0.0%) | 0 (0.0%) |
| 35 to 44 Years | 5 (4.9%) | 18 (15.8%) |
| 45 to 54 Years | 0 (0.0%) | 0 (0.0%) |
| 55 to 64 Years | 3 (20.0%) | 0 (0.0%) |
| 65 to 74 Years | 0 (0.0%) | 3 (20.0%) |
| 75 Years and over | 4 (66.7%) | 2 (40.0%) |
| Total | 39 (6.4%) | 47 (8.1%) |
Income Above Poverty by Sex and Age in St George
According to the poverty statistics in St George, males aged under 5 years and females aged 5 years are the age groups that are most secure financially, with 100.0% of males and 100.0% of females in these age groups living above the poverty line.
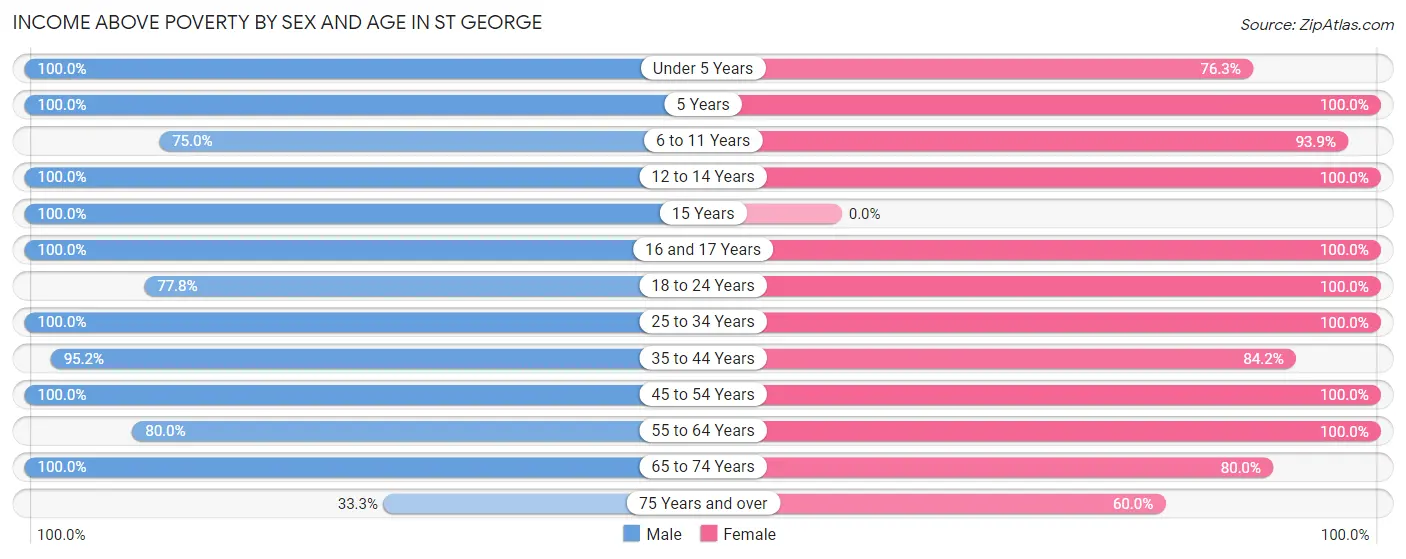
| Age Bracket | Male | Female |
| Under 5 Years | 54 (100.0%) | 61 (76.2%) |
| 5 Years | 11 (100.0%) | 15 (100.0%) |
| 6 to 11 Years | 69 (75.0%) | 77 (93.9%) |
| 12 to 14 Years | 22 (100.0%) | 23 (100.0%) |
| 15 Years | 5 (100.0%) | 0 (0.0%) |
| 16 and 17 Years | 25 (100.0%) | 18 (100.0%) |
| 18 to 24 Years | 14 (77.8%) | 24 (100.0%) |
| 25 to 34 Years | 153 (100.0%) | 114 (100.0%) |
| 35 to 44 Years | 98 (95.2%) | 96 (84.2%) |
| 45 to 54 Years | 81 (100.0%) | 69 (100.0%) |
| 55 to 64 Years | 12 (80.0%) | 22 (100.0%) |
| 65 to 74 Years | 24 (100.0%) | 12 (80.0%) |
| 75 Years and over | 2 (33.3%) | 3 (60.0%) |
| Total | 570 (93.6%) | 534 (91.9%) |
Income Below Poverty Among Married-Couple Families in St George
The poverty statistics for married-couple families in St George show that 3.3% or 9 of the total 276 families live below the poverty line. Families with 5 or more children have the highest poverty rate of 60.0%, comprising of 6 families. On the other hand, families with 1 or 2 children have the lowest poverty rate of 0.0%, which includes 0 families.
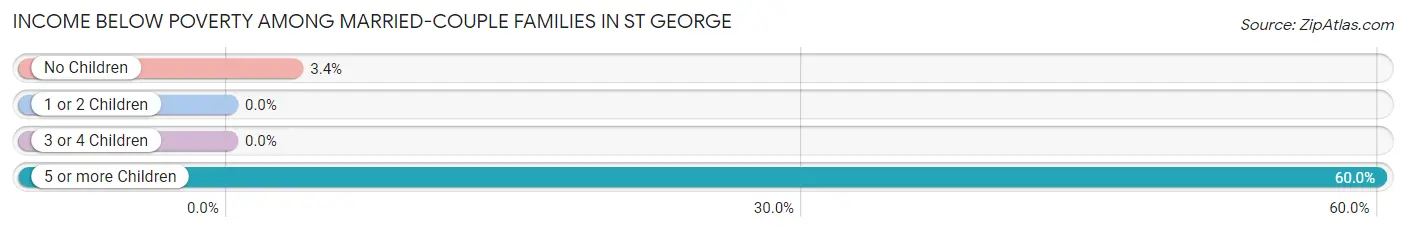
| Children | Above Poverty | Below Poverty |
| No Children | 85 (96.6%) | 3 (3.4%) |
| 1 or 2 Children | 128 (100.0%) | 0 (0.0%) |
| 3 or 4 Children | 50 (100.0%) | 0 (0.0%) |
| 5 or more Children | 4 (40.0%) | 6 (60.0%) |
| Total | 267 (96.7%) | 9 (3.3%) |
Income Below Poverty Among Single-Parent Households in St George
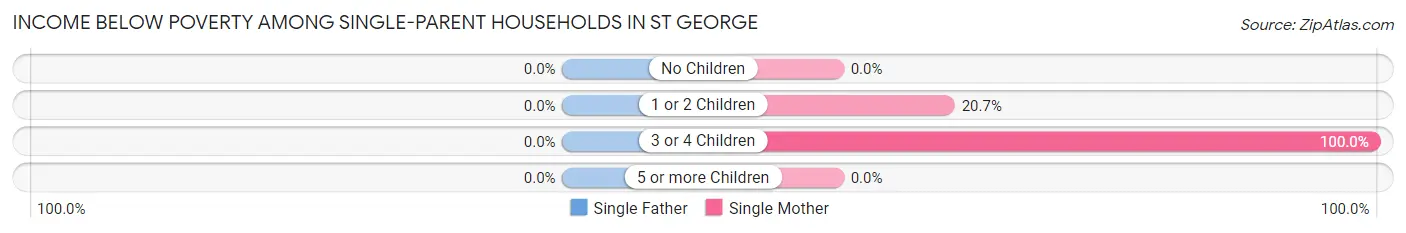
| Children | Single Father | Single Mother |
| No Children | 0 (0.0%) | 0 (0.0%) |
| 1 or 2 Children | 0 (0.0%) | 6 (20.7%) |
| 3 or 4 Children | 0 (0.0%) | 6 (100.0%) |
| 5 or more Children | 0 (0.0%) | 0 (0.0%) |
| Total | 0 (0.0%) | 12 (26.1%) |
Income Below Poverty Among Married-Couple vs Single-Parent Households in St George
The poverty data for St George shows that 9 of the married-couple family households (3.3%) and 12 of the single-parent households (18.2%) are living below the poverty level. Within the married-couple family households, those with 5 or more children have the highest poverty rate, with 6 households (60.0%) falling below the poverty line. Among the single-parent households, those with 3 or 4 children have the highest poverty rate, with 6 household (100.0%) living below poverty.
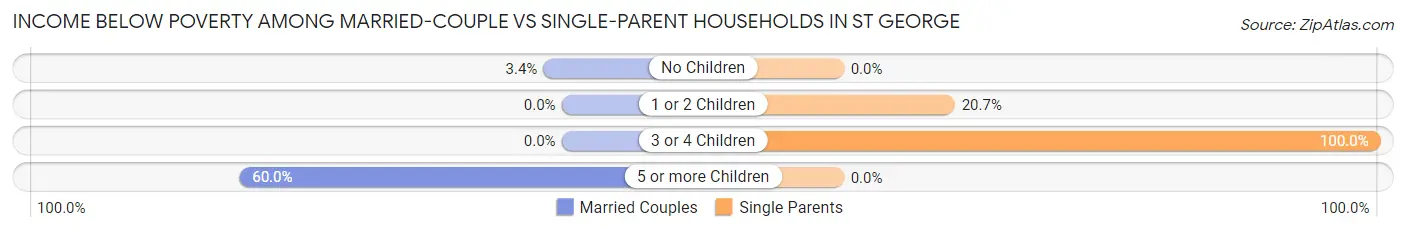
| Children | Married-Couple Families | Single-Parent Households |
| No Children | 3 (3.4%) | 0 (0.0%) |
| 1 or 2 Children | 0 (0.0%) | 6 (20.7%) |
| 3 or 4 Children | 0 (0.0%) | 6 (100.0%) |
| 5 or more Children | 6 (60.0%) | 0 (0.0%) |
| Total | 9 (3.3%) | 12 (18.2%) |
Race in St George
The most populous races in St George are White / Caucasian (1,045 | 87.8%), Hispanic or Latino (138 | 11.6%), and Two or more Races (65 | 5.5%).
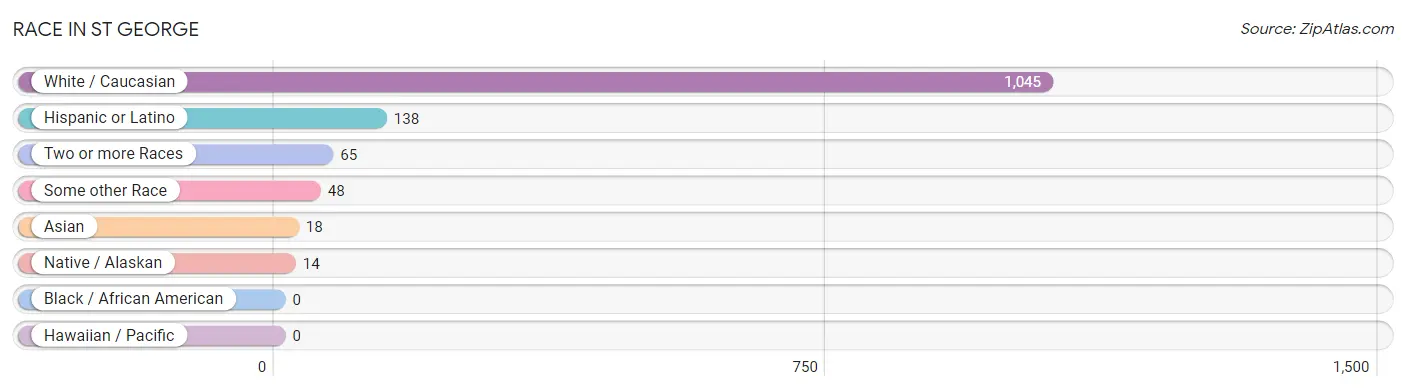
| Race | # Population | % Population |
| Asian | 18 | 1.5% |
| Black / African American | 0 | 0.0% |
| Hawaiian / Pacific | 0 | 0.0% |
| Hispanic or Latino | 138 | 11.6% |
| Native / Alaskan | 14 | 1.2% |
| White / Caucasian | 1,045 | 87.8% |
| Two or more Races | 65 | 5.5% |
| Some other Race | 48 | 4.0% |
| Total | 1,190 | 100.0% |
Ancestry in St George
The most populous ancestries reported in St George are German (535 | 45.0%), Irish (117 | 9.8%), English (115 | 9.7%), Mexican (98 | 8.2%), and American (68 | 5.7%), together accounting for 78.4% of all St George residents.
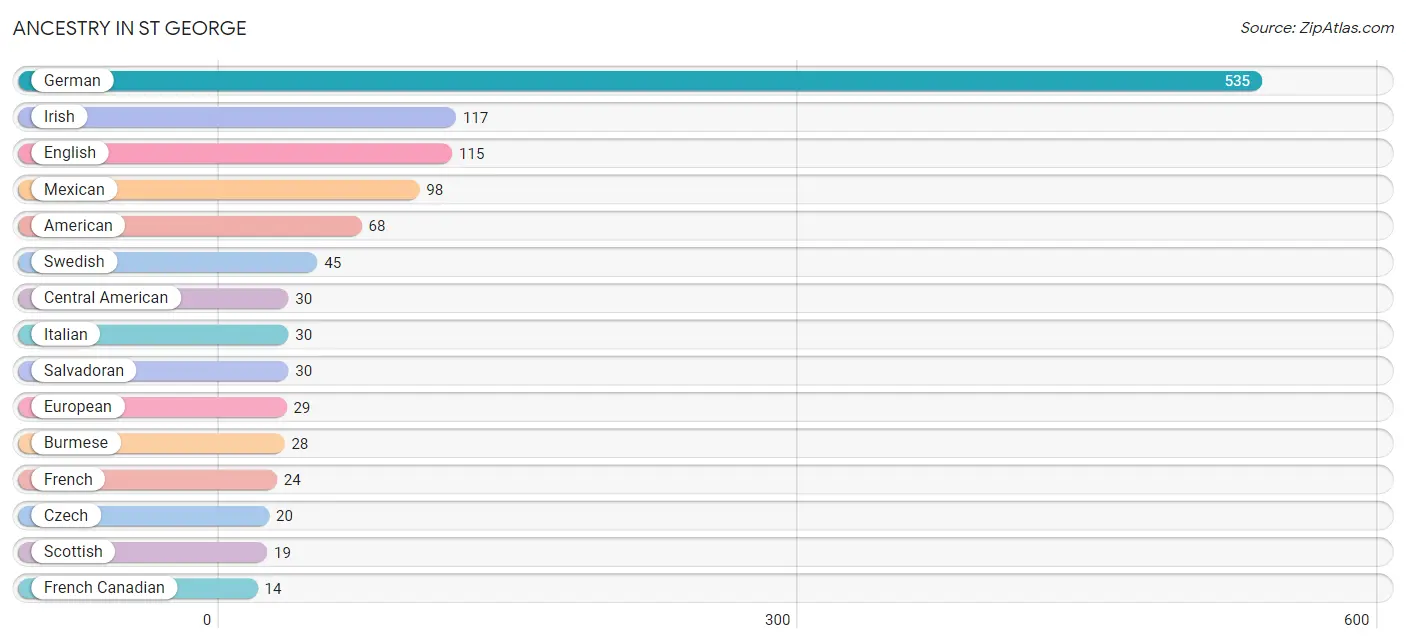
| Ancestry | # Population | % Population |
| American | 68 | 5.7% |
| Apache | 8 | 0.7% |
| Bhutanese | 12 | 1.0% |
| Burmese | 28 | 2.4% |
| Canadian | 2 | 0.2% |
| Celtic | 4 | 0.3% |
| Central American | 30 | 2.5% |
| Czech | 20 | 1.7% |
| Dutch | 10 | 0.8% |
| English | 115 | 9.7% |
| European | 29 | 2.4% |
| French | 24 | 2.0% |
| French Canadian | 14 | 1.2% |
| German | 535 | 45.0% |
| Irish | 117 | 9.8% |
| Italian | 30 | 2.5% |
| Mexican | 98 | 8.2% |
| Mexican American Indian | 14 | 1.2% |
| Norwegian | 8 | 0.7% |
| Polish | 8 | 0.7% |
| Portuguese | 2 | 0.2% |
| Puerto Rican | 10 | 0.8% |
| Romanian | 3 | 0.3% |
| Salvadoran | 30 | 2.5% |
| Scandinavian | 5 | 0.4% |
| Scottish | 19 | 1.6% |
| Swedish | 45 | 3.8% |
| Swiss | 9 | 0.8% |
| Welsh | 5 | 0.4% | View All 29 Rows |
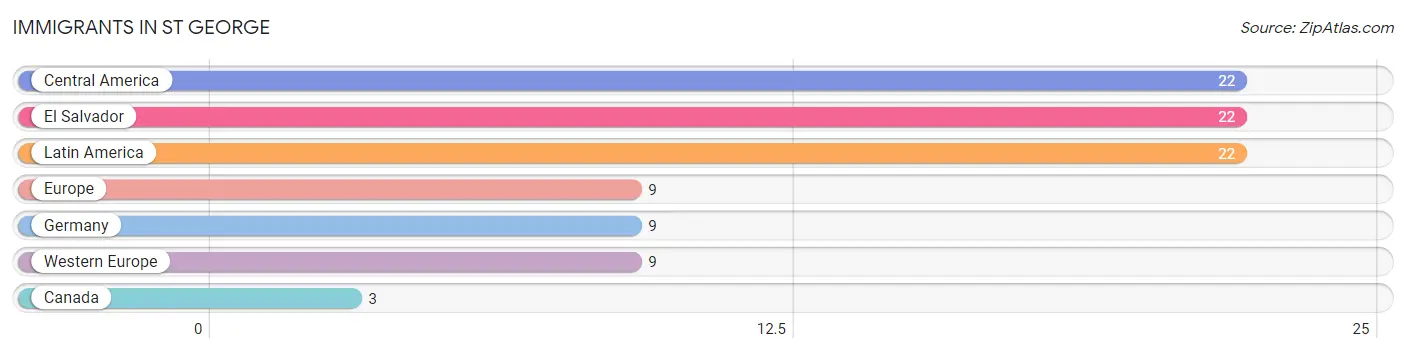
Immigrants in St George
The most numerous immigrant groups reported in St George came from Central America (22 | 1.8%), El Salvador (22 | 1.8%), Latin America (22 | 1.8%), Europe (9 | 0.8%), and Germany (9 | 0.8%), together accounting for 7.1% of all St George residents.
| Immigration Origin | # Population | % Population |
| Canada | 3 | 0.3% |
| Central America | 22 | 1.8% |
| El Salvador | 22 | 1.8% |
| Europe | 9 | 0.8% |
| Germany | 9 | 0.8% |
| Latin America | 22 | 1.8% |
| Western Europe | 9 | 0.8% | View All 7 Rows |
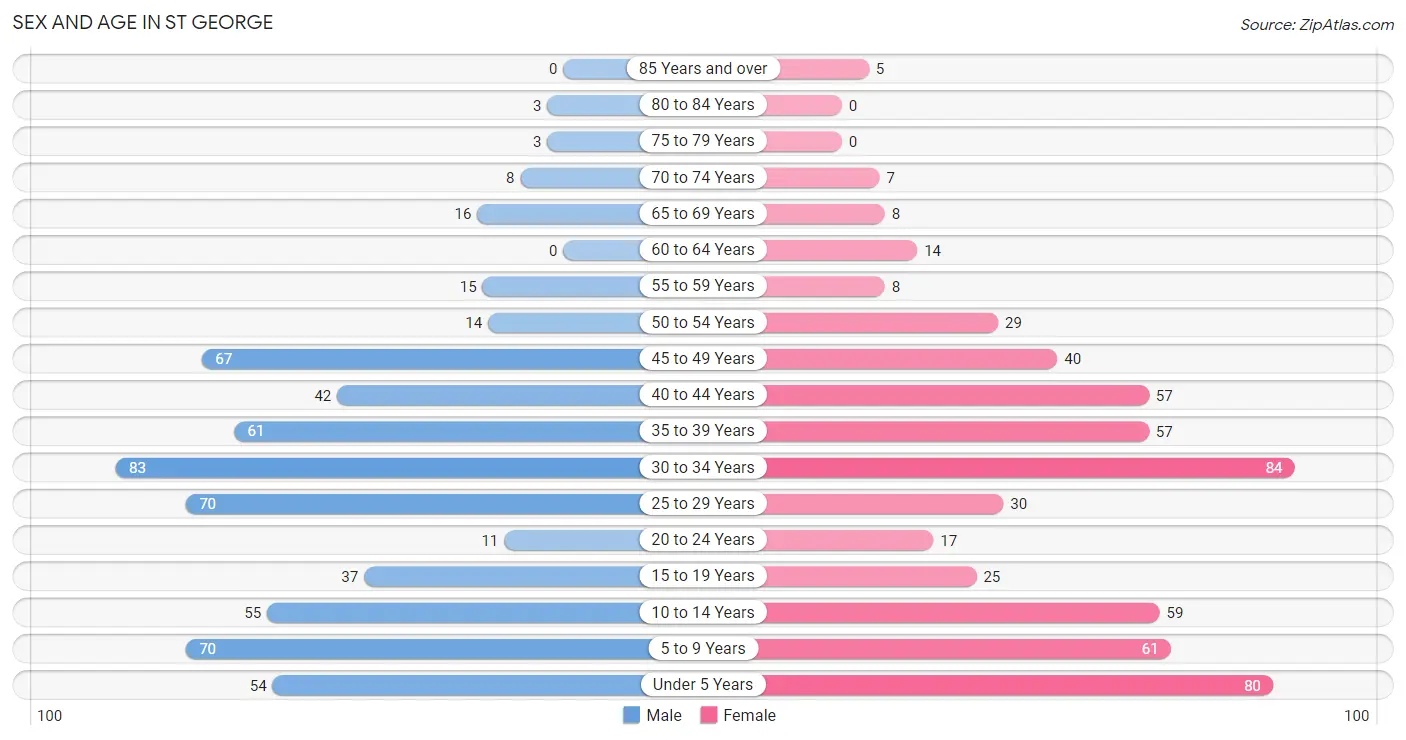
Sex and Age in St George
Sex and Age in St George
The most populous age groups in St George are 30 to 34 Years (83 | 13.6%) for men and 30 to 34 Years (84 | 14.5%) for women.
| Age Bracket | Male | Female |
| Under 5 Years | 54 (8.9%) | 80 (13.8%) |
| 5 to 9 Years | 70 (11.5%) | 61 (10.5%) |
| 10 to 14 Years | 55 (9.0%) | 59 (10.2%) |
| 15 to 19 Years | 37 (6.1%) | 25 (4.3%) |
| 20 to 24 Years | 11 (1.8%) | 17 (2.9%) |
| 25 to 29 Years | 70 (11.5%) | 30 (5.2%) |
| 30 to 34 Years | 83 (13.6%) | 84 (14.5%) |
| 35 to 39 Years | 61 (10.0%) | 57 (9.8%) |
| 40 to 44 Years | 42 (6.9%) | 57 (9.8%) |
| 45 to 49 Years | 67 (11.0%) | 40 (6.9%) |
| 50 to 54 Years | 14 (2.3%) | 29 (5.0%) |
| 55 to 59 Years | 15 (2.5%) | 8 (1.4%) |
| 60 to 64 Years | 0 (0.0%) | 14 (2.4%) |
| 65 to 69 Years | 16 (2.6%) | 8 (1.4%) |
| 70 to 74 Years | 8 (1.3%) | 7 (1.2%) |
| 75 to 79 Years | 3 (0.5%) | 0 (0.0%) |
| 80 to 84 Years | 3 (0.5%) | 0 (0.0%) |
| 85 Years and over | 0 (0.0%) | 5 (0.9%) |
| Total | 609 (100.0%) | 581 (100.0%) |
Families and Households in St George
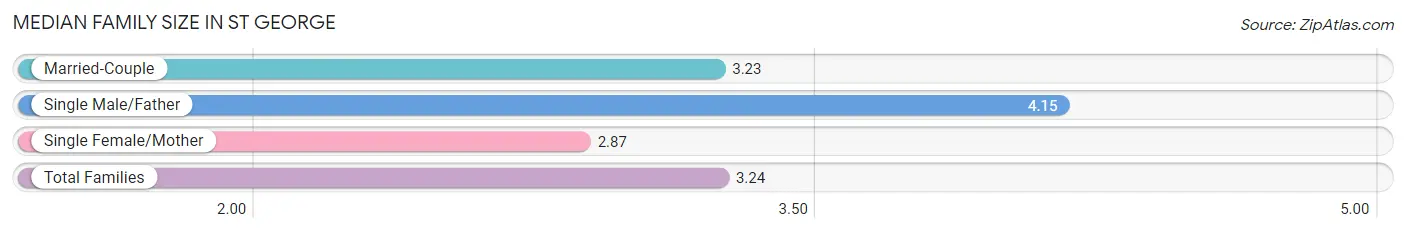
Median Family Size in St George
The median family size in St George is 3.24 persons per family, with single male/father families (20 | 5.9%) accounting for the largest median family size of 4.15 persons per family. On the other hand, single female/mother families (46 | 13.5%) represent the smallest median family size with 2.87 persons per family.
| Family Type | # Families | Family Size |
| Married-Couple | 276 (80.7%) | 3.23 |
| Single Male/Father | 20 (5.9%) | 4.15 |
| Single Female/Mother | 46 (13.5%) | 2.87 |
| Total Families | 342 (100.0%) | 3.24 |
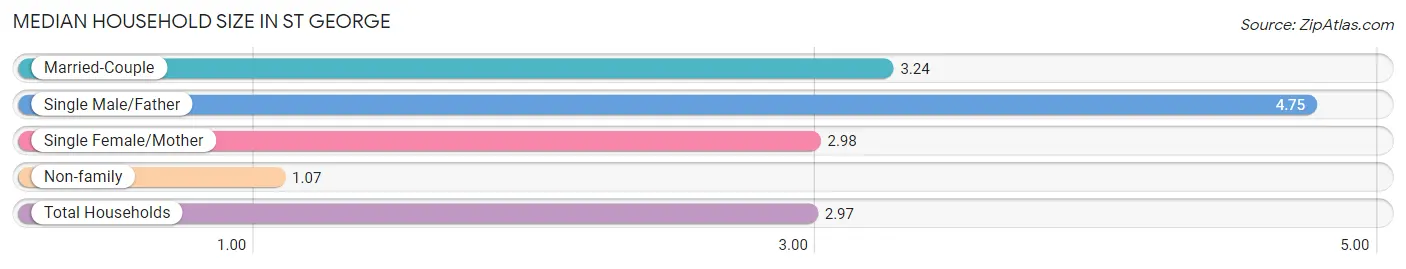
Median Household Size in St George
The median household size in St George is 2.97 persons per household, with single male/father households (20 | 5.0%) accounting for the largest median household size of 4.75 persons per household. non-family households (59 | 14.7%) represent the smallest median household size with 1.07 persons per household.
| Household Type | # Households | Household Size |
| Married-Couple | 276 (68.8%) | 3.24 |
| Single Male/Father | 20 (5.0%) | 4.75 |
| Single Female/Mother | 46 (11.5%) | 2.98 |
| Non-family | 59 (14.7%) | 1.07 |
| Total Households | 401 (100.0%) | 2.97 |
Household Size by Marriage Status in St George
Out of a total of 401 households in St George, 342 (85.3%) are family households, while 59 (14.7%) are nonfamily households. The most numerous type of family households are 3-person households, comprising 122, and the most common type of nonfamily households are 1-person households, comprising 56.
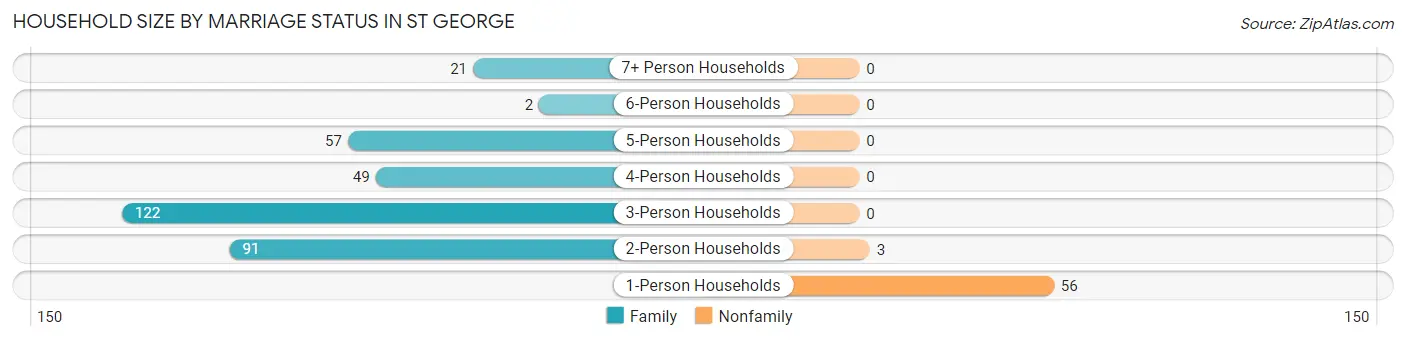
| Household Size | Family Households | Nonfamily Households |
| 1-Person Households | - | 56 (14.0%) |
| 2-Person Households | 91 (22.7%) | 3 (0.7%) |
| 3-Person Households | 122 (30.4%) | 0 (0.0%) |
| 4-Person Households | 49 (12.2%) | 0 (0.0%) |
| 5-Person Households | 57 (14.2%) | 0 (0.0%) |
| 6-Person Households | 2 (0.5%) | 0 (0.0%) |
| 7+ Person Households | 21 (5.2%) | 0 (0.0%) |
| Total | 342 (85.3%) | 59 (14.7%) |
Female Fertility in St George
Fertility by Age in St George
Average fertility rate in St George is 88.0 births per 1,000 women. Women in the age bracket of 20 to 34 years have the highest fertility rate with 145.0 births per 1,000 women. Women in the age bracket of 20 to 34 years acount for 67.9% of all women with births.
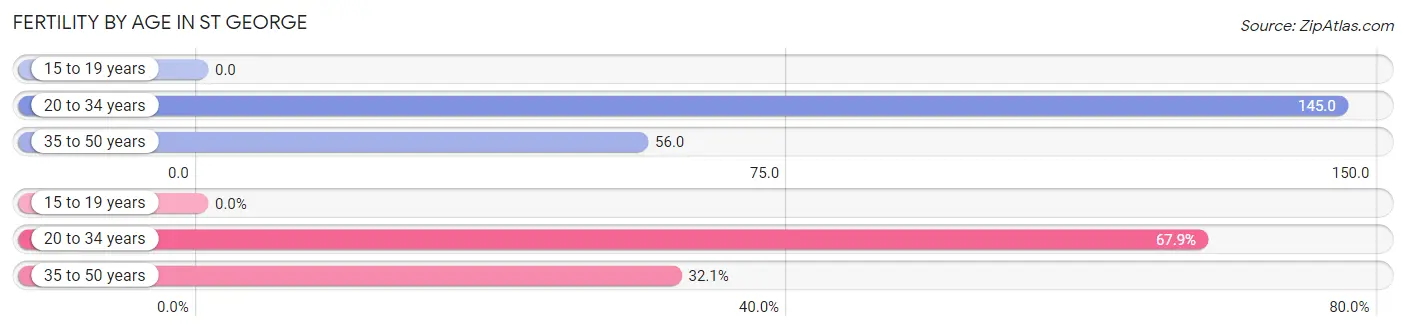
| Age Bracket | Women with Births | Births / 1,000 Women |
| 15 to 19 years | 0 (0.0%) | 0.0 |
| 20 to 34 years | 19 (67.9%) | 145.0 |
| 35 to 50 years | 9 (32.1%) | 56.0 |
| Total | 28 (100.0%) | 88.0 |
Fertility by Age by Marriage Status in St George
71.4% of women with births (28) in St George are married. The highest percentage of unmarried women with births falls into 35 to 50 years age bracket with 66.7% of them unmarried at the time of birth, while the lowest percentage of unmarried women with births belong to 20 to 34 years age bracket with 10.5% of them unmarried.
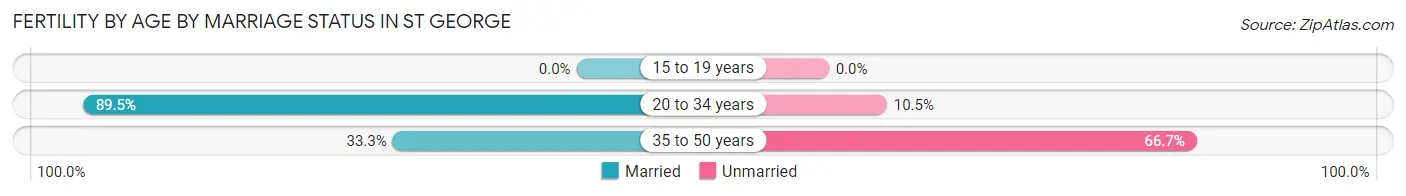
| Age Bracket | Married | Unmarried |
| 15 to 19 years | 0 (0.0%) | 0 (0.0%) |
| 20 to 34 years | 17 (89.5%) | 2 (10.5%) |
| 35 to 50 years | 3 (33.3%) | 6 (66.7%) |
| Total | 20 (71.4%) | 8 (28.6%) |
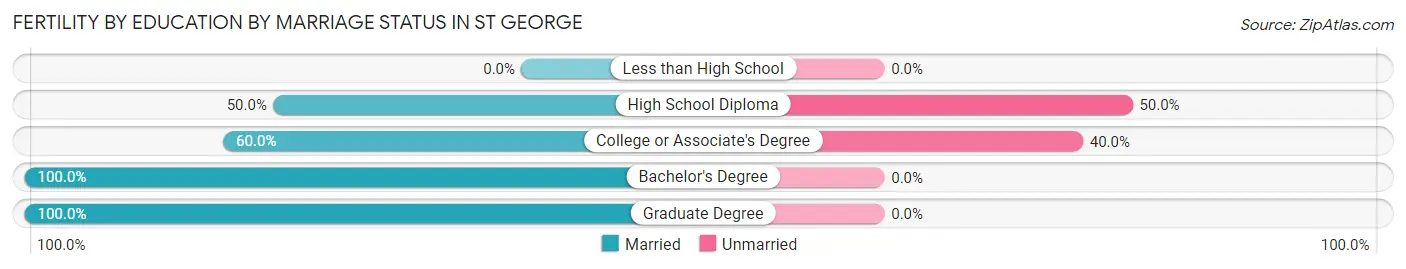
Fertility by Education in St George
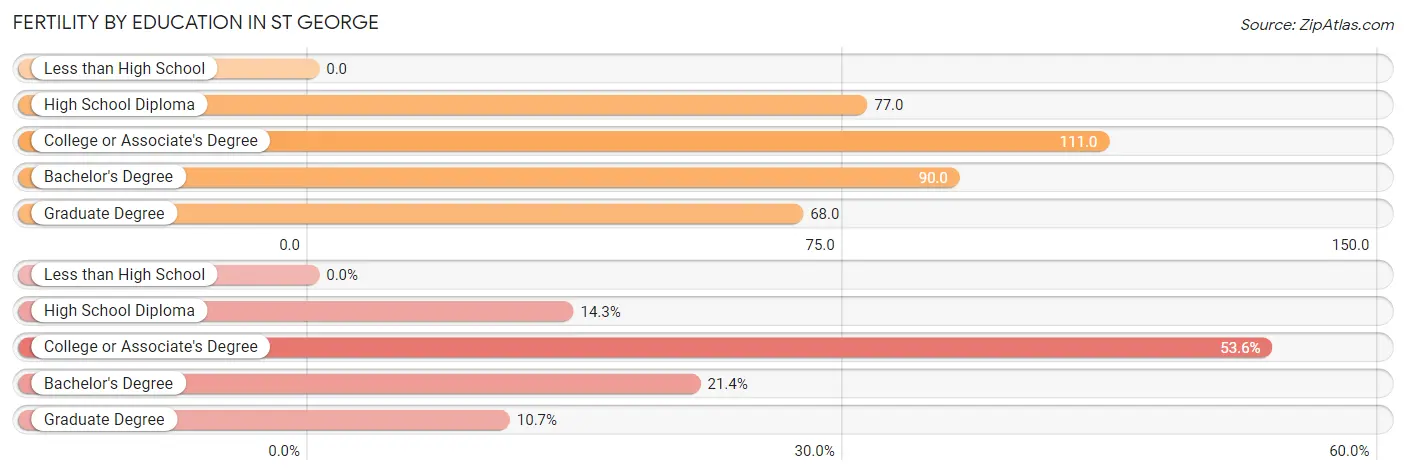
| Educational Attainment | Women with Births | Births / 1,000 Women |
| Less than High School | 0 (0.0%) | 0.0 |
| High School Diploma | 4 (14.3%) | 77.0 |
| College or Associate's Degree | 15 (53.6%) | 111.0 |
| Bachelor's Degree | 6 (21.4%) | 90.0 |
| Graduate Degree | 3 (10.7%) | 68.0 |
| Total | 28 (100.0%) | 88.0 |
Fertility by Education by Marriage Status in St George
28.6% of women with births in St George are unmarried. Women with the educational attainment of bachelor's degree are most likely to be married with 100.0% of them married at childbirth, while women with the educational attainment of high school diploma are least likely to be married with 50.0% of them unmarried at childbirth.
| Educational Attainment | Married | Unmarried |
| Less than High School | 0 (0.0%) | 0 (0.0%) |
| High School Diploma | 2 (50.0%) | 2 (50.0%) |
| College or Associate's Degree | 9 (60.0%) | 6 (40.0%) |
| Bachelor's Degree | 6 (100.0%) | 0 (0.0%) |
| Graduate Degree | 3 (100.0%) | 0 (0.0%) |
| Total | 20 (71.4%) | 8 (28.6%) |
Employment Characteristics in St George
Employment by Class of Employer in St George
Among the 643 employed individuals in St George, private company employees (293 | 45.6%), local government employees (108 | 16.8%), and state government employees (90 | 14.0%) make up the most common classes of employment.
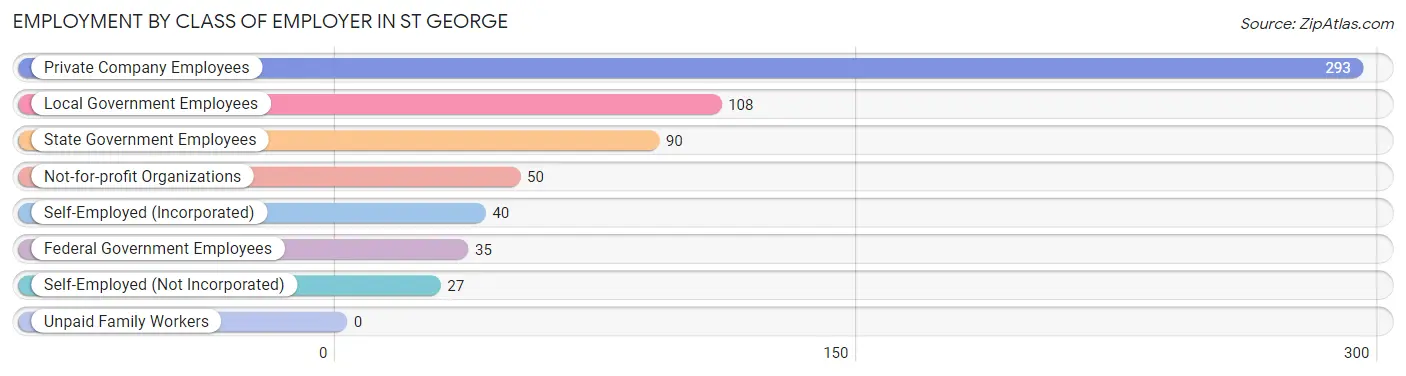
| Employer Class | # Employees | % Employees |
| Private Company Employees | 293 | 45.6% |
| Self-Employed (Incorporated) | 40 | 6.2% |
| Self-Employed (Not Incorporated) | 27 | 4.2% |
| Not-for-profit Organizations | 50 | 7.8% |
| Local Government Employees | 108 | 16.8% |
| State Government Employees | 90 | 14.0% |
| Federal Government Employees | 35 | 5.4% |
| Unpaid Family Workers | 0 | 0.0% |
| Total | 643 | 100.0% |
Employment Status by Age in St George
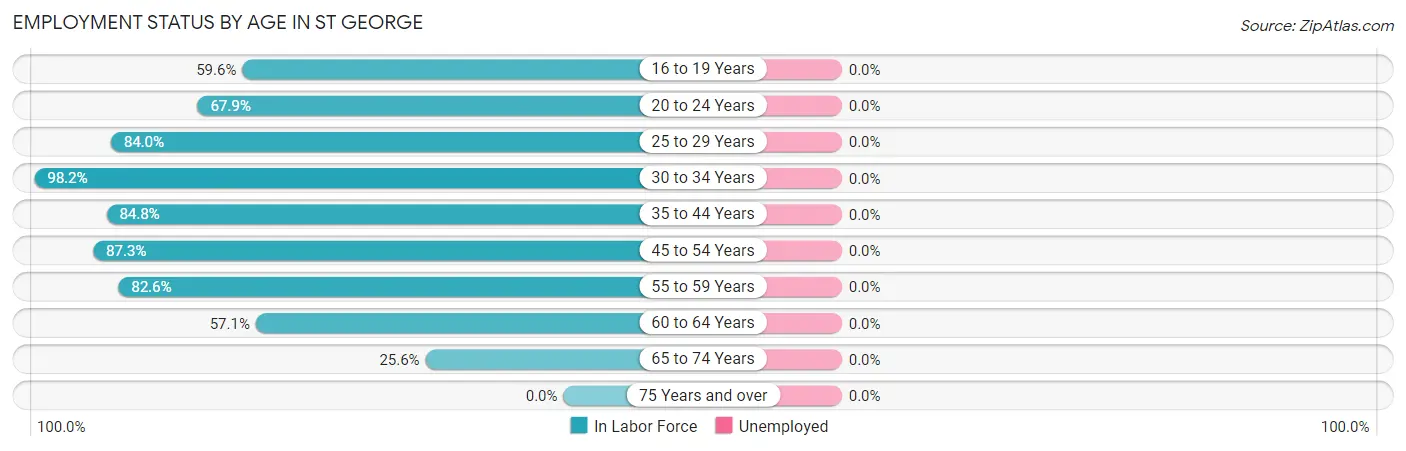
| Age Bracket | In Labor Force | Unemployed |
| 16 to 19 Years | 34 (59.6%) | 0 (0.0%) |
| 20 to 24 Years | 19 (67.9%) | 0 (0.0%) |
| 25 to 29 Years | 84 (84.0%) | 0 (0.0%) |
| 30 to 34 Years | 164 (98.2%) | 0 (0.0%) |
| 35 to 44 Years | 184 (84.8%) | 0 (0.0%) |
| 45 to 54 Years | 131 (87.3%) | 0 (0.0%) |
| 55 to 59 Years | 19 (82.6%) | 0 (0.0%) |
| 60 to 64 Years | 8 (57.1%) | 0 (0.0%) |
| 65 to 74 Years | 10 (25.6%) | 0 (0.0%) |
| 75 Years and over | 0 (0.0%) | 0 (0.0%) |
| Total | 653 (81.0%) | 0 (0.0%) |
Employment Status by Educational Attainment in St George
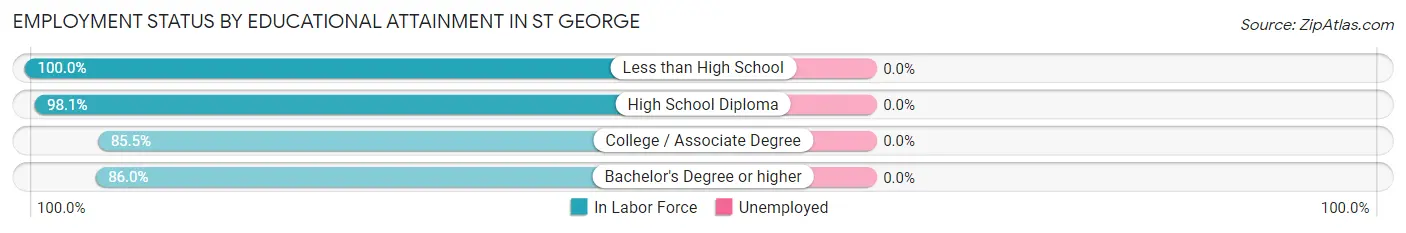
| Educational Attainment | In Labor Force | Unemployed |
| Less than High School | 14 (100.0%) | 0 (0.0%) |
| High School Diploma | 101 (98.1%) | 0 (0.0%) |
| College / Associate Degree | 247 (85.5%) | 0 (0.0%) |
| Bachelor's Degree or higher | 228 (86.0%) | 0 (0.0%) |
| Total | 590 (87.9%) | 0 (0.0%) |
Employment Occupations by Sex in St George
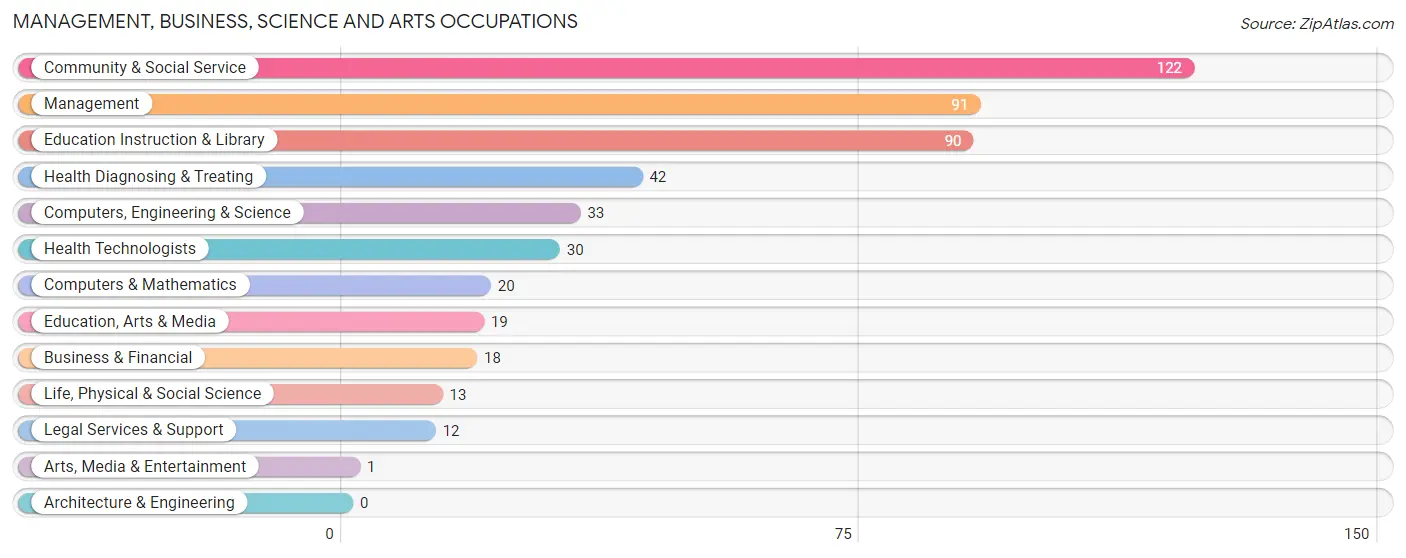
Management, Business, Science and Arts Occupations
The most common Management, Business, Science and Arts occupations in St George are Community & Social Service (122 | 19.3%), Management (91 | 14.4%), Education Instruction & Library (90 | 14.2%), Health Diagnosing & Treating (42 | 6.6%), and Computers, Engineering & Science (33 | 5.2%).
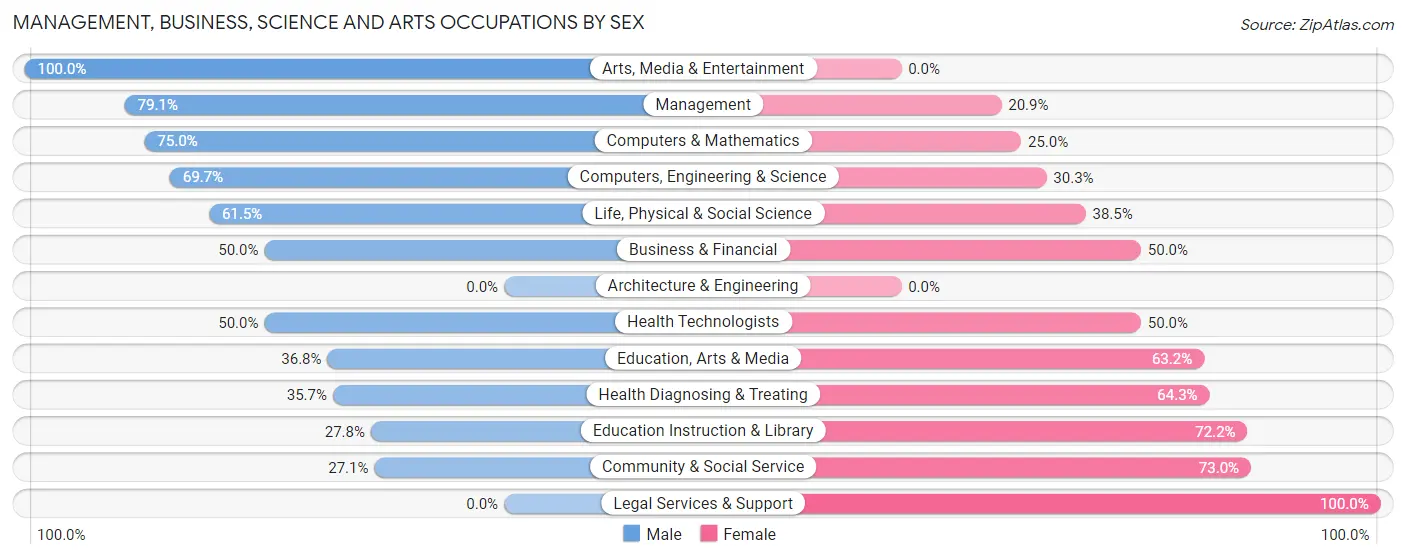
Management, Business, Science and Arts Occupations by Sex
Within the Management, Business, Science and Arts occupations in St George, the most male-oriented occupations are Arts, Media & Entertainment (100.0%), Management (79.1%), and Computers & Mathematics (75.0%), while the most female-oriented occupations are Legal Services & Support (100.0%), Community & Social Service (73.0%), and Education Instruction & Library (72.2%).
| Occupation | Male | Female |
| Management | 72 (79.1%) | 19 (20.9%) |
| Business & Financial | 9 (50.0%) | 9 (50.0%) |
| Computers, Engineering & Science | 23 (69.7%) | 10 (30.3%) |
| Computers & Mathematics | 15 (75.0%) | 5 (25.0%) |
| Architecture & Engineering | 0 (0.0%) | 0 (0.0%) |
| Life, Physical & Social Science | 8 (61.5%) | 5 (38.5%) |
| Community & Social Service | 33 (27.1%) | 89 (73.0%) |
| Education, Arts & Media | 7 (36.8%) | 12 (63.2%) |
| Legal Services & Support | 0 (0.0%) | 12 (100.0%) |
| Education Instruction & Library | 25 (27.8%) | 65 (72.2%) |
| Arts, Media & Entertainment | 1 (100.0%) | 0 (0.0%) |
| Health Diagnosing & Treating | 15 (35.7%) | 27 (64.3%) |
| Health Technologists | 15 (50.0%) | 15 (50.0%) |
| Total (Category) | 152 (49.7%) | 154 (50.3%) |
| Total (Overall) | 361 (57.0%) | 272 (43.0%) |
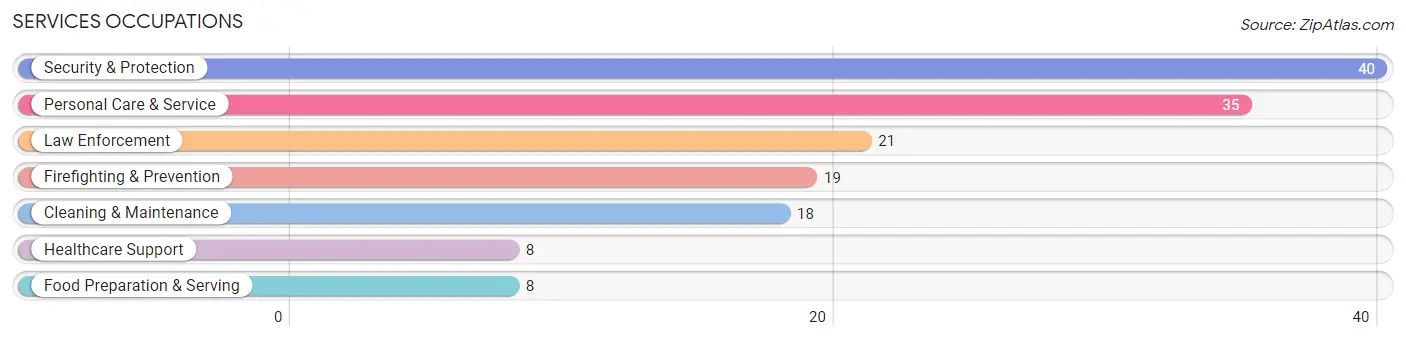
Services Occupations
The most common Services occupations in St George are Security & Protection (40 | 6.3%), Personal Care & Service (35 | 5.5%), Law Enforcement (21 | 3.3%), Firefighting & Prevention (19 | 3.0%), and Cleaning & Maintenance (18 | 2.8%).
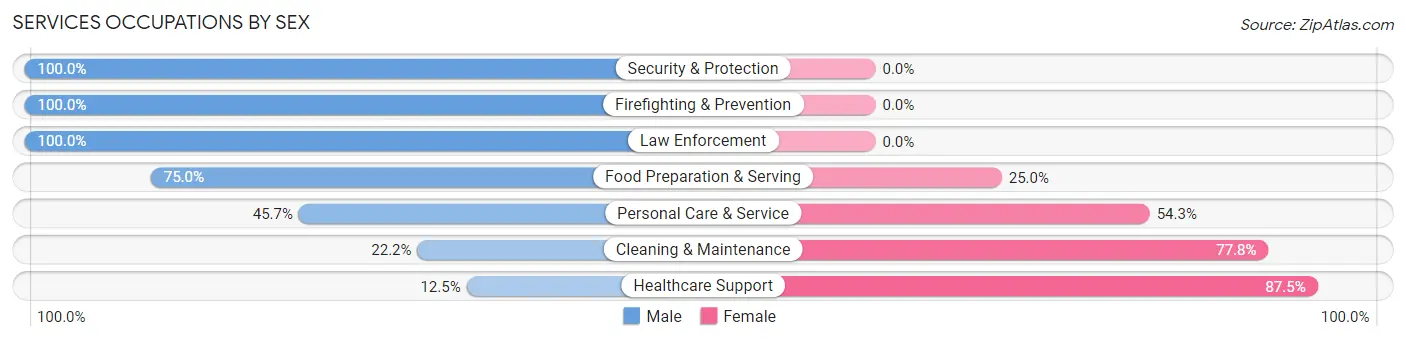
Services Occupations by Sex
Within the Services occupations in St George, the most male-oriented occupations are Security & Protection (100.0%), Firefighting & Prevention (100.0%), and Law Enforcement (100.0%), while the most female-oriented occupations are Healthcare Support (87.5%), Cleaning & Maintenance (77.8%), and Personal Care & Service (54.3%).
| Occupation | Male | Female |
| Healthcare Support | 1 (12.5%) | 7 (87.5%) |
| Security & Protection | 40 (100.0%) | 0 (0.0%) |
| Firefighting & Prevention | 19 (100.0%) | 0 (0.0%) |
| Law Enforcement | 21 (100.0%) | 0 (0.0%) |
| Food Preparation & Serving | 6 (75.0%) | 2 (25.0%) |
| Cleaning & Maintenance | 4 (22.2%) | 14 (77.8%) |
| Personal Care & Service | 16 (45.7%) | 19 (54.3%) |
| Total (Category) | 67 (61.5%) | 42 (38.5%) |
| Total (Overall) | 361 (57.0%) | 272 (43.0%) |
Sales and Office Occupations
The most common Sales and Office occupations in St George are Office & Administration (49 | 7.7%), and Sales & Related (24 | 3.8%).

Sales and Office Occupations by Sex

| Occupation | Male | Female |
| Sales & Related | 19 (79.2%) | 5 (20.8%) |
| Office & Administration | 5 (10.2%) | 44 (89.8%) |
| Total (Category) | 24 (32.9%) | 49 (67.1%) |
| Total (Overall) | 361 (57.0%) | 272 (43.0%) |
Natural Resources, Construction and Maintenance Occupations
The most common Natural Resources, Construction and Maintenance occupations in St George are Construction & Extraction (55 | 8.7%), and Installation, Maintenance & Repair (10 | 1.6%).
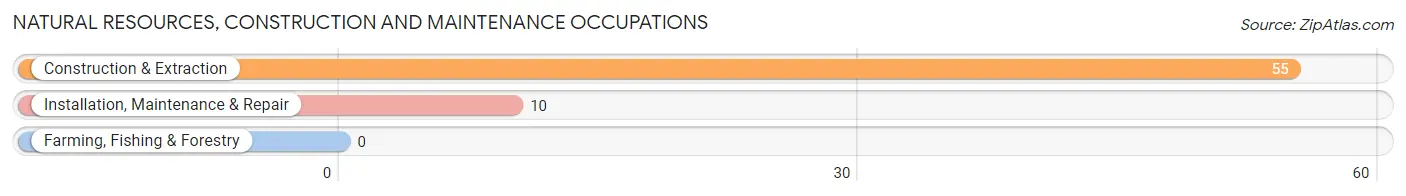
Natural Resources, Construction and Maintenance Occupations by Sex

| Occupation | Male | Female |
| Farming, Fishing & Forestry | 0 (0.0%) | 0 (0.0%) |
| Construction & Extraction | 55 (100.0%) | 0 (0.0%) |
| Installation, Maintenance & Repair | 10 (100.0%) | 0 (0.0%) |
| Total (Category) | 65 (100.0%) | 0 (0.0%) |
| Total (Overall) | 361 (57.0%) | 272 (43.0%) |
Production, Transportation and Moving Occupations
The most common Production, Transportation and Moving occupations in St George are Production (58 | 9.2%), Transportation (11 | 1.7%), and Material Moving (11 | 1.7%).
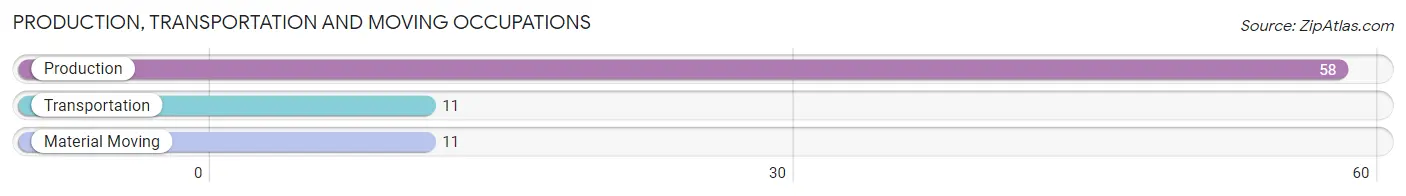
Production, Transportation and Moving Occupations by Sex
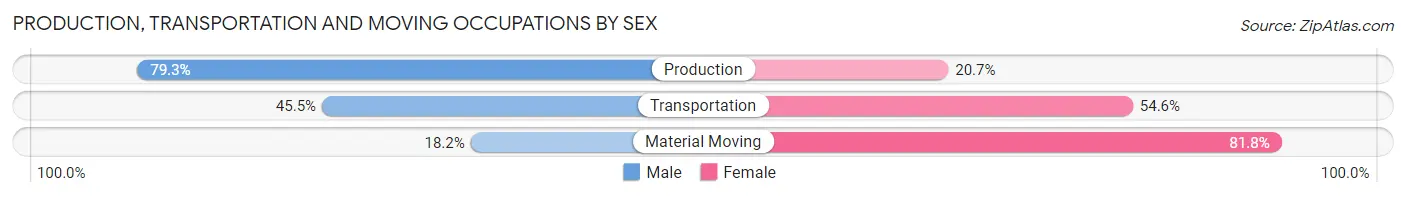
| Occupation | Male | Female |
| Production | 46 (79.3%) | 12 (20.7%) |
| Transportation | 5 (45.5%) | 6 (54.5%) |
| Material Moving | 2 (18.2%) | 9 (81.8%) |
| Total (Category) | 53 (66.2%) | 27 (33.8%) |
| Total (Overall) | 361 (57.0%) | 272 (43.0%) |
Employment Industries by Sex in St George
Employment Industries in St George
The major employment industries in St George include Educational Services (138 | 21.8%), Health Care & Social Assistance (95 | 15.0%), Public Administration (73 | 11.5%), Professional & Scientific (58 | 9.2%), and Construction (52 | 8.2%).
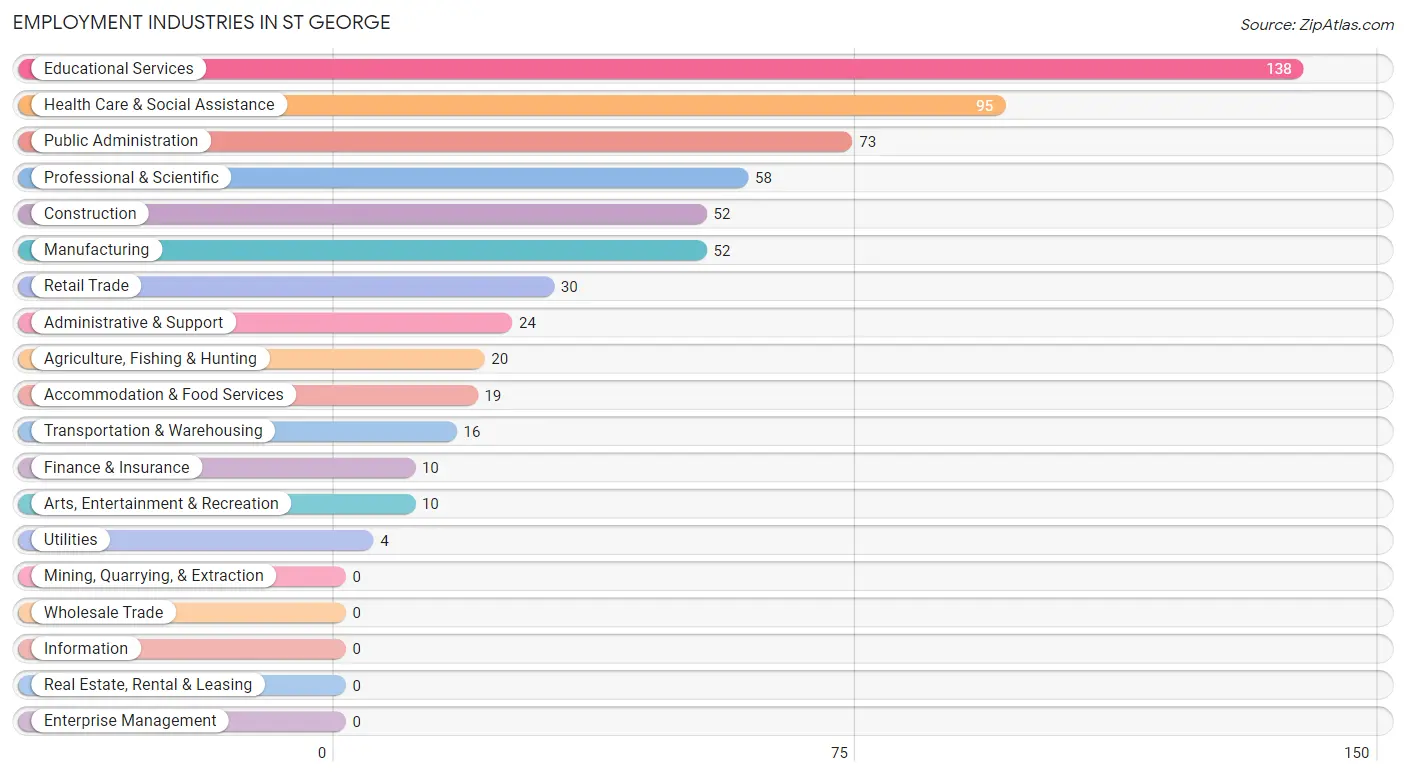
Employment Industries by Sex in St George
The St George industries that see more men than women are Agriculture, Fishing & Hunting (100.0%), Construction (100.0%), and Transportation & Warehousing (100.0%), whereas the industries that tend to have a higher number of women are Administrative & Support (87.5%), Educational Services (73.9%), and Finance & Insurance (70.0%).
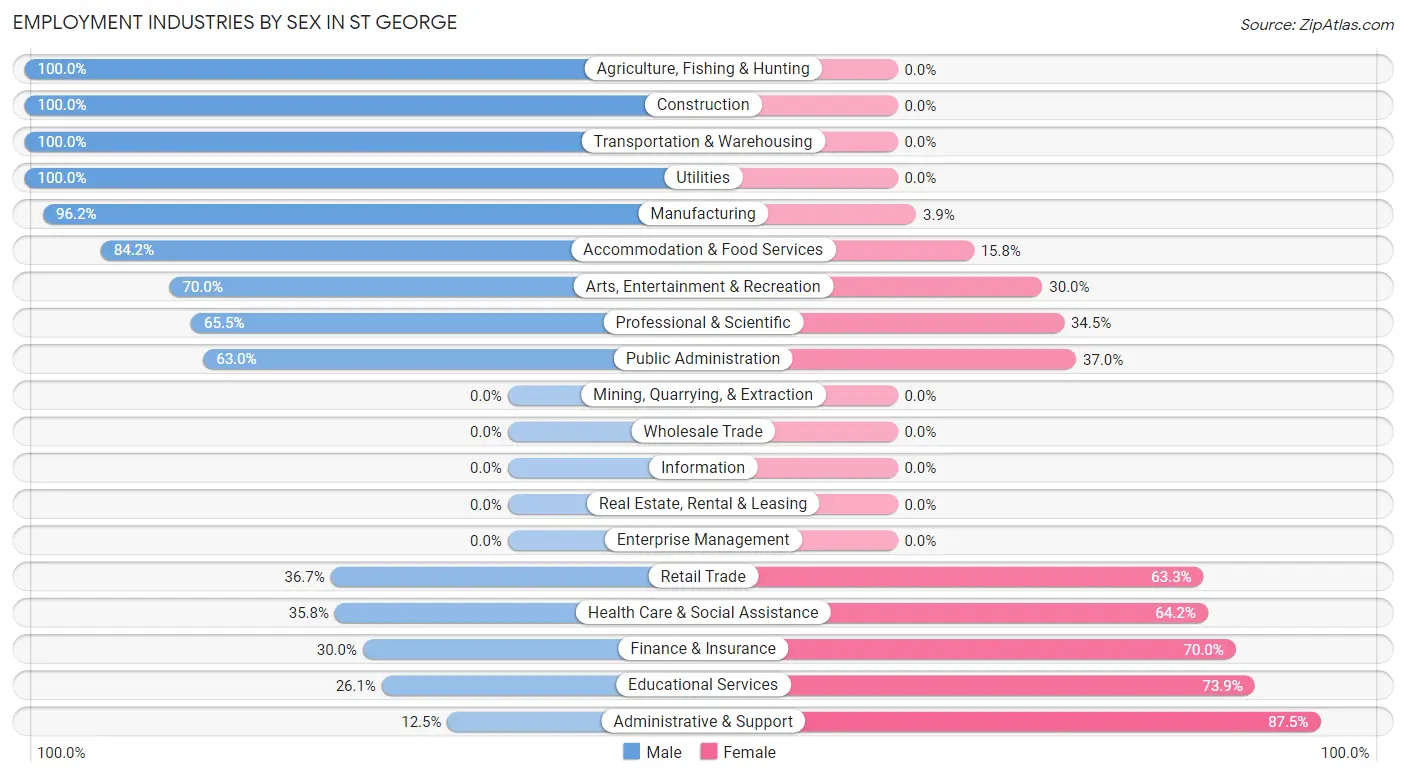
| Industry | Male | Female |
| Agriculture, Fishing & Hunting | 20 (100.0%) | 0 (0.0%) |
| Mining, Quarrying, & Extraction | 0 (0.0%) | 0 (0.0%) |
| Construction | 52 (100.0%) | 0 (0.0%) |
| Manufacturing | 50 (96.2%) | 2 (3.8%) |
| Wholesale Trade | 0 (0.0%) | 0 (0.0%) |
| Retail Trade | 11 (36.7%) | 19 (63.3%) |
| Transportation & Warehousing | 16 (100.0%) | 0 (0.0%) |
| Utilities | 4 (100.0%) | 0 (0.0%) |
| Information | 0 (0.0%) | 0 (0.0%) |
| Finance & Insurance | 3 (30.0%) | 7 (70.0%) |
| Real Estate, Rental & Leasing | 0 (0.0%) | 0 (0.0%) |
| Professional & Scientific | 38 (65.5%) | 20 (34.5%) |
| Enterprise Management | 0 (0.0%) | 0 (0.0%) |
| Administrative & Support | 3 (12.5%) | 21 (87.5%) |
| Educational Services | 36 (26.1%) | 102 (73.9%) |
| Health Care & Social Assistance | 34 (35.8%) | 61 (64.2%) |
| Arts, Entertainment & Recreation | 7 (70.0%) | 3 (30.0%) |
| Accommodation & Food Services | 16 (84.2%) | 3 (15.8%) |
| Public Administration | 46 (63.0%) | 27 (37.0%) |
| Total | 361 (57.0%) | 272 (43.0%) |
Education in St George
School Enrollment in St George
The most common levels of schooling among the 349 students in St George are elementary school (114 | 32.7%), middle school (79 | 22.6%), and high school (61 | 17.5%).
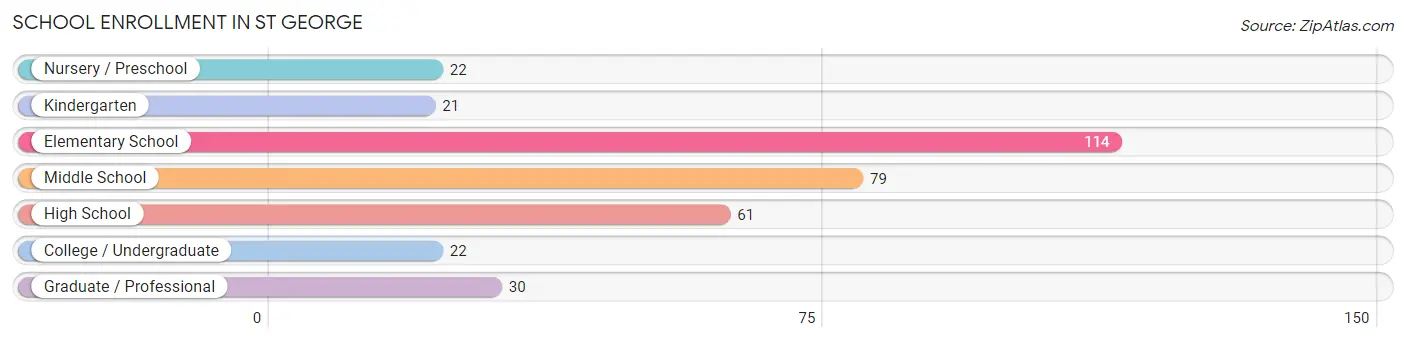
| School Level | # Students | % Students |
| Nursery / Preschool | 22 | 6.3% |
| Kindergarten | 21 | 6.0% |
| Elementary School | 114 | 32.7% |
| Middle School | 79 | 22.6% |
| High School | 61 | 17.5% |
| College / Undergraduate | 22 | 6.3% |
| Graduate / Professional | 30 | 8.6% |
| Total | 349 | 100.0% |
School Enrollment by Age by Funding Source in St George
Out of a total of 349 students who are enrolled in schools in St George, 35 (10.0%) attend a private institution, while the remaining 314 (90.0%) are enrolled in public schools. The age group of 3 to 4 year olds has the highest likelihood of being enrolled in private schools, with 8 (57.1% in the age bracket) enrolled. Conversely, the age group of 10 to 14 year olds has the lowest likelihood of being enrolled in a private school, with 114 (100.0% in the age bracket) attending a public institution.
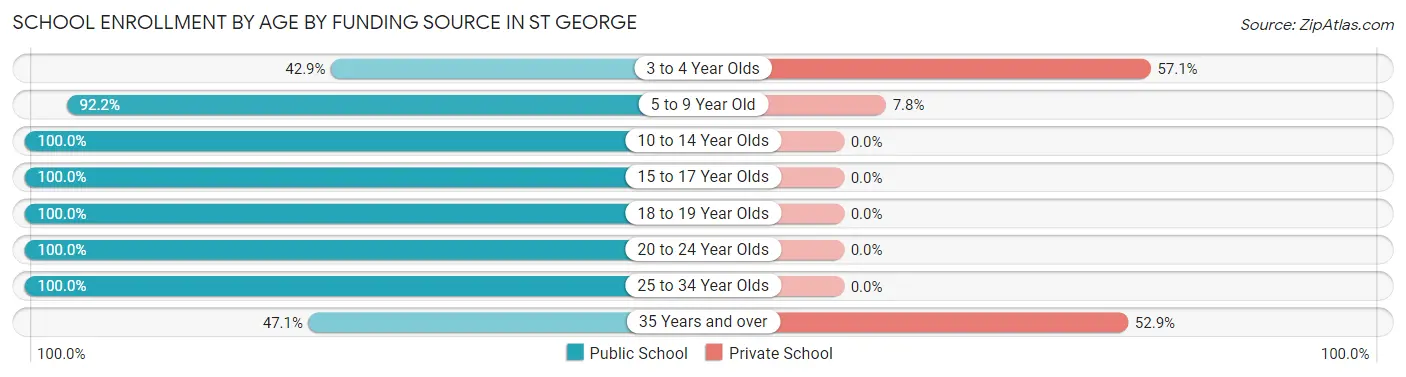
| Age Bracket | Public School | Private School |
| 3 to 4 Year Olds | 6 (42.9%) | 8 (57.1%) |
| 5 to 9 Year Old | 106 (92.2%) | 9 (7.8%) |
| 10 to 14 Year Olds | 114 (100.0%) | 0 (0.0%) |
| 15 to 17 Year Olds | 48 (100.0%) | 0 (0.0%) |
| 18 to 19 Year Olds | 6 (100.0%) | 0 (0.0%) |
| 20 to 24 Year Olds | 14 (100.0%) | 0 (0.0%) |
| 25 to 34 Year Olds | 4 (100.0%) | 0 (0.0%) |
| 35 Years and over | 16 (47.1%) | 18 (52.9%) |
| Total | 314 (90.0%) | 35 (10.0%) |
Educational Attainment by Field of Study in St George
Education (63 | 21.4%), business (58 | 19.7%), liberal arts & history (29 | 9.8%), arts & humanities (26 | 8.8%), and bio, nature & agricultural (23 | 7.8%) are the most common fields of study among 295 individuals in St George who have obtained a bachelor's degree or higher.
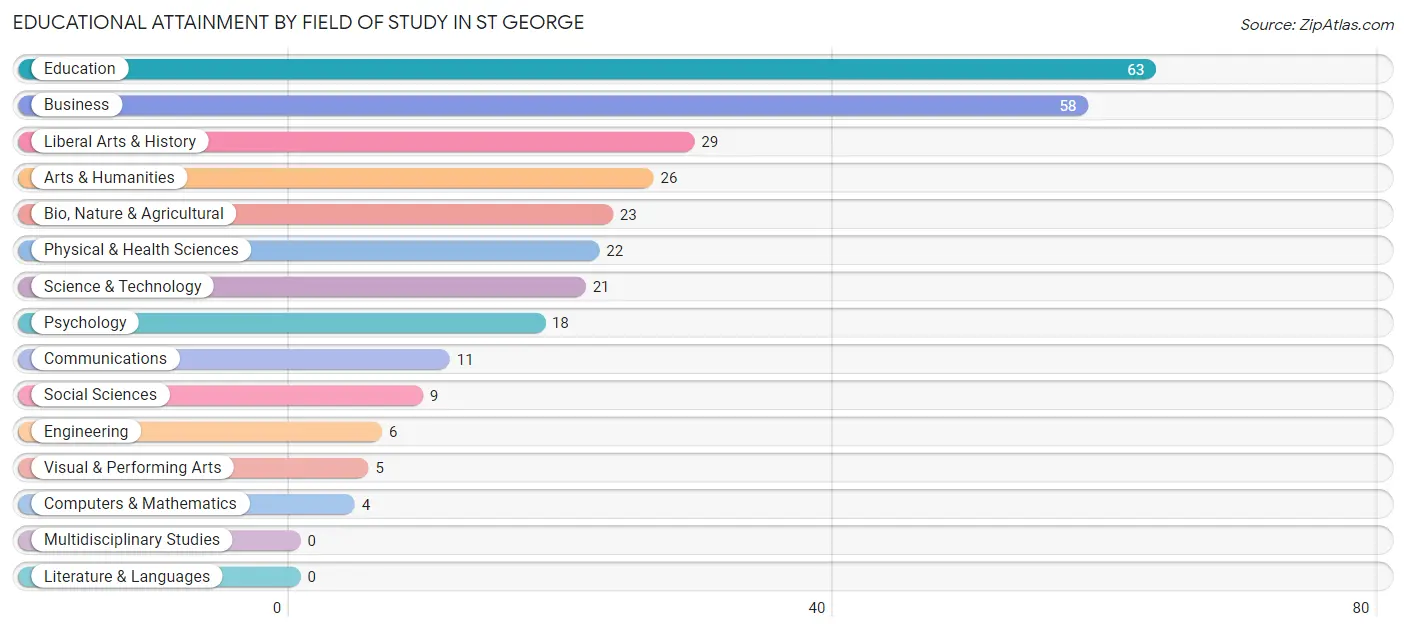
| Field of Study | # Graduates | % Graduates |
| Computers & Mathematics | 4 | 1.4% |
| Bio, Nature & Agricultural | 23 | 7.8% |
| Physical & Health Sciences | 22 | 7.5% |
| Psychology | 18 | 6.1% |
| Social Sciences | 9 | 3.0% |
| Engineering | 6 | 2.0% |
| Multidisciplinary Studies | 0 | 0.0% |
| Science & Technology | 21 | 7.1% |
| Business | 58 | 19.7% |
| Education | 63 | 21.4% |
| Literature & Languages | 0 | 0.0% |
| Liberal Arts & History | 29 | 9.8% |
| Visual & Performing Arts | 5 | 1.7% |
| Communications | 11 | 3.7% |
| Arts & Humanities | 26 | 8.8% |
| Total | 295 | 100.0% |
Transportation & Commute in St George
Vehicle Availability by Sex in St George
The most prevalent vehicle ownership categories in St George are males with 2 vehicles (218, accounting for 57.5%) and females with 2 vehicles (151, making up 82.6%).
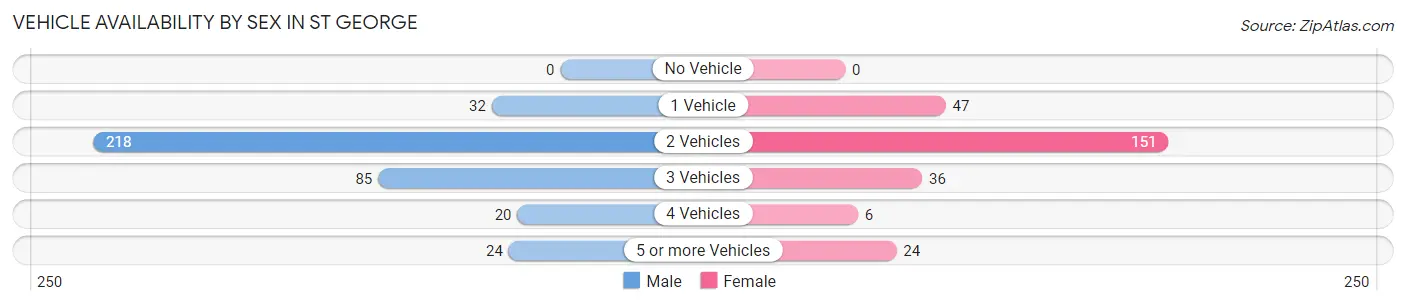
| Vehicles Available | Male | Female |
| No Vehicle | 0 (0.0%) | 0 (0.0%) |
| 1 Vehicle | 32 (8.4%) | 47 (17.8%) |
| 2 Vehicles | 218 (57.5%) | 151 (57.2%) |
| 3 Vehicles | 85 (22.4%) | 36 (13.6%) |
| 4 Vehicles | 20 (5.3%) | 6 (2.3%) |
| 5 or more Vehicles | 24 (6.3%) | 24 (9.1%) |
| Total | 379 (100.0%) | 264 (100.0%) |
Commute Time in St George
The most frequently occuring commute durations in St George are 20 to 24 minutes (121 commuters, 19.3%), 15 to 19 minutes (99 commuters, 15.8%), and 25 to 29 minutes (87 commuters, 13.9%).
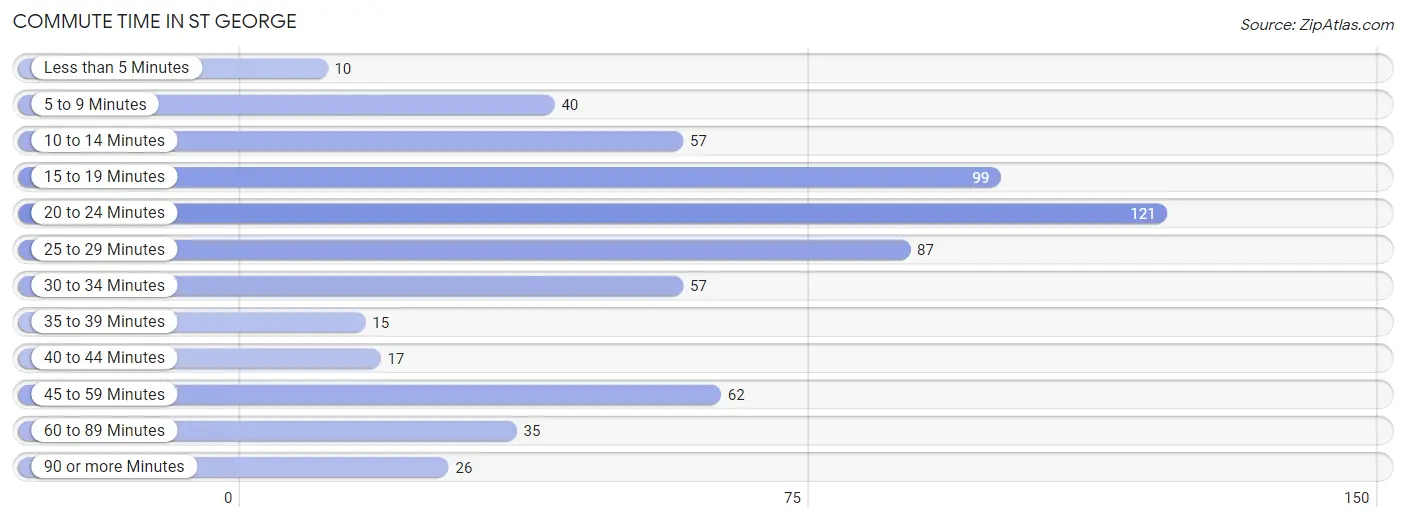
| Commute Time | # Commuters | % Commuters |
| Less than 5 Minutes | 10 | 1.6% |
| 5 to 9 Minutes | 40 | 6.4% |
| 10 to 14 Minutes | 57 | 9.1% |
| 15 to 19 Minutes | 99 | 15.8% |
| 20 to 24 Minutes | 121 | 19.3% |
| 25 to 29 Minutes | 87 | 13.9% |
| 30 to 34 Minutes | 57 | 9.1% |
| 35 to 39 Minutes | 15 | 2.4% |
| 40 to 44 Minutes | 17 | 2.7% |
| 45 to 59 Minutes | 62 | 9.9% |
| 60 to 89 Minutes | 35 | 5.6% |
| 90 or more Minutes | 26 | 4.2% |
Commute Time by Sex in St George
The most common commute times in St George are 20 to 24 minutes (70 commuters, 18.8%) for males and 20 to 24 minutes (51 commuters, 20.1%) for females.
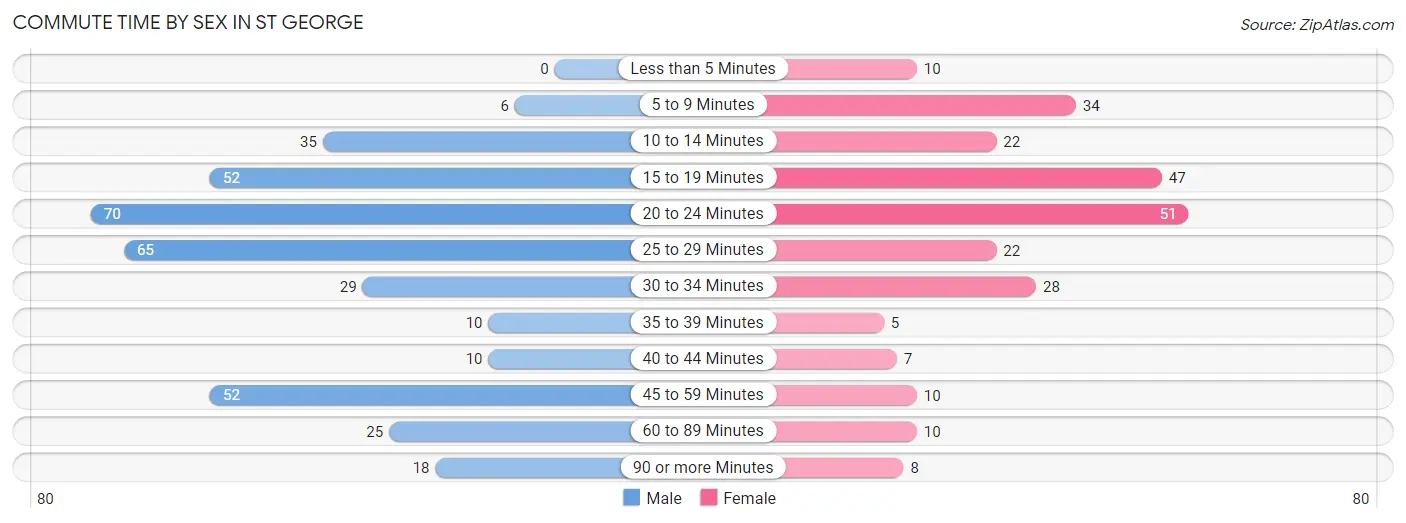
| Commute Time | Male | Female |
| Less than 5 Minutes | 0 (0.0%) | 10 (3.9%) |
| 5 to 9 Minutes | 6 (1.6%) | 34 (13.4%) |
| 10 to 14 Minutes | 35 (9.4%) | 22 (8.7%) |
| 15 to 19 Minutes | 52 (14.0%) | 47 (18.5%) |
| 20 to 24 Minutes | 70 (18.8%) | 51 (20.1%) |
| 25 to 29 Minutes | 65 (17.5%) | 22 (8.7%) |
| 30 to 34 Minutes | 29 (7.8%) | 28 (11.0%) |
| 35 to 39 Minutes | 10 (2.7%) | 5 (2.0%) |
| 40 to 44 Minutes | 10 (2.7%) | 7 (2.8%) |
| 45 to 59 Minutes | 52 (14.0%) | 10 (3.9%) |
| 60 to 89 Minutes | 25 (6.7%) | 10 (3.9%) |
| 90 or more Minutes | 18 (4.8%) | 8 (3.2%) |
Time of Departure to Work by Sex in St George
The most frequent times of departure to work in St George are 7:00 AM to 7:29 AM (88, 23.7%) for males and 7:30 AM to 7:59 AM (73, 28.7%) for females.
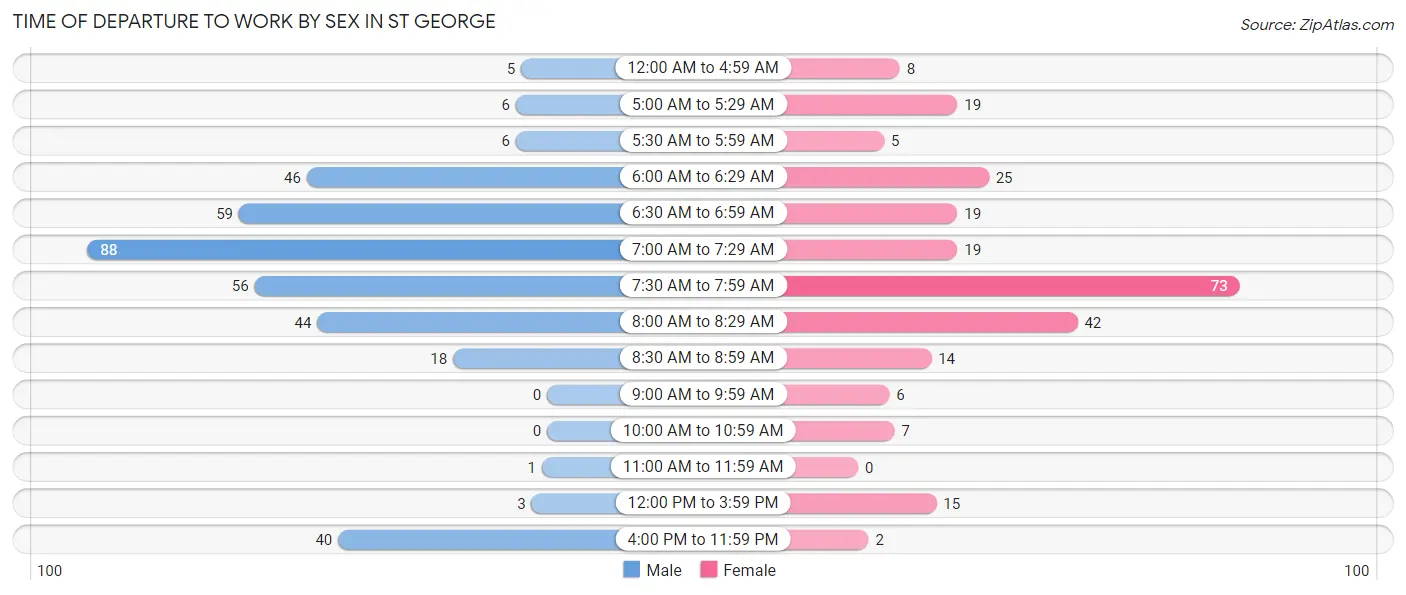
| Time of Departure | Male | Female |
| 12:00 AM to 4:59 AM | 5 (1.3%) | 8 (3.2%) |
| 5:00 AM to 5:29 AM | 6 (1.6%) | 19 (7.5%) |
| 5:30 AM to 5:59 AM | 6 (1.6%) | 5 (2.0%) |
| 6:00 AM to 6:29 AM | 46 (12.4%) | 25 (9.8%) |
| 6:30 AM to 6:59 AM | 59 (15.9%) | 19 (7.5%) |
| 7:00 AM to 7:29 AM | 88 (23.7%) | 19 (7.5%) |
| 7:30 AM to 7:59 AM | 56 (15.0%) | 73 (28.7%) |
| 8:00 AM to 8:29 AM | 44 (11.8%) | 42 (16.5%) |
| 8:30 AM to 8:59 AM | 18 (4.8%) | 14 (5.5%) |
| 9:00 AM to 9:59 AM | 0 (0.0%) | 6 (2.4%) |
| 10:00 AM to 10:59 AM | 0 (0.0%) | 7 (2.8%) |
| 11:00 AM to 11:59 AM | 1 (0.3%) | 0 (0.0%) |
| 12:00 PM to 3:59 PM | 3 (0.8%) | 15 (5.9%) |
| 4:00 PM to 11:59 PM | 40 (10.7%) | 2 (0.8%) |
| Total | 372 (100.0%) | 254 (100.0%) |
Housing Occupancy in St George
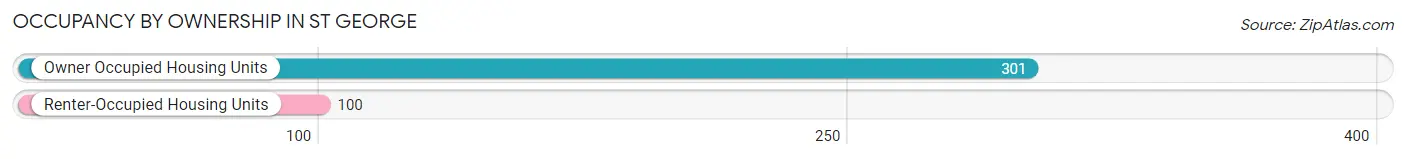
Occupancy by Ownership in St George
Of the total 401 dwellings in St George, owner-occupied units account for 301 (75.1%), while renter-occupied units make up 100 (24.9%).
| Occupancy | # Housing Units | % Housing Units |
| Owner Occupied Housing Units | 301 | 75.1% |
| Renter-Occupied Housing Units | 100 | 24.9% |
| Total Occupied Housing Units | 401 | 100.0% |
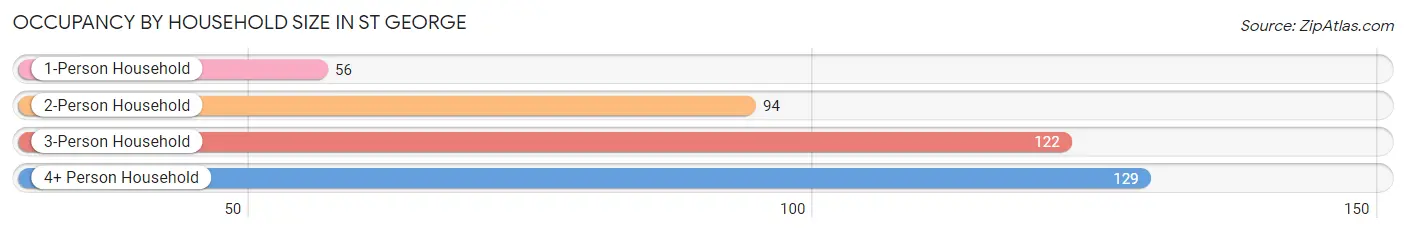
Occupancy by Household Size in St George
| Household Size | # Housing Units | % Housing Units |
| 1-Person Household | 56 | 14.0% |
| 2-Person Household | 94 | 23.4% |
| 3-Person Household | 122 | 30.4% |
| 4+ Person Household | 129 | 32.2% |
| Total Housing Units | 401 | 100.0% |
Occupancy by Ownership by Household Size in St George
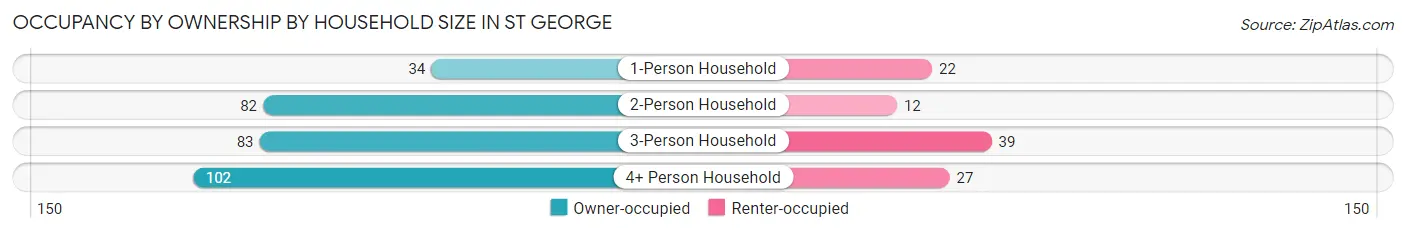
| Household Size | Owner-occupied | Renter-occupied |
| 1-Person Household | 34 (60.7%) | 22 (39.3%) |
| 2-Person Household | 82 (87.2%) | 12 (12.8%) |
| 3-Person Household | 83 (68.0%) | 39 (32.0%) |
| 4+ Person Household | 102 (79.1%) | 27 (20.9%) |
| Total Housing Units | 301 (75.1%) | 100 (24.9%) |
Occupancy by Educational Attainment in St George
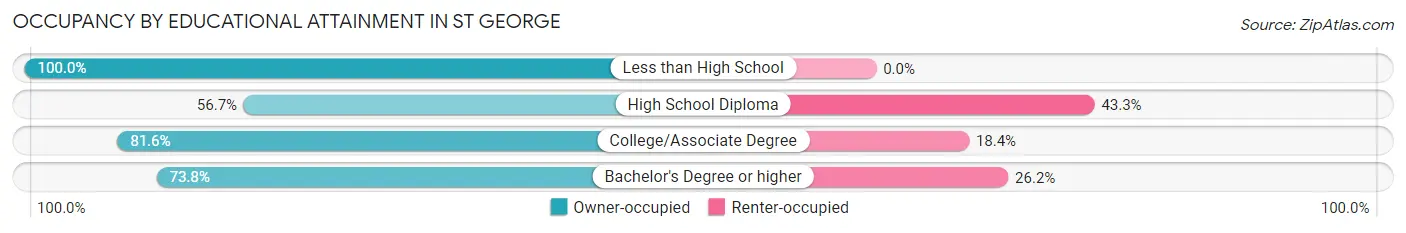
| Household Size | Owner-occupied | Renter-occupied |
| Less than High School | 11 (100.0%) | 0 (0.0%) |
| High School Diploma | 38 (56.7%) | 29 (43.3%) |
| College/Associate Degree | 142 (81.6%) | 32 (18.4%) |
| Bachelor's Degree or higher | 110 (73.8%) | 39 (26.2%) |
Occupancy by Age of Householder in St George
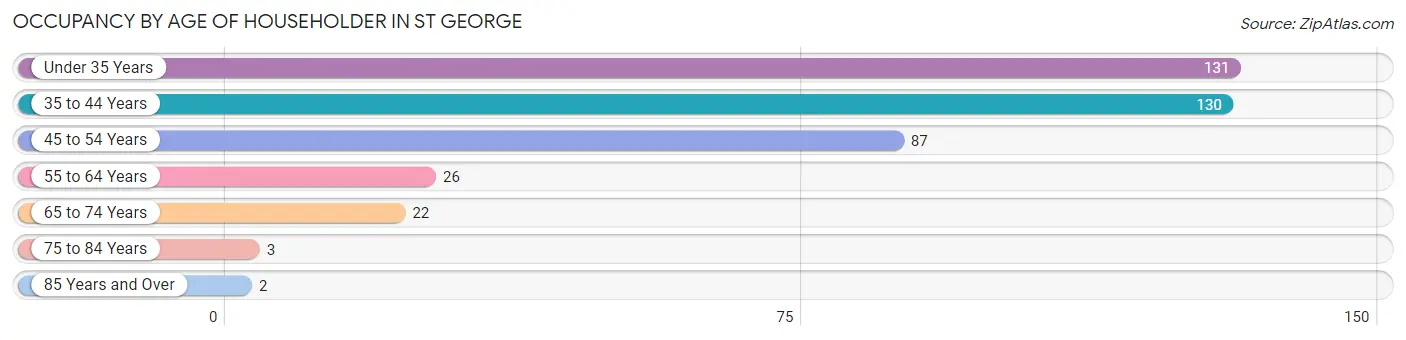
| Age Bracket | # Households | % Households |
| Under 35 Years | 131 | 32.7% |
| 35 to 44 Years | 130 | 32.4% |
| 45 to 54 Years | 87 | 21.7% |
| 55 to 64 Years | 26 | 6.5% |
| 65 to 74 Years | 22 | 5.5% |
| 75 to 84 Years | 3 | 0.7% |
| 85 Years and Over | 2 | 0.5% |
| Total | 401 | 100.0% |
Housing Finances in St George
Median Income by Occupancy in St George
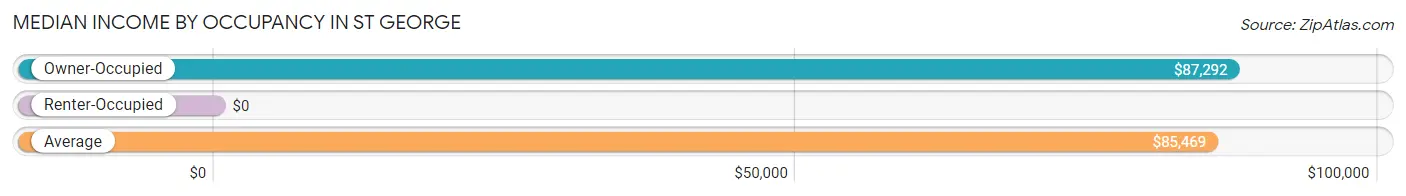
| Occupancy Type | # Households | Median Income |
| Owner-Occupied | 301 (75.1%) | $87,292 |
| Renter-Occupied | 100 (24.9%) | $0 |
| Average | 401 (100.0%) | $85,469 |
Occupancy by Householder Income Bracket in St George
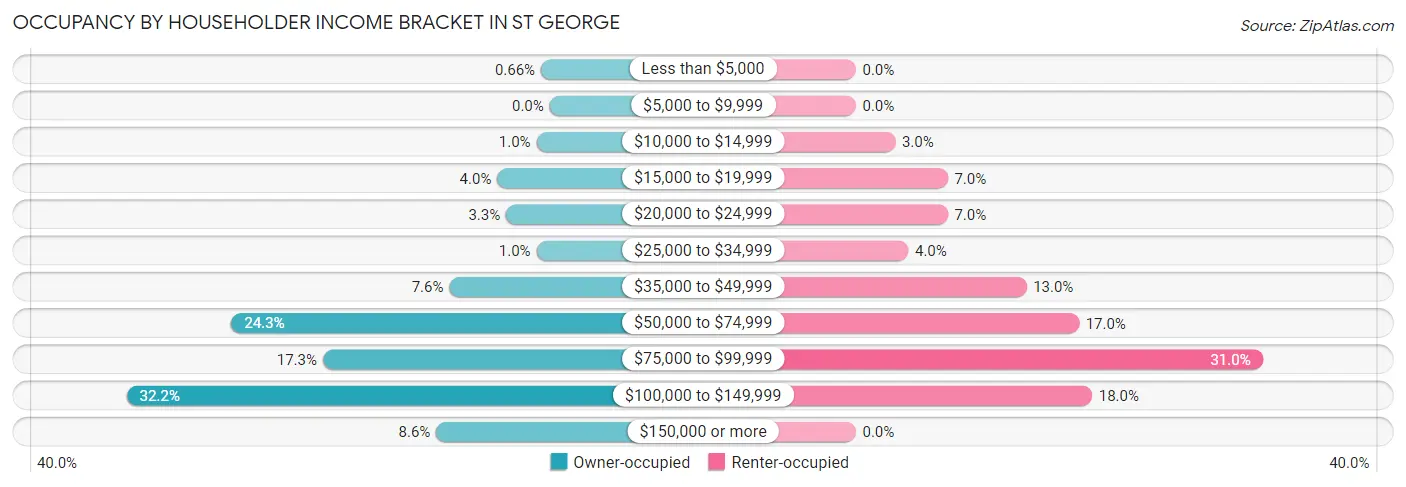
| Income Bracket | Owner-occupied | Renter-occupied |
| Less than $5,000 | 2 (0.7%) | 0 (0.0%) |
| $5,000 to $9,999 | 0 (0.0%) | 0 (0.0%) |
| $10,000 to $14,999 | 3 (1.0%) | 3 (3.0%) |
| $15,000 to $19,999 | 12 (4.0%) | 7 (7.0%) |
| $20,000 to $24,999 | 10 (3.3%) | 7 (7.0%) |
| $25,000 to $34,999 | 3 (1.0%) | 4 (4.0%) |
| $35,000 to $49,999 | 23 (7.6%) | 13 (13.0%) |
| $50,000 to $74,999 | 73 (24.2%) | 17 (17.0%) |
| $75,000 to $99,999 | 52 (17.3%) | 31 (31.0%) |
| $100,000 to $149,999 | 97 (32.2%) | 18 (18.0%) |
| $150,000 or more | 26 (8.6%) | 0 (0.0%) |
| Total | 301 (100.0%) | 100 (100.0%) |
Monthly Housing Cost Tiers in St George
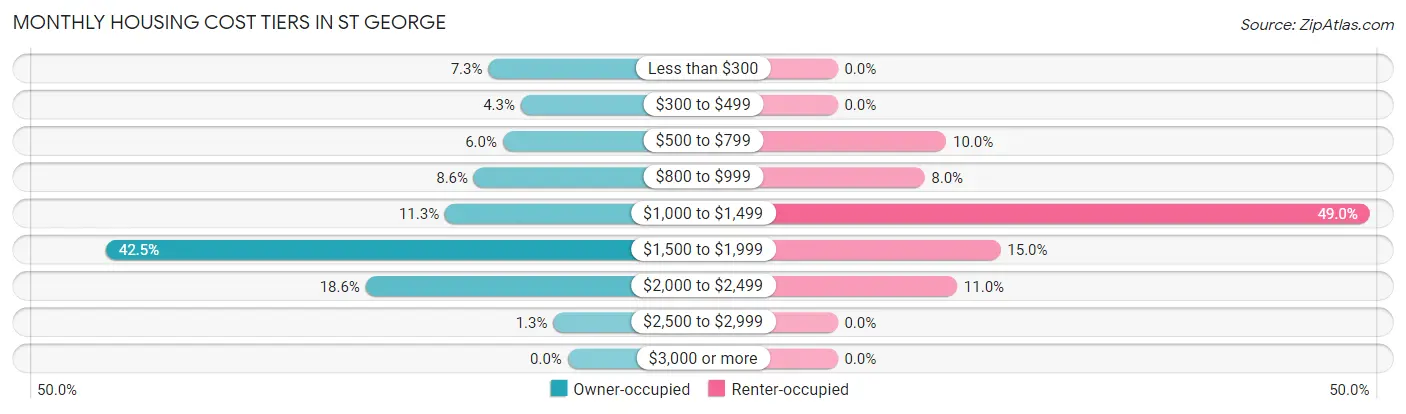
| Monthly Cost | Owner-occupied | Renter-occupied |
| Less than $300 | 22 (7.3%) | 0 (0.0%) |
| $300 to $499 | 13 (4.3%) | 0 (0.0%) |
| $500 to $799 | 18 (6.0%) | 10 (10.0%) |
| $800 to $999 | 26 (8.6%) | 8 (8.0%) |
| $1,000 to $1,499 | 34 (11.3%) | 49 (49.0%) |
| $1,500 to $1,999 | 128 (42.5%) | 15 (15.0%) |
| $2,000 to $2,499 | 56 (18.6%) | 11 (11.0%) |
| $2,500 to $2,999 | 4 (1.3%) | 0 (0.0%) |
| $3,000 or more | 0 (0.0%) | 0 (0.0%) |
| Total | 301 (100.0%) | 100 (100.0%) |
Physical Housing Characteristics in St George
Housing Structures in St George
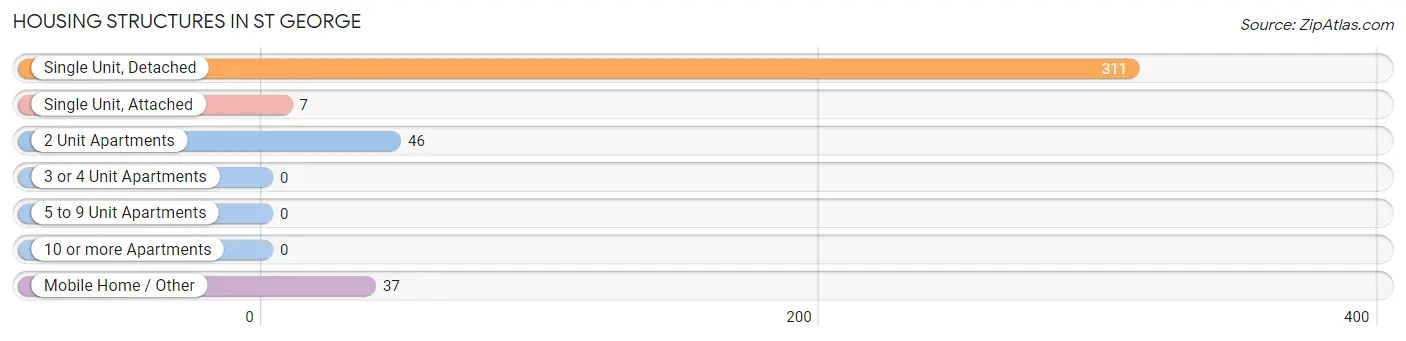
| Structure Type | # Housing Units | % Housing Units |
| Single Unit, Detached | 311 | 77.6% |
| Single Unit, Attached | 7 | 1.8% |
| 2 Unit Apartments | 46 | 11.5% |
| 3 or 4 Unit Apartments | 0 | 0.0% |
| 5 to 9 Unit Apartments | 0 | 0.0% |
| 10 or more Apartments | 0 | 0.0% |
| Mobile Home / Other | 37 | 9.2% |
| Total | 401 | 100.0% |
Housing Structures by Occupancy in St George
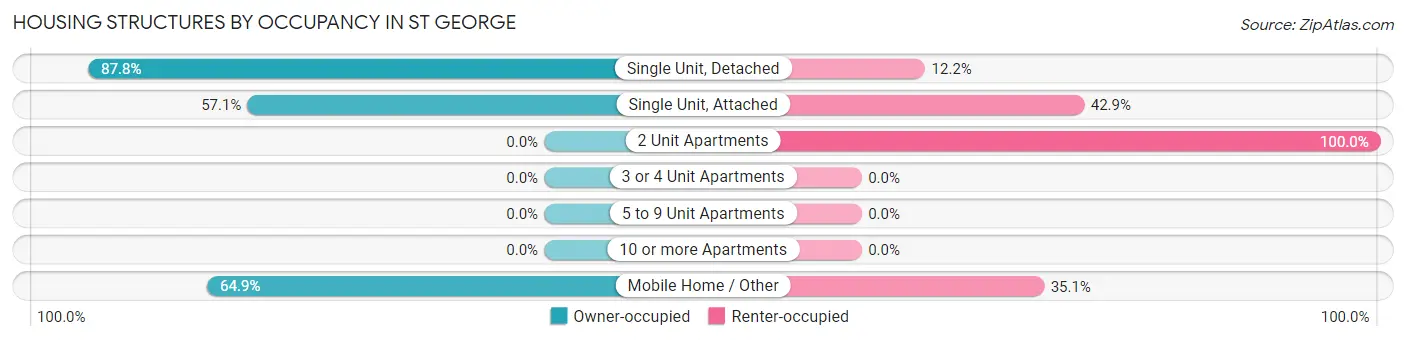
| Structure Type | Owner-occupied | Renter-occupied |
| Single Unit, Detached | 273 (87.8%) | 38 (12.2%) |
| Single Unit, Attached | 4 (57.1%) | 3 (42.9%) |
| 2 Unit Apartments | 0 (0.0%) | 46 (100.0%) |
| 3 or 4 Unit Apartments | 0 (0.0%) | 0 (0.0%) |
| 5 to 9 Unit Apartments | 0 (0.0%) | 0 (0.0%) |
| 10 or more Apartments | 0 (0.0%) | 0 (0.0%) |
| Mobile Home / Other | 24 (64.9%) | 13 (35.1%) |
| Total | 301 (75.1%) | 100 (24.9%) |
Housing Structures by Number of Rooms in St George
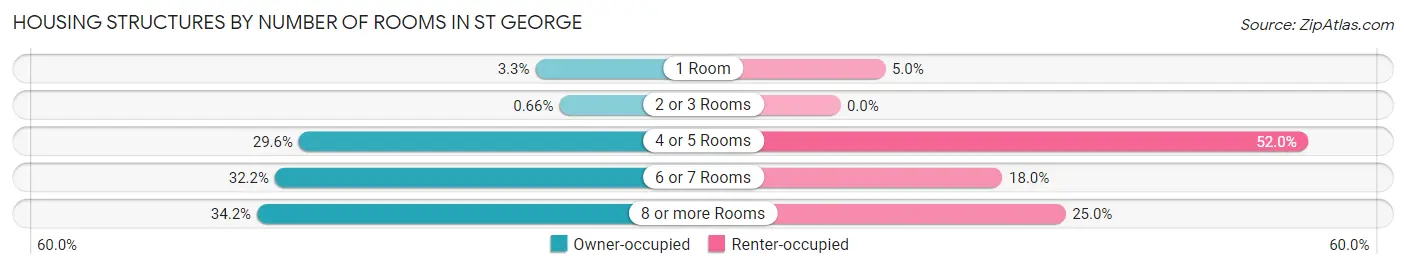
| Number of Rooms | Owner-occupied | Renter-occupied |
| 1 Room | 10 (3.3%) | 5 (5.0%) |
| 2 or 3 Rooms | 2 (0.7%) | 0 (0.0%) |
| 4 or 5 Rooms | 89 (29.6%) | 52 (52.0%) |
| 6 or 7 Rooms | 97 (32.2%) | 18 (18.0%) |
| 8 or more Rooms | 103 (34.2%) | 25 (25.0%) |
| Total | 301 (100.0%) | 100 (100.0%) |
Housing Structure by Heating Type in St George
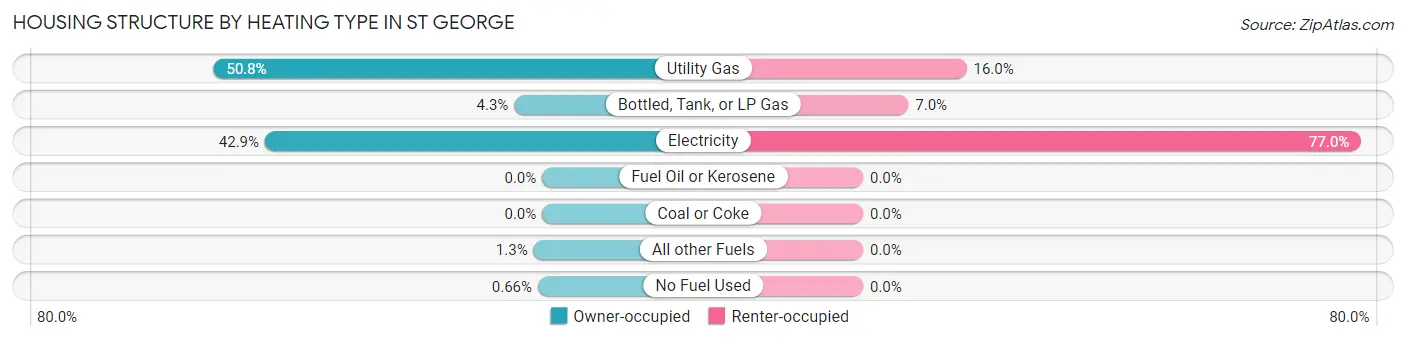
| Heating Type | Owner-occupied | Renter-occupied |
| Utility Gas | 153 (50.8%) | 16 (16.0%) |
| Bottled, Tank, or LP Gas | 13 (4.3%) | 7 (7.0%) |
| Electricity | 129 (42.9%) | 77 (77.0%) |
| Fuel Oil or Kerosene | 0 (0.0%) | 0 (0.0%) |
| Coal or Coke | 0 (0.0%) | 0 (0.0%) |
| All other Fuels | 4 (1.3%) | 0 (0.0%) |
| No Fuel Used | 2 (0.7%) | 0 (0.0%) |
| Total | 301 (100.0%) | 100 (100.0%) |
Household Vehicle Usage in St George
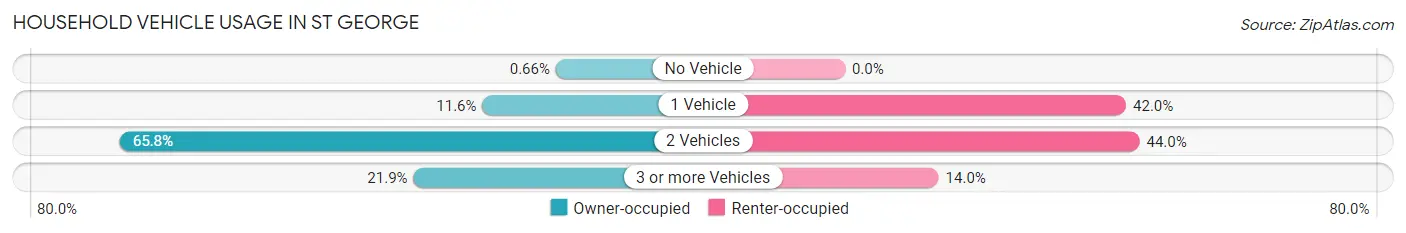
| Vehicles per Household | Owner-occupied | Renter-occupied |
| No Vehicle | 2 (0.7%) | 0 (0.0%) |
| 1 Vehicle | 35 (11.6%) | 42 (42.0%) |
| 2 Vehicles | 198 (65.8%) | 44 (44.0%) |
| 3 or more Vehicles | 66 (21.9%) | 14 (14.0%) |
| Total | 301 (100.0%) | 100 (100.0%) |
Real Estate & Mortgages in St George
Real Estate and Mortgage Overview in St George
| Characteristic | Without Mortgage | With Mortgage |
| Housing Units | 57 | 244 |
| Median Property Value | - | - |
| Median Household Income | $40,625 | $25 |
| Monthly Housing Costs | $391 | $0 |
| Real Estate Taxes | - | - |
Property Value by Mortgage Status in St George
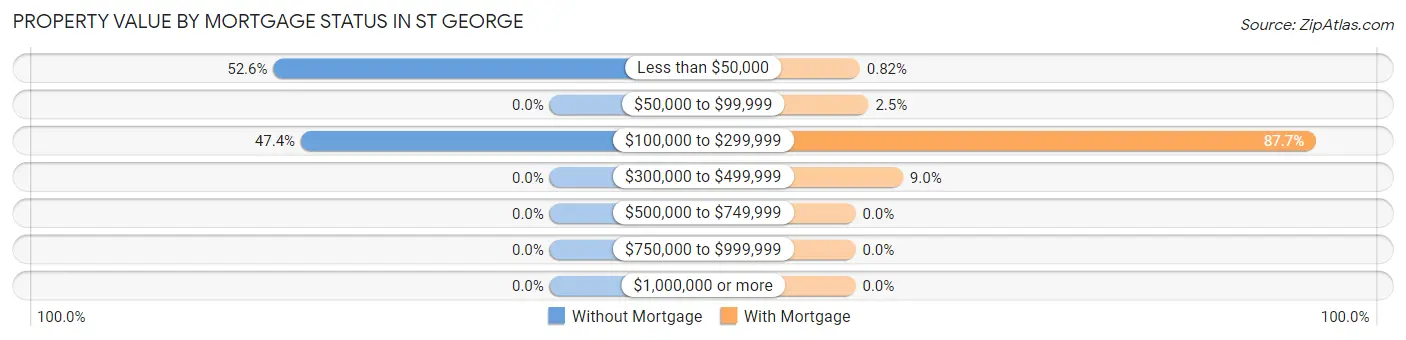
| Property Value | Without Mortgage | With Mortgage |
| Less than $50,000 | 30 (52.6%) | 2 (0.8%) |
| $50,000 to $99,999 | 0 (0.0%) | 6 (2.5%) |
| $100,000 to $299,999 | 27 (47.4%) | 214 (87.7%) |
| $300,000 to $499,999 | 0 (0.0%) | 22 (9.0%) |
| $500,000 to $749,999 | 0 (0.0%) | 0 (0.0%) |
| $750,000 to $999,999 | 0 (0.0%) | 0 (0.0%) |
| $1,000,000 or more | 0 (0.0%) | 0 (0.0%) |
| Total | 57 (100.0%) | 244 (100.0%) |
Household Income by Mortgage Status in St George
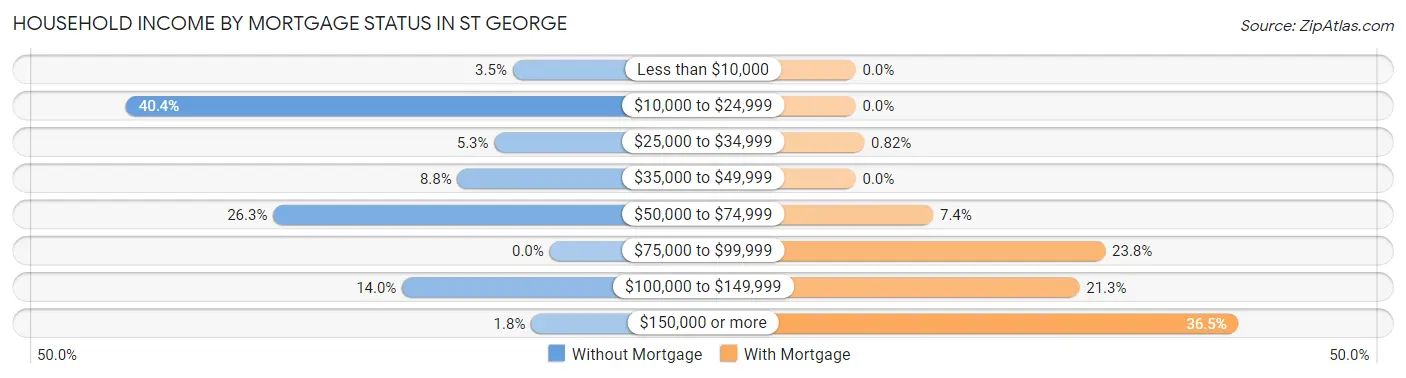
| Household Income | Without Mortgage | With Mortgage |
| Less than $10,000 | 2 (3.5%) | 0 (0.0%) |
| $10,000 to $24,999 | 23 (40.4%) | 0 (0.0%) |
| $25,000 to $34,999 | 3 (5.3%) | 2 (0.8%) |
| $35,000 to $49,999 | 5 (8.8%) | 0 (0.0%) |
| $50,000 to $74,999 | 15 (26.3%) | 18 (7.4%) |
| $75,000 to $99,999 | 0 (0.0%) | 58 (23.8%) |
| $100,000 to $149,999 | 8 (14.0%) | 52 (21.3%) |
| $150,000 or more | 1 (1.8%) | 89 (36.5%) |
| Total | 57 (100.0%) | 244 (100.0%) |
Property Value to Household Income Ratio in St George
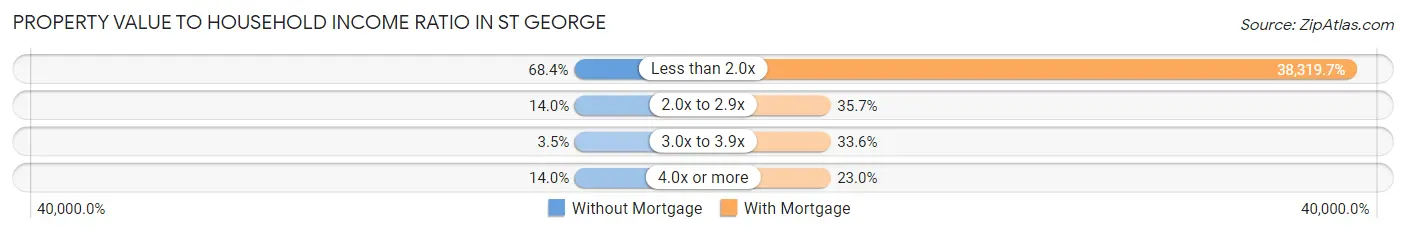
| Value-to-Income Ratio | Without Mortgage | With Mortgage |
| Less than 2.0x | 39 (68.4%) | 93,500 (38,319.7%) |
| 2.0x to 2.9x | 8 (14.0%) | 87 (35.7%) |
| 3.0x to 3.9x | 2 (3.5%) | 82 (33.6%) |
| 4.0x or more | 8 (14.0%) | 56 (23.0%) |
| Total | 57 (100.0%) | 244 (100.0%) |
Real Estate Taxes by Mortgage Status in St George
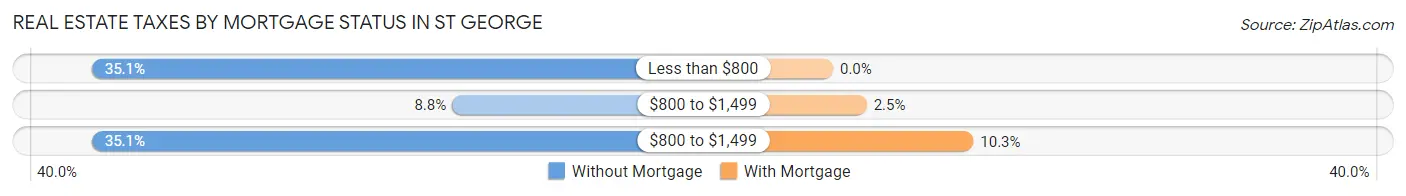
| Property Taxes | Without Mortgage | With Mortgage |
| Less than $800 | 20 (35.1%) | 0 (0.0%) |
| $800 to $1,499 | 5 (8.8%) | 6 (2.5%) |
| $800 to $1,499 | 20 (35.1%) | 25 (10.2%) |
| Total | 57 (100.0%) | 244 (100.0%) |
Health & Disability in St George
Health Insurance Coverage by Age in St George
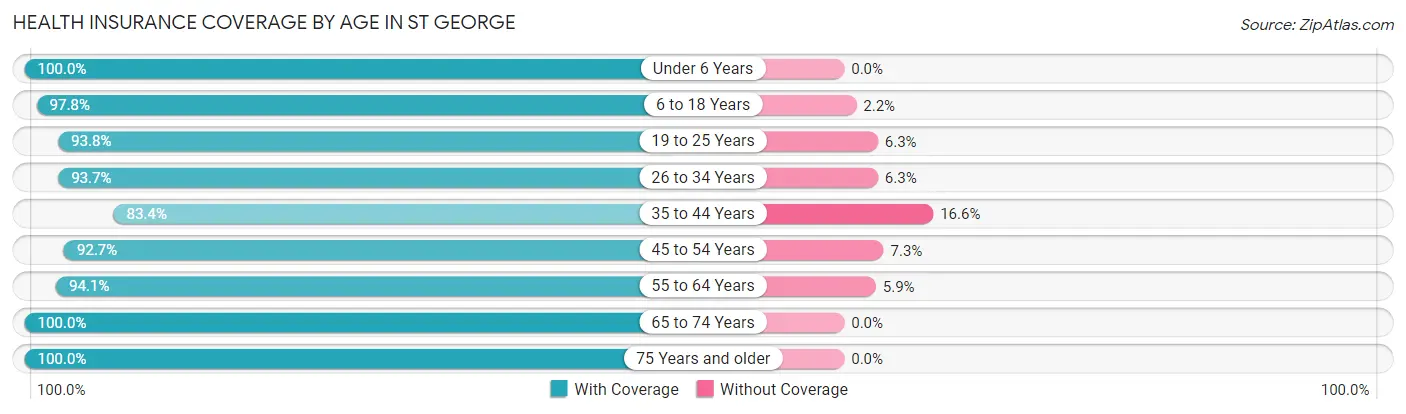
| Age Bracket | With Coverage | Without Coverage |
| Under 6 Years | 160 (100.0%) | 0 (0.0%) |
| 6 to 18 Years | 262 (97.8%) | 6 (2.2%) |
| 19 to 25 Years | 45 (93.8%) | 3 (6.2%) |
| 26 to 34 Years | 239 (93.7%) | 16 (6.3%) |
| 35 to 44 Years | 171 (83.4%) | 34 (16.6%) |
| 45 to 54 Years | 139 (92.7%) | 11 (7.3%) |
| 55 to 64 Years | 32 (94.1%) | 2 (5.9%) |
| 65 to 74 Years | 39 (100.0%) | 0 (0.0%) |
| 75 Years and older | 11 (100.0%) | 0 (0.0%) |
| Total | 1,098 (93.9%) | 72 (6.1%) |
Health Insurance Coverage by Citizenship Status in St George

| Citizenship Status | With Coverage | Without Coverage |
| Native Born | 160 (100.0%) | 0 (0.0%) |
| Foreign Born, Citizen | 262 (97.8%) | 6 (2.2%) |
| Foreign Born, not a Citizen | 45 (93.8%) | 3 (6.2%) |
Health Insurance Coverage by Household Income in St George
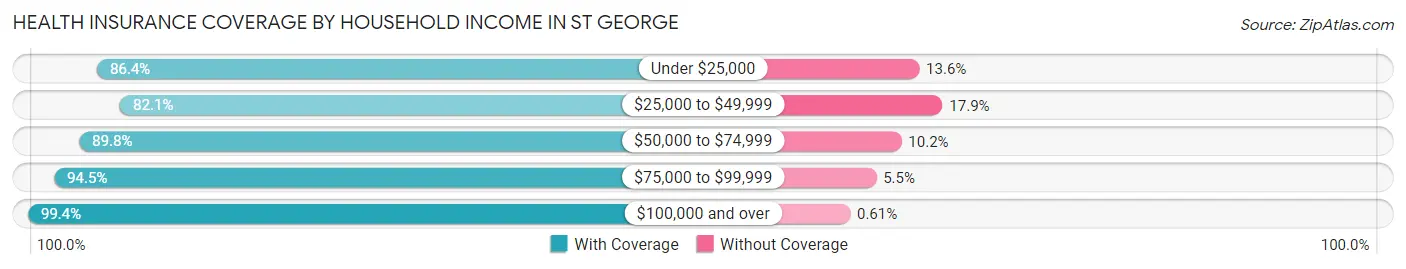
| Household Income | With Coverage | Without Coverage |
| Under $25,000 | 51 (86.4%) | 8 (13.6%) |
| $25,000 to $49,999 | 110 (82.1%) | 24 (17.9%) |
| $50,000 to $74,999 | 193 (89.8%) | 22 (10.2%) |
| $75,000 to $99,999 | 257 (94.5%) | 15 (5.5%) |
| $100,000 and over | 487 (99.4%) | 3 (0.6%) |
Public vs Private Health Insurance Coverage by Age in St George
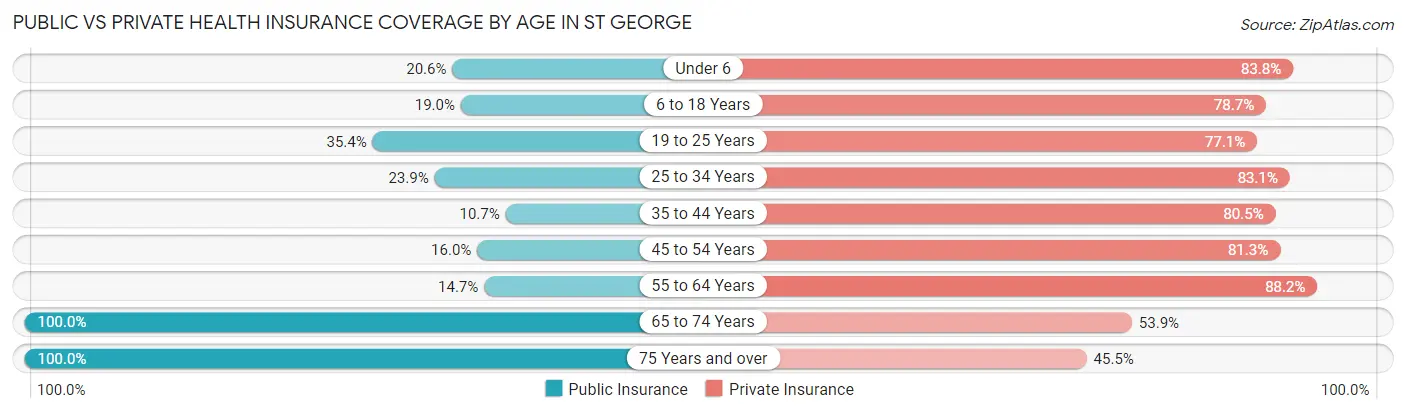
| Age Bracket | Public Insurance | Private Insurance |
| Under 6 | 33 (20.6%) | 134 (83.8%) |
| 6 to 18 Years | 51 (19.0%) | 211 (78.7%) |
| 19 to 25 Years | 17 (35.4%) | 37 (77.1%) |
| 25 to 34 Years | 61 (23.9%) | 212 (83.1%) |
| 35 to 44 Years | 22 (10.7%) | 165 (80.5%) |
| 45 to 54 Years | 24 (16.0%) | 122 (81.3%) |
| 55 to 64 Years | 5 (14.7%) | 30 (88.2%) |
| 65 to 74 Years | 39 (100.0%) | 21 (53.8%) |
| 75 Years and over | 11 (100.0%) | 5 (45.5%) |
| Total | 263 (22.5%) | 937 (80.1%) |
Disability Status by Sex by Age in St George
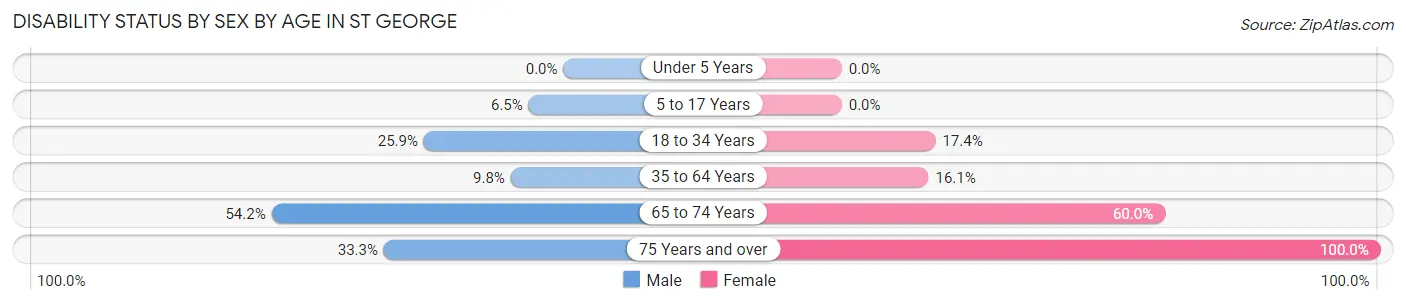
| Age Bracket | Male | Female |
| Under 5 Years | 0 (0.0%) | 0 (0.0%) |
| 5 to 17 Years | 10 (6.5%) | 0 (0.0%) |
| 18 to 34 Years | 43 (25.9%) | 24 (17.4%) |
| 35 to 64 Years | 18 (9.8%) | 33 (16.1%) |
| 65 to 74 Years | 13 (54.2%) | 9 (60.0%) |
| 75 Years and over | 2 (33.3%) | 5 (100.0%) |
Disability Class by Sex by Age in St George
Disability Class: Hearing Difficulty
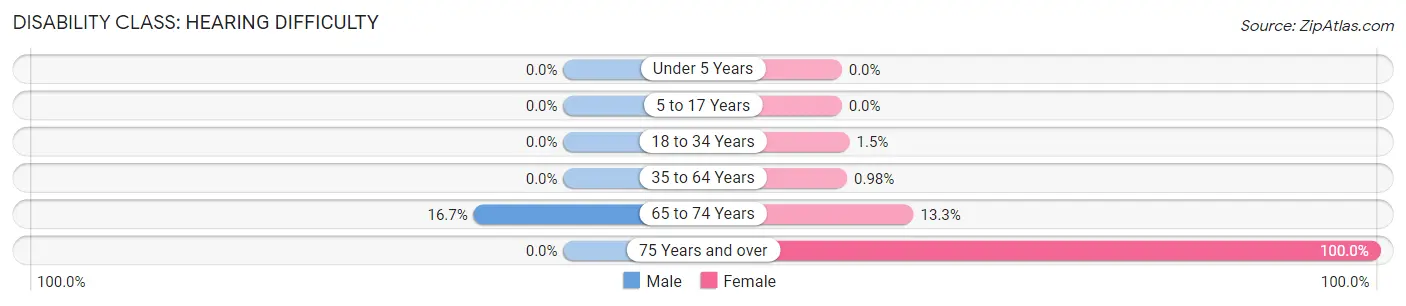
| Age Bracket | Male | Female |
| Under 5 Years | 0 (0.0%) | 0 (0.0%) |
| 5 to 17 Years | 0 (0.0%) | 0 (0.0%) |
| 18 to 34 Years | 0 (0.0%) | 2 (1.5%) |
| 35 to 64 Years | 0 (0.0%) | 2 (1.0%) |
| 65 to 74 Years | 4 (16.7%) | 2 (13.3%) |
| 75 Years and over | 0 (0.0%) | 5 (100.0%) |
Disability Class: Vision Difficulty
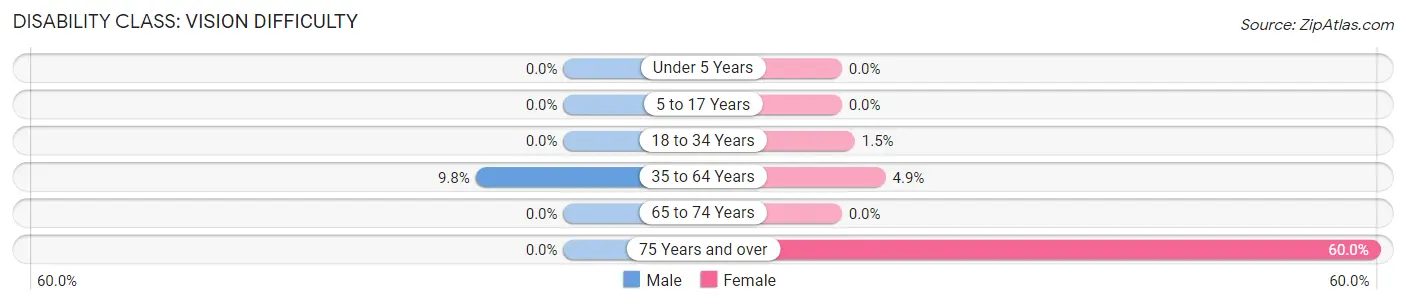
| Age Bracket | Male | Female |
| Under 5 Years | 0 (0.0%) | 0 (0.0%) |
| 5 to 17 Years | 0 (0.0%) | 0 (0.0%) |
| 18 to 34 Years | 0 (0.0%) | 2 (1.5%) |
| 35 to 64 Years | 18 (9.8%) | 10 (4.9%) |
| 65 to 74 Years | 0 (0.0%) | 0 (0.0%) |
| 75 Years and over | 0 (0.0%) | 3 (60.0%) |
Disability Class: Cognitive Difficulty
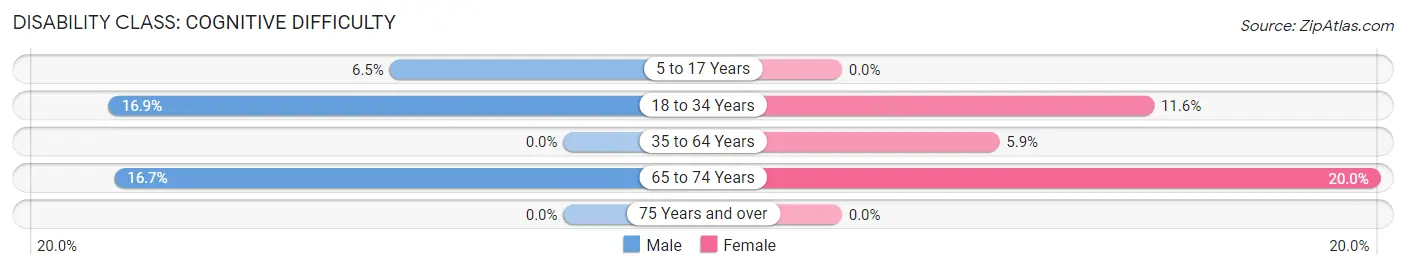
| Age Bracket | Male | Female |
| 5 to 17 Years | 10 (6.5%) | 0 (0.0%) |
| 18 to 34 Years | 28 (16.9%) | 16 (11.6%) |
| 35 to 64 Years | 0 (0.0%) | 12 (5.9%) |
| 65 to 74 Years | 4 (16.7%) | 3 (20.0%) |
| 75 Years and over | 0 (0.0%) | 0 (0.0%) |
Disability Class: Ambulatory Difficulty
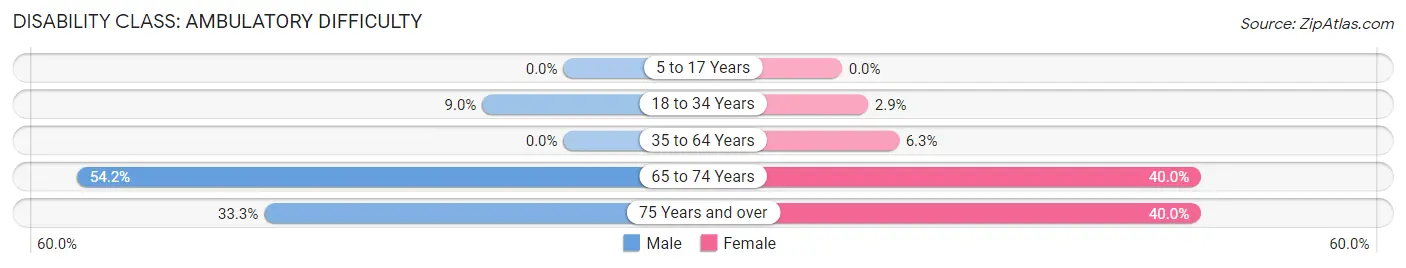
| Age Bracket | Male | Female |
| 5 to 17 Years | 0 (0.0%) | 0 (0.0%) |
| 18 to 34 Years | 15 (9.0%) | 4 (2.9%) |
| 35 to 64 Years | 0 (0.0%) | 13 (6.3%) |
| 65 to 74 Years | 13 (54.2%) | 6 (40.0%) |
| 75 Years and over | 2 (33.3%) | 2 (40.0%) |
Disability Class: Self-Care Difficulty
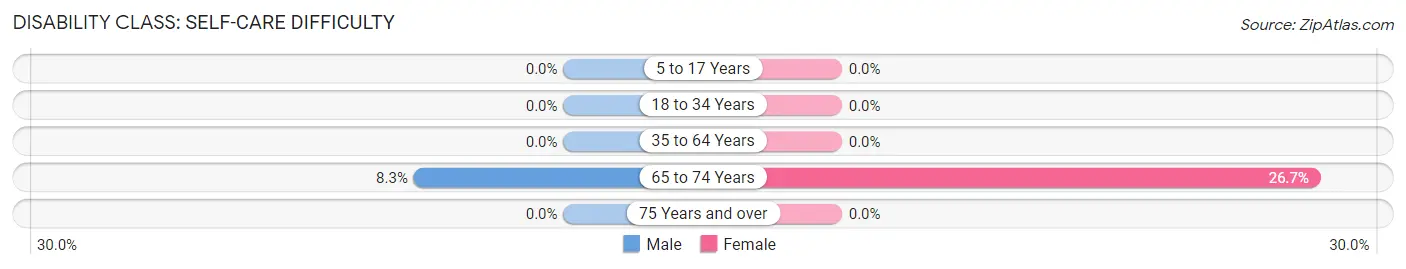
| Age Bracket | Male | Female |
| 5 to 17 Years | 0 (0.0%) | 0 (0.0%) |
| 18 to 34 Years | 0 (0.0%) | 0 (0.0%) |
| 35 to 64 Years | 0 (0.0%) | 0 (0.0%) |
| 65 to 74 Years | 2 (8.3%) | 4 (26.7%) |
| 75 Years and over | 0 (0.0%) | 0 (0.0%) |
Technology Access in St George
Computing Device Access in St George
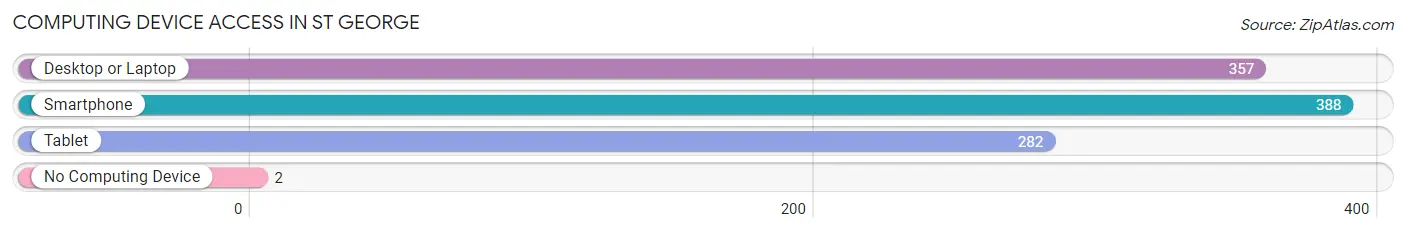
| Device Type | # Households | % Households |
| Desktop or Laptop | 357 | 89.0% |
| Smartphone | 388 | 96.8% |
| Tablet | 282 | 70.3% |
| No Computing Device | 2 | 0.5% |
| Total | 401 | 100.0% |
Internet Access in St George
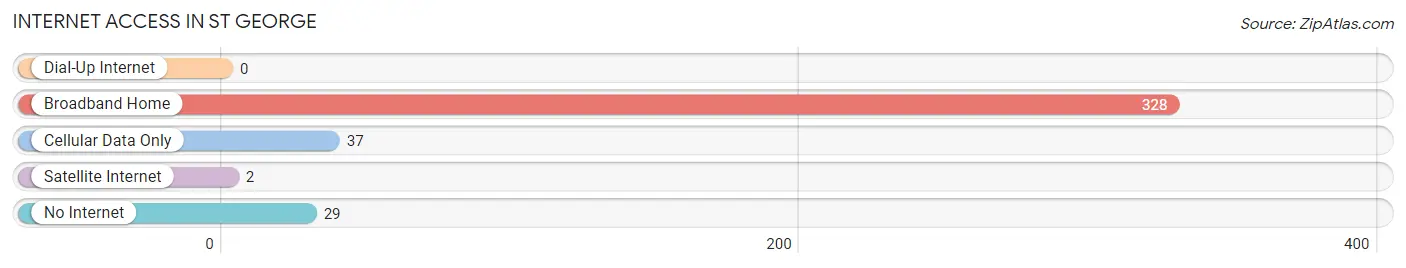
| Internet Type | # Households | % Households |
| Dial-Up Internet | 0 | 0.0% |
| Broadband Home | 328 | 81.8% |
| Cellular Data Only | 37 | 9.2% |
| Satellite Internet | 2 | 0.5% |
| No Internet | 29 | 7.2% |
| Total | 401 | 100.0% |
St George Summary
St. George, Kansas is a small town located in the southwestern corner of the state, in Finney County. It is situated on the banks of the Arkansas River, and is surrounded by rolling hills and prairies. The town was founded in 1885, and has a population of just over 500 people.
History
St. George was founded in 1885 by a group of settlers from the nearby town of Garden City. The settlers were looking for a place to settle and start a new life, and they chose the area around the Arkansas River. The town was named after St. George, the patron saint of England. The first settlers built a small church, and the town quickly grew. By the early 1900s, St. George had become a thriving agricultural community, with a population of over 500 people.
The town was also home to a number of businesses, including a general store, a blacksmith shop, a hotel, and a saloon. The town also had a school, which was built in 1887. The school was the first in the area, and it served the children of the town until it closed in the 1950s.
In the early 1900s, St. George was a popular destination for tourists, who came to enjoy the scenery and the peaceful atmosphere. The town was also known for its annual rodeo, which was held every summer. The rodeo was a popular event, and it attracted people from all over the state.
Geography
St. George is located in the southwestern corner of Kansas, in Finney County. It is situated on the banks of the Arkansas River, and is surrounded by rolling hills and prairies. The town is located about 25 miles from Garden City, and about 50 miles from Dodge City.
The climate in St. George is semi-arid, with hot summers and cold winters. The average temperature in the summer is around 90 degrees Fahrenheit, and the average temperature in the winter is around 30 degrees Fahrenheit. The town receives an average of 16 inches of precipitation each year.
Economy
The economy of St. George is largely based on agriculture. The town is home to several farms, which produce a variety of crops, including wheat, corn, and soybeans. The town also has a number of small businesses, including a general store, a hardware store, and a restaurant.
Demographics
As of the 2010 census, the population of St. George was 514 people. The racial makeup of the town was 95.3% White, 0.6% African American, 0.4% Native American, 0.2% Asian, and 3.5% from other races. The median household income was $37,500, and the median age was 37 years.
Conclusion
St. George, Kansas is a small town located in the southwestern corner of the state, in Finney County. It was founded in 1885, and has a population of just over 500 people. The town is largely agricultural, and is home to several farms, as well as a number of small businesses. The town is also known for its annual rodeo, which is a popular event. The town has a semi-arid climate, with hot summers and cold winters. The population of St. George is mostly White, with a small percentage of African American, Native American, and Asian residents. The median household income is $37,500, and the median age is 37 years.
Common Questions
What is Per Capita Income in St George?
Per Capita income in St George is $30,480.
What is the Median Family Income in St George?
Median Family Income in St George is $87,292.
What is the Median Household income in St George?
Median Household Income in St George is $85,469.
What is Income or Wage Gap in St George?
Income or Wage Gap in St George is 19.5%.
Women in St George earn 80.5 cents for every dollar earned by a man.
What is Inequality or Gini Index in St George?
Inequality or Gini Index in St George is 0.30.
What is the Total Population of St George?
Total Population of St George is 1,190.
What is the Total Male Population of St George?
Total Male Population of St George is 609.
What is the Total Female Population of St George?
Total Female Population of St George is 581.
What is the Ratio of Males per 100 Females in St George?
There are 104.82 Males per 100 Females in St George.
What is the Ratio of Females per 100 Males in St George?
There are 95.40 Females per 100 Males in St George.
What is the Median Population Age in St George?
Median Population Age in St George is 31.0 Years.
What is the Average Family Size in St George
Average Family Size in St George is 3.2 People.
What is the Average Household Size in St George
Average Household Size in St George is 3.0 People.
How Large is the Labor Force in St George?
There are 653 People in the Labor Forcein in St George.
What is the Percentage of People in the Labor Force in St George?
81.0% of People are in the Labor Force in St George.