Wamego, KS Map & Demographics
Wamego Map
Wamego Overview
$39,160
PER CAPITA INCOME
$98,411
AVG FAMILY INCOME
$88,942
AVG HOUSEHOLD INCOME
42.6%
WAGE / INCOME GAP [ % ]
57.4¢/ $1
WAGE / INCOME GAP [ $ ]
0.38
INEQUALITY / GINI INDEX
4,190
TOTAL POPULATION
1,974
MALE POPULATION
2,216
FEMALE POPULATION
89.08
MALES / 100 FEMALES
112.26
FEMALES / 100 MALES
35.8
MEDIAN AGE
3.5
AVG FAMILY SIZE
2.7
AVG HOUSEHOLD SIZE
2,520
LABOR FORCE [ PEOPLE ]
77.8%
PERCENT IN LABOR FORCE
4.0%
UNEMPLOYMENT RATE
Wamego Zip Codes
Wamego Area Codes
Income in Wamego
Income Overview in Wamego
Per Capita Income in Wamego is $39,160, while median incomes of families and households are $98,411 and $88,942 respectively.
| Characteristic | Number | Measure |
| Per Capita Income | 4,190 | $39,160 |
| Median Family Income | 967 | $98,411 |
| Mean Family Income | 967 | $111,852 |
| Median Household Income | 1,525 | $88,942 |
| Mean Household Income | 1,525 | $98,678 |
| Income Deficit | 967 | $0 |
| Wage / Income Gap (%) | 4,190 | 42.57% |
| Wage / Income Gap ($) | 4,190 | 57.43¢ per $1 |
| Gini / Inequality Index | 4,190 | 0.38 |
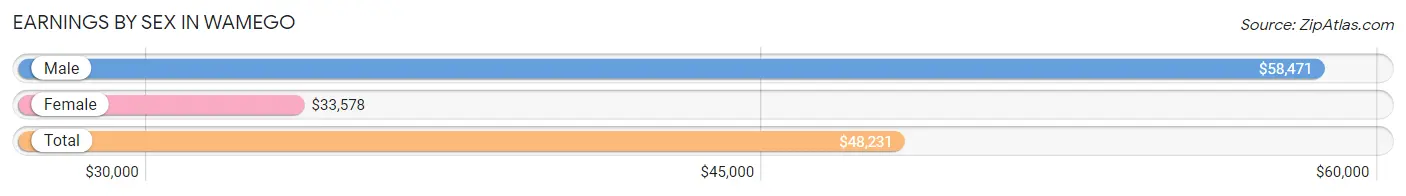
Earnings by Sex in Wamego
Average Earnings in Wamego are $48,231, $58,471 for men and $33,578 for women, a difference of 42.6%.
| Sex | Number | Average Earnings |
| Male | 1,474 (55.2%) | $58,471 |
| Female | 1,196 (44.8%) | $33,578 |
| Total | 2,670 (100.0%) | $48,231 |
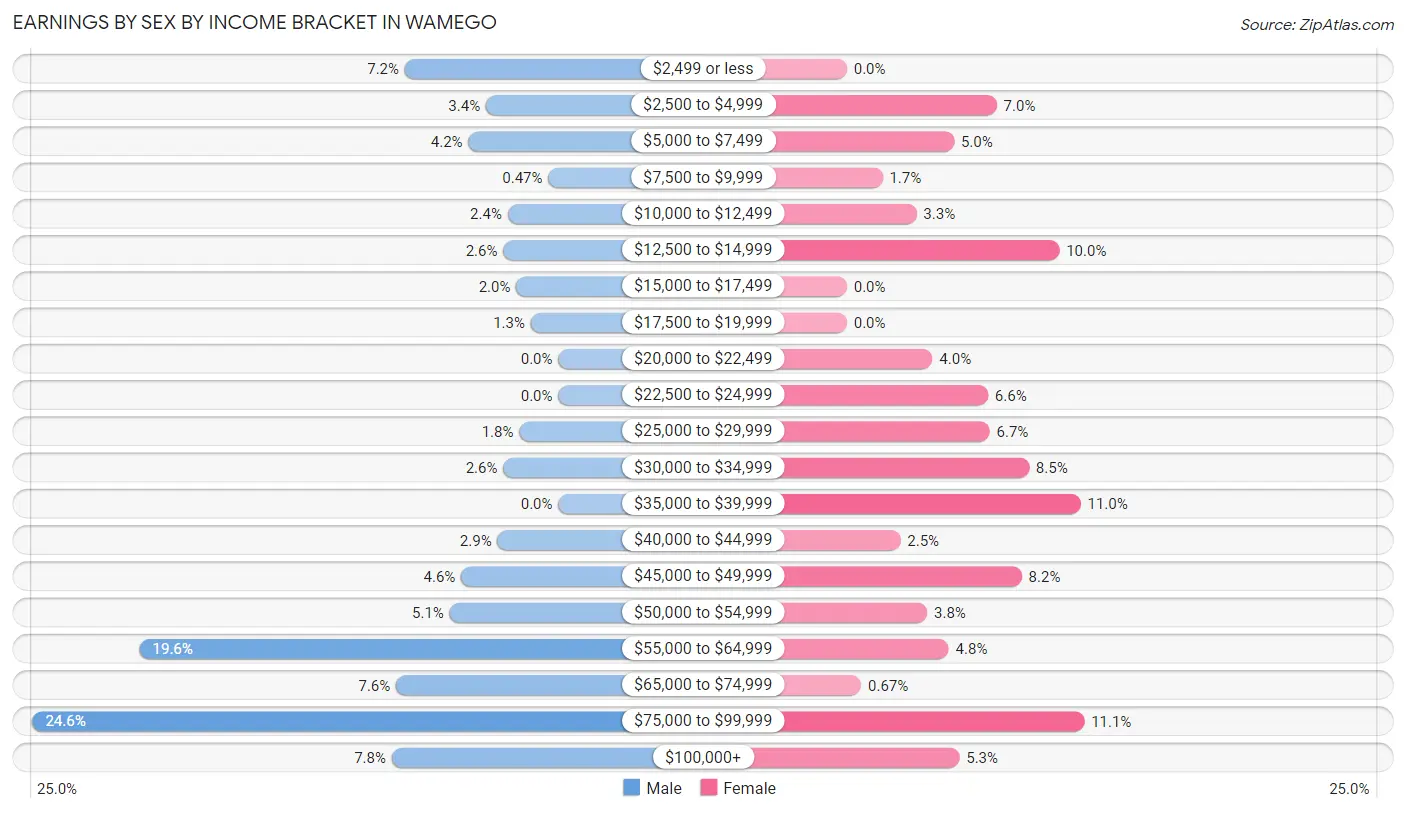
Earnings by Sex by Income Bracket in Wamego
The most common earnings brackets in Wamego are $75,000 to $99,999 for men (363 | 24.6%) and $75,000 to $99,999 for women (133 | 11.1%).
| Income | Male | Female |
| $2,499 or less | 106 (7.2%) | 0 (0.0%) |
| $2,500 to $4,999 | 50 (3.4%) | 84 (7.0%) |
| $5,000 to $7,499 | 62 (4.2%) | 60 (5.0%) |
| $7,500 to $9,999 | 7 (0.5%) | 20 (1.7%) |
| $10,000 to $12,499 | 35 (2.4%) | 39 (3.3%) |
| $12,500 to $14,999 | 38 (2.6%) | 119 (10.0%) |
| $15,000 to $17,499 | 29 (2.0%) | 0 (0.0%) |
| $17,500 to $19,999 | 19 (1.3%) | 0 (0.0%) |
| $20,000 to $22,499 | 0 (0.0%) | 48 (4.0%) |
| $22,500 to $24,999 | 0 (0.0%) | 79 (6.6%) |
| $25,000 to $29,999 | 27 (1.8%) | 80 (6.7%) |
| $30,000 to $34,999 | 38 (2.6%) | 102 (8.5%) |
| $35,000 to $39,999 | 0 (0.0%) | 131 (11.0%) |
| $40,000 to $44,999 | 42 (2.9%) | 30 (2.5%) |
| $45,000 to $49,999 | 67 (4.5%) | 98 (8.2%) |
| $50,000 to $54,999 | 75 (5.1%) | 45 (3.8%) |
| $55,000 to $64,999 | 289 (19.6%) | 57 (4.8%) |
| $65,000 to $74,999 | 112 (7.6%) | 8 (0.7%) |
| $75,000 to $99,999 | 363 (24.6%) | 133 (11.1%) |
| $100,000+ | 115 (7.8%) | 63 (5.3%) |
| Total | 1,474 (100.0%) | 1,196 (100.0%) |
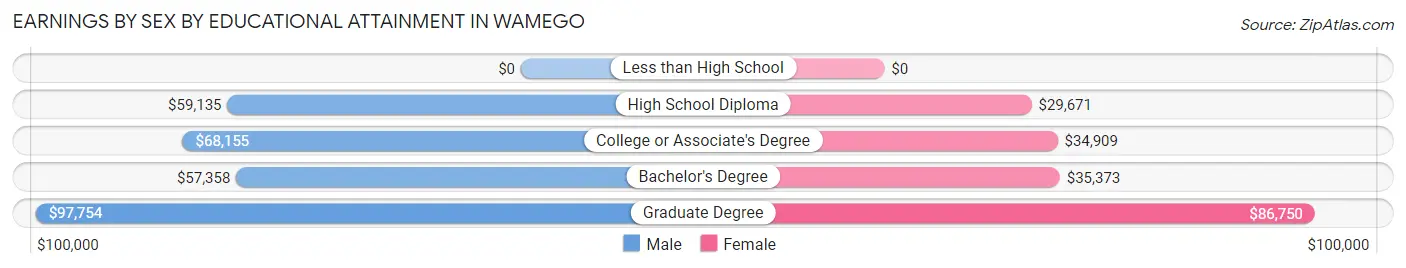
Earnings by Sex by Educational Attainment in Wamego
Average earnings in Wamego are $66,071 for men and $37,356 for women, a difference of 43.5%. Men with an educational attainment of graduate degree enjoy the highest average annual earnings of $97,754, while those with bachelor's degree education earn the least with $57,358. Women with an educational attainment of graduate degree earn the most with the average annual earnings of $86,750, while those with high school diploma education have the smallest earnings of $29,671.
| Educational Attainment | Male Income | Female Income |
| Less than High School | - | - |
| High School Diploma | $59,135 | $29,671 |
| College or Associate's Degree | $68,155 | $34,909 |
| Bachelor's Degree | $57,358 | $35,373 |
| Graduate Degree | $97,754 | $86,750 |
| Total | $66,071 | $37,356 |
Family Income in Wamego
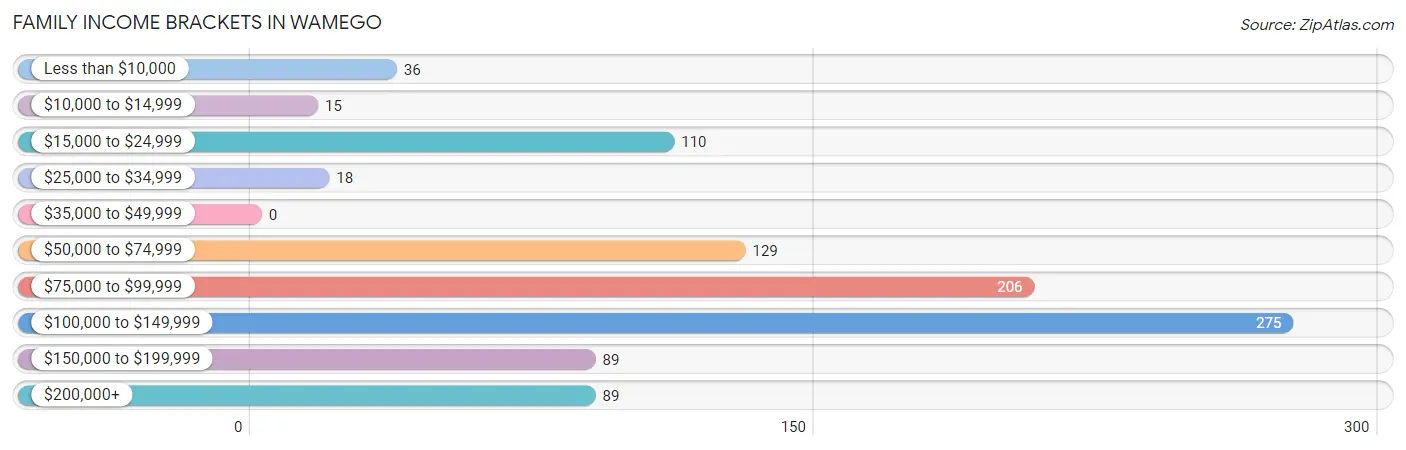
Family Income Brackets in Wamego
According to the Wamego family income data, there are 275 families falling into the $100,000 to $149,999 income range, which is the most common income bracket and makes up 28.4% of all families.
| Income Bracket | # Families | % Families |
| Less than $10,000 | 36 | 3.7% |
| $10,000 to $14,999 | 15 | 1.6% |
| $15,000 to $24,999 | 110 | 11.4% |
| $25,000 to $34,999 | 18 | 1.9% |
| $35,000 to $49,999 | 0 | 0.0% |
| $50,000 to $74,999 | 129 | 13.3% |
| $75,000 to $99,999 | 206 | 21.3% |
| $100,000 to $149,999 | 275 | 28.4% |
| $150,000 to $199,999 | 89 | 9.2% |
| $200,000+ | 89 | 9.2% |
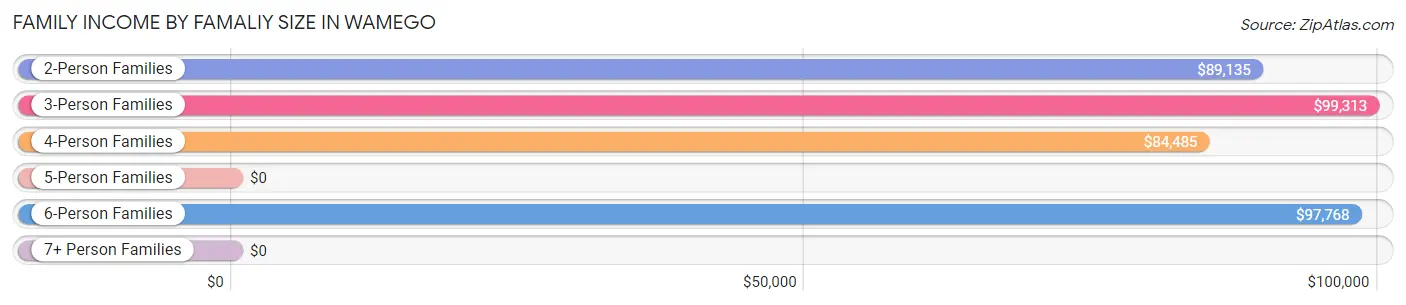
Family Income by Famaliy Size in Wamego
3-person families (253 | 26.2%) account for the highest median family income in Wamego with $99,313 per family, while 2-person families (343 | 35.5%) have the highest median income of $44,568 per family member.
| Income Bracket | # Families | Median Income |
| 2-Person Families | 343 (35.5%) | $89,135 |
| 3-Person Families | 253 (26.2%) | $99,313 |
| 4-Person Families | 217 (22.4%) | $84,485 |
| 5-Person Families | 83 (8.6%) | $0 |
| 6-Person Families | 50 (5.2%) | $97,768 |
| 7+ Person Families | 21 (2.2%) | $0 |
| Total | 967 (100.0%) | $98,411 |
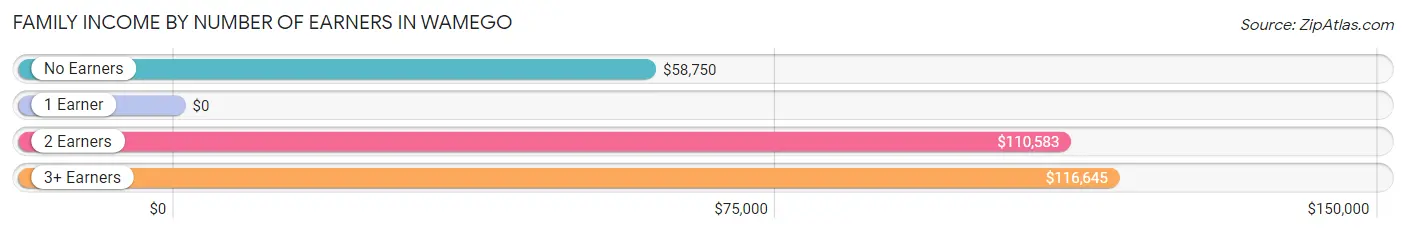
Family Income by Number of Earners in Wamego
| Number of Earners | # Families | Median Income |
| No Earners | 42 (4.3%) | $58,750 |
| 1 Earner | 275 (28.4%) | $0 |
| 2 Earners | 417 (43.1%) | $110,583 |
| 3+ Earners | 233 (24.1%) | $116,645 |
| Total | 967 (100.0%) | $98,411 |
Household Income in Wamego
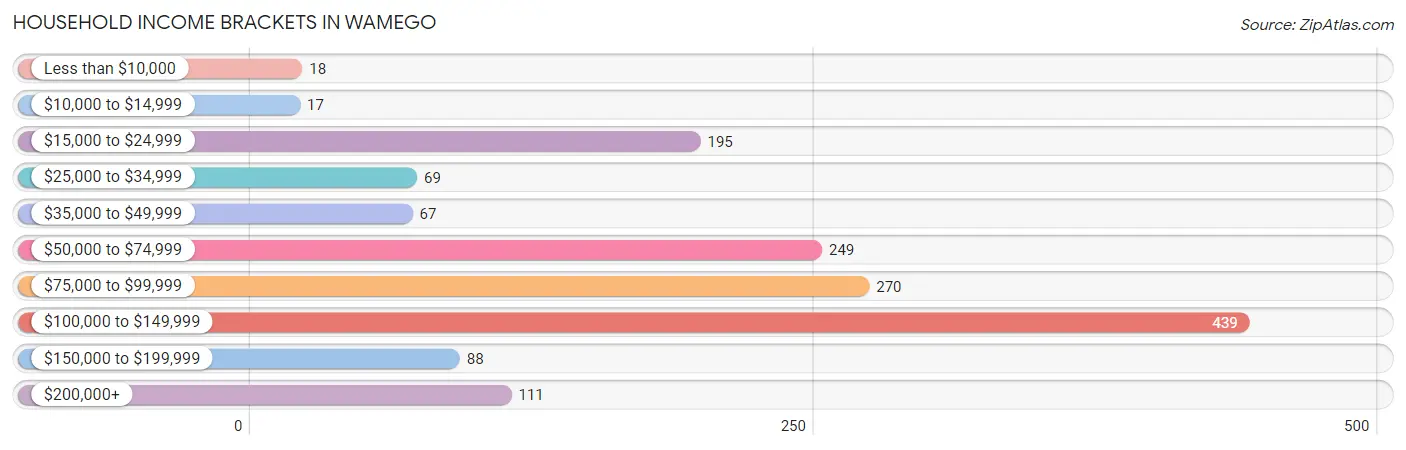
Household Income Brackets in Wamego
With 439 households falling in the category, the $100,000 to $149,999 income range is the most frequent in Wamego, accounting for 28.8% of all households. In contrast, only 17 households (1.1%) fall into the $10,000 to $14,999 income bracket, making it the least populous group.
| Income Bracket | # Households | % Households |
| Less than $10,000 | 18 | 1.2% |
| $10,000 to $14,999 | 17 | 1.1% |
| $15,000 to $24,999 | 195 | 12.8% |
| $25,000 to $34,999 | 69 | 4.5% |
| $35,000 to $49,999 | 67 | 4.4% |
| $50,000 to $74,999 | 249 | 16.3% |
| $75,000 to $99,999 | 270 | 17.7% |
| $100,000 to $149,999 | 439 | 28.8% |
| $150,000 to $199,999 | 88 | 5.8% |
| $200,000+ | 111 | 7.3% |
Household Income by Householder Age in Wamego
The median household income in Wamego is $88,942, with the highest median household income of $109,125 found in the 45 to 64 years age bracket for the primary householder. A total of 575 households (37.7%) fall into this category. Meanwhile, the 65+ years age bracket for the primary householder has the lowest median household income of $43,750, with 316 households (20.7%) in this group.
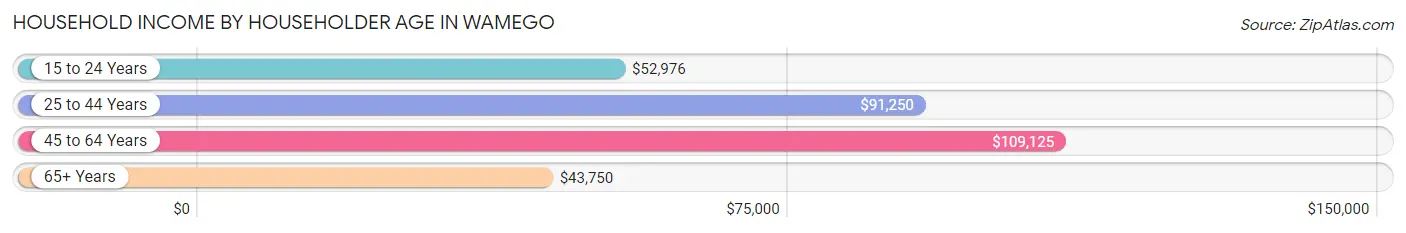
| Income Bracket | # Households | Median Income |
| 15 to 24 Years | 110 (7.2%) | $52,976 |
| 25 to 44 Years | 524 (34.4%) | $91,250 |
| 45 to 64 Years | 575 (37.7%) | $109,125 |
| 65+ Years | 316 (20.7%) | $43,750 |
| Total | 1,525 (100.0%) | $88,942 |
Poverty in Wamego
Income Below Poverty by Sex and Age in Wamego
With 6.2% poverty level for males and 11.9% for females among the residents of Wamego, 6 to 11 year old males and 5 year old females are the most vulnerable to poverty, with 69 males (33.8%) and 58 females (69.1%) in their respective age groups living below the poverty level.
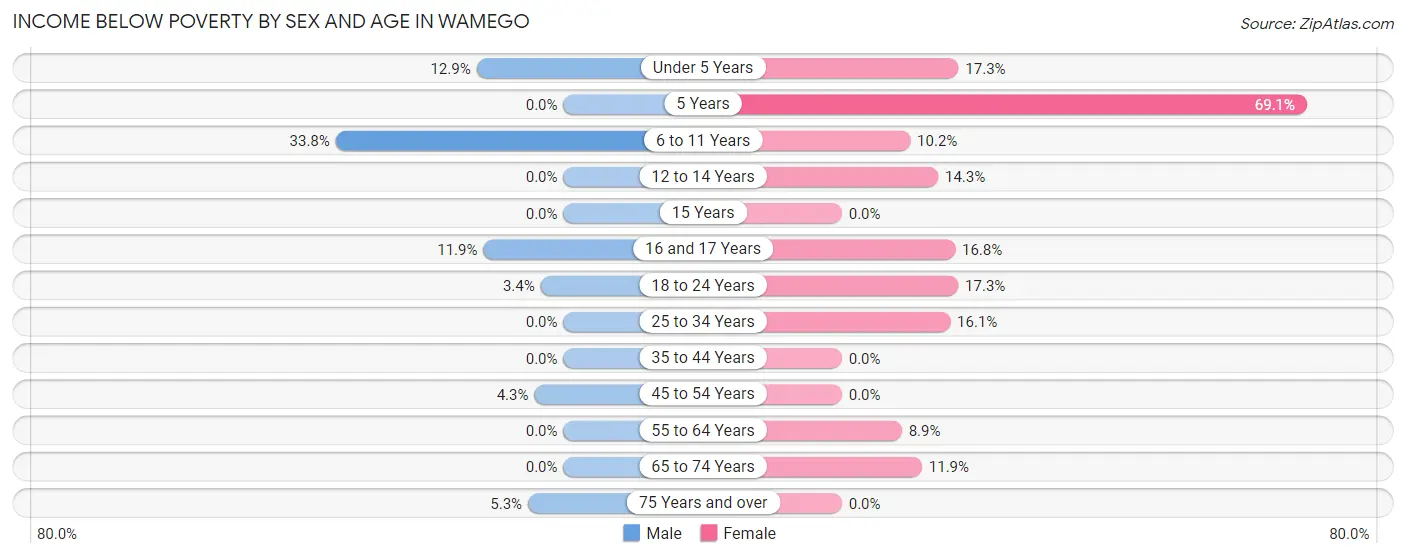
| Age Bracket | Male | Female |
| Under 5 Years | 8 (12.9%) | 22 (17.3%) |
| 5 Years | 0 (0.0%) | 58 (69.1%) |
| 6 to 11 Years | 69 (33.8%) | 27 (10.2%) |
| 12 to 14 Years | 0 (0.0%) | 15 (14.3%) |
| 15 Years | 0 (0.0%) | 0 (0.0%) |
| 16 and 17 Years | 17 (11.9%) | 18 (16.8%) |
| 18 to 24 Years | 6 (3.4%) | 33 (17.3%) |
| 25 to 34 Years | 0 (0.0%) | 56 (16.1%) |
| 35 to 44 Years | 0 (0.0%) | 0 (0.0%) |
| 45 to 54 Years | 18 (4.3%) | 0 (0.0%) |
| 55 to 64 Years | 0 (0.0%) | 13 (8.9%) |
| 65 to 74 Years | 0 (0.0%) | 17 (11.9%) |
| 75 Years and over | 3 (5.3%) | 0 (0.0%) |
| Total | 121 (6.2%) | 259 (11.9%) |
Income Above Poverty by Sex and Age in Wamego
According to the poverty statistics in Wamego, males aged 5 years and females aged 15 years are the age groups that are most secure financially, with 100.0% of males and 100.0% of females in these age groups living above the poverty line.
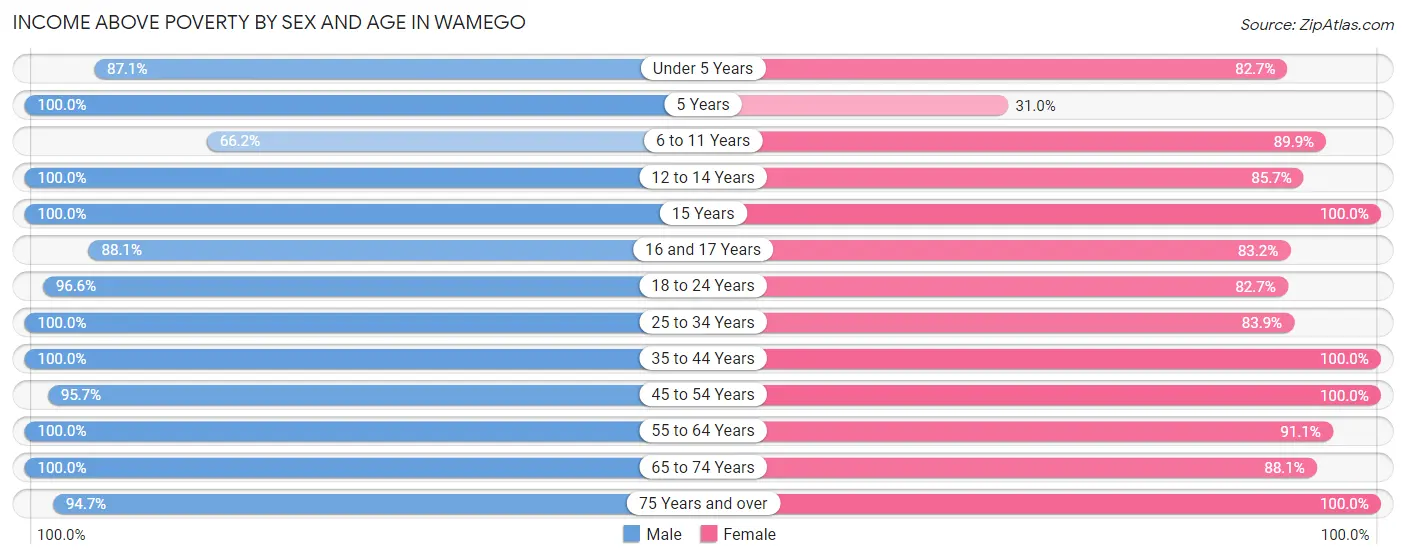
| Age Bracket | Male | Female |
| Under 5 Years | 54 (87.1%) | 105 (82.7%) |
| 5 Years | 18 (100.0%) | 26 (30.9%) |
| 6 to 11 Years | 135 (66.2%) | 239 (89.8%) |
| 12 to 14 Years | 31 (100.0%) | 90 (85.7%) |
| 15 Years | 18 (100.0%) | 36 (100.0%) |
| 16 and 17 Years | 126 (88.1%) | 89 (83.2%) |
| 18 to 24 Years | 171 (96.6%) | 158 (82.7%) |
| 25 to 34 Years | 150 (100.0%) | 292 (83.9%) |
| 35 to 44 Years | 375 (100.0%) | 187 (100.0%) |
| 45 to 54 Years | 400 (95.7%) | 308 (100.0%) |
| 55 to 64 Years | 217 (100.0%) | 133 (91.1%) |
| 65 to 74 Years | 74 (100.0%) | 126 (88.1%) |
| 75 Years and over | 54 (94.7%) | 124 (100.0%) |
| Total | 1,823 (93.8%) | 1,913 (88.1%) |
Income Below Poverty Among Married-Couple Families in Wamego
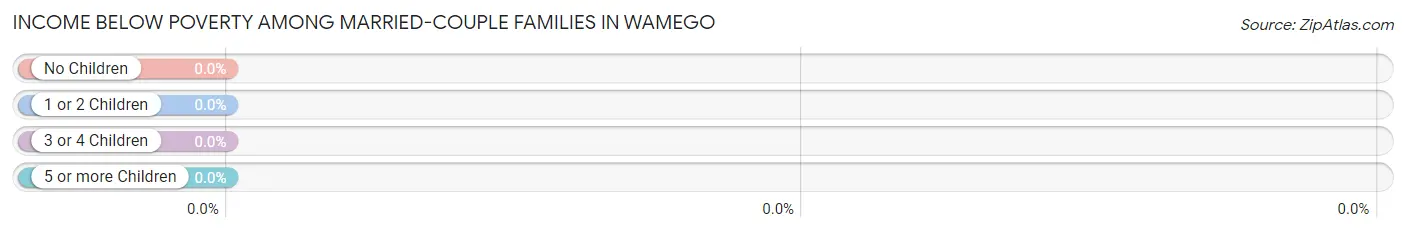
| Children | Above Poverty | Below Poverty |
| No Children | 312 (100.0%) | 0 (0.0%) |
| 1 or 2 Children | 351 (100.0%) | 0 (0.0%) |
| 3 or 4 Children | 62 (100.0%) | 0 (0.0%) |
| 5 or more Children | 21 (100.0%) | 0 (0.0%) |
| Total | 746 (100.0%) | 0 (0.0%) |
Income Below Poverty Among Single-Parent Households in Wamego
According to the poverty data in Wamego, 24.7% or 18 single-father households and 60.1% or 89 single-mother households are living below the poverty line. Among single-father households, those with 3 or 4 children have the highest poverty rate, with 18 households (36.0%) experiencing poverty. Likewise, among single-mother households, those with 1 or 2 children have the highest poverty rate, with 89 households (60.5%) falling below the poverty line.
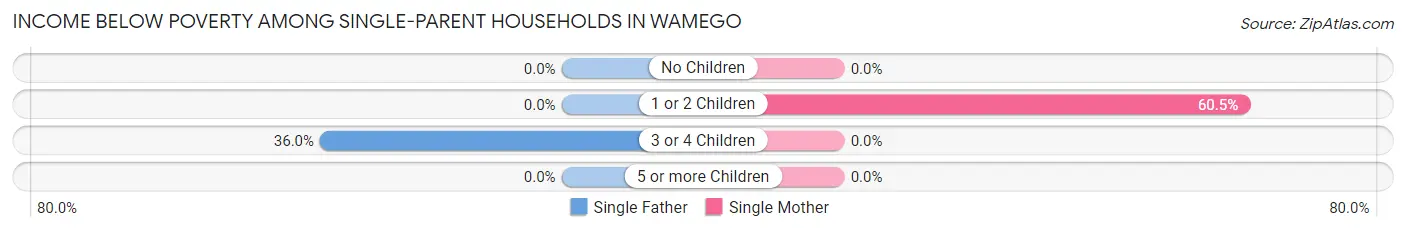
| Children | Single Father | Single Mother |
| No Children | 0 (0.0%) | 0 (0.0%) |
| 1 or 2 Children | 0 (0.0%) | 89 (60.5%) |
| 3 or 4 Children | 18 (36.0%) | 0 (0.0%) |
| 5 or more Children | 0 (0.0%) | 0 (0.0%) |
| Total | 18 (24.7%) | 89 (60.1%) |
Income Below Poverty Among Married-Couple vs Single-Parent Households in Wamego
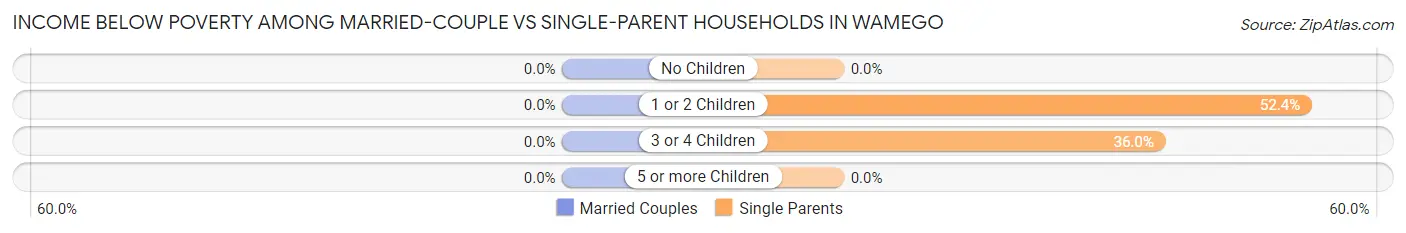
| Children | Married-Couple Families | Single-Parent Households |
| No Children | 0 (0.0%) | 0 (0.0%) |
| 1 or 2 Children | 0 (0.0%) | 89 (52.3%) |
| 3 or 4 Children | 0 (0.0%) | 18 (36.0%) |
| 5 or more Children | 0 (0.0%) | 0 (0.0%) |
| Total | 0 (0.0%) | 107 (48.4%) |
Race in Wamego
The most populous races in Wamego are White / Caucasian (3,705 | 88.4%), Two or more Races (350 | 8.4%), and Hispanic or Latino (274 | 6.5%).
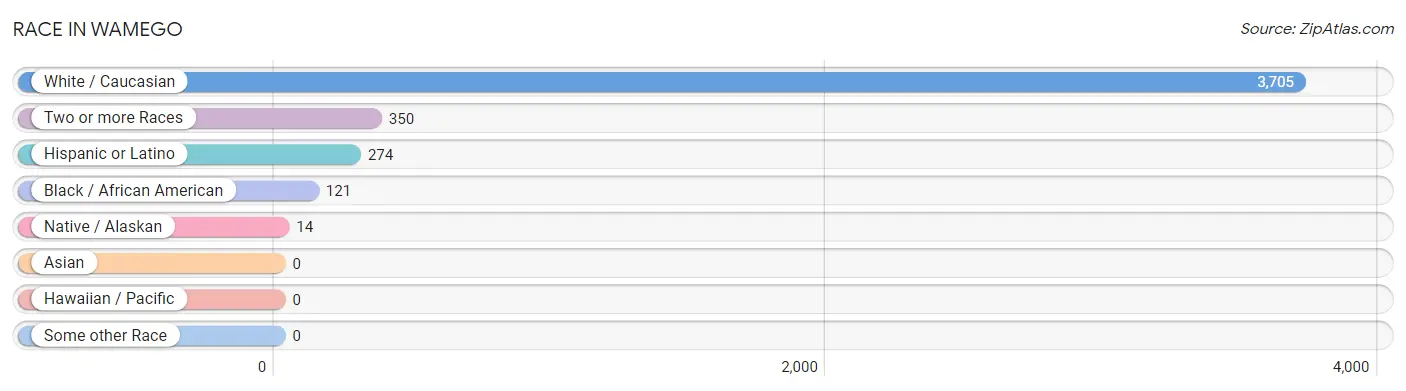
| Race | # Population | % Population |
| Asian | 0 | 0.0% |
| Black / African American | 121 | 2.9% |
| Hawaiian / Pacific | 0 | 0.0% |
| Hispanic or Latino | 274 | 6.5% |
| Native / Alaskan | 14 | 0.3% |
| White / Caucasian | 3,705 | 88.4% |
| Two or more Races | 350 | 8.4% |
| Some other Race | 0 | 0.0% |
| Total | 4,190 | 100.0% |
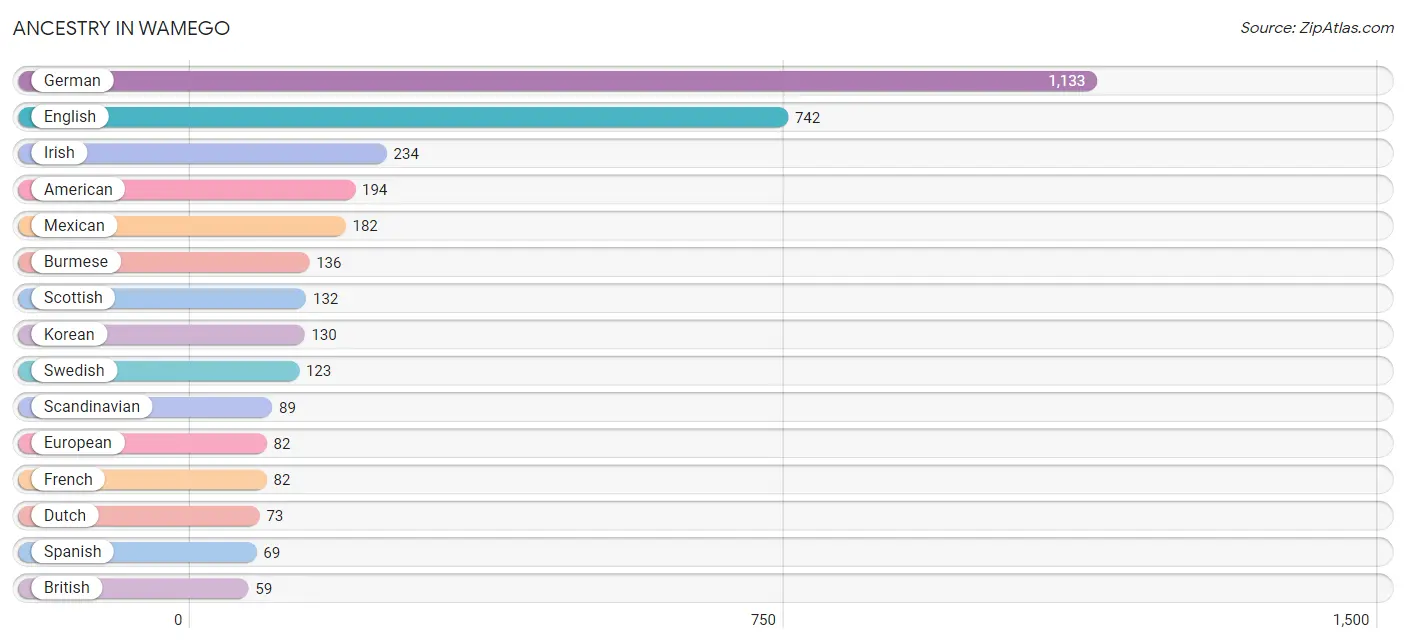
Ancestry in Wamego
The most populous ancestries reported in Wamego are German (1,133 | 27.0%), English (742 | 17.7%), Irish (234 | 5.6%), American (194 | 4.6%), and Mexican (182 | 4.3%), together accounting for 59.3% of all Wamego residents.
| Ancestry | # Population | % Population |
| American | 194 | 4.6% |
| British | 59 | 1.4% |
| Burmese | 136 | 3.3% |
| Czech | 21 | 0.5% |
| Dutch | 73 | 1.7% |
| Eastern European | 14 | 0.3% |
| English | 742 | 17.7% |
| European | 82 | 2.0% |
| French | 82 | 2.0% |
| French Canadian | 8 | 0.2% |
| German | 1,133 | 27.0% |
| Iranian | 4 | 0.1% |
| Irish | 234 | 5.6% |
| Italian | 22 | 0.5% |
| Korean | 130 | 3.1% |
| Mexican | 182 | 4.3% |
| Pennsylvania German | 8 | 0.2% |
| Polish | 32 | 0.8% |
| Potawatomi | 31 | 0.7% |
| Scandinavian | 89 | 2.1% |
| Scotch-Irish | 13 | 0.3% |
| Scottish | 132 | 3.2% |
| Spaniard | 23 | 0.5% |
| Spanish | 69 | 1.7% |
| Swedish | 123 | 2.9% |
| Swiss | 37 | 0.9% |
| Welsh | 8 | 0.2% | View All 27 Rows |
Immigrants in Wamego
The most numerous immigrant groups reported in Wamego came from Europe (40 | 0.9%), Western Europe (40 | 0.9%), France (22 | 0.5%), Canada (19 | 0.4%), and Germany (18 | 0.4%), together accounting for 3.3% of all Wamego residents.
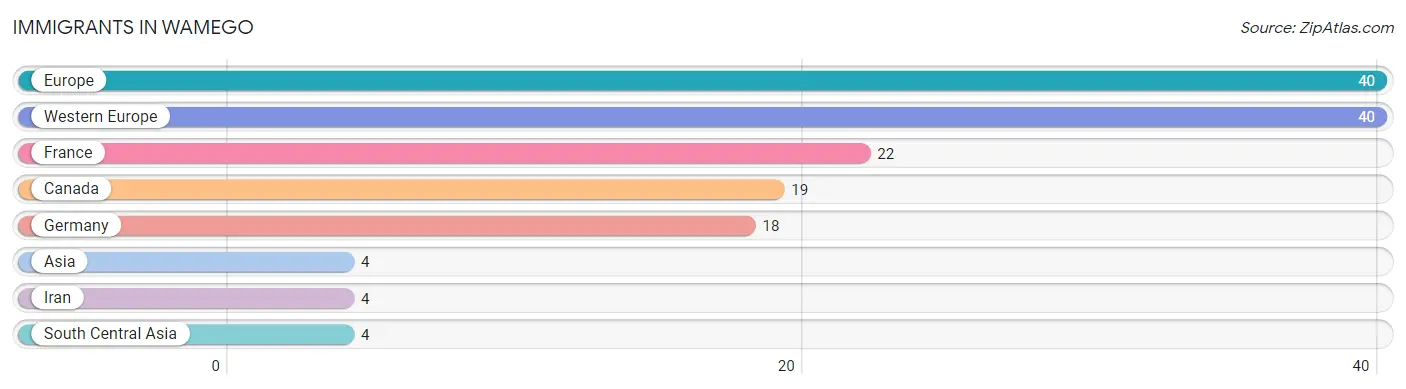
| Immigration Origin | # Population | % Population |
| Asia | 4 | 0.1% |
| Canada | 19 | 0.4% |
| Europe | 40 | 0.9% |
| France | 22 | 0.5% |
| Germany | 18 | 0.4% |
| Iran | 4 | 0.1% |
| South Central Asia | 4 | 0.1% |
| Western Europe | 40 | 0.9% | View All 8 Rows |
Sex and Age in Wamego
Sex and Age in Wamego
The most populous age groups in Wamego are 40 to 44 Years (253 | 12.8%) for men and 5 to 9 Years (288 | 13.0%) for women.
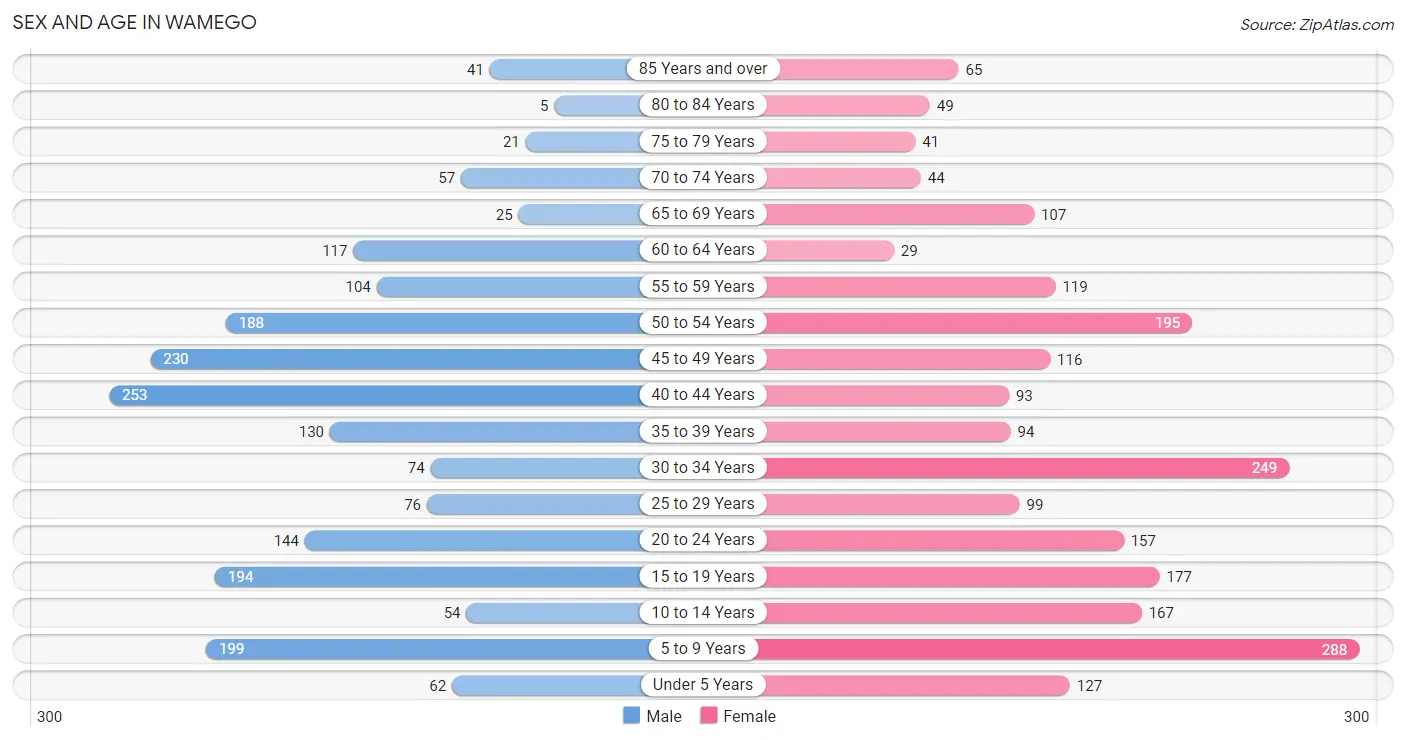
| Age Bracket | Male | Female |
| Under 5 Years | 62 (3.1%) | 127 (5.7%) |
| 5 to 9 Years | 199 (10.1%) | 288 (13.0%) |
| 10 to 14 Years | 54 (2.7%) | 167 (7.5%) |
| 15 to 19 Years | 194 (9.8%) | 177 (8.0%) |
| 20 to 24 Years | 144 (7.3%) | 157 (7.1%) |
| 25 to 29 Years | 76 (3.8%) | 99 (4.5%) |
| 30 to 34 Years | 74 (3.7%) | 249 (11.2%) |
| 35 to 39 Years | 130 (6.6%) | 94 (4.2%) |
| 40 to 44 Years | 253 (12.8%) | 93 (4.2%) |
| 45 to 49 Years | 230 (11.7%) | 116 (5.2%) |
| 50 to 54 Years | 188 (9.5%) | 195 (8.8%) |
| 55 to 59 Years | 104 (5.3%) | 119 (5.4%) |
| 60 to 64 Years | 117 (5.9%) | 29 (1.3%) |
| 65 to 69 Years | 25 (1.3%) | 107 (4.8%) |
| 70 to 74 Years | 57 (2.9%) | 44 (2.0%) |
| 75 to 79 Years | 21 (1.1%) | 41 (1.8%) |
| 80 to 84 Years | 5 (0.3%) | 49 (2.2%) |
| 85 Years and over | 41 (2.1%) | 65 (2.9%) |
| Total | 1,974 (100.0%) | 2,216 (100.0%) |
Families and Households in Wamego
Median Family Size in Wamego
The median family size in Wamego is 3.45 persons per family, with married-couple families (746 | 77.1%) accounting for the largest median family size of 3.6 persons per family. On the other hand, single female/mother families (148 | 15.3%) represent the smallest median family size with 2.82 persons per family.
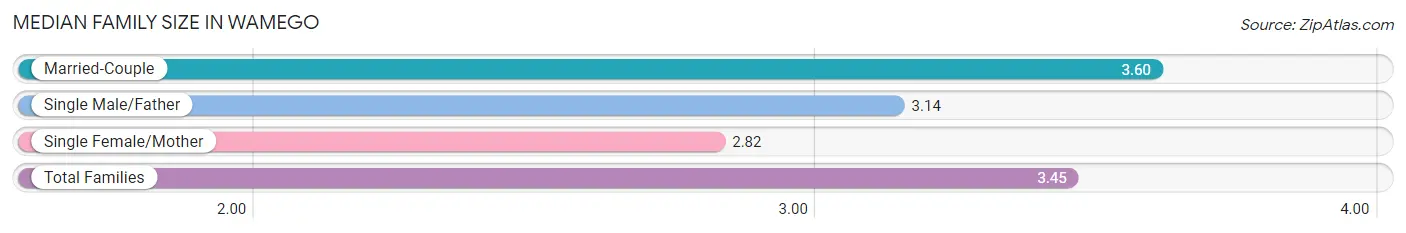
| Family Type | # Families | Family Size |
| Married-Couple | 746 (77.1%) | 3.60 |
| Single Male/Father | 73 (7.5%) | 3.14 |
| Single Female/Mother | 148 (15.3%) | 2.82 |
| Total Families | 967 (100.0%) | 3.45 |
Median Household Size in Wamego
The median household size in Wamego is 2.70 persons per household, with single male/father households (73 | 4.8%) accounting for the largest median household size of 3.89 persons per household. non-family households (558 | 36.6%) represent the smallest median household size with 1.17 persons per household.
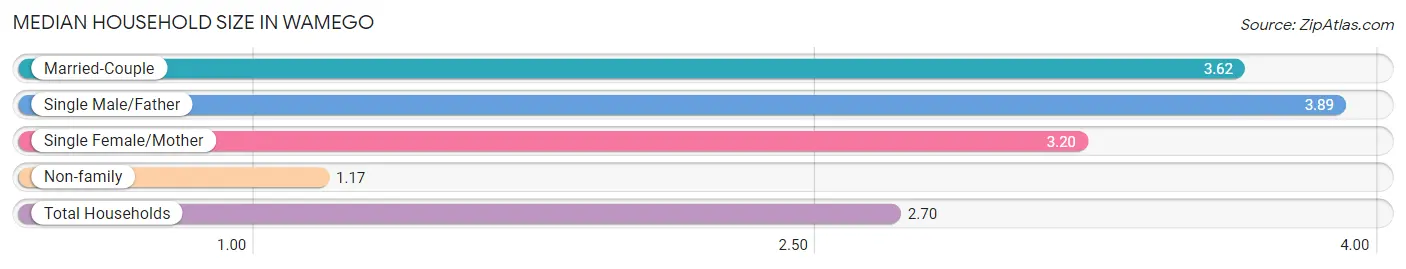
| Household Type | # Households | Household Size |
| Married-Couple | 746 (48.9%) | 3.62 |
| Single Male/Father | 73 (4.8%) | 3.89 |
| Single Female/Mother | 148 (9.7%) | 3.20 |
| Non-family | 558 (36.6%) | 1.17 |
| Total Households | 1,525 (100.0%) | 2.70 |
Household Size by Marriage Status in Wamego
Out of a total of 1,525 households in Wamego, 967 (63.4%) are family households, while 558 (36.6%) are nonfamily households. The most numerous type of family households are 2-person households, comprising 310, and the most common type of nonfamily households are 1-person households, comprising 475.
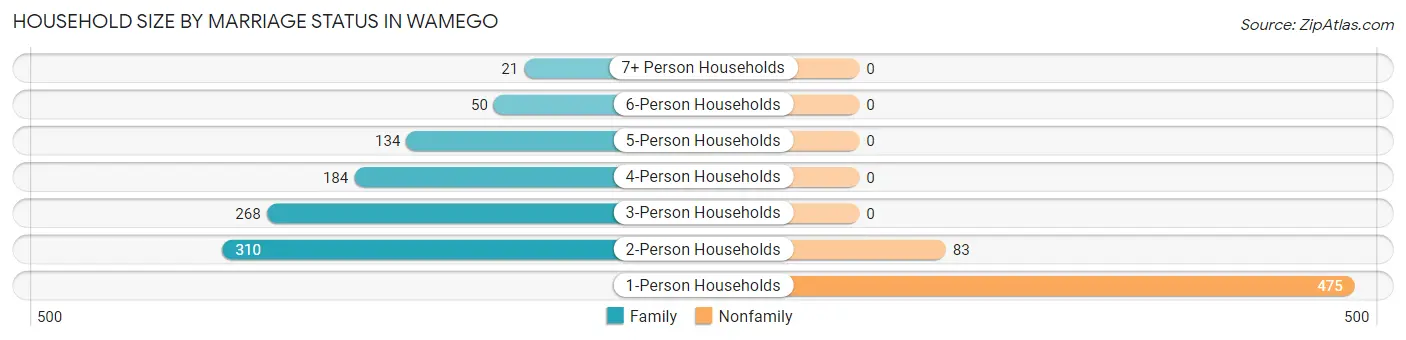
| Household Size | Family Households | Nonfamily Households |
| 1-Person Households | - | 475 (31.1%) |
| 2-Person Households | 310 (20.3%) | 83 (5.4%) |
| 3-Person Households | 268 (17.6%) | 0 (0.0%) |
| 4-Person Households | 184 (12.1%) | 0 (0.0%) |
| 5-Person Households | 134 (8.8%) | 0 (0.0%) |
| 6-Person Households | 50 (3.3%) | 0 (0.0%) |
| 7+ Person Households | 21 (1.4%) | 0 (0.0%) |
| Total | 967 (63.4%) | 558 (36.6%) |
Female Fertility in Wamego
Fertility by Age in Wamego
Average fertility rate in Wamego is 36.0 births per 1,000 women. Women in the age bracket of 20 to 34 years have the highest fertility rate with 71.0 births per 1,000 women. Women in the age bracket of 20 to 34 years acount for 100.0% of all women with births.
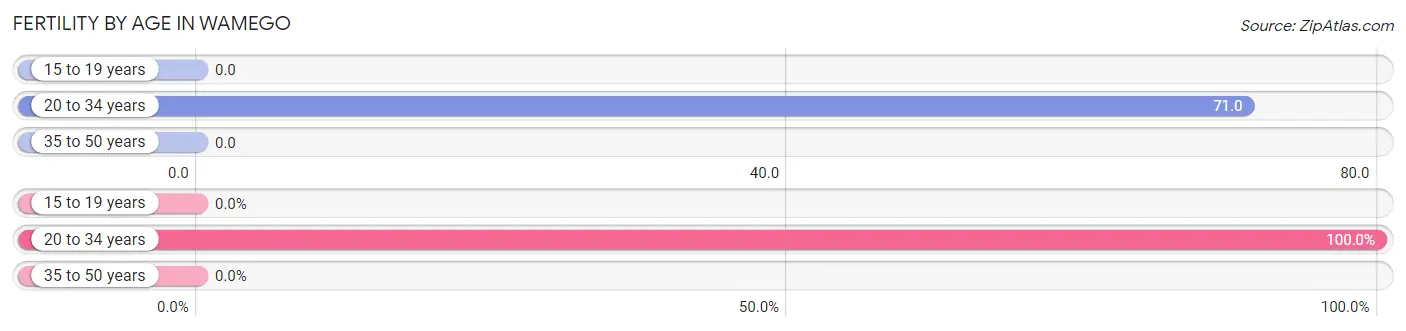
| Age Bracket | Women with Births | Births / 1,000 Women |
| 15 to 19 years | 0 (0.0%) | 0.0 |
| 20 to 34 years | 36 (100.0%) | 71.0 |
| 35 to 50 years | 0 (0.0%) | 0.0 |
| Total | 36 (100.0%) | 36.0 |
Fertility by Age by Marriage Status in Wamego
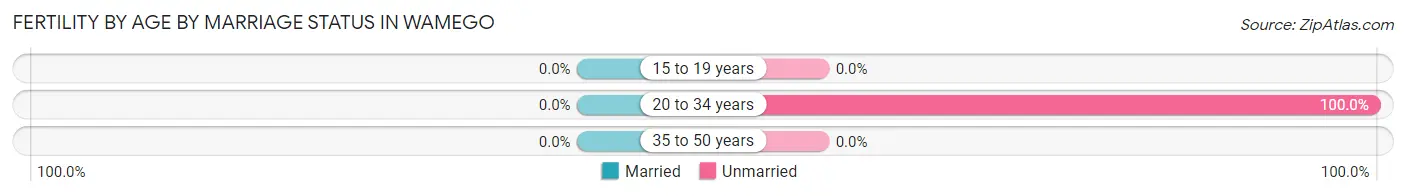
| Age Bracket | Married | Unmarried |
| 15 to 19 years | 0 (0.0%) | 0 (0.0%) |
| 20 to 34 years | 0 (0.0%) | 36 (100.0%) |
| 35 to 50 years | 0 (0.0%) | 0 (0.0%) |
| Total | 0 (0.0%) | 36 (100.0%) |
Fertility by Education in Wamego
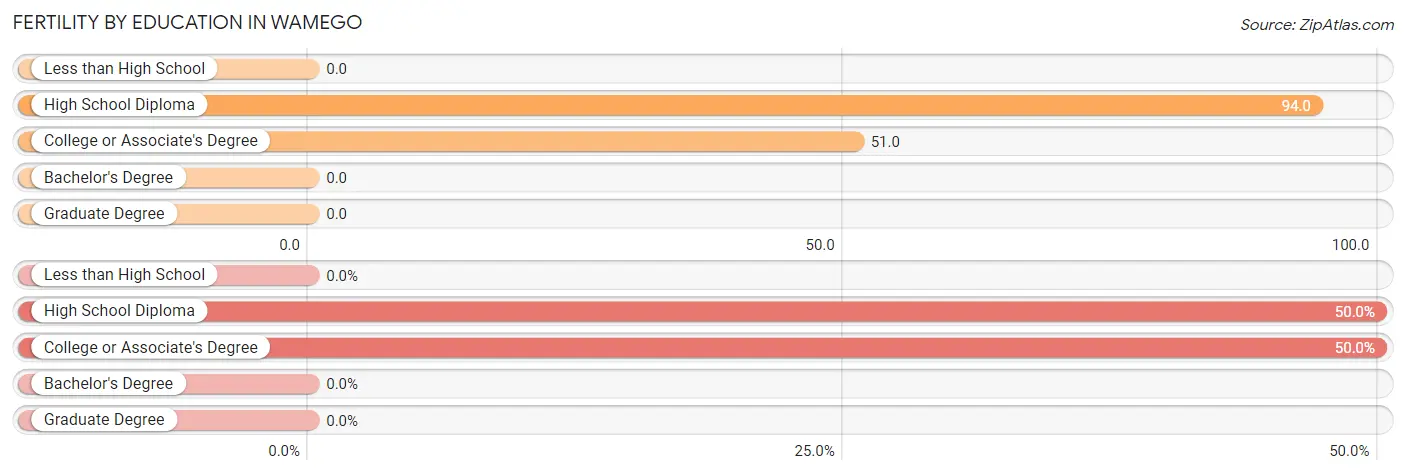
| Educational Attainment | Women with Births | Births / 1,000 Women |
| Less than High School | 0 (0.0%) | 0.0 |
| High School Diploma | 18 (50.0%) | 94.0 |
| College or Associate's Degree | 18 (50.0%) | 51.0 |
| Bachelor's Degree | 0 (0.0%) | 0.0 |
| Graduate Degree | 0 (0.0%) | 0.0 |
| Total | 36 (100.0%) | 36.0 |
Fertility by Education by Marriage Status in Wamego
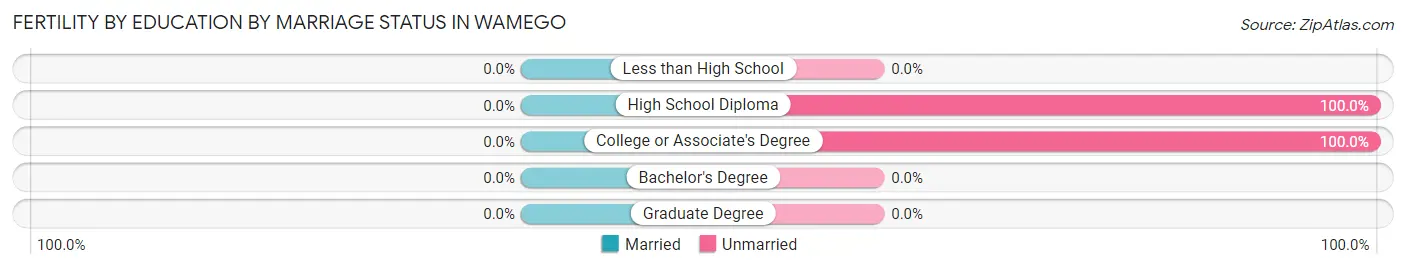
| Educational Attainment | Married | Unmarried |
| Less than High School | 0 (0.0%) | 0 (0.0%) |
| High School Diploma | 0 (0.0%) | 18 (100.0%) |
| College or Associate's Degree | 0 (0.0%) | 18 (100.0%) |
| Bachelor's Degree | 0 (0.0%) | 0 (0.0%) |
| Graduate Degree | 0 (0.0%) | 0 (0.0%) |
| Total | 0 (0.0%) | 36 (100.0%) |
Employment Characteristics in Wamego
Employment by Class of Employer in Wamego
Among the 2,418 employed individuals in Wamego, private company employees (1,318 | 54.5%), state government employees (314 | 13.0%), and local government employees (277 | 11.5%) make up the most common classes of employment.
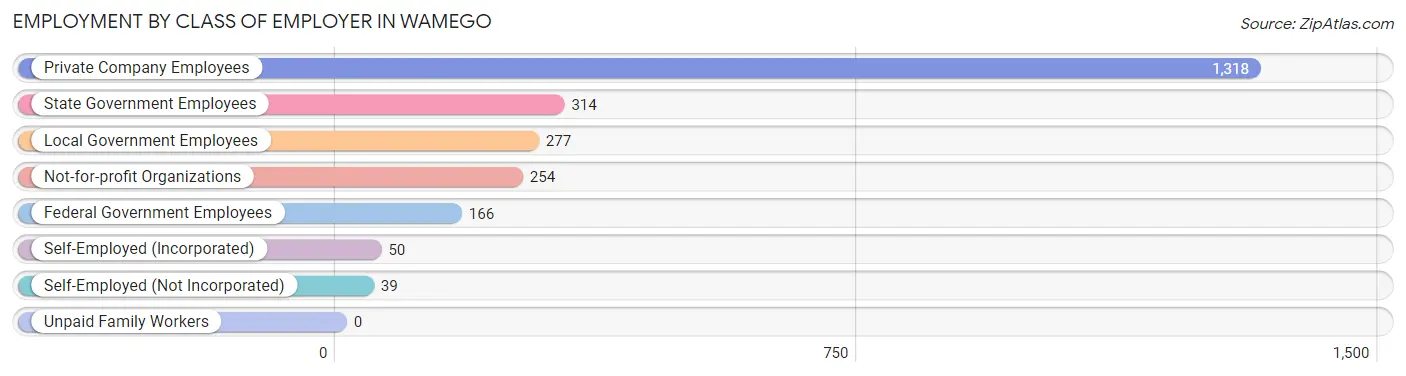
| Employer Class | # Employees | % Employees |
| Private Company Employees | 1,318 | 54.5% |
| Self-Employed (Incorporated) | 50 | 2.1% |
| Self-Employed (Not Incorporated) | 39 | 1.6% |
| Not-for-profit Organizations | 254 | 10.5% |
| Local Government Employees | 277 | 11.5% |
| State Government Employees | 314 | 13.0% |
| Federal Government Employees | 166 | 6.9% |
| Unpaid Family Workers | 0 | 0.0% |
| Total | 2,418 | 100.0% |
Employment Status by Age in Wamego
According to the labor force statistics for Wamego, out of the total population over 16 years of age (3,239), 77.8% or 2,520 individuals are in the labor force, with 4.0% or 101 of them unemployed. The age group with the highest labor force participation rate is 25 to 29 years, with 100.0% or 175 individuals in the labor force. Within the labor force, the 30 to 34 years age range has the highest percentage of unemployed individuals, with 12.4% or 40 of them being unemployed.
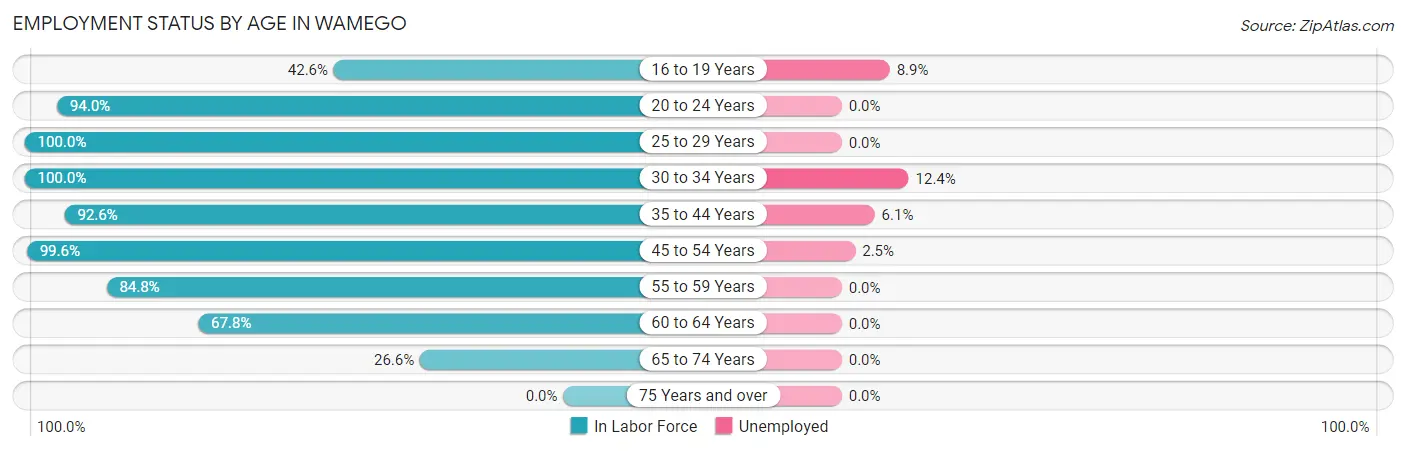
| Age Bracket | In Labor Force | Unemployed |
| 16 to 19 Years | 135 (42.6%) | 12 (8.9%) |
| 20 to 24 Years | 283 (94.0%) | 0 (0.0%) |
| 25 to 29 Years | 175 (100.0%) | 0 (0.0%) |
| 30 to 34 Years | 323 (100.0%) | 40 (12.4%) |
| 35 to 44 Years | 528 (92.6%) | 32 (6.1%) |
| 45 to 54 Years | 726 (99.6%) | 18 (2.5%) |
| 55 to 59 Years | 189 (84.8%) | 0 (0.0%) |
| 60 to 64 Years | 99 (67.8%) | 0 (0.0%) |
| 65 to 74 Years | 62 (26.6%) | 0 (0.0%) |
| 75 Years and over | 0 (0.0%) | 0 (0.0%) |
| Total | 2,520 (77.8%) | 101 (4.0%) |
Employment Status by Educational Attainment in Wamego
According to labor force statistics for Wamego, 94.2% of individuals (2,040) out of the total population between 25 and 64 years of age (2,166) are in the labor force, with 4.4% or 90 of them being unemployed. The group with the highest labor force participation rate are those with the educational attainment of bachelor's degree or higher, with 96.7% or 1,003 individuals in the labor force. Within the labor force, individuals with college / associate degree education have the highest percentage of unemployment, with 5.3% or 40 of them being unemployed.
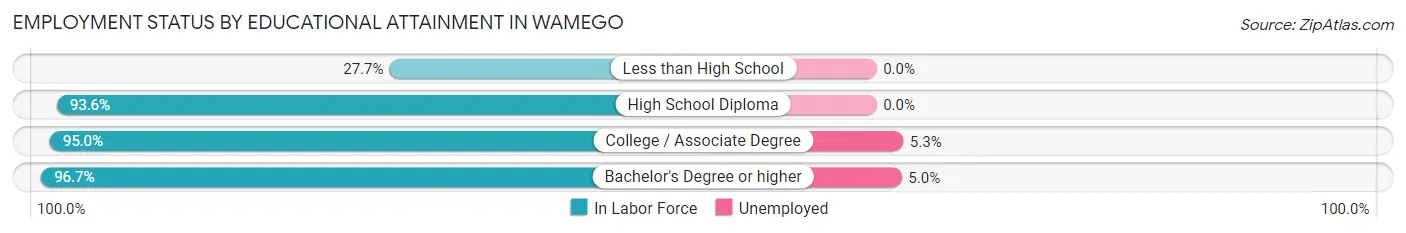
| Educational Attainment | In Labor Force | Unemployed |
| Less than High School | 13 (27.7%) | 0 (0.0%) |
| High School Diploma | 265 (93.6%) | 0 (0.0%) |
| College / Associate Degree | 759 (95.0%) | 42 (5.3%) |
| Bachelor's Degree or higher | 1,003 (96.7%) | 52 (5.0%) |
| Total | 2,040 (94.2%) | 95 (4.4%) |
Employment Occupations by Sex in Wamego
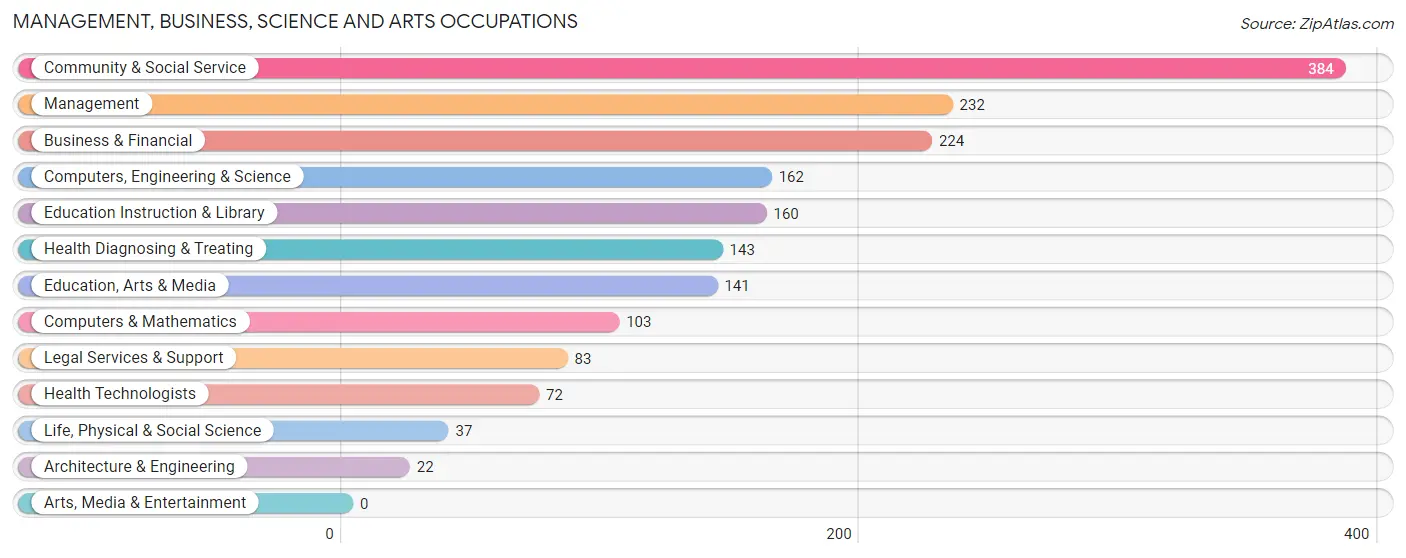
Management, Business, Science and Arts Occupations
The most common Management, Business, Science and Arts occupations in Wamego are Community & Social Service (384 | 15.9%), Management (232 | 9.6%), Business & Financial (224 | 9.3%), Computers, Engineering & Science (162 | 6.7%), and Education Instruction & Library (160 | 6.6%).
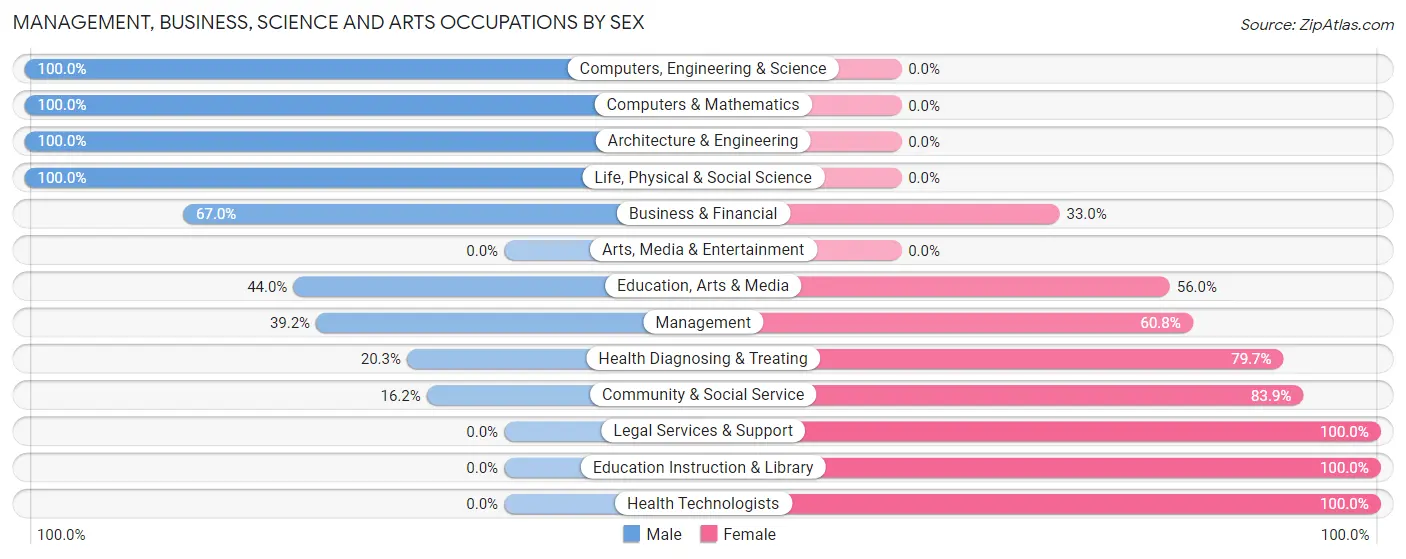
Management, Business, Science and Arts Occupations by Sex
Within the Management, Business, Science and Arts occupations in Wamego, the most male-oriented occupations are Computers, Engineering & Science (100.0%), Computers & Mathematics (100.0%), and Architecture & Engineering (100.0%), while the most female-oriented occupations are Legal Services & Support (100.0%), Education Instruction & Library (100.0%), and Health Technologists (100.0%).
| Occupation | Male | Female |
| Management | 91 (39.2%) | 141 (60.8%) |
| Business & Financial | 150 (67.0%) | 74 (33.0%) |
| Computers, Engineering & Science | 162 (100.0%) | 0 (0.0%) |
| Computers & Mathematics | 103 (100.0%) | 0 (0.0%) |
| Architecture & Engineering | 22 (100.0%) | 0 (0.0%) |
| Life, Physical & Social Science | 37 (100.0%) | 0 (0.0%) |
| Community & Social Service | 62 (16.2%) | 322 (83.9%) |
| Education, Arts & Media | 62 (44.0%) | 79 (56.0%) |
| Legal Services & Support | 0 (0.0%) | 83 (100.0%) |
| Education Instruction & Library | 0 (0.0%) | 160 (100.0%) |
| Arts, Media & Entertainment | 0 (0.0%) | 0 (0.0%) |
| Health Diagnosing & Treating | 29 (20.3%) | 114 (79.7%) |
| Health Technologists | 0 (0.0%) | 72 (100.0%) |
| Total (Category) | 494 (43.1%) | 651 (56.9%) |
| Total (Overall) | 1,298 (53.7%) | 1,120 (46.3%) |
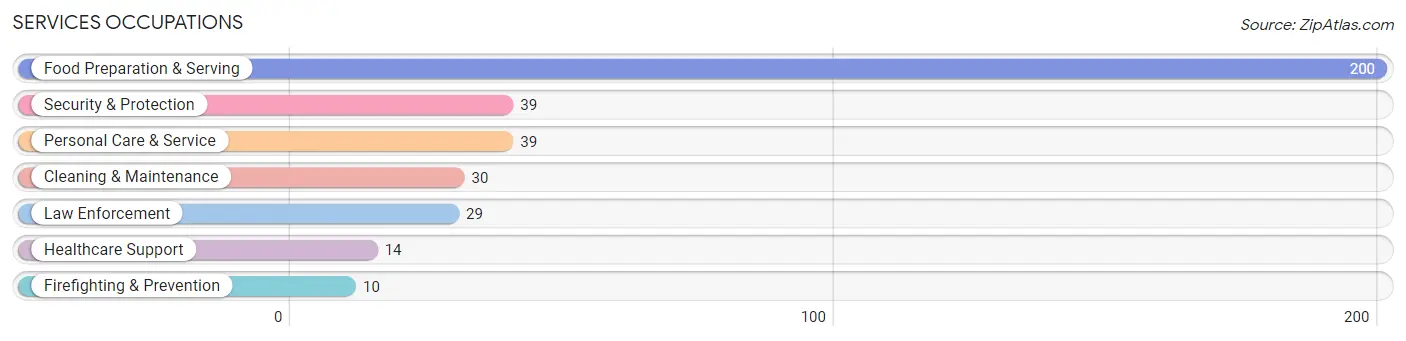
Services Occupations
The most common Services occupations in Wamego are Food Preparation & Serving (200 | 8.3%), Security & Protection (39 | 1.6%), Personal Care & Service (39 | 1.6%), Cleaning & Maintenance (30 | 1.2%), and Law Enforcement (29 | 1.2%).
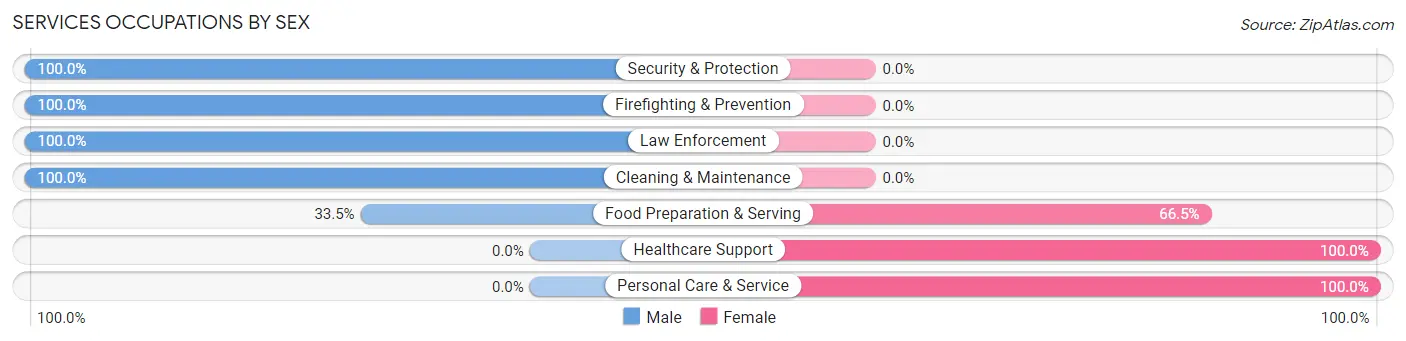
Services Occupations by Sex
Within the Services occupations in Wamego, the most male-oriented occupations are Security & Protection (100.0%), Firefighting & Prevention (100.0%), and Law Enforcement (100.0%), while the most female-oriented occupations are Healthcare Support (100.0%), Personal Care & Service (100.0%), and Food Preparation & Serving (66.5%).
| Occupation | Male | Female |
| Healthcare Support | 0 (0.0%) | 14 (100.0%) |
| Security & Protection | 39 (100.0%) | 0 (0.0%) |
| Firefighting & Prevention | 10 (100.0%) | 0 (0.0%) |
| Law Enforcement | 29 (100.0%) | 0 (0.0%) |
| Food Preparation & Serving | 67 (33.5%) | 133 (66.5%) |
| Cleaning & Maintenance | 30 (100.0%) | 0 (0.0%) |
| Personal Care & Service | 0 (0.0%) | 39 (100.0%) |
| Total (Category) | 136 (42.2%) | 186 (57.8%) |
| Total (Overall) | 1,298 (53.7%) | 1,120 (46.3%) |
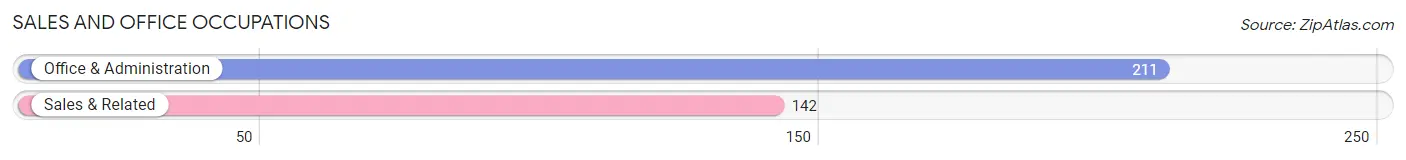
Sales and Office Occupations
The most common Sales and Office occupations in Wamego are Office & Administration (211 | 8.7%), and Sales & Related (142 | 5.9%).
Sales and Office Occupations by Sex
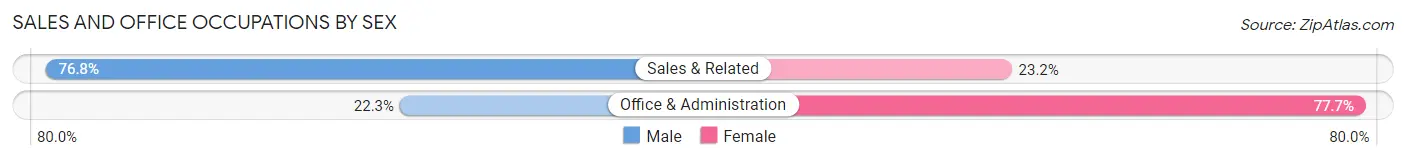
| Occupation | Male | Female |
| Sales & Related | 109 (76.8%) | 33 (23.2%) |
| Office & Administration | 47 (22.3%) | 164 (77.7%) |
| Total (Category) | 156 (44.2%) | 197 (55.8%) |
| Total (Overall) | 1,298 (53.7%) | 1,120 (46.3%) |
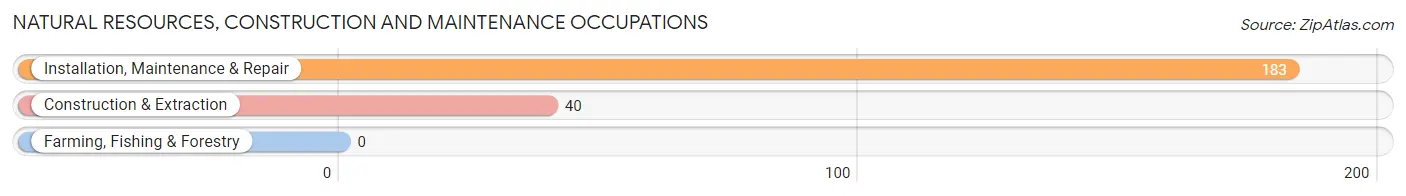
Natural Resources, Construction and Maintenance Occupations
The most common Natural Resources, Construction and Maintenance occupations in Wamego are Installation, Maintenance & Repair (183 | 7.6%), and Construction & Extraction (40 | 1.7%).
Natural Resources, Construction and Maintenance Occupations by Sex
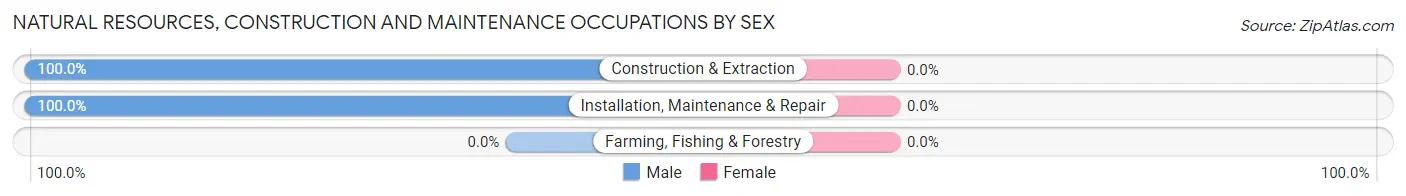
| Occupation | Male | Female |
| Farming, Fishing & Forestry | 0 (0.0%) | 0 (0.0%) |
| Construction & Extraction | 40 (100.0%) | 0 (0.0%) |
| Installation, Maintenance & Repair | 183 (100.0%) | 0 (0.0%) |
| Total (Category) | 223 (100.0%) | 0 (0.0%) |
| Total (Overall) | 1,298 (53.7%) | 1,120 (46.3%) |
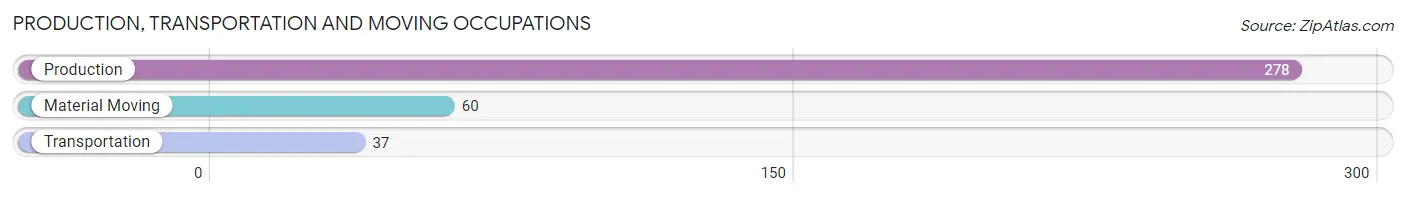
Production, Transportation and Moving Occupations
The most common Production, Transportation and Moving occupations in Wamego are Production (278 | 11.5%), Material Moving (60 | 2.5%), and Transportation (37 | 1.5%).
Production, Transportation and Moving Occupations by Sex
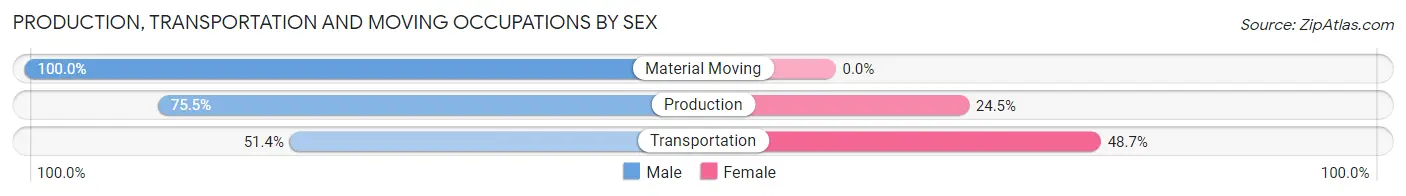
| Occupation | Male | Female |
| Production | 210 (75.5%) | 68 (24.5%) |
| Transportation | 19 (51.3%) | 18 (48.6%) |
| Material Moving | 60 (100.0%) | 0 (0.0%) |
| Total (Category) | 289 (77.1%) | 86 (22.9%) |
| Total (Overall) | 1,298 (53.7%) | 1,120 (46.3%) |
Employment Industries by Sex in Wamego
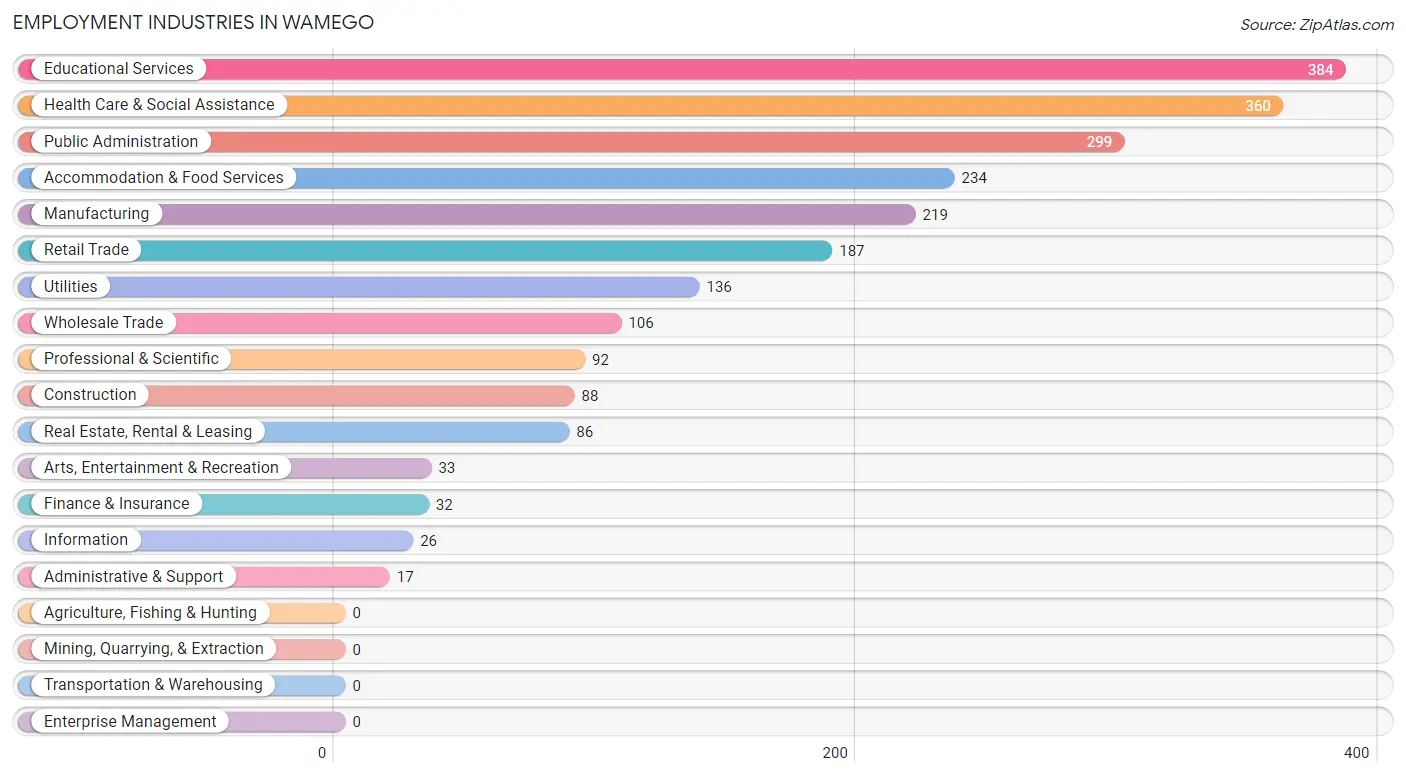
Employment Industries in Wamego
The major employment industries in Wamego include Educational Services (384 | 15.9%), Health Care & Social Assistance (360 | 14.9%), Public Administration (299 | 12.4%), Accommodation & Food Services (234 | 9.7%), and Manufacturing (219 | 9.1%).
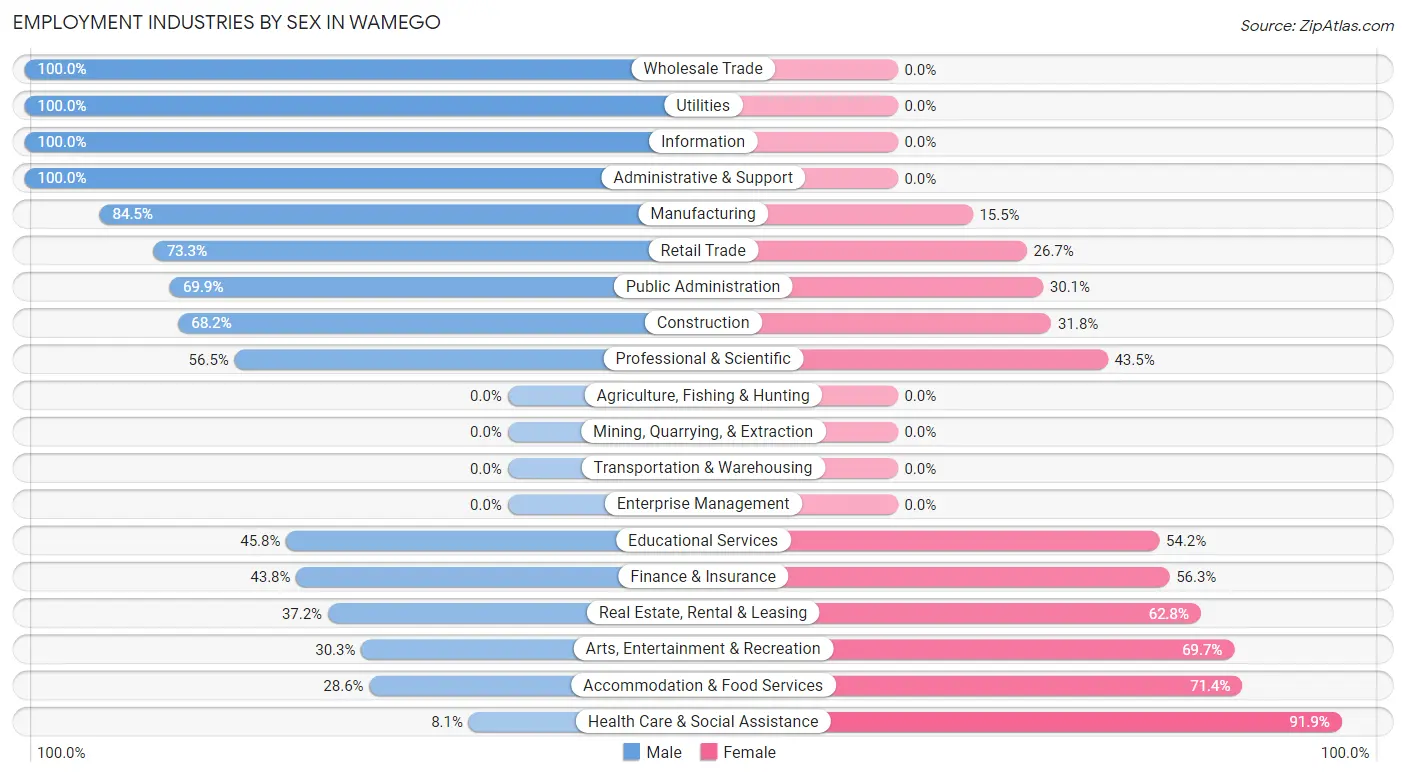
Employment Industries by Sex in Wamego
The Wamego industries that see more men than women are Wholesale Trade (100.0%), Utilities (100.0%), and Information (100.0%), whereas the industries that tend to have a higher number of women are Health Care & Social Assistance (91.9%), Accommodation & Food Services (71.4%), and Arts, Entertainment & Recreation (69.7%).
| Industry | Male | Female |
| Agriculture, Fishing & Hunting | 0 (0.0%) | 0 (0.0%) |
| Mining, Quarrying, & Extraction | 0 (0.0%) | 0 (0.0%) |
| Construction | 60 (68.2%) | 28 (31.8%) |
| Manufacturing | 185 (84.5%) | 34 (15.5%) |
| Wholesale Trade | 106 (100.0%) | 0 (0.0%) |
| Retail Trade | 137 (73.3%) | 50 (26.7%) |
| Transportation & Warehousing | 0 (0.0%) | 0 (0.0%) |
| Utilities | 136 (100.0%) | 0 (0.0%) |
| Information | 26 (100.0%) | 0 (0.0%) |
| Finance & Insurance | 14 (43.8%) | 18 (56.2%) |
| Real Estate, Rental & Leasing | 32 (37.2%) | 54 (62.8%) |
| Professional & Scientific | 52 (56.5%) | 40 (43.5%) |
| Enterprise Management | 0 (0.0%) | 0 (0.0%) |
| Administrative & Support | 17 (100.0%) | 0 (0.0%) |
| Educational Services | 176 (45.8%) | 208 (54.2%) |
| Health Care & Social Assistance | 29 (8.1%) | 331 (91.9%) |
| Arts, Entertainment & Recreation | 10 (30.3%) | 23 (69.7%) |
| Accommodation & Food Services | 67 (28.6%) | 167 (71.4%) |
| Public Administration | 209 (69.9%) | 90 (30.1%) |
| Total | 1,298 (53.7%) | 1,120 (46.3%) |
Education in Wamego
School Enrollment in Wamego
The most common levels of schooling among the 1,170 students in Wamego are high school (346 | 29.6%), elementary school (343 | 29.3%), and middle school (188 | 16.1%).
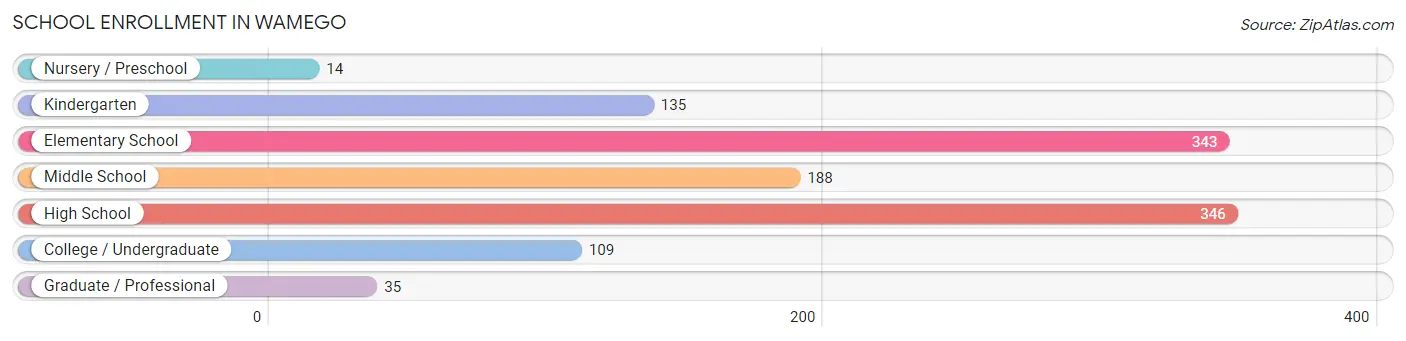
| School Level | # Students | % Students |
| Nursery / Preschool | 14 | 1.2% |
| Kindergarten | 135 | 11.5% |
| Elementary School | 343 | 29.3% |
| Middle School | 188 | 16.1% |
| High School | 346 | 29.6% |
| College / Undergraduate | 109 | 9.3% |
| Graduate / Professional | 35 | 3.0% |
| Total | 1,170 | 100.0% |
School Enrollment by Age by Funding Source in Wamego
Out of a total of 1,170 students who are enrolled in schools in Wamego, 47 (4.0%) attend a private institution, while the remaining 1,123 (96.0%) are enrolled in public schools. The age group of 10 to 14 year olds has the highest likelihood of being enrolled in private schools, with 15 (6.8% in the age bracket) enrolled. Conversely, the age group of 18 to 19 year olds has the lowest likelihood of being enrolled in a private school, with 67 (100.0% in the age bracket) attending a public institution.
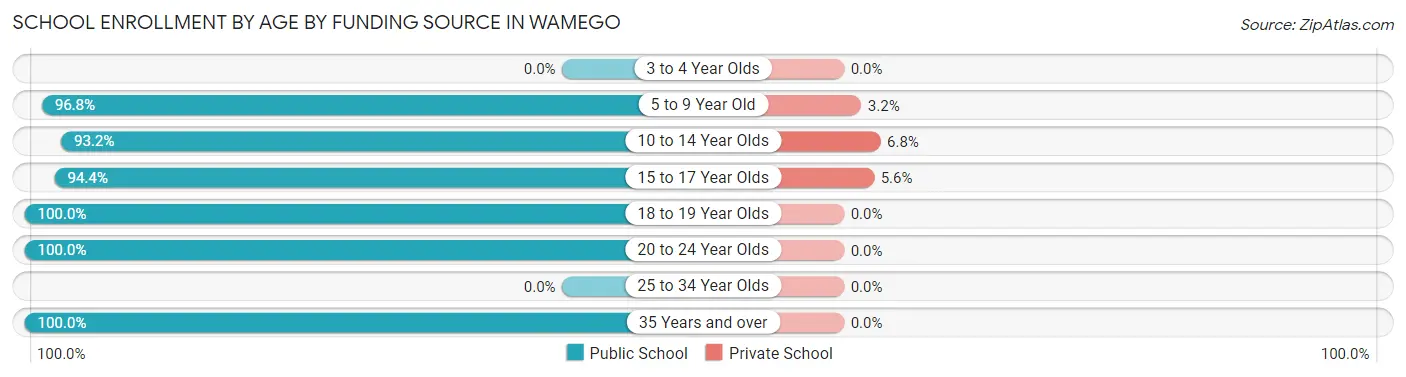
| Age Bracket | Public School | Private School |
| 3 to 4 Year Olds | 0 (0.0%) | 0 (0.0%) |
| 5 to 9 Year Old | 453 (96.8%) | 15 (3.2%) |
| 10 to 14 Year Olds | 206 (93.2%) | 15 (6.8%) |
| 15 to 17 Year Olds | 287 (94.4%) | 17 (5.6%) |
| 18 to 19 Year Olds | 67 (100.0%) | 0 (0.0%) |
| 20 to 24 Year Olds | 55 (100.0%) | 0 (0.0%) |
| 25 to 34 Year Olds | 0 (0.0%) | 0 (0.0%) |
| 35 Years and over | 55 (100.0%) | 0 (0.0%) |
| Total | 1,123 (96.0%) | 47 (4.0%) |
Educational Attainment by Field of Study in Wamego
Education (279 | 23.0%), arts & humanities (174 | 14.3%), business (160 | 13.2%), communications (89 | 7.3%), and literature & languages (80 | 6.6%) are the most common fields of study among 1,213 individuals in Wamego who have obtained a bachelor's degree or higher.
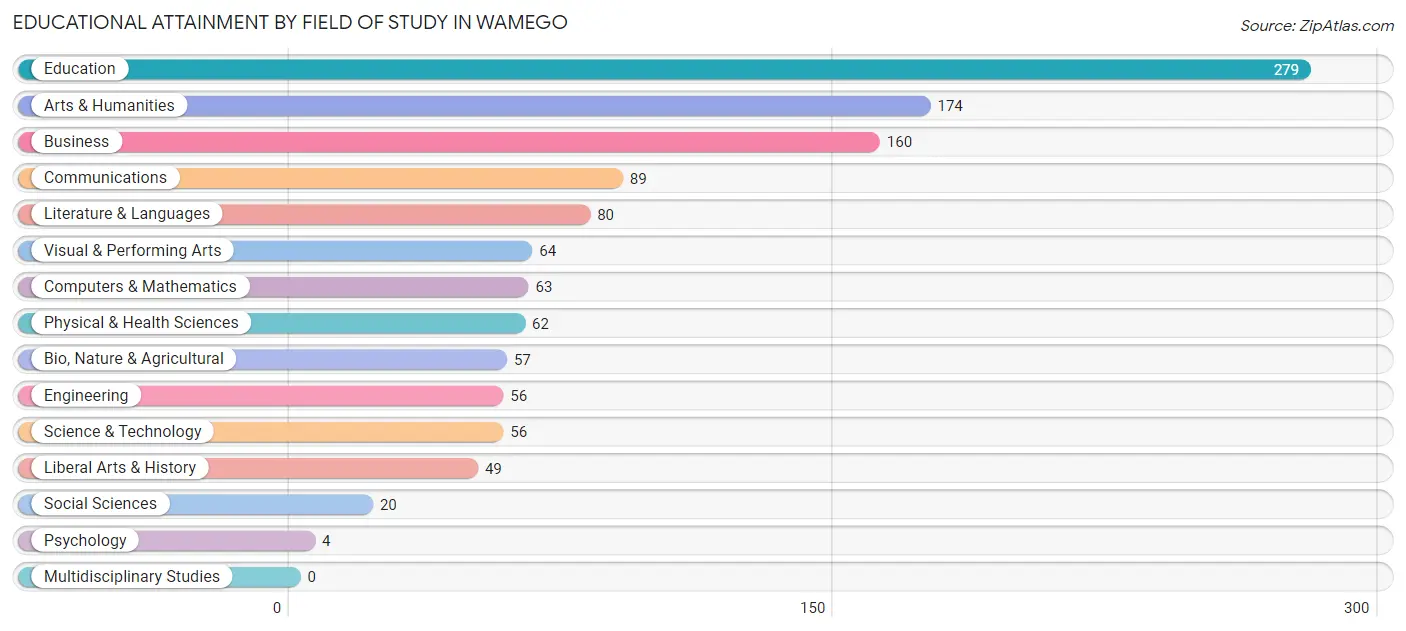
| Field of Study | # Graduates | % Graduates |
| Computers & Mathematics | 63 | 5.2% |
| Bio, Nature & Agricultural | 57 | 4.7% |
| Physical & Health Sciences | 62 | 5.1% |
| Psychology | 4 | 0.3% |
| Social Sciences | 20 | 1.7% |
| Engineering | 56 | 4.6% |
| Multidisciplinary Studies | 0 | 0.0% |
| Science & Technology | 56 | 4.6% |
| Business | 160 | 13.2% |
| Education | 279 | 23.0% |
| Literature & Languages | 80 | 6.6% |
| Liberal Arts & History | 49 | 4.0% |
| Visual & Performing Arts | 64 | 5.3% |
| Communications | 89 | 7.3% |
| Arts & Humanities | 174 | 14.3% |
| Total | 1,213 | 100.0% |
Transportation & Commute in Wamego
Vehicle Availability by Sex in Wamego
The most prevalent vehicle ownership categories in Wamego are males with 2 vehicles (443, accounting for 34.1%) and females with 2 vehicles (355, making up 39.6%).
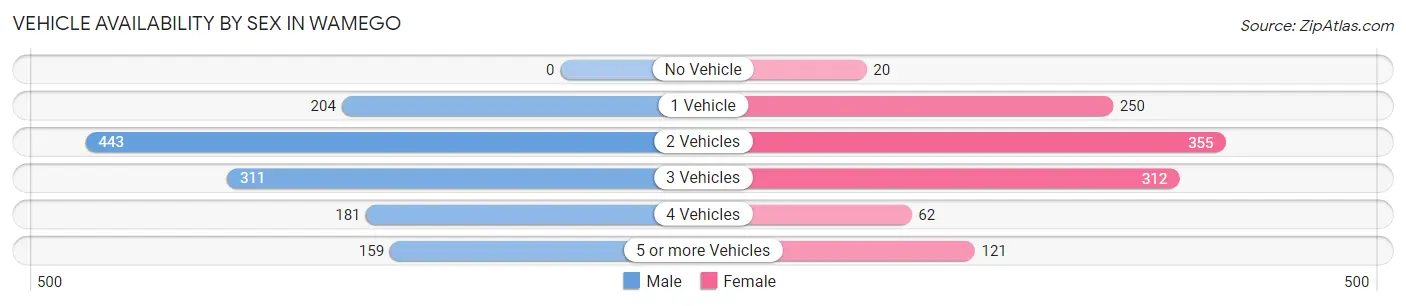
| Vehicles Available | Male | Female |
| No Vehicle | 0 (0.0%) | 20 (1.8%) |
| 1 Vehicle | 204 (15.7%) | 250 (22.3%) |
| 2 Vehicles | 443 (34.1%) | 355 (31.7%) |
| 3 Vehicles | 311 (24.0%) | 312 (27.9%) |
| 4 Vehicles | 181 (13.9%) | 62 (5.5%) |
| 5 or more Vehicles | 159 (12.2%) | 121 (10.8%) |
| Total | 1,298 (100.0%) | 1,120 (100.0%) |
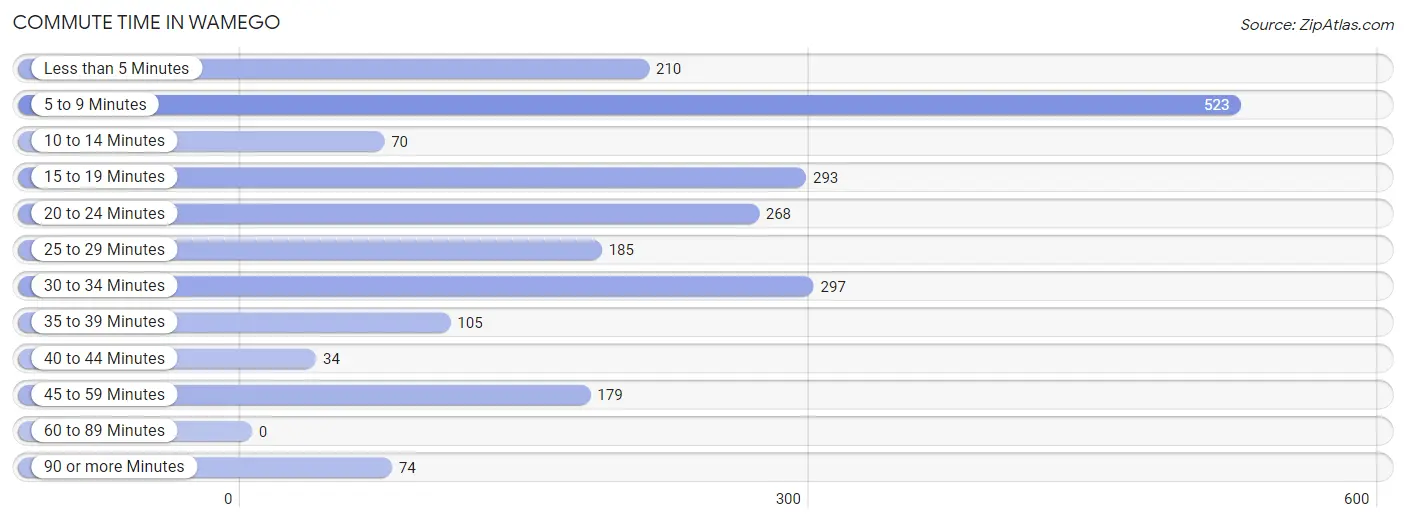
Commute Time in Wamego
The most frequently occuring commute durations in Wamego are 5 to 9 minutes (523 commuters, 23.4%), 30 to 34 minutes (297 commuters, 13.3%), and 15 to 19 minutes (293 commuters, 13.1%).
| Commute Time | # Commuters | % Commuters |
| Less than 5 Minutes | 210 | 9.4% |
| 5 to 9 Minutes | 523 | 23.4% |
| 10 to 14 Minutes | 70 | 3.1% |
| 15 to 19 Minutes | 293 | 13.1% |
| 20 to 24 Minutes | 268 | 12.0% |
| 25 to 29 Minutes | 185 | 8.3% |
| 30 to 34 Minutes | 297 | 13.3% |
| 35 to 39 Minutes | 105 | 4.7% |
| 40 to 44 Minutes | 34 | 1.5% |
| 45 to 59 Minutes | 179 | 8.0% |
| 60 to 89 Minutes | 0 | 0.0% |
| 90 or more Minutes | 74 | 3.3% |
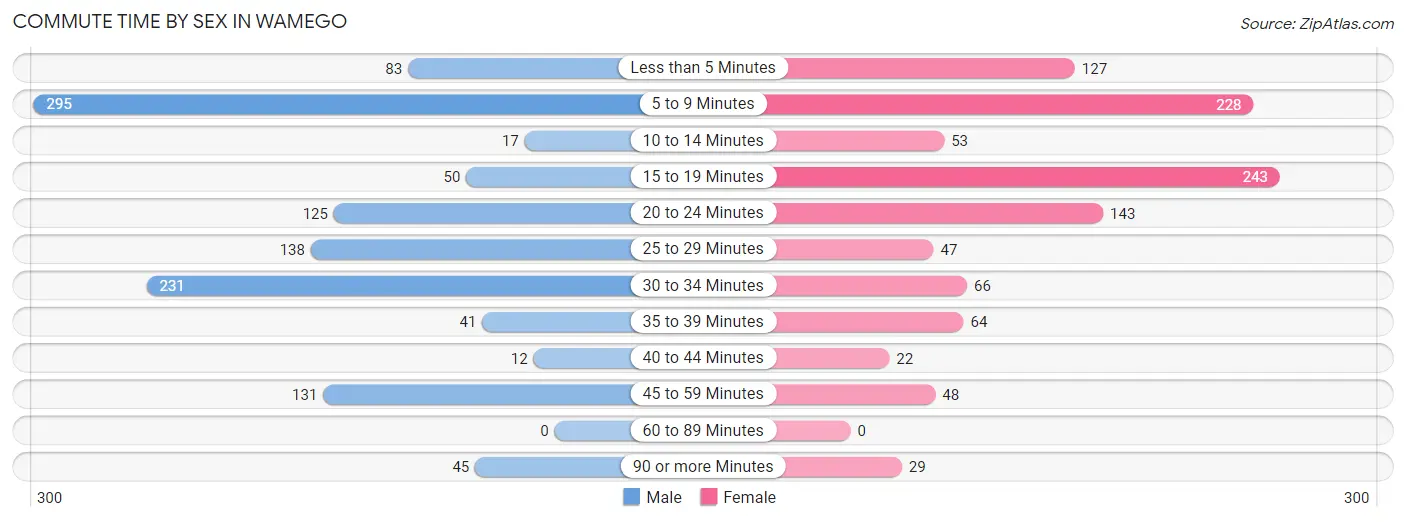
Commute Time by Sex in Wamego
The most common commute times in Wamego are 5 to 9 minutes (295 commuters, 25.3%) for males and 15 to 19 minutes (243 commuters, 22.7%) for females.
| Commute Time | Male | Female |
| Less than 5 Minutes | 83 (7.1%) | 127 (11.9%) |
| 5 to 9 Minutes | 295 (25.3%) | 228 (21.3%) |
| 10 to 14 Minutes | 17 (1.5%) | 53 (5.0%) |
| 15 to 19 Minutes | 50 (4.3%) | 243 (22.7%) |
| 20 to 24 Minutes | 125 (10.7%) | 143 (13.4%) |
| 25 to 29 Minutes | 138 (11.8%) | 47 (4.4%) |
| 30 to 34 Minutes | 231 (19.8%) | 66 (6.2%) |
| 35 to 39 Minutes | 41 (3.5%) | 64 (6.0%) |
| 40 to 44 Minutes | 12 (1.0%) | 22 (2.1%) |
| 45 to 59 Minutes | 131 (11.2%) | 48 (4.5%) |
| 60 to 89 Minutes | 0 (0.0%) | 0 (0.0%) |
| 90 or more Minutes | 45 (3.8%) | 29 (2.7%) |
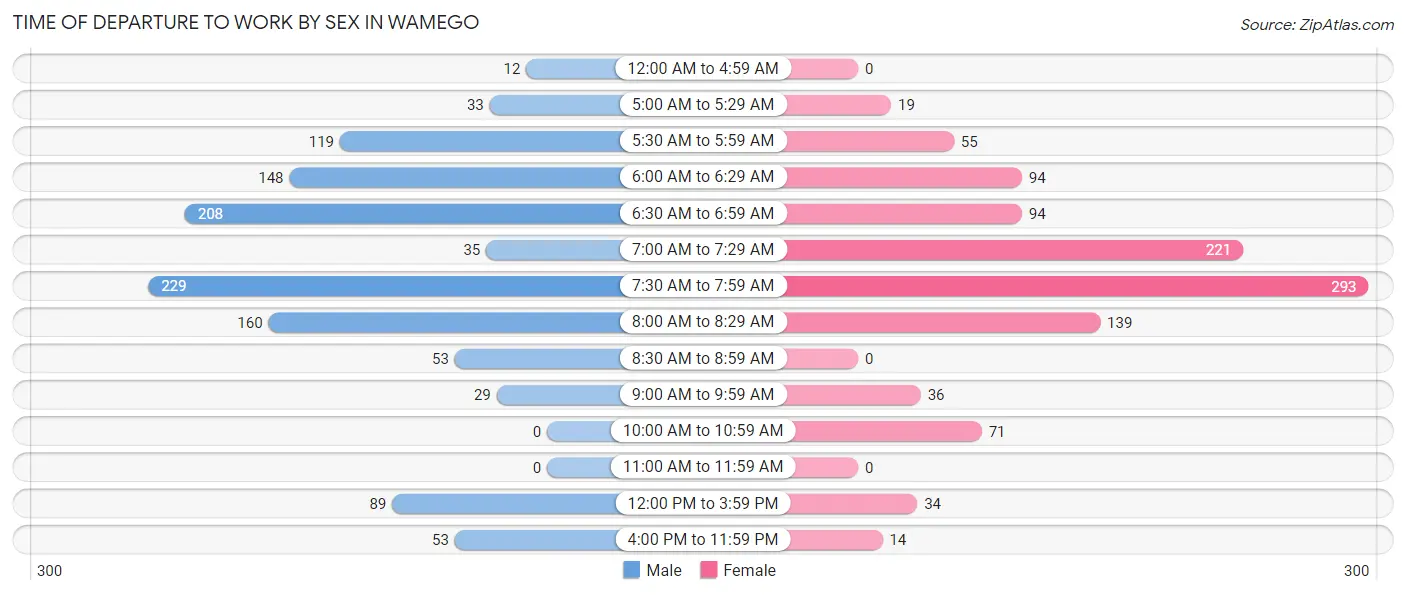
Time of Departure to Work by Sex in Wamego
The most frequent times of departure to work in Wamego are 7:30 AM to 7:59 AM (229, 19.6%) for males and 7:30 AM to 7:59 AM (293, 27.4%) for females.
| Time of Departure | Male | Female |
| 12:00 AM to 4:59 AM | 12 (1.0%) | 0 (0.0%) |
| 5:00 AM to 5:29 AM | 33 (2.8%) | 19 (1.8%) |
| 5:30 AM to 5:59 AM | 119 (10.2%) | 55 (5.1%) |
| 6:00 AM to 6:29 AM | 148 (12.7%) | 94 (8.8%) |
| 6:30 AM to 6:59 AM | 208 (17.8%) | 94 (8.8%) |
| 7:00 AM to 7:29 AM | 35 (3.0%) | 221 (20.6%) |
| 7:30 AM to 7:59 AM | 229 (19.6%) | 293 (27.4%) |
| 8:00 AM to 8:29 AM | 160 (13.7%) | 139 (13.0%) |
| 8:30 AM to 8:59 AM | 53 (4.5%) | 0 (0.0%) |
| 9:00 AM to 9:59 AM | 29 (2.5%) | 36 (3.4%) |
| 10:00 AM to 10:59 AM | 0 (0.0%) | 71 (6.6%) |
| 11:00 AM to 11:59 AM | 0 (0.0%) | 0 (0.0%) |
| 12:00 PM to 3:59 PM | 89 (7.6%) | 34 (3.2%) |
| 4:00 PM to 11:59 PM | 53 (4.5%) | 14 (1.3%) |
| Total | 1,168 (100.0%) | 1,070 (100.0%) |
Housing Occupancy in Wamego
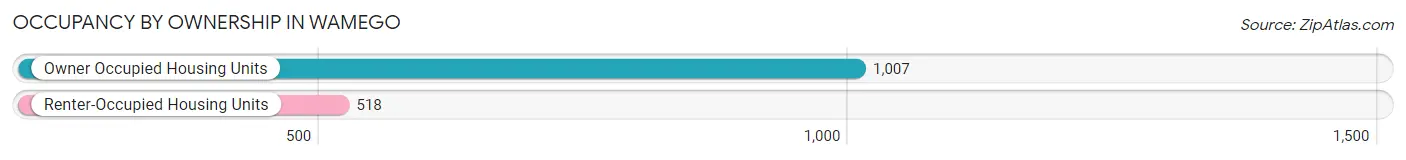
Occupancy by Ownership in Wamego
Of the total 1,525 dwellings in Wamego, owner-occupied units account for 1,007 (66.0%), while renter-occupied units make up 518 (34.0%).
| Occupancy | # Housing Units | % Housing Units |
| Owner Occupied Housing Units | 1,007 | 66.0% |
| Renter-Occupied Housing Units | 518 | 34.0% |
| Total Occupied Housing Units | 1,525 | 100.0% |
Occupancy by Household Size in Wamego
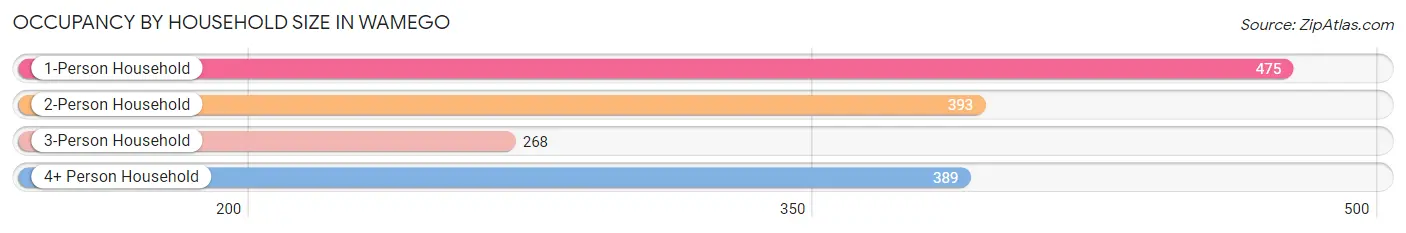
| Household Size | # Housing Units | % Housing Units |
| 1-Person Household | 475 | 31.1% |
| 2-Person Household | 393 | 25.8% |
| 3-Person Household | 268 | 17.6% |
| 4+ Person Household | 389 | 25.5% |
| Total Housing Units | 1,525 | 100.0% |
Occupancy by Ownership by Household Size in Wamego
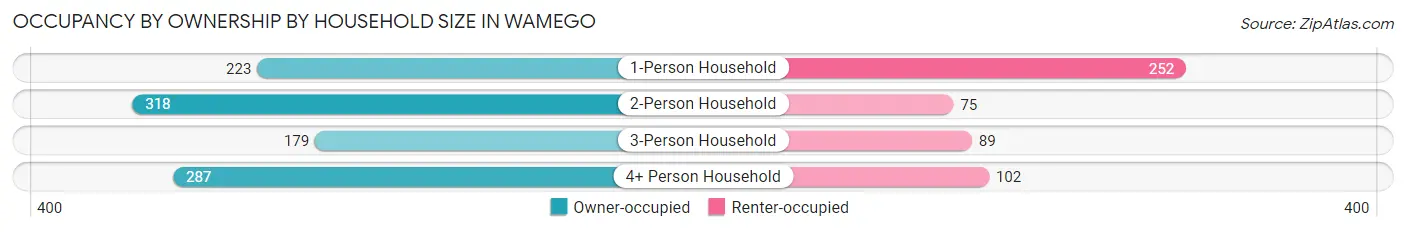
| Household Size | Owner-occupied | Renter-occupied |
| 1-Person Household | 223 (46.9%) | 252 (53.0%) |
| 2-Person Household | 318 (80.9%) | 75 (19.1%) |
| 3-Person Household | 179 (66.8%) | 89 (33.2%) |
| 4+ Person Household | 287 (73.8%) | 102 (26.2%) |
| Total Housing Units | 1,007 (66.0%) | 518 (34.0%) |
Occupancy by Educational Attainment in Wamego
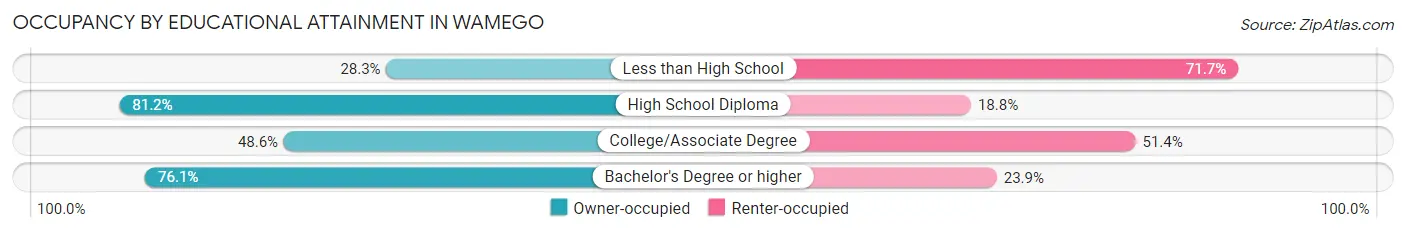
| Household Size | Owner-occupied | Renter-occupied |
| Less than High School | 13 (28.3%) | 33 (71.7%) |
| High School Diploma | 216 (81.2%) | 50 (18.8%) |
| College/Associate Degree | 256 (48.6%) | 271 (51.4%) |
| Bachelor's Degree or higher | 522 (76.1%) | 164 (23.9%) |
Occupancy by Age of Householder in Wamego
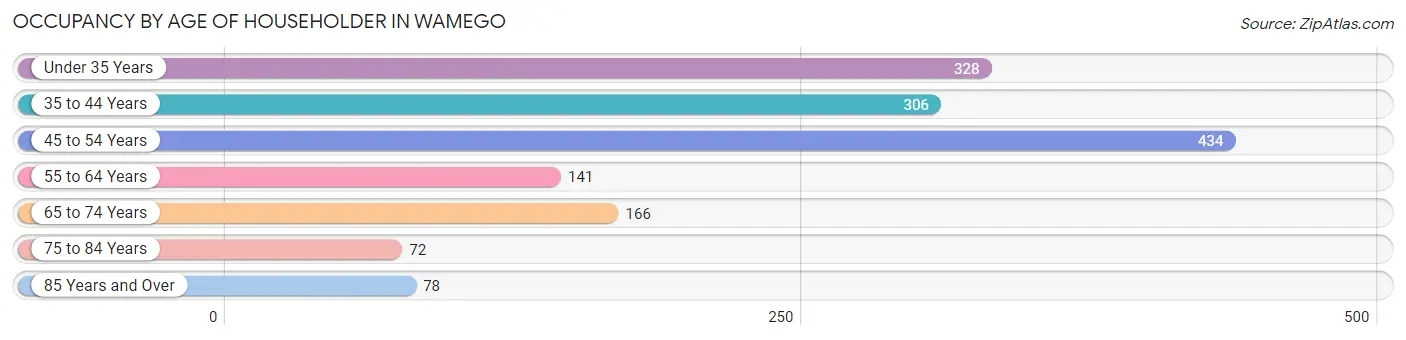
| Age Bracket | # Households | % Households |
| Under 35 Years | 328 | 21.5% |
| 35 to 44 Years | 306 | 20.1% |
| 45 to 54 Years | 434 | 28.5% |
| 55 to 64 Years | 141 | 9.2% |
| 65 to 74 Years | 166 | 10.9% |
| 75 to 84 Years | 72 | 4.7% |
| 85 Years and Over | 78 | 5.1% |
| Total | 1,525 | 100.0% |
Housing Finances in Wamego
Median Income by Occupancy in Wamego
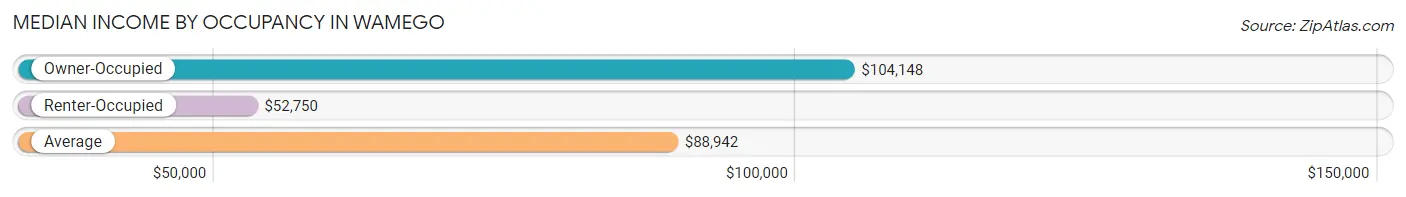
| Occupancy Type | # Households | Median Income |
| Owner-Occupied | 1,007 (66.0%) | $104,148 |
| Renter-Occupied | 518 (34.0%) | $52,750 |
| Average | 1,525 (100.0%) | $88,942 |
Occupancy by Householder Income Bracket in Wamego
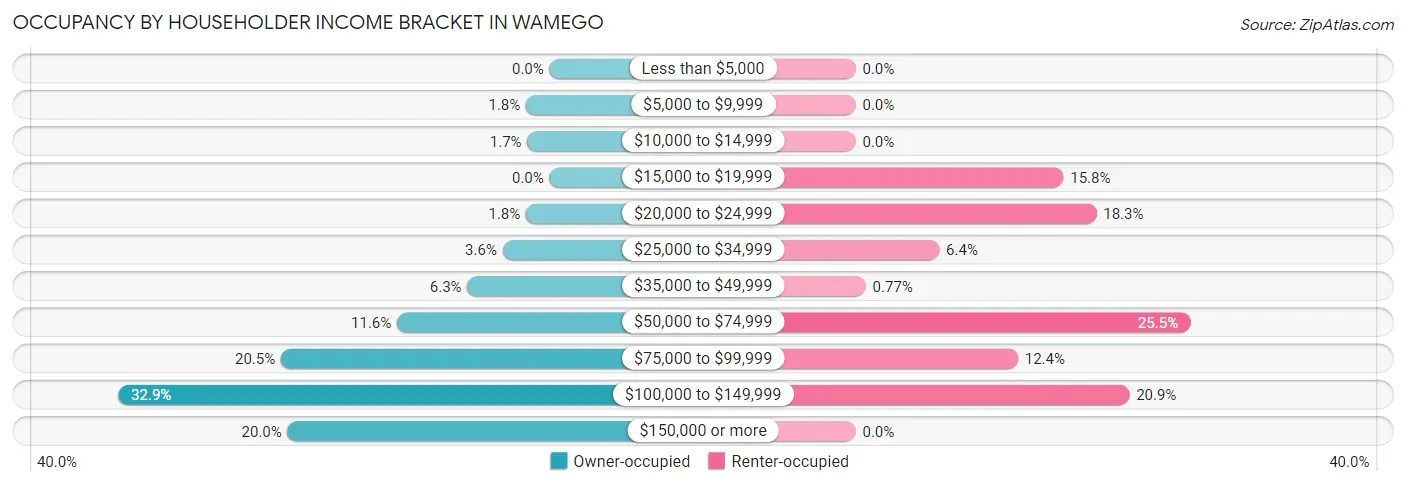
| Income Bracket | Owner-occupied | Renter-occupied |
| Less than $5,000 | 0 (0.0%) | 0 (0.0%) |
| $5,000 to $9,999 | 18 (1.8%) | 0 (0.0%) |
| $10,000 to $14,999 | 17 (1.7%) | 0 (0.0%) |
| $15,000 to $19,999 | 0 (0.0%) | 82 (15.8%) |
| $20,000 to $24,999 | 18 (1.8%) | 95 (18.3%) |
| $25,000 to $34,999 | 36 (3.6%) | 33 (6.4%) |
| $35,000 to $49,999 | 63 (6.3%) | 4 (0.8%) |
| $50,000 to $74,999 | 117 (11.6%) | 132 (25.5%) |
| $75,000 to $99,999 | 206 (20.5%) | 64 (12.4%) |
| $100,000 to $149,999 | 331 (32.9%) | 108 (20.8%) |
| $150,000 or more | 201 (20.0%) | 0 (0.0%) |
| Total | 1,007 (100.0%) | 518 (100.0%) |
Monthly Housing Cost Tiers in Wamego
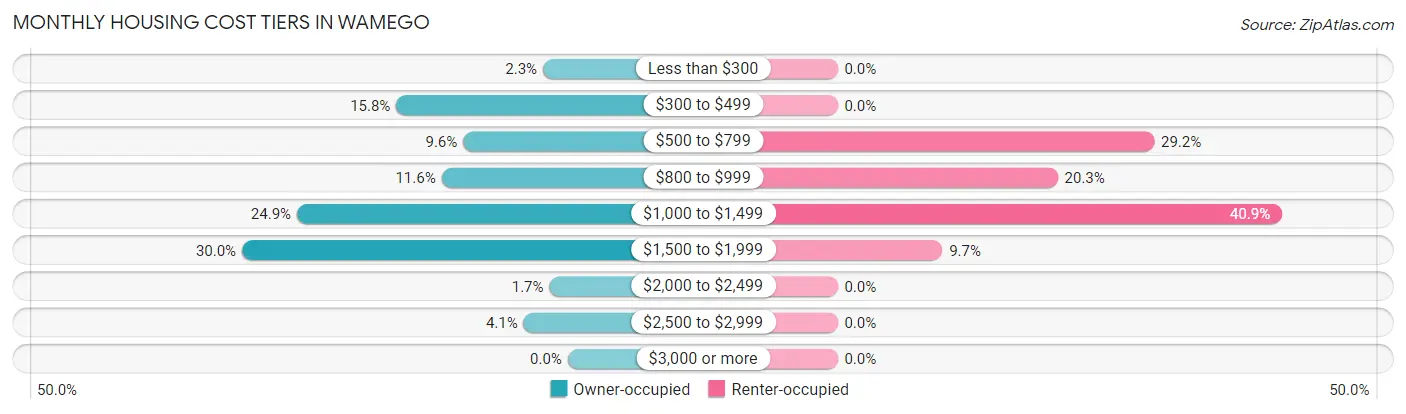
| Monthly Cost | Owner-occupied | Renter-occupied |
| Less than $300 | 23 (2.3%) | 0 (0.0%) |
| $300 to $499 | 159 (15.8%) | 0 (0.0%) |
| $500 to $799 | 97 (9.6%) | 151 (29.1%) |
| $800 to $999 | 117 (11.6%) | 105 (20.3%) |
| $1,000 to $1,499 | 251 (24.9%) | 212 (40.9%) |
| $1,500 to $1,999 | 302 (30.0%) | 50 (9.7%) |
| $2,000 to $2,499 | 17 (1.7%) | 0 (0.0%) |
| $2,500 to $2,999 | 41 (4.1%) | 0 (0.0%) |
| $3,000 or more | 0 (0.0%) | 0 (0.0%) |
| Total | 1,007 (100.0%) | 518 (100.0%) |
Physical Housing Characteristics in Wamego
Housing Structures in Wamego
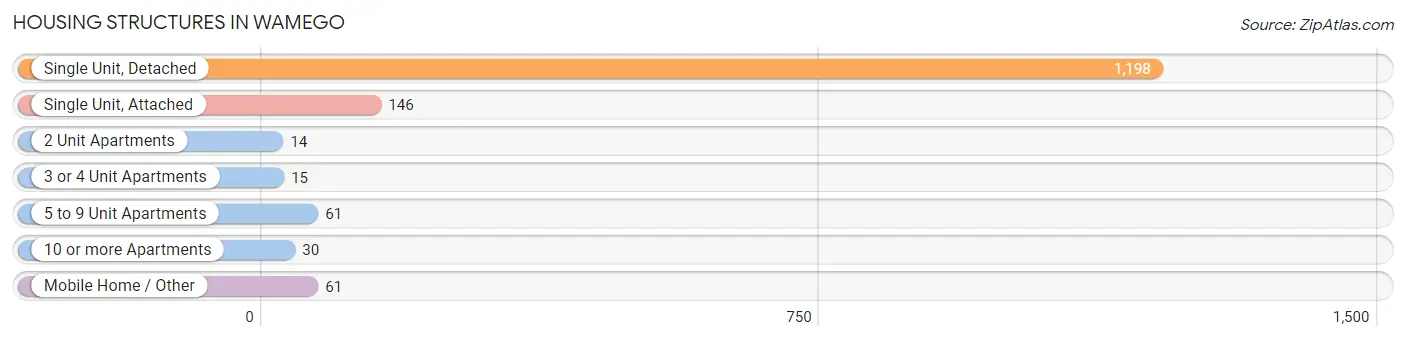
| Structure Type | # Housing Units | % Housing Units |
| Single Unit, Detached | 1,198 | 78.6% |
| Single Unit, Attached | 146 | 9.6% |
| 2 Unit Apartments | 14 | 0.9% |
| 3 or 4 Unit Apartments | 15 | 1.0% |
| 5 to 9 Unit Apartments | 61 | 4.0% |
| 10 or more Apartments | 30 | 2.0% |
| Mobile Home / Other | 61 | 4.0% |
| Total | 1,525 | 100.0% |
Housing Structures by Occupancy in Wamego
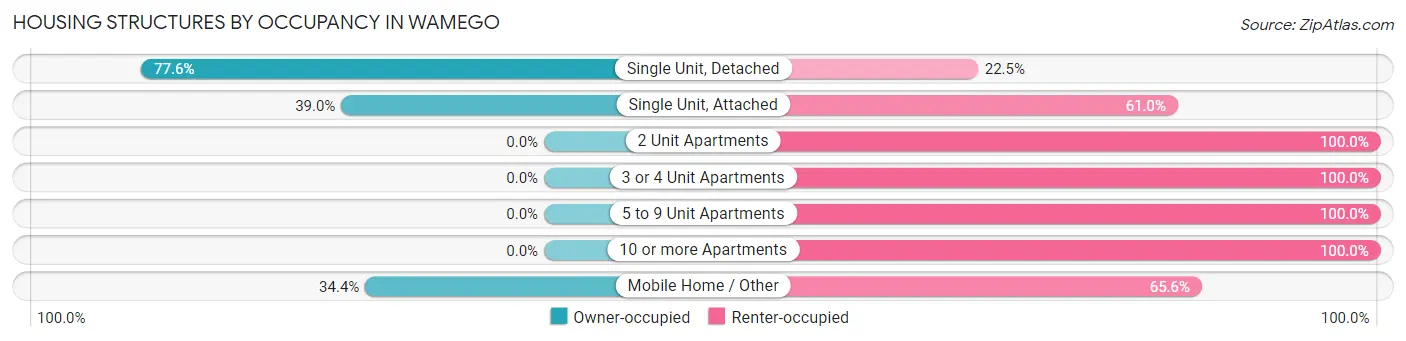
| Structure Type | Owner-occupied | Renter-occupied |
| Single Unit, Detached | 929 (77.5%) | 269 (22.5%) |
| Single Unit, Attached | 57 (39.0%) | 89 (61.0%) |
| 2 Unit Apartments | 0 (0.0%) | 14 (100.0%) |
| 3 or 4 Unit Apartments | 0 (0.0%) | 15 (100.0%) |
| 5 to 9 Unit Apartments | 0 (0.0%) | 61 (100.0%) |
| 10 or more Apartments | 0 (0.0%) | 30 (100.0%) |
| Mobile Home / Other | 21 (34.4%) | 40 (65.6%) |
| Total | 1,007 (66.0%) | 518 (34.0%) |
Housing Structures by Number of Rooms in Wamego
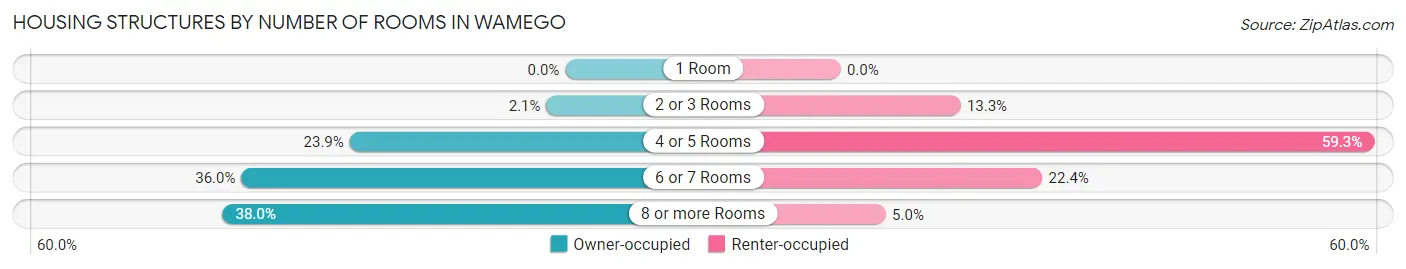
| Number of Rooms | Owner-occupied | Renter-occupied |
| 1 Room | 0 (0.0%) | 0 (0.0%) |
| 2 or 3 Rooms | 21 (2.1%) | 69 (13.3%) |
| 4 or 5 Rooms | 241 (23.9%) | 307 (59.3%) |
| 6 or 7 Rooms | 362 (35.9%) | 116 (22.4%) |
| 8 or more Rooms | 383 (38.0%) | 26 (5.0%) |
| Total | 1,007 (100.0%) | 518 (100.0%) |
Housing Structure by Heating Type in Wamego
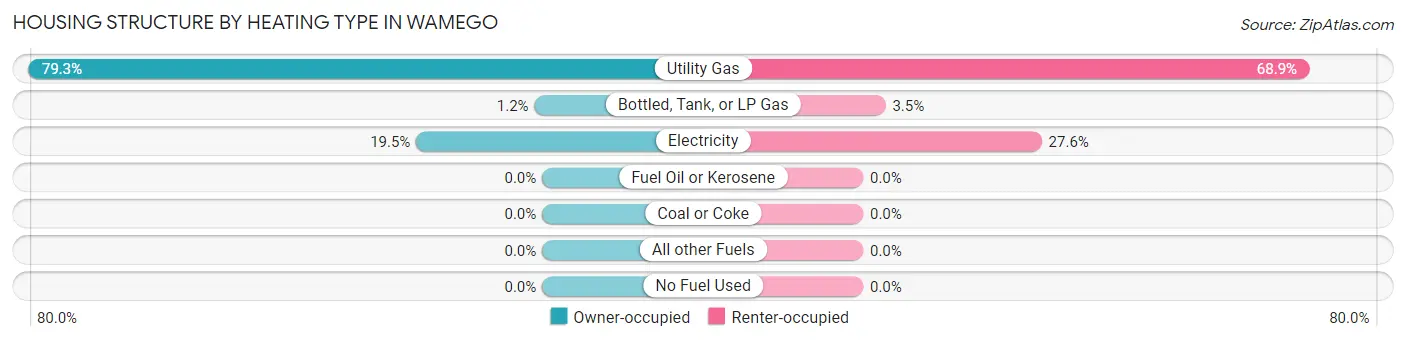
| Heating Type | Owner-occupied | Renter-occupied |
| Utility Gas | 799 (79.3%) | 357 (68.9%) |
| Bottled, Tank, or LP Gas | 12 (1.2%) | 18 (3.5%) |
| Electricity | 196 (19.5%) | 143 (27.6%) |
| Fuel Oil or Kerosene | 0 (0.0%) | 0 (0.0%) |
| Coal or Coke | 0 (0.0%) | 0 (0.0%) |
| All other Fuels | 0 (0.0%) | 0 (0.0%) |
| No Fuel Used | 0 (0.0%) | 0 (0.0%) |
| Total | 1,007 (100.0%) | 518 (100.0%) |
Household Vehicle Usage in Wamego
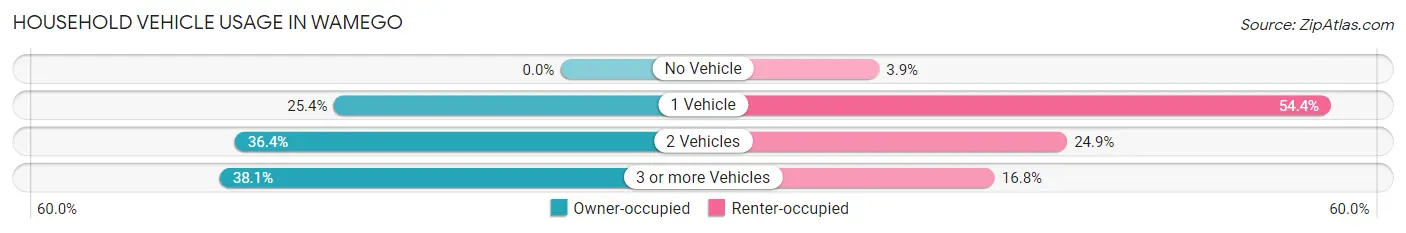
| Vehicles per Household | Owner-occupied | Renter-occupied |
| No Vehicle | 0 (0.0%) | 20 (3.9%) |
| 1 Vehicle | 256 (25.4%) | 282 (54.4%) |
| 2 Vehicles | 367 (36.4%) | 129 (24.9%) |
| 3 or more Vehicles | 384 (38.1%) | 87 (16.8%) |
| Total | 1,007 (100.0%) | 518 (100.0%) |
Real Estate & Mortgages in Wamego
Real Estate and Mortgage Overview in Wamego
| Characteristic | Without Mortgage | With Mortgage |
| Housing Units | 352 | 655 |
| Median Property Value | $178,400 | $212,800 |
| Median Household Income | $74,239 | $147 |
| Monthly Housing Costs | $494 | $0 |
| Real Estate Taxes | $2,963 | $79 |
Property Value by Mortgage Status in Wamego
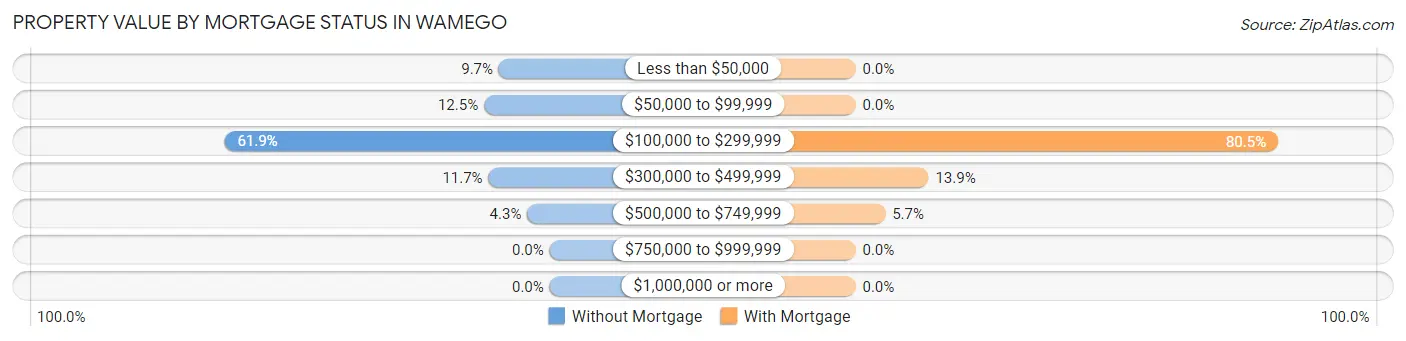
| Property Value | Without Mortgage | With Mortgage |
| Less than $50,000 | 34 (9.7%) | 0 (0.0%) |
| $50,000 to $99,999 | 44 (12.5%) | 0 (0.0%) |
| $100,000 to $299,999 | 218 (61.9%) | 527 (80.5%) |
| $300,000 to $499,999 | 41 (11.7%) | 91 (13.9%) |
| $500,000 to $749,999 | 15 (4.3%) | 37 (5.7%) |
| $750,000 to $999,999 | 0 (0.0%) | 0 (0.0%) |
| $1,000,000 or more | 0 (0.0%) | 0 (0.0%) |
| Total | 352 (100.0%) | 655 (100.0%) |
Household Income by Mortgage Status in Wamego
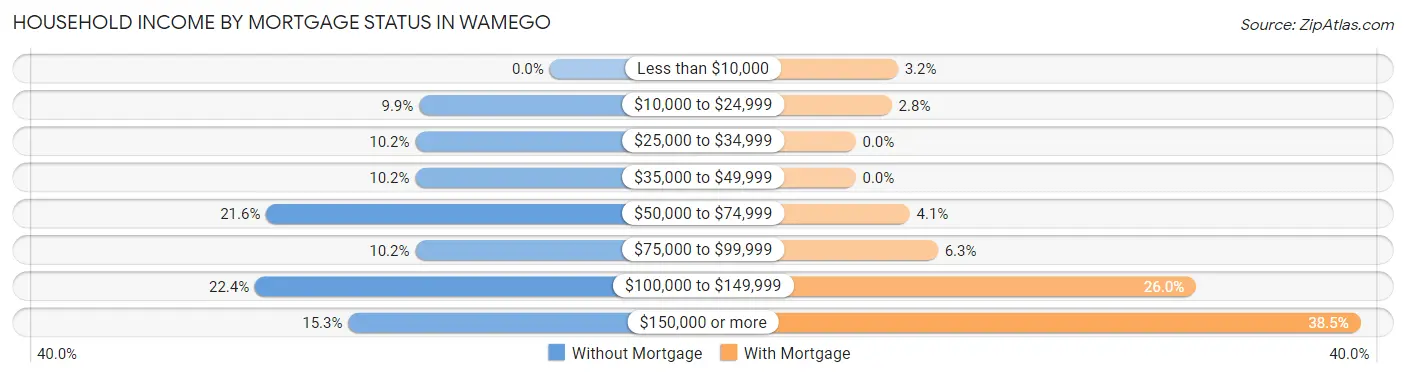
| Household Income | Without Mortgage | With Mortgage |
| Less than $10,000 | 0 (0.0%) | 21 (3.2%) |
| $10,000 to $24,999 | 35 (9.9%) | 18 (2.8%) |
| $25,000 to $34,999 | 36 (10.2%) | 0 (0.0%) |
| $35,000 to $49,999 | 36 (10.2%) | 0 (0.0%) |
| $50,000 to $74,999 | 76 (21.6%) | 27 (4.1%) |
| $75,000 to $99,999 | 36 (10.2%) | 41 (6.3%) |
| $100,000 to $149,999 | 79 (22.4%) | 170 (26.0%) |
| $150,000 or more | 54 (15.3%) | 252 (38.5%) |
| Total | 352 (100.0%) | 655 (100.0%) |
Property Value to Household Income Ratio in Wamego
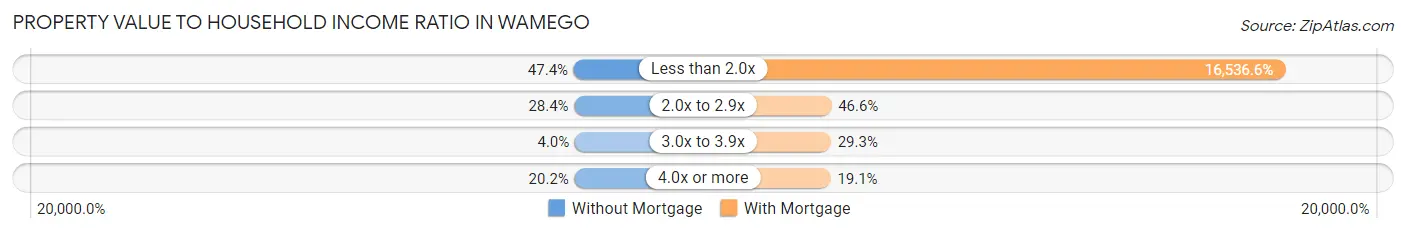
| Value-to-Income Ratio | Without Mortgage | With Mortgage |
| Less than 2.0x | 167 (47.4%) | 108,315 (16,536.6%) |
| 2.0x to 2.9x | 100 (28.4%) | 305 (46.6%) |
| 3.0x to 3.9x | 14 (4.0%) | 192 (29.3%) |
| 4.0x or more | 71 (20.2%) | 125 (19.1%) |
| Total | 352 (100.0%) | 655 (100.0%) |
Real Estate Taxes by Mortgage Status in Wamego
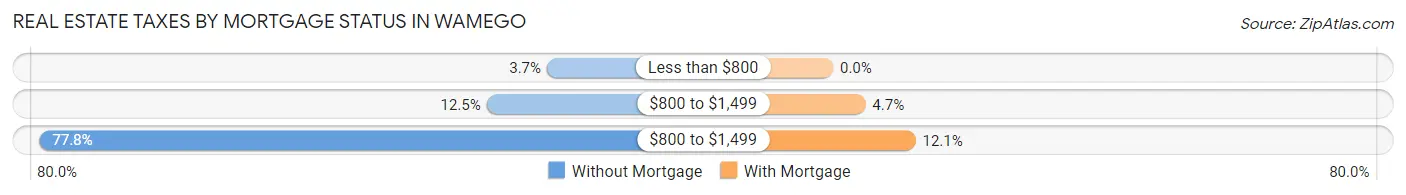
| Property Taxes | Without Mortgage | With Mortgage |
| Less than $800 | 13 (3.7%) | 0 (0.0%) |
| $800 to $1,499 | 44 (12.5%) | 31 (4.7%) |
| $800 to $1,499 | 274 (77.8%) | 79 (12.1%) |
| Total | 352 (100.0%) | 655 (100.0%) |
Health & Disability in Wamego
Health Insurance Coverage by Age in Wamego
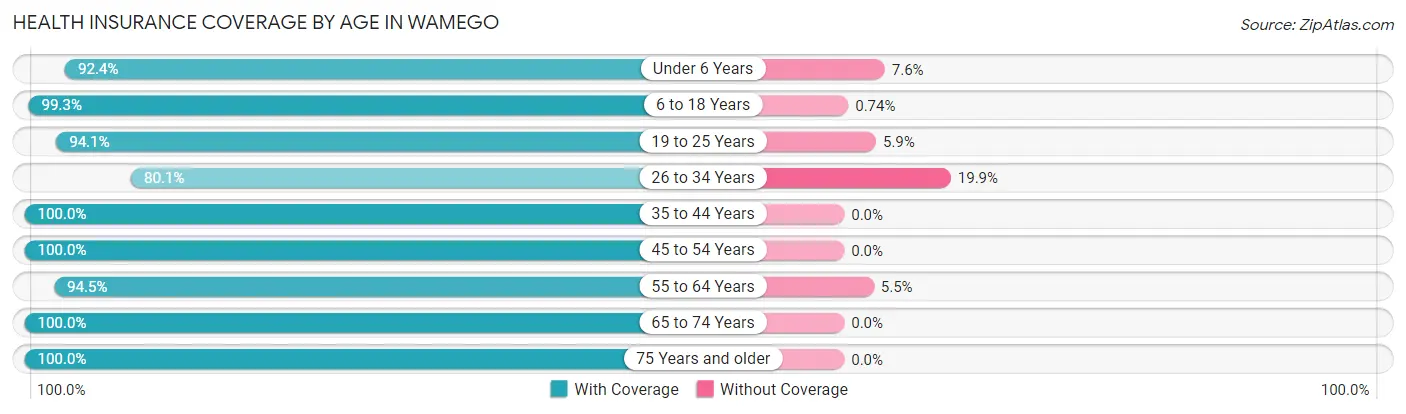
| Age Bracket | With Coverage | Without Coverage |
| Under 6 Years | 269 (92.4%) | 22 (7.6%) |
| 6 to 18 Years | 936 (99.3%) | 7 (0.7%) |
| 19 to 25 Years | 334 (94.1%) | 21 (5.9%) |
| 26 to 34 Years | 383 (80.1%) | 95 (19.9%) |
| 35 to 44 Years | 562 (100.0%) | 0 (0.0%) |
| 45 to 54 Years | 726 (100.0%) | 0 (0.0%) |
| 55 to 64 Years | 343 (94.5%) | 20 (5.5%) |
| 65 to 74 Years | 217 (100.0%) | 0 (0.0%) |
| 75 Years and older | 181 (100.0%) | 0 (0.0%) |
| Total | 3,951 (96.0%) | 165 (4.0%) |
Health Insurance Coverage by Citizenship Status in Wamego
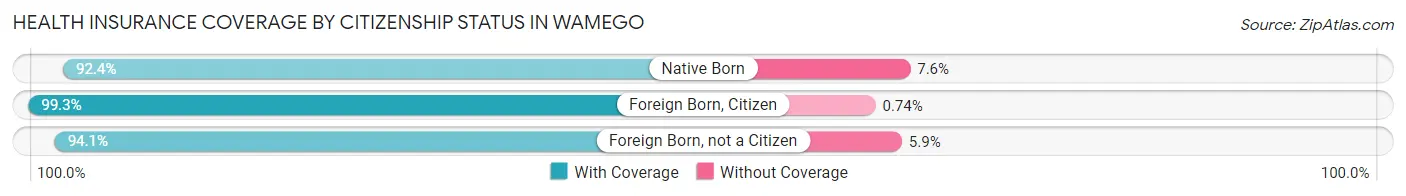
| Citizenship Status | With Coverage | Without Coverage |
| Native Born | 269 (92.4%) | 22 (7.6%) |
| Foreign Born, Citizen | 936 (99.3%) | 7 (0.7%) |
| Foreign Born, not a Citizen | 334 (94.1%) | 21 (5.9%) |
Health Insurance Coverage by Household Income in Wamego
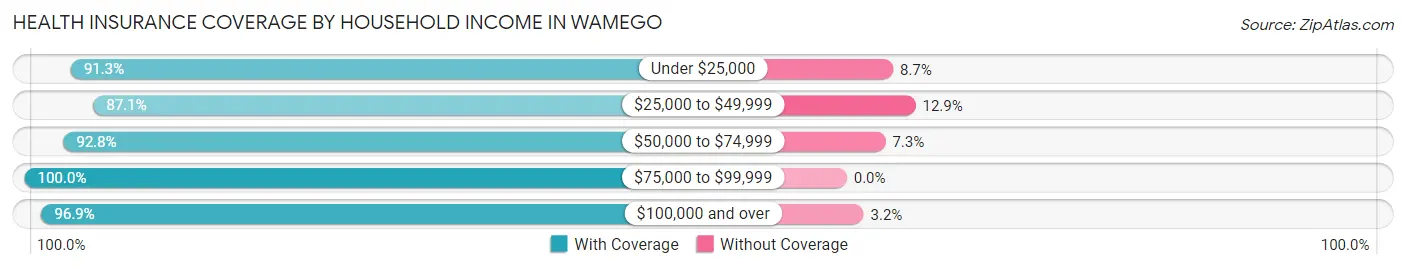
| Household Income | With Coverage | Without Coverage |
| Under $25,000 | 422 (91.3%) | 40 (8.7%) |
| $25,000 to $49,999 | 142 (87.1%) | 21 (12.9%) |
| $50,000 to $74,999 | 537 (92.7%) | 42 (7.2%) |
| $75,000 to $99,999 | 941 (100.0%) | 0 (0.0%) |
| $100,000 and over | 1,906 (96.9%) | 62 (3.2%) |
Public vs Private Health Insurance Coverage by Age in Wamego
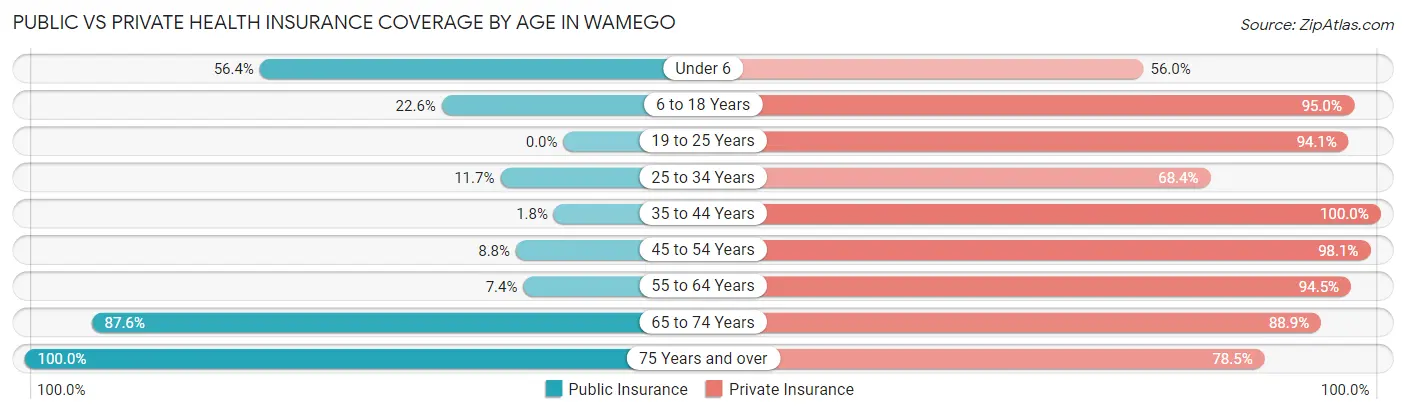
| Age Bracket | Public Insurance | Private Insurance |
| Under 6 | 164 (56.4%) | 163 (56.0%) |
| 6 to 18 Years | 213 (22.6%) | 896 (95.0%) |
| 19 to 25 Years | 0 (0.0%) | 334 (94.1%) |
| 25 to 34 Years | 56 (11.7%) | 327 (68.4%) |
| 35 to 44 Years | 10 (1.8%) | 562 (100.0%) |
| 45 to 54 Years | 64 (8.8%) | 712 (98.1%) |
| 55 to 64 Years | 27 (7.4%) | 343 (94.5%) |
| 65 to 74 Years | 190 (87.6%) | 193 (88.9%) |
| 75 Years and over | 181 (100.0%) | 142 (78.4%) |
| Total | 905 (22.0%) | 3,672 (89.2%) |
Disability Status by Sex by Age in Wamego
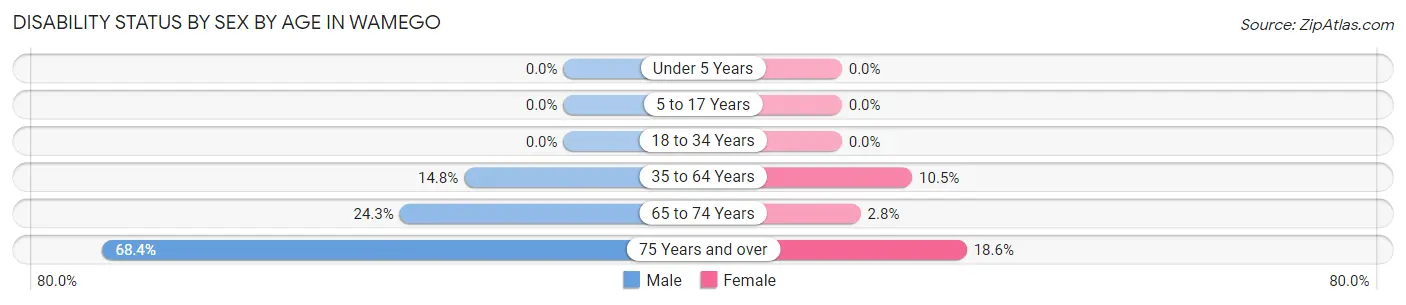
| Age Bracket | Male | Female |
| Under 5 Years | 0 (0.0%) | 0 (0.0%) |
| 5 to 17 Years | 0 (0.0%) | 0 (0.0%) |
| 18 to 34 Years | 0 (0.0%) | 0 (0.0%) |
| 35 to 64 Years | 149 (14.7%) | 67 (10.4%) |
| 65 to 74 Years | 18 (24.3%) | 4 (2.8%) |
| 75 Years and over | 39 (68.4%) | 23 (18.5%) |
Disability Class by Sex by Age in Wamego
Disability Class: Hearing Difficulty
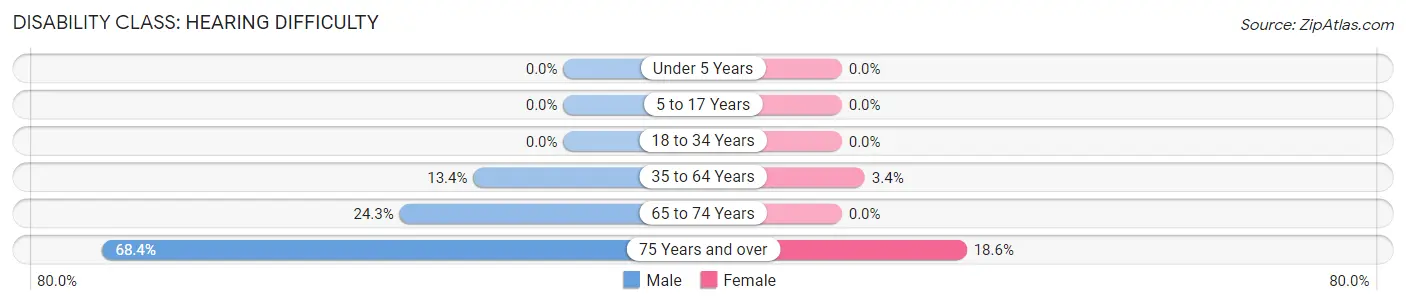
| Age Bracket | Male | Female |
| Under 5 Years | 0 (0.0%) | 0 (0.0%) |
| 5 to 17 Years | 0 (0.0%) | 0 (0.0%) |
| 18 to 34 Years | 0 (0.0%) | 0 (0.0%) |
| 35 to 64 Years | 135 (13.4%) | 22 (3.4%) |
| 65 to 74 Years | 18 (24.3%) | 0 (0.0%) |
| 75 Years and over | 39 (68.4%) | 23 (18.5%) |
Disability Class: Vision Difficulty
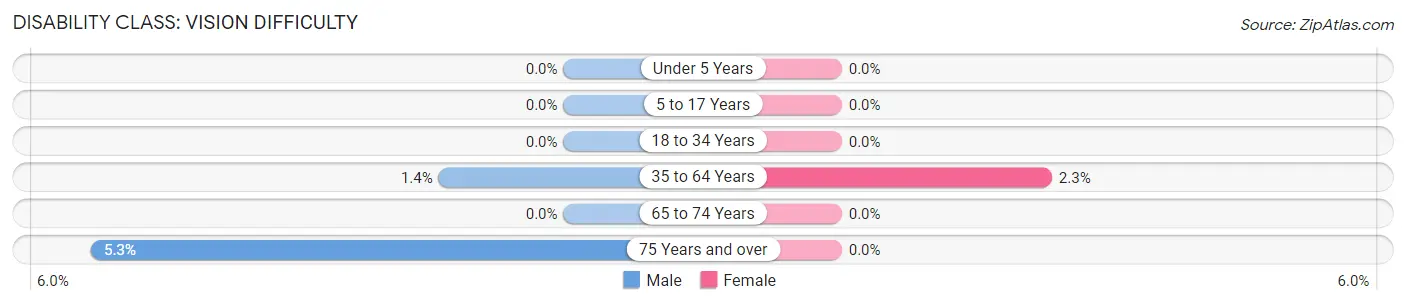
| Age Bracket | Male | Female |
| Under 5 Years | 0 (0.0%) | 0 (0.0%) |
| 5 to 17 Years | 0 (0.0%) | 0 (0.0%) |
| 18 to 34 Years | 0 (0.0%) | 0 (0.0%) |
| 35 to 64 Years | 14 (1.4%) | 15 (2.3%) |
| 65 to 74 Years | 0 (0.0%) | 0 (0.0%) |
| 75 Years and over | 3 (5.3%) | 0 (0.0%) |
Disability Class: Cognitive Difficulty
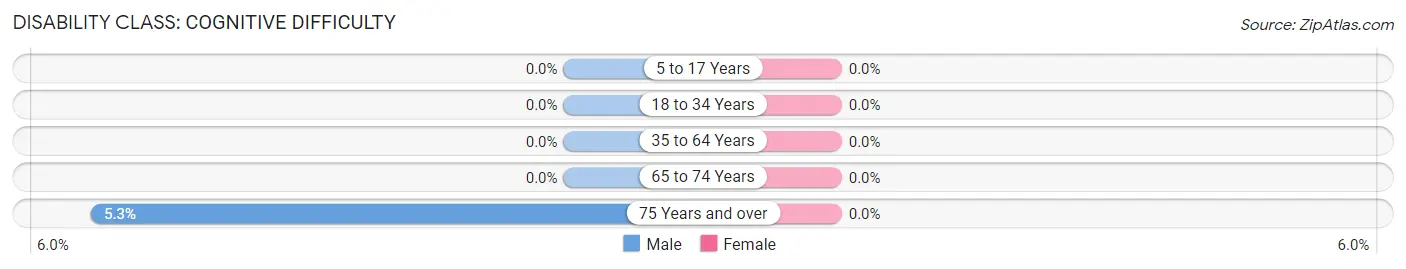
| Age Bracket | Male | Female |
| 5 to 17 Years | 0 (0.0%) | 0 (0.0%) |
| 18 to 34 Years | 0 (0.0%) | 0 (0.0%) |
| 35 to 64 Years | 0 (0.0%) | 0 (0.0%) |
| 65 to 74 Years | 0 (0.0%) | 0 (0.0%) |
| 75 Years and over | 3 (5.3%) | 0 (0.0%) |
Disability Class: Ambulatory Difficulty
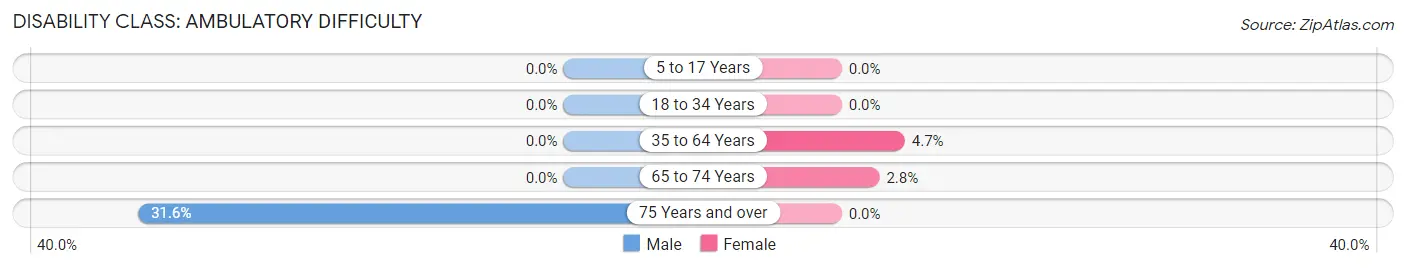
| Age Bracket | Male | Female |
| 5 to 17 Years | 0 (0.0%) | 0 (0.0%) |
| 18 to 34 Years | 0 (0.0%) | 0 (0.0%) |
| 35 to 64 Years | 0 (0.0%) | 30 (4.7%) |
| 65 to 74 Years | 0 (0.0%) | 4 (2.8%) |
| 75 Years and over | 18 (31.6%) | 0 (0.0%) |
Disability Class: Self-Care Difficulty
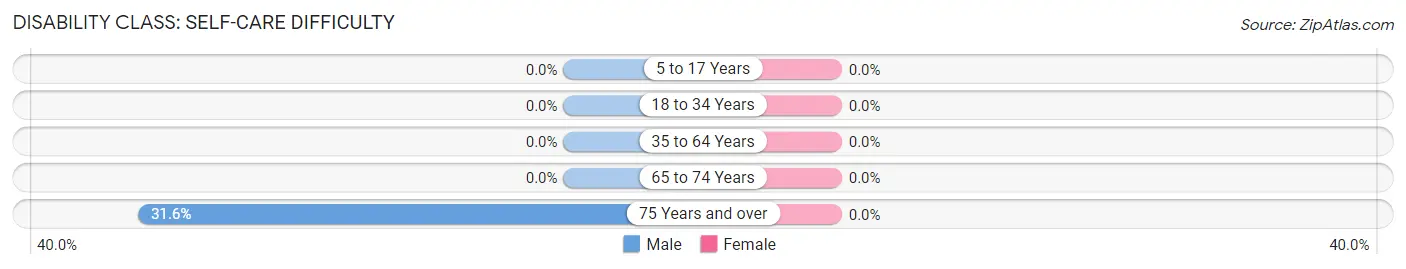
| Age Bracket | Male | Female |
| 5 to 17 Years | 0 (0.0%) | 0 (0.0%) |
| 18 to 34 Years | 0 (0.0%) | 0 (0.0%) |
| 35 to 64 Years | 0 (0.0%) | 0 (0.0%) |
| 65 to 74 Years | 0 (0.0%) | 0 (0.0%) |
| 75 Years and over | 18 (31.6%) | 0 (0.0%) |
Technology Access in Wamego
Computing Device Access in Wamego
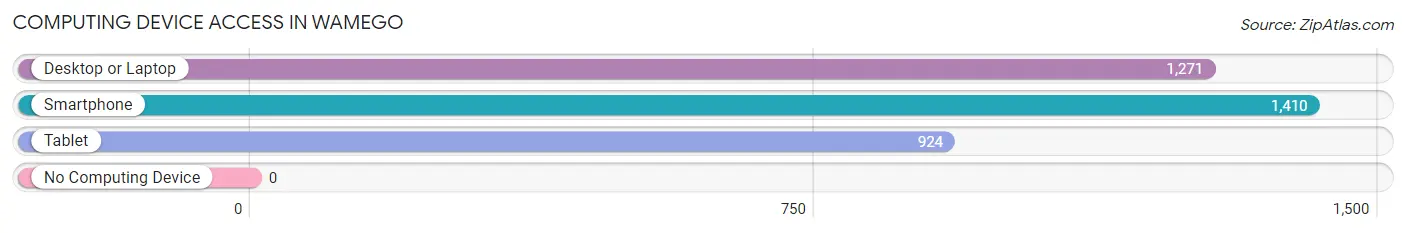
| Device Type | # Households | % Households |
| Desktop or Laptop | 1,271 | 83.3% |
| Smartphone | 1,410 | 92.5% |
| Tablet | 924 | 60.6% |
| No Computing Device | 0 | 0.0% |
| Total | 1,525 | 100.0% |
Internet Access in Wamego
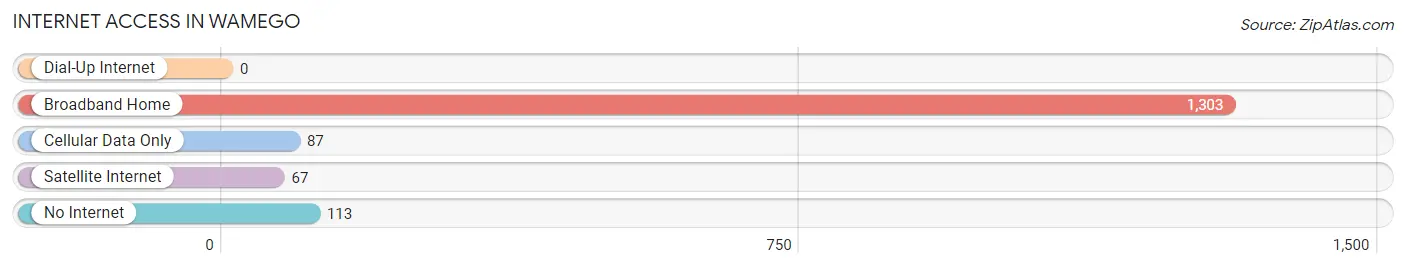
| Internet Type | # Households | % Households |
| Dial-Up Internet | 0 | 0.0% |
| Broadband Home | 1,303 | 85.4% |
| Cellular Data Only | 87 | 5.7% |
| Satellite Internet | 67 | 4.4% |
| No Internet | 113 | 7.4% |
| Total | 1,525 | 100.0% |
Wamego Summary
Wamego is a city located in Pottawatomie County, Kansas, United States. It is situated along the Kansas River in the Flint Hills region of the state. The population was 3,876 at the 2010 census.
History
Wamego was founded in 1866 by a group of settlers from the nearby town of St. Marys. The town was named after the Potawatomi Indians who lived in the area. The first post office was established in 1867.
The city was incorporated in 1872 and the first mayor was elected in 1873. The city was a major stop on the Santa Fe Trail and was home to several businesses, including a flour mill, a sawmill, and a brickyard.
In the late 19th century, Wamego was a major center for the cattle industry. The city was also home to several large farms, including the Wamego Stock Farm, which was established in 1887.
Geography
Wamego is located at 39°11'25" North, 96°17'45" West (39.1904, -96.2958). According to the United States Census Bureau, the city has a total area of 2.3 square miles (6.0 km2), all of it land.
Economy
The economy of Wamego is largely based on agriculture and manufacturing. The city is home to several large farms, including the Wamego Stock Farm, which produces beef, pork, and poultry. The city is also home to several manufacturing companies, including a plastics manufacturer, a metal fabrication company, and a printing company.
Demographics
As of the census of 2010, there were 3,876 people, 1,541 households, and 990 families residing in the city. The population density was 1,711.3 people per square mile (661.2/km2). There were 1,717 housing units at an average density of 745.3 per square mile (288.2/km2). The racial makeup of the city was 95.2% White, 0.7% African American, 0.4% Native American, 0.7% Asian, 0.1% Pacific Islander, 1.2% from other races, and 1.7% from two or more races. Hispanic or Latino of any race were 3.3% of the population.
There were 1,541 households, out of which 30.2% had children under the age of 18 living with them, 48.2% were married couples living together, 11.7% had a female householder with no husband present, and 35.7% were non-families. 30.2% of all households were made up of individuals, and 13.2% had someone living alone who was 65 years of age or older. The average household size was 2.45 and the average family size was 3.04.
In the city, the population was spread out, with 25.7% under the age of 18, 8.2% from 18 to 24, 28.2% from 25 to 44, 22.2% from 45 to 64, and 15.7% who were 65 years of age or older. The median age was 37 years. For every 100 females, there were 92.2 males. For every 100 females age 18 and over, there were 88.3 males.
The median income for a household in the city was $37,917, and the median income for a family was $45,938. Males had a median income of $31,964 versus $22,917 for females. The per capita income for the city was $18,945. About 6.2% of families and 8.7% of the population were below the poverty line, including 10.2% of those under age 18 and 8.2% of those age 65 or over.
Common Questions
What is Per Capita Income in Wamego?
Per Capita income in Wamego is $39,160.
What is the Median Family Income in Wamego?
Median Family Income in Wamego is $98,411.
What is the Median Household income in Wamego?
Median Household Income in Wamego is $88,942.
What is Income or Wage Gap in Wamego?
Income or Wage Gap in Wamego is 42.6%.
Women in Wamego earn 57.4 cents for every dollar earned by a man.
What is Inequality or Gini Index in Wamego?
Inequality or Gini Index in Wamego is 0.38.
What is the Total Population of Wamego?
Total Population of Wamego is 4,190.
What is the Total Male Population of Wamego?
Total Male Population of Wamego is 1,974.
What is the Total Female Population of Wamego?
Total Female Population of Wamego is 2,216.
What is the Ratio of Males per 100 Females in Wamego?
There are 89.08 Males per 100 Females in Wamego.
What is the Ratio of Females per 100 Males in Wamego?
There are 112.26 Females per 100 Males in Wamego.
What is the Median Population Age in Wamego?
Median Population Age in Wamego is 35.8 Years.
What is the Average Family Size in Wamego
Average Family Size in Wamego is 3.5 People.
What is the Average Household Size in Wamego
Average Household Size in Wamego is 2.7 People.
How Large is the Labor Force in Wamego?
There are 2,520 People in the Labor Forcein in Wamego.
What is the Percentage of People in the Labor Force in Wamego?
77.8% of People are in the Labor Force in Wamego.
What is the Unemployment Rate in Wamego?
Unemployment Rate in Wamego is 4.0%.