Pretty Prairie, KS Map & Demographics
Pretty Prairie Map
Pretty Prairie Overview
$30,257
PER CAPITA INCOME
$56,667
AVG FAMILY INCOME
$55,750
AVG HOUSEHOLD INCOME
23.2%
WAGE / INCOME GAP [ % ]
76.8¢/ $1
WAGE / INCOME GAP [ $ ]
0.37
INEQUALITY / GINI INDEX
638
TOTAL POPULATION
366
MALE POPULATION
272
FEMALE POPULATION
134.56
MALES / 100 FEMALES
74.32
FEMALES / 100 MALES
42.5
MEDIAN AGE
3.0
AVG FAMILY SIZE
2.3
AVG HOUSEHOLD SIZE
294
LABOR FORCE [ PEOPLE ]
57.8%
PERCENT IN LABOR FORCE
1.0%
UNEMPLOYMENT RATE
Pretty Prairie Zip Codes
Pretty Prairie Area Codes
Income in Pretty Prairie
Income Overview in Pretty Prairie
Per Capita Income in Pretty Prairie is $30,257, while median incomes of families and households are $56,667 and $55,750 respectively.
| Characteristic | Number | Measure |
| Per Capita Income | 638 | $30,257 |
| Median Family Income | 138 | $56,667 |
| Mean Family Income | 138 | $69,988 |
| Median Household Income | 250 | $55,750 |
| Mean Household Income | 250 | $66,327 |
| Income Deficit | 138 | $0 |
| Wage / Income Gap (%) | 638 | 23.23% |
| Wage / Income Gap ($) | 638 | 76.77¢ per $1 |
| Gini / Inequality Index | 638 | 0.37 |
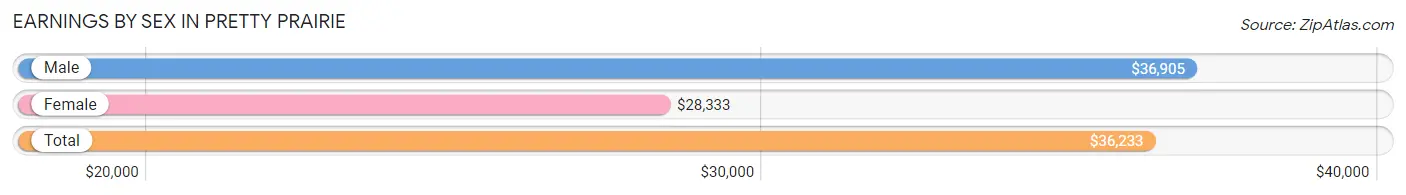
Earnings by Sex in Pretty Prairie
Average Earnings in Pretty Prairie are $36,233, $36,905 for men and $28,333 for women, a difference of 23.2%.
| Sex | Number | Average Earnings |
| Male | 218 (60.6%) | $36,905 |
| Female | 142 (39.4%) | $28,333 |
| Total | 360 (100.0%) | $36,233 |
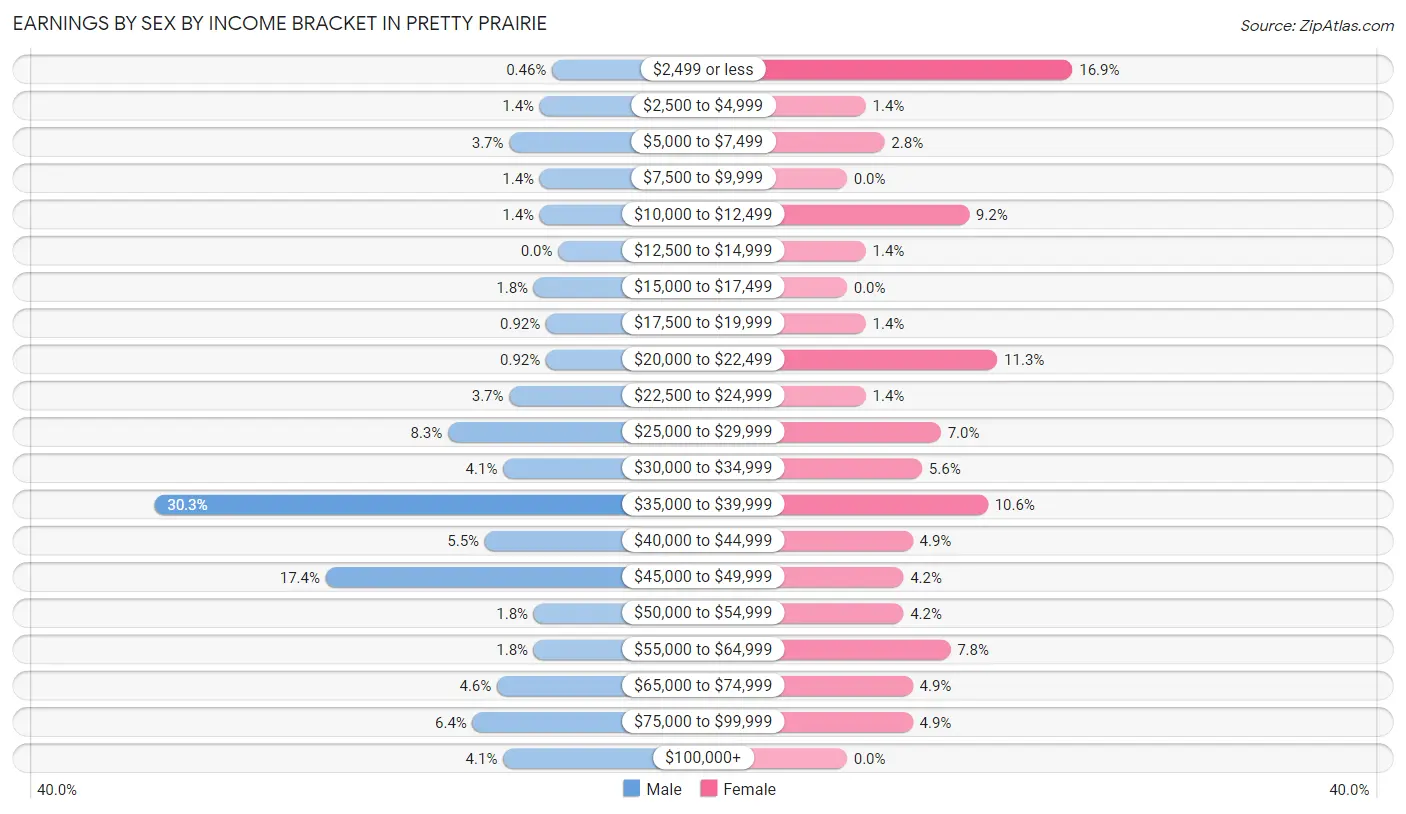
Earnings by Sex by Income Bracket in Pretty Prairie
The most common earnings brackets in Pretty Prairie are $35,000 to $39,999 for men (66 | 30.3%) and $2,499 or less for women (24 | 16.9%).
| Income | Male | Female |
| $2,499 or less | 1 (0.5%) | 24 (16.9%) |
| $2,500 to $4,999 | 3 (1.4%) | 2 (1.4%) |
| $5,000 to $7,499 | 8 (3.7%) | 4 (2.8%) |
| $7,500 to $9,999 | 3 (1.4%) | 0 (0.0%) |
| $10,000 to $12,499 | 3 (1.4%) | 13 (9.1%) |
| $12,500 to $14,999 | 0 (0.0%) | 2 (1.4%) |
| $15,000 to $17,499 | 4 (1.8%) | 0 (0.0%) |
| $17,500 to $19,999 | 2 (0.9%) | 2 (1.4%) |
| $20,000 to $22,499 | 2 (0.9%) | 16 (11.3%) |
| $22,500 to $24,999 | 8 (3.7%) | 2 (1.4%) |
| $25,000 to $29,999 | 18 (8.3%) | 10 (7.0%) |
| $30,000 to $34,999 | 9 (4.1%) | 8 (5.6%) |
| $35,000 to $39,999 | 66 (30.3%) | 15 (10.6%) |
| $40,000 to $44,999 | 12 (5.5%) | 7 (4.9%) |
| $45,000 to $49,999 | 38 (17.4%) | 6 (4.2%) |
| $50,000 to $54,999 | 4 (1.8%) | 6 (4.2%) |
| $55,000 to $64,999 | 4 (1.8%) | 11 (7.7%) |
| $65,000 to $74,999 | 10 (4.6%) | 7 (4.9%) |
| $75,000 to $99,999 | 14 (6.4%) | 7 (4.9%) |
| $100,000+ | 9 (4.1%) | 0 (0.0%) |
| Total | 218 (100.0%) | 142 (100.0%) |
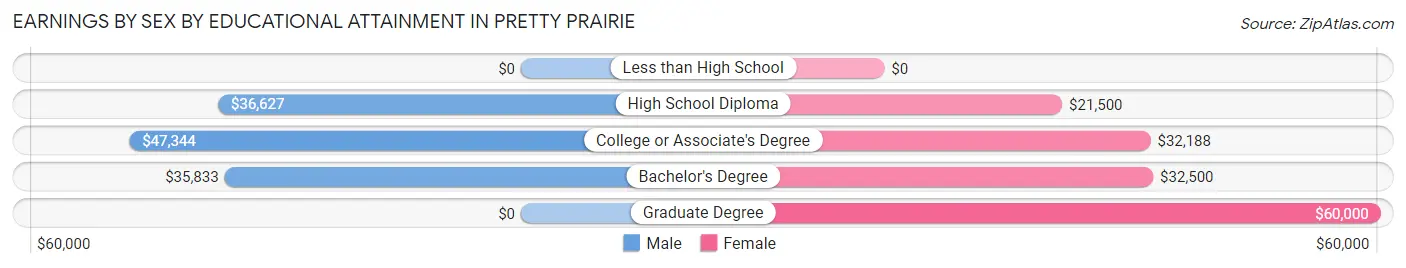
Earnings by Sex by Educational Attainment in Pretty Prairie
Average earnings in Pretty Prairie are $36,984 for men and $30,625 for women, a difference of 17.2%. Men with an educational attainment of college or associate's degree enjoy the highest average annual earnings of $47,344, while those with bachelor's degree education earn the least with $35,833. Women with an educational attainment of graduate degree earn the most with the average annual earnings of $60,000, while those with high school diploma education have the smallest earnings of $21,500.
| Educational Attainment | Male Income | Female Income |
| Less than High School | - | - |
| High School Diploma | $36,627 | $21,500 |
| College or Associate's Degree | $47,344 | $32,188 |
| Bachelor's Degree | $35,833 | $32,500 |
| Graduate Degree | - | - |
| Total | $36,984 | $30,625 |
Family Income in Pretty Prairie
Family Income Brackets in Pretty Prairie
According to the Pretty Prairie family income data, there are 28 families falling into the $75,000 to $99,999 income range, which is the most common income bracket and makes up 20.3% of all families.
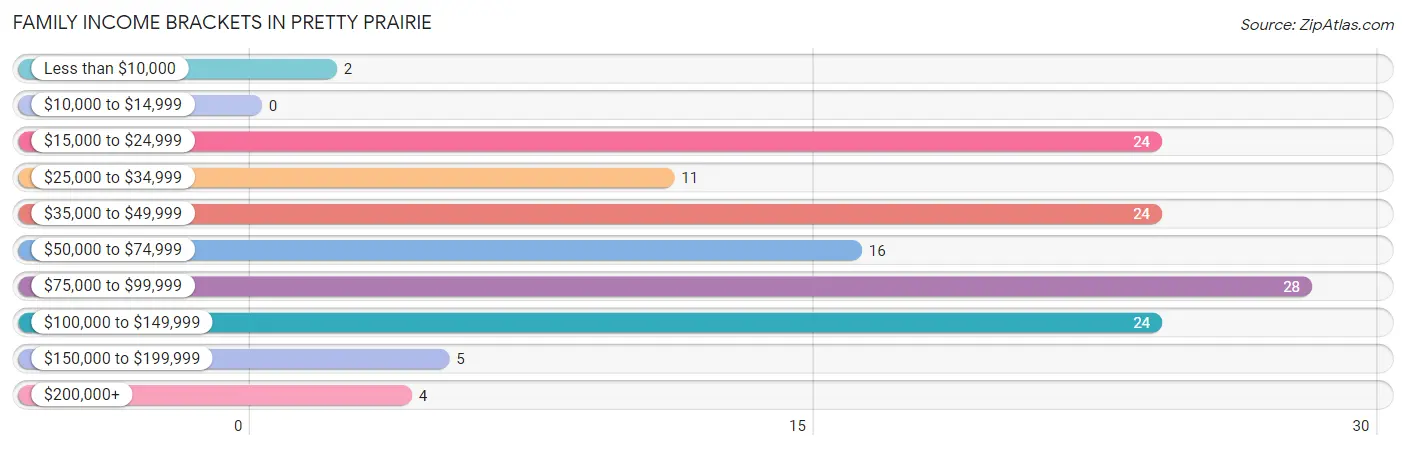
| Income Bracket | # Families | % Families |
| Less than $10,000 | 2 | 1.4% |
| $10,000 to $14,999 | 0 | 0.0% |
| $15,000 to $24,999 | 24 | 17.4% |
| $25,000 to $34,999 | 11 | 8.0% |
| $35,000 to $49,999 | 24 | 17.4% |
| $50,000 to $74,999 | 16 | 11.6% |
| $75,000 to $99,999 | 28 | 20.3% |
| $100,000 to $149,999 | 24 | 17.4% |
| $150,000 to $199,999 | 5 | 3.6% |
| $200,000+ | 4 | 2.9% |
Family Income by Famaliy Size in Pretty Prairie
3-person families (22 | 15.9%) account for the highest median family income in Pretty Prairie with $93,333 per family, while 3-person families (22 | 15.9%) have the highest median income of $31,111 per family member.
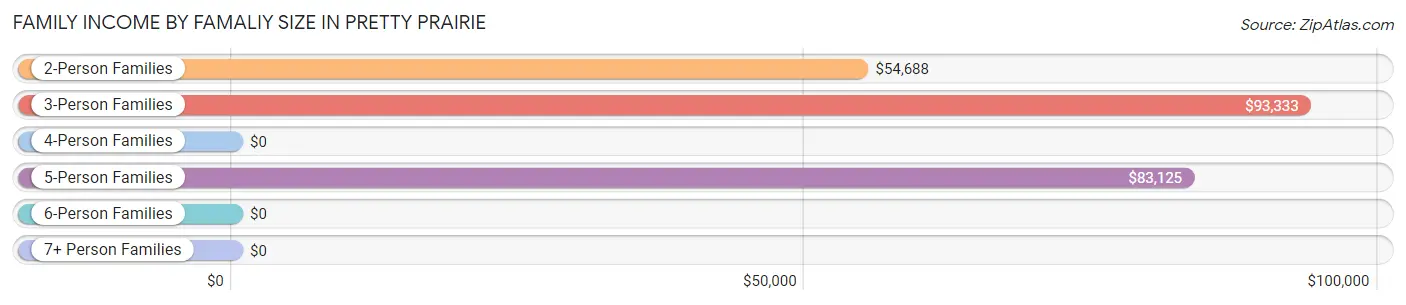
| Income Bracket | # Families | Median Income |
| 2-Person Families | 83 (60.1%) | $54,688 |
| 3-Person Families | 22 (15.9%) | $93,333 |
| 4-Person Families | 25 (18.1%) | $0 |
| 5-Person Families | 5 (3.6%) | $83,125 |
| 6-Person Families | 3 (2.2%) | $0 |
| 7+ Person Families | 0 (0.0%) | $0 |
| Total | 138 (100.0%) | $56,667 |
Family Income by Number of Earners in Pretty Prairie
The median family income in Pretty Prairie is $56,667, with families comprising 3+ earners (10) having the highest median family income of $98,333, while families with no earners (10) have the lowest median family income of $26,667, accounting for 7.2% and 7.2% of families, respectively.
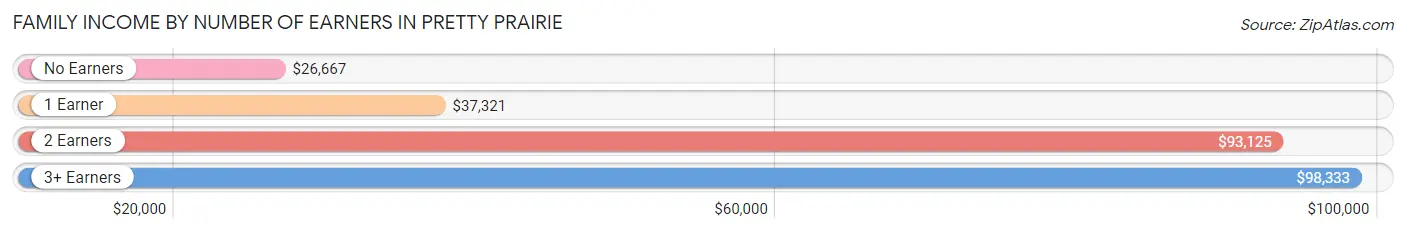
| Number of Earners | # Families | Median Income |
| No Earners | 10 (7.2%) | $26,667 |
| 1 Earner | 67 (48.5%) | $37,321 |
| 2 Earners | 51 (37.0%) | $93,125 |
| 3+ Earners | 10 (7.2%) | $98,333 |
| Total | 138 (100.0%) | $56,667 |
Household Income in Pretty Prairie
Household Income Brackets in Pretty Prairie
With 62 households falling in the category, the $75,000 to $99,999 income range is the most frequent in Pretty Prairie, accounting for 24.8% of all households. In contrast, only 5 households (2.0%) fall into the $150,000 to $199,999 income bracket, making it the least populous group.
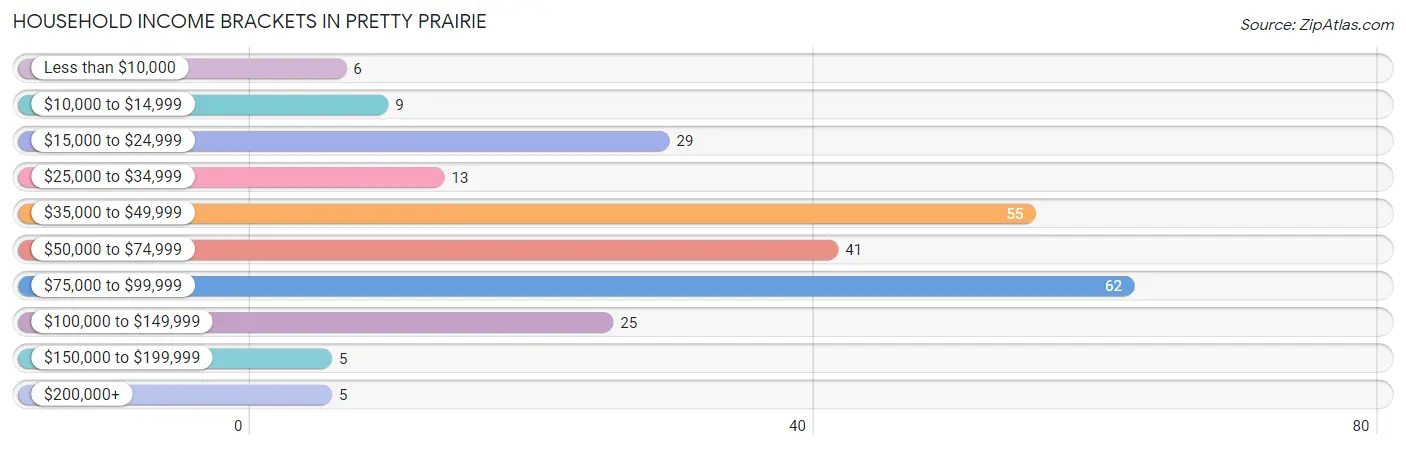
| Income Bracket | # Households | % Households |
| Less than $10,000 | 6 | 2.4% |
| $10,000 to $14,999 | 9 | 3.6% |
| $15,000 to $24,999 | 29 | 11.6% |
| $25,000 to $34,999 | 13 | 5.2% |
| $35,000 to $49,999 | 55 | 22.0% |
| $50,000 to $74,999 | 41 | 16.4% |
| $75,000 to $99,999 | 62 | 24.8% |
| $100,000 to $149,999 | 25 | 10.0% |
| $150,000 to $199,999 | 5 | 2.0% |
| $200,000+ | 5 | 2.0% |
Household Income by Householder Age in Pretty Prairie
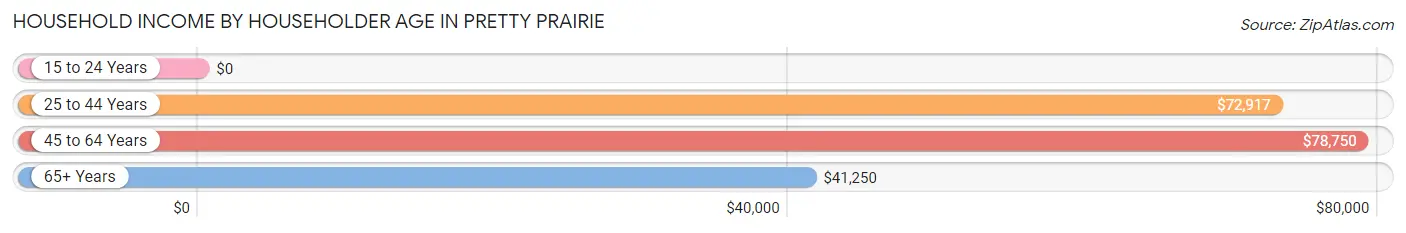
The median household income in Pretty Prairie is $55,750, with the highest median household income of $78,750 found in the 45 to 64 years age bracket for the primary householder. A total of 80 households (32.0%) fall into this category. Meanwhile, the 15 to 24 years age bracket for the primary householder has the lowest median household income of $0, with 1 households (0.4%) in this group.
| Income Bracket | # Households | Median Income |
| 15 to 24 Years | 1 (0.4%) | $0 |
| 25 to 44 Years | 93 (37.2%) | $72,917 |
| 45 to 64 Years | 80 (32.0%) | $78,750 |
| 65+ Years | 76 (30.4%) | $41,250 |
| Total | 250 (100.0%) | $55,750 |
Poverty in Pretty Prairie
Income Below Poverty by Sex and Age in Pretty Prairie
With 10.7% poverty level for males and 12.4% for females among the residents of Pretty Prairie, under 5 year old males and 5 year old females are the most vulnerable to poverty, with 6 males (42.9%) and 3 females (100.0%) in their respective age groups living below the poverty level.
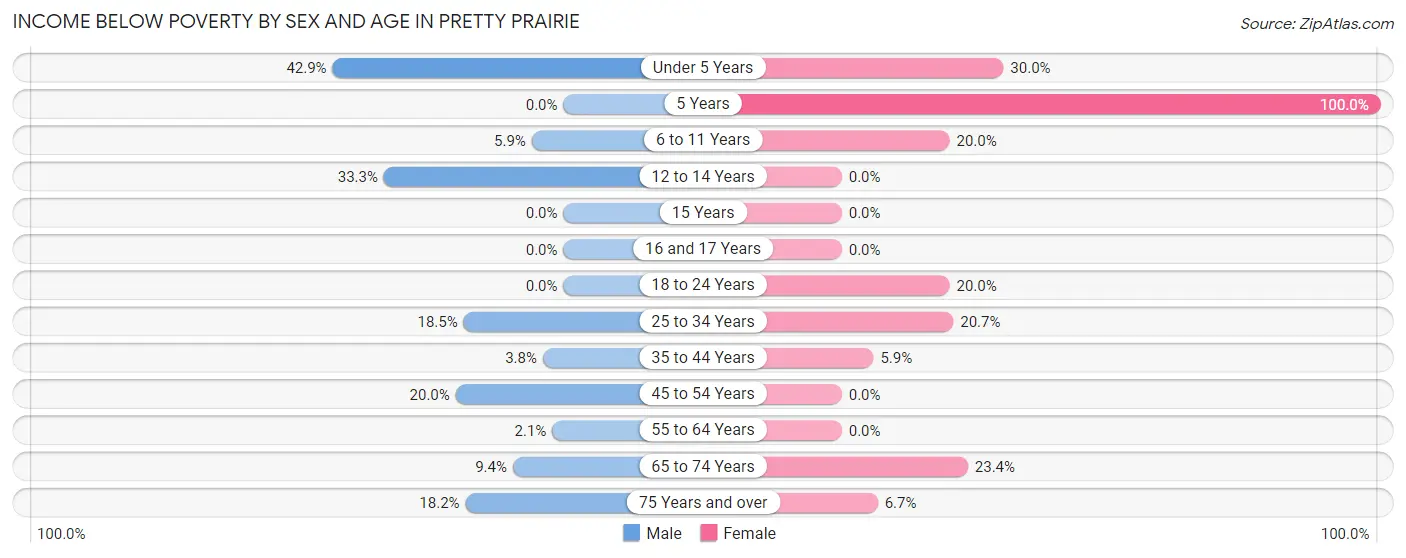
| Age Bracket | Male | Female |
| Under 5 Years | 6 (42.9%) | 3 (30.0%) |
| 5 Years | 0 (0.0%) | 3 (100.0%) |
| 6 to 11 Years | 2 (5.9%) | 4 (20.0%) |
| 12 to 14 Years | 3 (33.3%) | 0 (0.0%) |
| 15 Years | 0 (0.0%) | 0 (0.0%) |
| 16 and 17 Years | 0 (0.0%) | 0 (0.0%) |
| 18 to 24 Years | 0 (0.0%) | 2 (20.0%) |
| 25 to 34 Years | 5 (18.5%) | 6 (20.7%) |
| 35 to 44 Years | 4 (3.8%) | 2 (5.9%) |
| 45 to 54 Years | 10 (20.0%) | 0 (0.0%) |
| 55 to 64 Years | 1 (2.1%) | 0 (0.0%) |
| 65 to 74 Years | 3 (9.4%) | 11 (23.4%) |
| 75 Years and over | 4 (18.2%) | 1 (6.7%) |
| Total | 38 (10.7%) | 32 (12.4%) |
Income Above Poverty by Sex and Age in Pretty Prairie
According to the poverty statistics in Pretty Prairie, males aged 5 years and females aged 12 to 14 years are the age groups that are most secure financially, with 100.0% of males and 100.0% of females in these age groups living above the poverty line.
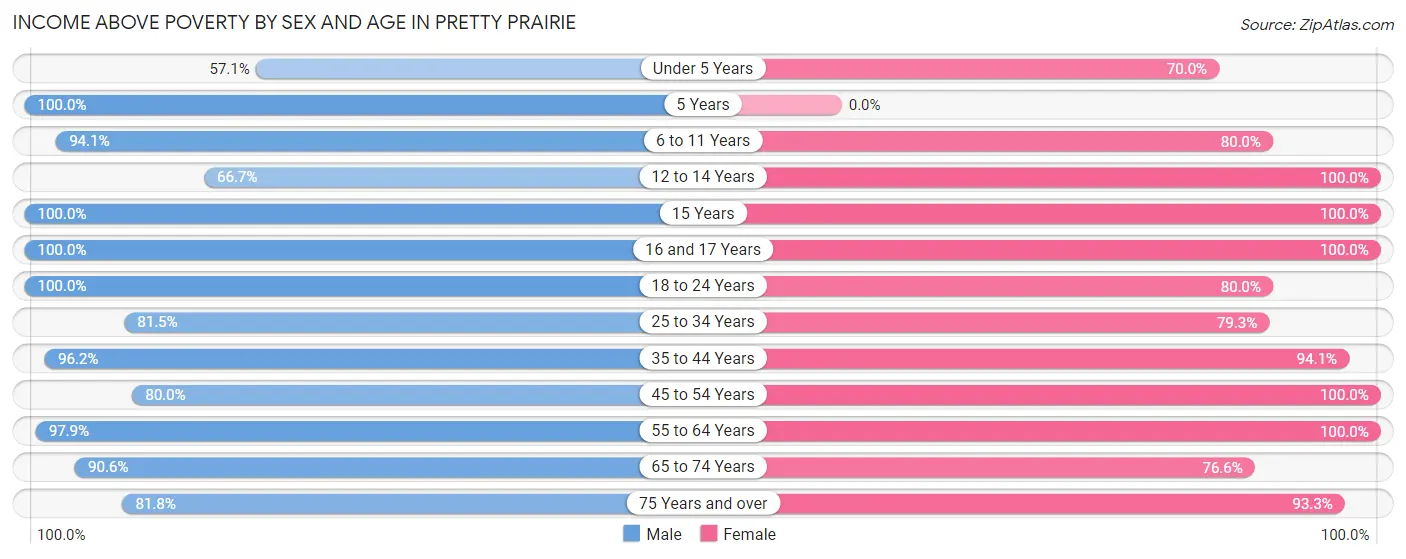
| Age Bracket | Male | Female |
| Under 5 Years | 8 (57.1%) | 7 (70.0%) |
| 5 Years | 3 (100.0%) | 0 (0.0%) |
| 6 to 11 Years | 32 (94.1%) | 16 (80.0%) |
| 12 to 14 Years | 6 (66.7%) | 22 (100.0%) |
| 15 Years | 6 (100.0%) | 3 (100.0%) |
| 16 and 17 Years | 1 (100.0%) | 3 (100.0%) |
| 18 to 24 Years | 3 (100.0%) | 8 (80.0%) |
| 25 to 34 Years | 22 (81.5%) | 23 (79.3%) |
| 35 to 44 Years | 101 (96.2%) | 32 (94.1%) |
| 45 to 54 Years | 40 (80.0%) | 35 (100.0%) |
| 55 to 64 Years | 47 (97.9%) | 27 (100.0%) |
| 65 to 74 Years | 29 (90.6%) | 36 (76.6%) |
| 75 Years and over | 18 (81.8%) | 14 (93.3%) |
| Total | 316 (89.3%) | 226 (87.6%) |
Income Below Poverty Among Married-Couple Families in Pretty Prairie
The poverty statistics for married-couple families in Pretty Prairie show that 15.9% or 17 of the total 107 families live below the poverty line. Families with 1 or 2 children have the highest poverty rate of 17.6%, comprising of 6 families. On the other hand, families with 3 or 4 children have the lowest poverty rate of 0.0%, which includes 0 families.
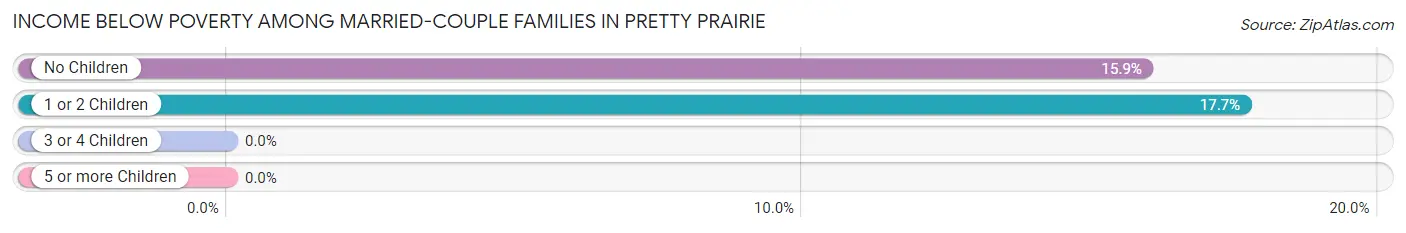
| Children | Above Poverty | Below Poverty |
| No Children | 58 (84.1%) | 11 (15.9%) |
| 1 or 2 Children | 28 (82.4%) | 6 (17.6%) |
| 3 or 4 Children | 4 (100.0%) | 0 (0.0%) |
| 5 or more Children | 0 (0.0%) | 0 (0.0%) |
| Total | 90 (84.1%) | 17 (15.9%) |
Income Below Poverty Among Single-Parent Households in Pretty Prairie
According to the poverty data in Pretty Prairie, 12.5% or 2 single-father households and 13.3% or 2 single-mother households are living below the poverty line. Among single-father households, those with 3 or 4 children have the highest poverty rate, with 2 households (100.0%) experiencing poverty. Likewise, among single-mother households, those with 1 or 2 children have the highest poverty rate, with 2 households (40.0%) falling below the poverty line.
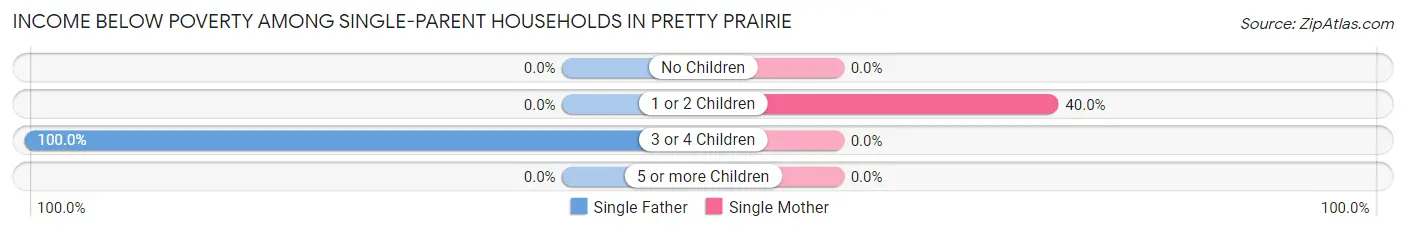
| Children | Single Father | Single Mother |
| No Children | 0 (0.0%) | 0 (0.0%) |
| 1 or 2 Children | 0 (0.0%) | 2 (40.0%) |
| 3 or 4 Children | 2 (100.0%) | 0 (0.0%) |
| 5 or more Children | 0 (0.0%) | 0 (0.0%) |
| Total | 2 (12.5%) | 2 (13.3%) |
Income Below Poverty Among Married-Couple vs Single-Parent Households in Pretty Prairie
The poverty data for Pretty Prairie shows that 17 of the married-couple family households (15.9%) and 4 of the single-parent households (12.9%) are living below the poverty level. Within the married-couple family households, those with 1 or 2 children have the highest poverty rate, with 6 households (17.6%) falling below the poverty line. Among the single-parent households, those with 3 or 4 children have the highest poverty rate, with 2 household (40.0%) living below poverty.
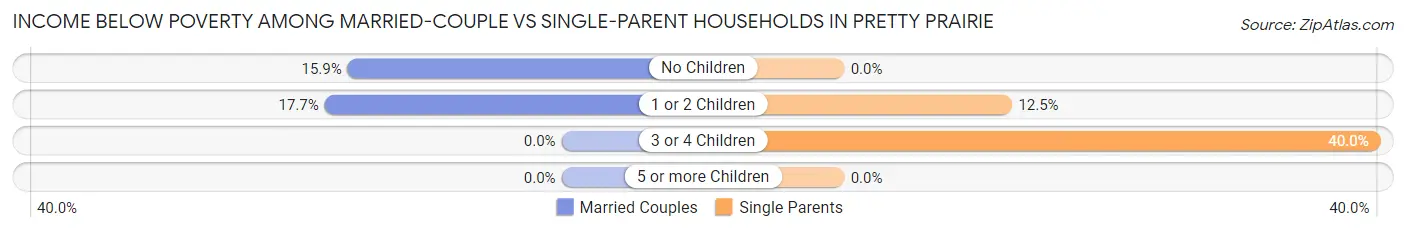
| Children | Married-Couple Families | Single-Parent Households |
| No Children | 11 (15.9%) | 0 (0.0%) |
| 1 or 2 Children | 6 (17.6%) | 2 (12.5%) |
| 3 or 4 Children | 0 (0.0%) | 2 (40.0%) |
| 5 or more Children | 0 (0.0%) | 0 (0.0%) |
| Total | 17 (15.9%) | 4 (12.9%) |
Race in Pretty Prairie
The most populous races in Pretty Prairie are White / Caucasian (629 | 98.6%), Hispanic or Latino (15 | 2.4%), and Two or more Races (5 | 0.8%).
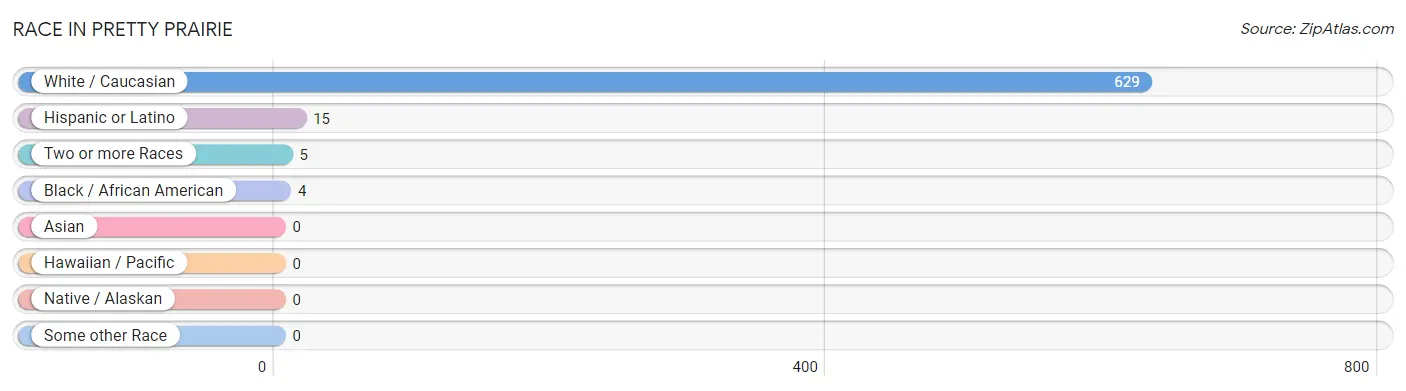
| Race | # Population | % Population |
| Asian | 0 | 0.0% |
| Black / African American | 4 | 0.6% |
| Hawaiian / Pacific | 0 | 0.0% |
| Hispanic or Latino | 15 | 2.4% |
| Native / Alaskan | 0 | 0.0% |
| White / Caucasian | 629 | 98.6% |
| Two or more Races | 5 | 0.8% |
| Some other Race | 0 | 0.0% |
| Total | 638 | 100.0% |
Ancestry in Pretty Prairie
The most populous ancestries reported in Pretty Prairie are German (177 | 27.7%), Irish (94 | 14.7%), English (47 | 7.4%), American (34 | 5.3%), and Dutch (15 | 2.4%), together accounting for 57.5% of all Pretty Prairie residents.
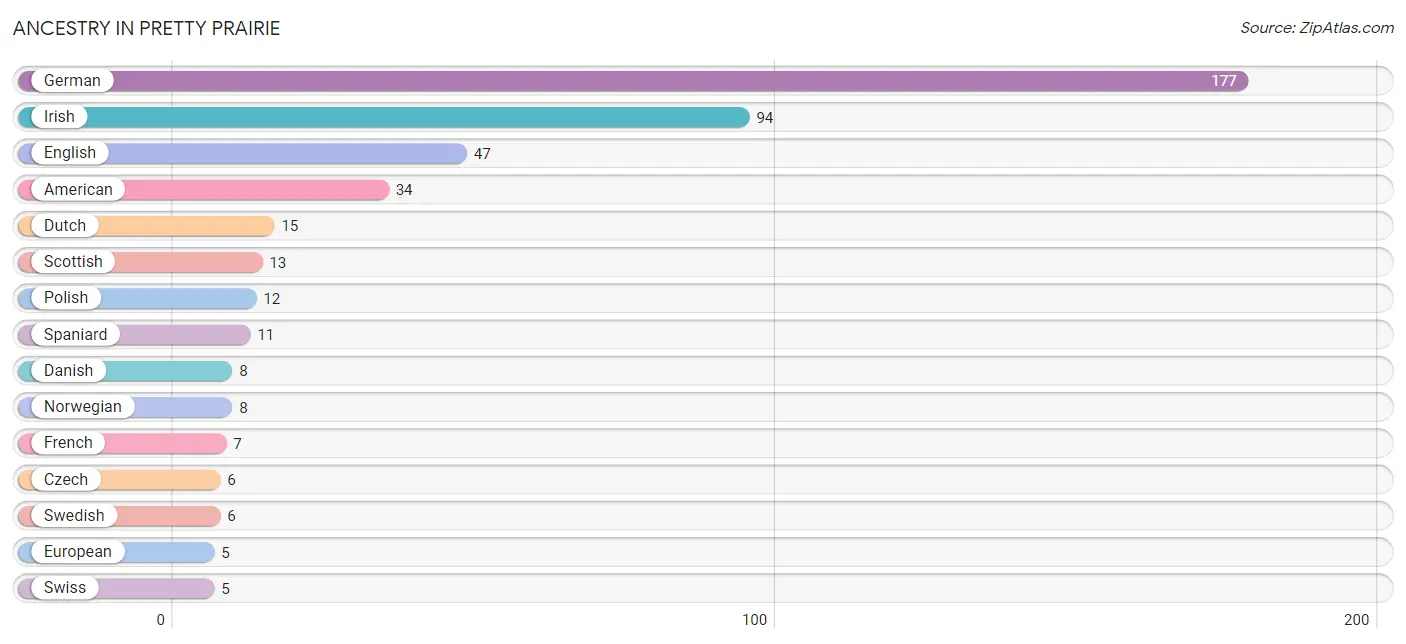
| Ancestry | # Population | % Population |
| American | 34 | 5.3% |
| Bulgarian | 4 | 0.6% |
| Cherokee | 3 | 0.5% |
| Czech | 6 | 0.9% |
| Danish | 8 | 1.3% |
| Dutch | 15 | 2.4% |
| English | 47 | 7.4% |
| European | 5 | 0.8% |
| French | 7 | 1.1% |
| French Canadian | 4 | 0.6% |
| German | 177 | 27.7% |
| Irish | 94 | 14.7% |
| Italian | 1 | 0.2% |
| Mexican | 4 | 0.6% |
| Navajo | 2 | 0.3% |
| Norwegian | 8 | 1.3% |
| Pennsylvania German | 4 | 0.6% |
| Polish | 12 | 1.9% |
| Russian | 4 | 0.6% |
| Scotch-Irish | 2 | 0.3% |
| Scottish | 13 | 2.0% |
| Spaniard | 11 | 1.7% |
| Swedish | 6 | 0.9% |
| Swiss | 5 | 0.8% | View All 24 Rows |
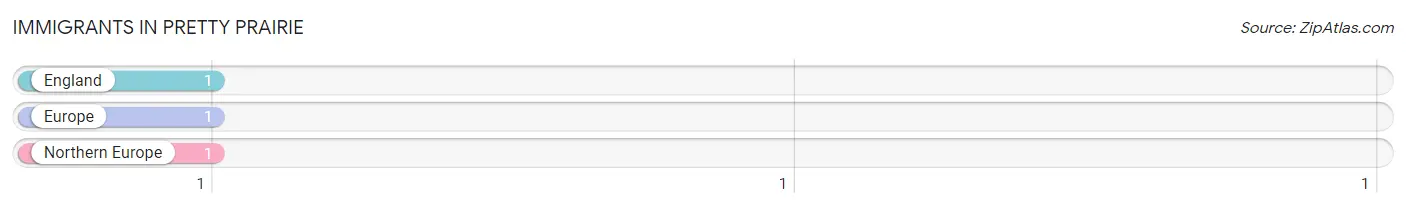
Immigrants in Pretty Prairie
The most numerous immigrant groups reported in Pretty Prairie came from England (1 | 0.2%), Europe (1 | 0.2%), and Northern Europe (1 | 0.2%), together accounting for 0.5% of all Pretty Prairie residents.
| Immigration Origin | # Population | % Population |
| England | 1 | 0.2% |
| Europe | 1 | 0.2% |
| Northern Europe | 1 | 0.2% | View All 3 Rows |
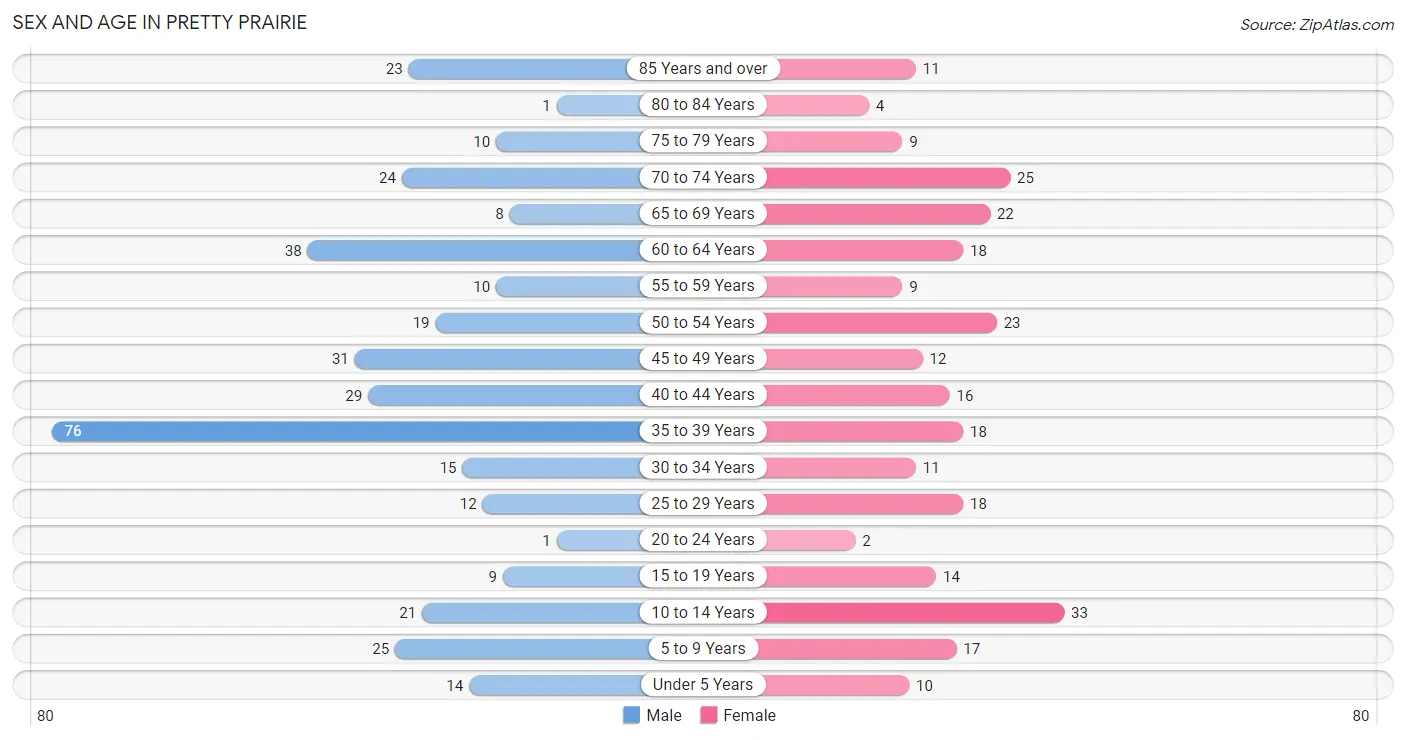
Sex and Age in Pretty Prairie
Sex and Age in Pretty Prairie
The most populous age groups in Pretty Prairie are 35 to 39 Years (76 | 20.8%) for men and 10 to 14 Years (33 | 12.1%) for women.
| Age Bracket | Male | Female |
| Under 5 Years | 14 (3.8%) | 10 (3.7%) |
| 5 to 9 Years | 25 (6.8%) | 17 (6.2%) |
| 10 to 14 Years | 21 (5.7%) | 33 (12.1%) |
| 15 to 19 Years | 9 (2.5%) | 14 (5.1%) |
| 20 to 24 Years | 1 (0.3%) | 2 (0.7%) |
| 25 to 29 Years | 12 (3.3%) | 18 (6.6%) |
| 30 to 34 Years | 15 (4.1%) | 11 (4.0%) |
| 35 to 39 Years | 76 (20.8%) | 18 (6.6%) |
| 40 to 44 Years | 29 (7.9%) | 16 (5.9%) |
| 45 to 49 Years | 31 (8.5%) | 12 (4.4%) |
| 50 to 54 Years | 19 (5.2%) | 23 (8.5%) |
| 55 to 59 Years | 10 (2.7%) | 9 (3.3%) |
| 60 to 64 Years | 38 (10.4%) | 18 (6.6%) |
| 65 to 69 Years | 8 (2.2%) | 22 (8.1%) |
| 70 to 74 Years | 24 (6.6%) | 25 (9.2%) |
| 75 to 79 Years | 10 (2.7%) | 9 (3.3%) |
| 80 to 84 Years | 1 (0.3%) | 4 (1.5%) |
| 85 Years and over | 23 (6.3%) | 11 (4.0%) |
| Total | 366 (100.0%) | 272 (100.0%) |
Families and Households in Pretty Prairie
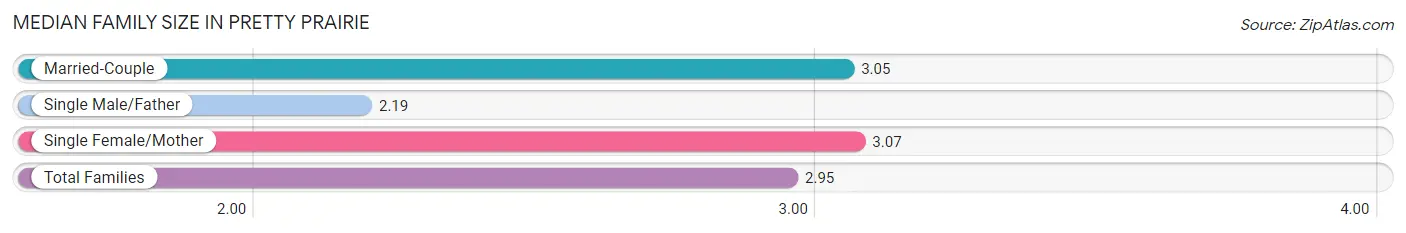
Median Family Size in Pretty Prairie
The median family size in Pretty Prairie is 2.95 persons per family, with single female/mother families (15 | 10.9%) accounting for the largest median family size of 3.07 persons per family. On the other hand, single male/father families (16 | 11.6%) represent the smallest median family size with 2.19 persons per family.
| Family Type | # Families | Family Size |
| Married-Couple | 107 (77.5%) | 3.05 |
| Single Male/Father | 16 (11.6%) | 2.19 |
| Single Female/Mother | 15 (10.9%) | 3.07 |
| Total Families | 138 (100.0%) | 2.95 |
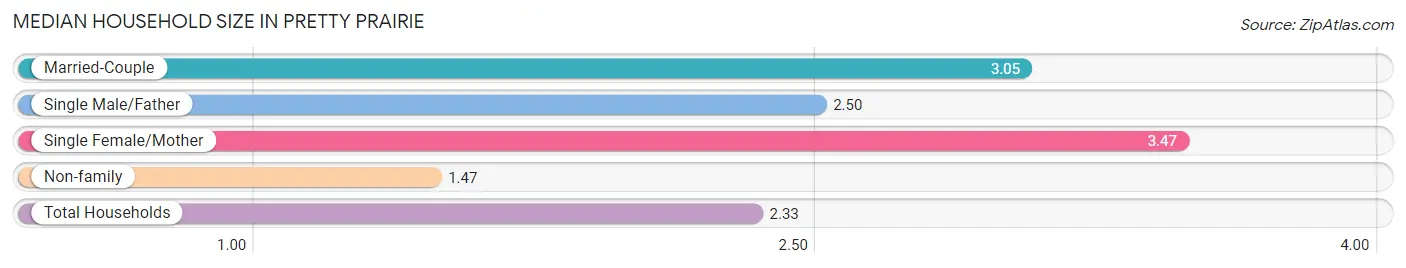
Median Household Size in Pretty Prairie
The median household size in Pretty Prairie is 2.33 persons per household, with single female/mother households (15 | 6.0%) accounting for the largest median household size of 3.47 persons per household. non-family households (112 | 44.8%) represent the smallest median household size with 1.47 persons per household.
| Household Type | # Households | Household Size |
| Married-Couple | 107 (42.8%) | 3.05 |
| Single Male/Father | 16 (6.4%) | 2.50 |
| Single Female/Mother | 15 (6.0%) | 3.47 |
| Non-family | 112 (44.8%) | 1.47 |
| Total Households | 250 (100.0%) | 2.33 |
Household Size by Marriage Status in Pretty Prairie
Out of a total of 250 households in Pretty Prairie, 138 (55.2%) are family households, while 112 (44.8%) are nonfamily households. The most numerous type of family households are 2-person households, comprising 81, and the most common type of nonfamily households are 1-person households, comprising 83.
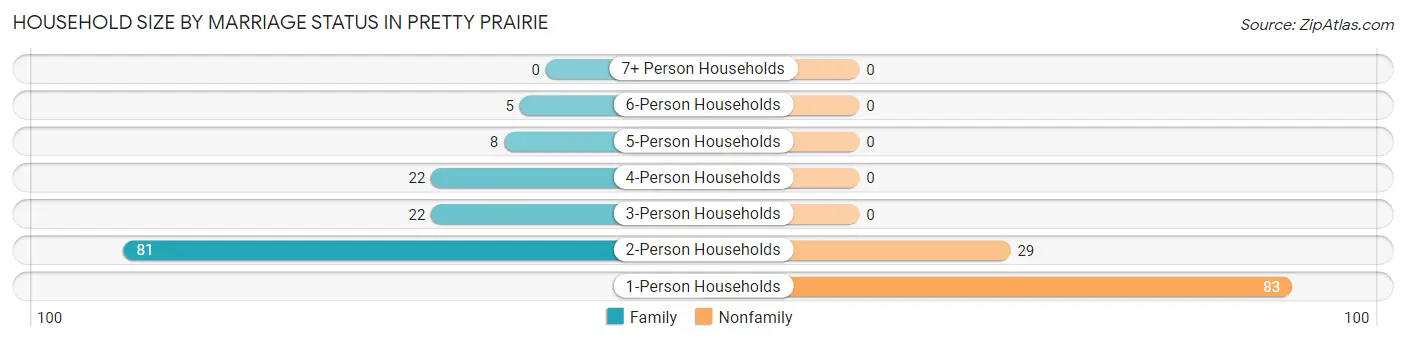
| Household Size | Family Households | Nonfamily Households |
| 1-Person Households | - | 83 (33.2%) |
| 2-Person Households | 81 (32.4%) | 29 (11.6%) |
| 3-Person Households | 22 (8.8%) | 0 (0.0%) |
| 4-Person Households | 22 (8.8%) | 0 (0.0%) |
| 5-Person Households | 8 (3.2%) | 0 (0.0%) |
| 6-Person Households | 5 (2.0%) | 0 (0.0%) |
| 7+ Person Households | 0 (0.0%) | 0 (0.0%) |
| Total | 138 (55.2%) | 112 (44.8%) |
Female Fertility in Pretty Prairie
Fertility by Age in Pretty Prairie
Average fertility rate in Pretty Prairie is 21.0 births per 1,000 women. Women in the age bracket of 15 to 19 years have the highest fertility rate with 143.0 births per 1,000 women. Women in the age bracket of 15 to 19 years acount for 100.0% of all women with births.
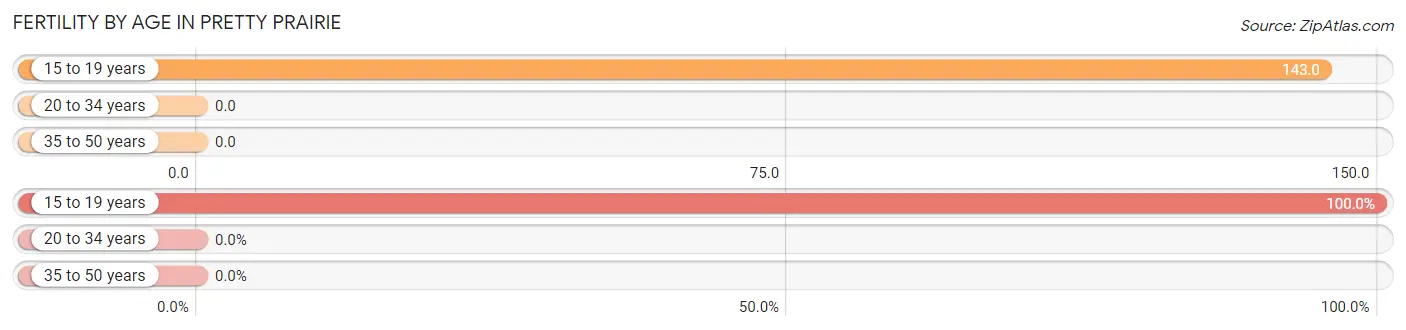
| Age Bracket | Women with Births | Births / 1,000 Women |
| 15 to 19 years | 2 (100.0%) | 143.0 |
| 20 to 34 years | 0 (0.0%) | 0.0 |
| 35 to 50 years | 0 (0.0%) | 0.0 |
| Total | 2 (100.0%) | 21.0 |
Fertility by Age by Marriage Status in Pretty Prairie
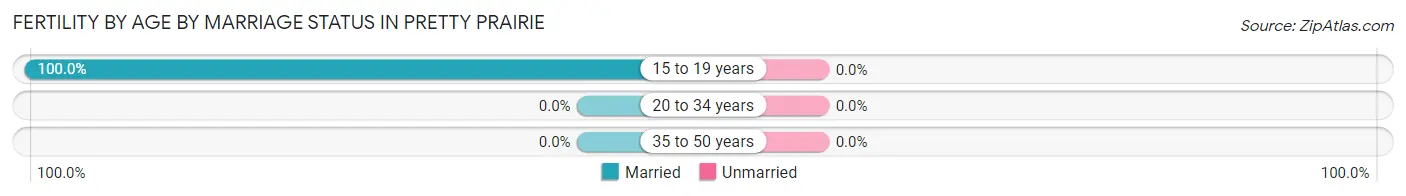
| Age Bracket | Married | Unmarried |
| 15 to 19 years | 2 (100.0%) | 0 (0.0%) |
| 20 to 34 years | 0 (0.0%) | 0 (0.0%) |
| 35 to 50 years | 0 (0.0%) | 0 (0.0%) |
| Total | 2 (100.0%) | 0 (0.0%) |
Fertility by Education in Pretty Prairie
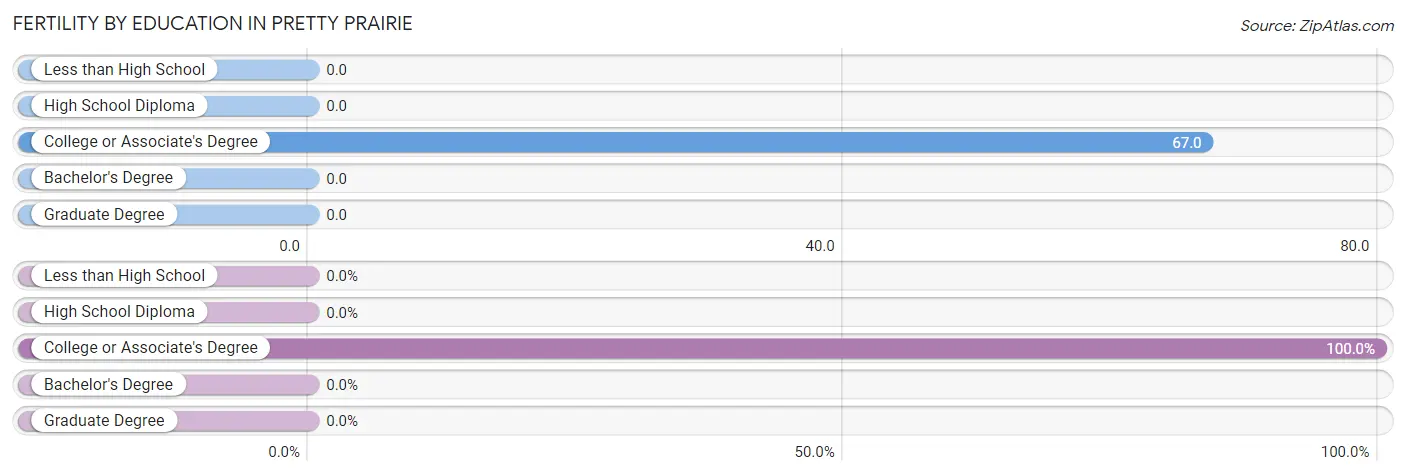
| Educational Attainment | Women with Births | Births / 1,000 Women |
| Less than High School | 0 (0.0%) | 0.0 |
| High School Diploma | 0 (0.0%) | 0.0 |
| College or Associate's Degree | 2 (100.0%) | 67.0 |
| Bachelor's Degree | 0 (0.0%) | 0.0 |
| Graduate Degree | 0 (0.0%) | 0.0 |
| Total | 2 (100.0%) | 21.0 |
Fertility by Education by Marriage Status in Pretty Prairie
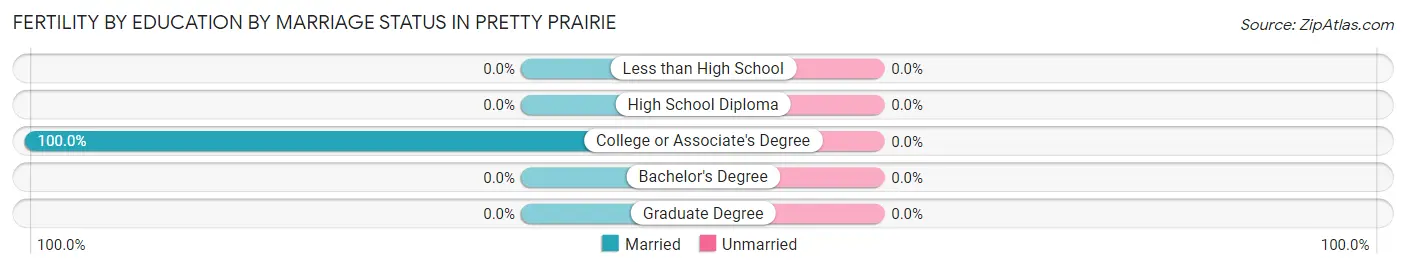
| Educational Attainment | Married | Unmarried |
| Less than High School | 0 (0.0%) | 0 (0.0%) |
| High School Diploma | 0 (0.0%) | 0 (0.0%) |
| College or Associate's Degree | 2 (100.0%) | 0 (0.0%) |
| Bachelor's Degree | 0 (0.0%) | 0 (0.0%) |
| Graduate Degree | 0 (0.0%) | 0 (0.0%) |
| Total | 2 (100.0%) | 0 (0.0%) |
Employment Characteristics in Pretty Prairie
Employment by Class of Employer in Pretty Prairie
Among the 282 employed individuals in Pretty Prairie, private company employees (144 | 51.1%), not-for-profit organizations (49 | 17.4%), and self-employed (not incorporated) (31 | 11.0%) make up the most common classes of employment.
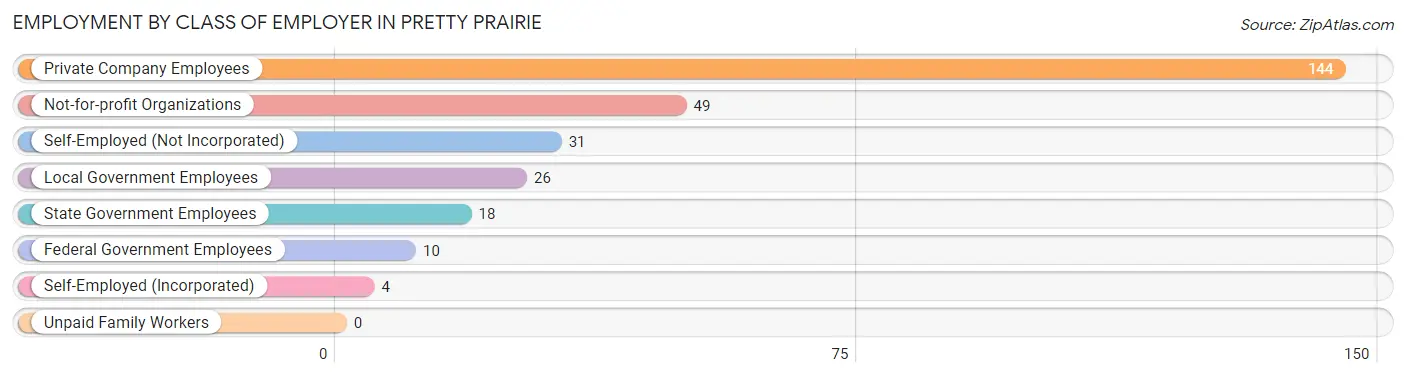
| Employer Class | # Employees | % Employees |
| Private Company Employees | 144 | 51.1% |
| Self-Employed (Incorporated) | 4 | 1.4% |
| Self-Employed (Not Incorporated) | 31 | 11.0% |
| Not-for-profit Organizations | 49 | 17.4% |
| Local Government Employees | 26 | 9.2% |
| State Government Employees | 18 | 6.4% |
| Federal Government Employees | 10 | 3.5% |
| Unpaid Family Workers | 0 | 0.0% |
| Total | 282 | 100.0% |
Employment Status by Age in Pretty Prairie
According to the labor force statistics for Pretty Prairie, out of the total population over 16 years of age (509), 57.8% or 294 individuals are in the labor force, with 1.0% or 3 of them unemployed. The age group with the highest labor force participation rate is 20 to 24 years, with 100.0% or 3 individuals in the labor force. Within the labor force, the 16 to 19 years age range has the highest percentage of unemployed individuals, with 15.4% or 2 of them being unemployed.
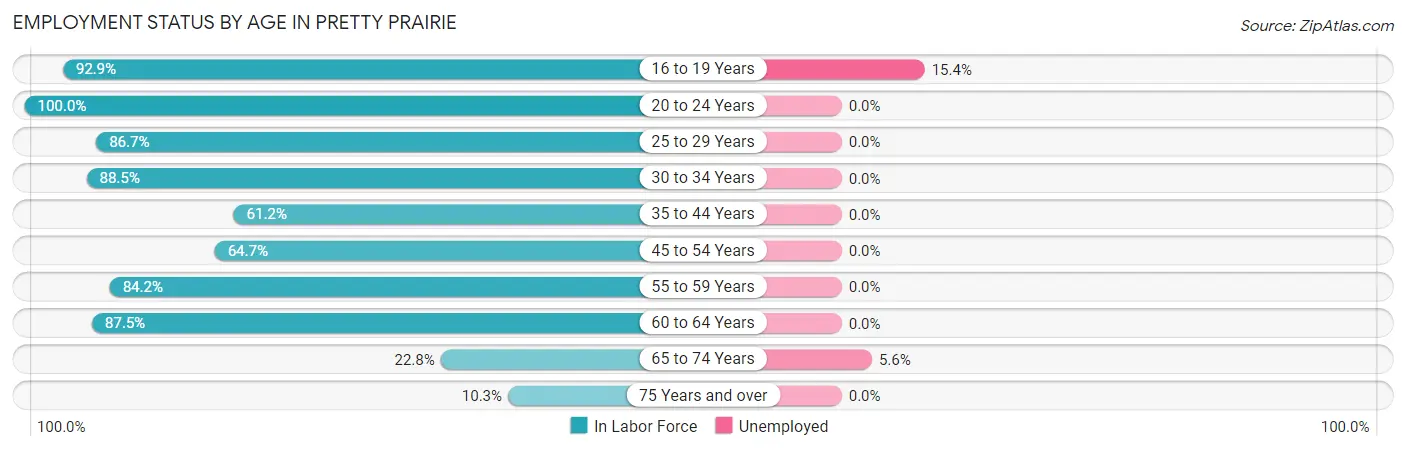
| Age Bracket | In Labor Force | Unemployed |
| 16 to 19 Years | 13 (92.9%) | 2 (15.4%) |
| 20 to 24 Years | 3 (100.0%) | 0 (0.0%) |
| 25 to 29 Years | 26 (86.7%) | 0 (0.0%) |
| 30 to 34 Years | 23 (88.5%) | 0 (0.0%) |
| 35 to 44 Years | 85 (61.2%) | 0 (0.0%) |
| 45 to 54 Years | 55 (64.7%) | 0 (0.0%) |
| 55 to 59 Years | 16 (84.2%) | 0 (0.0%) |
| 60 to 64 Years | 49 (87.5%) | 0 (0.0%) |
| 65 to 74 Years | 18 (22.8%) | 1 (5.6%) |
| 75 Years and over | 6 (10.3%) | 0 (0.0%) |
| Total | 294 (57.8%) | 3 (1.0%) |
Employment Status by Educational Attainment in Pretty Prairie
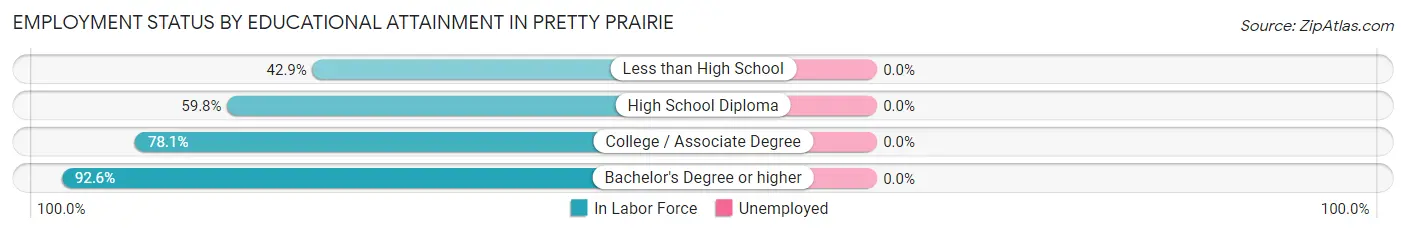
| Educational Attainment | In Labor Force | Unemployed |
| Less than High School | 6 (42.9%) | 0 (0.0%) |
| High School Diploma | 98 (59.8%) | 0 (0.0%) |
| College / Associate Degree | 75 (78.1%) | 0 (0.0%) |
| Bachelor's Degree or higher | 75 (92.6%) | 0 (0.0%) |
| Total | 254 (71.5%) | 0 (0.0%) |
Employment Occupations by Sex in Pretty Prairie
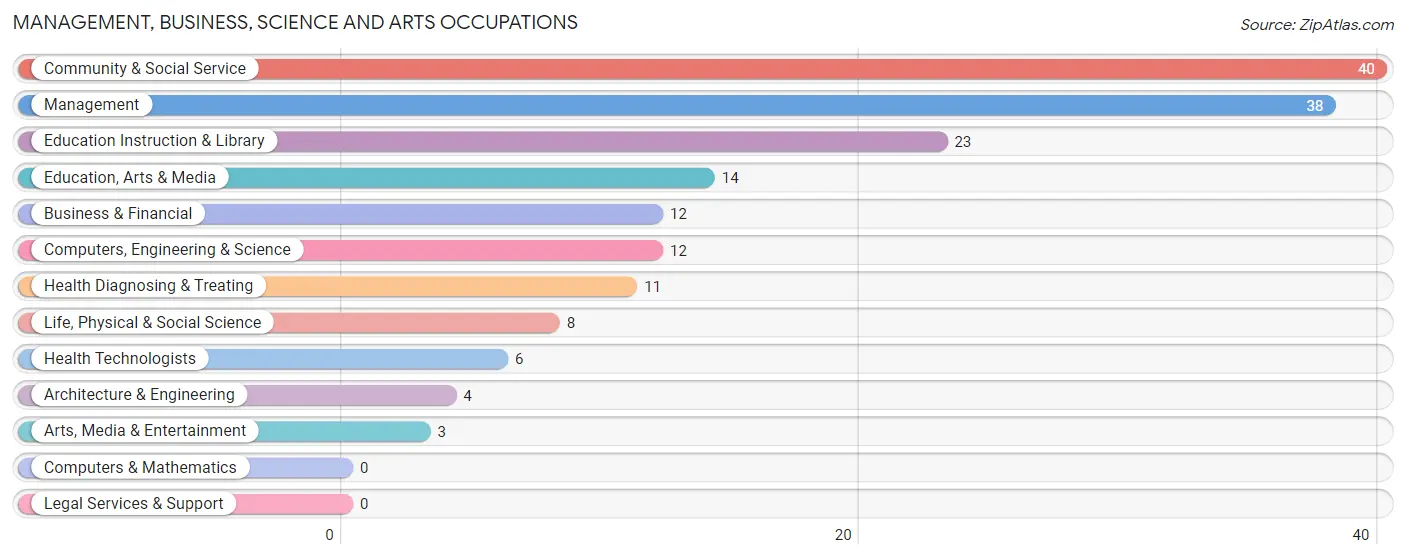
Management, Business, Science and Arts Occupations
The most common Management, Business, Science and Arts occupations in Pretty Prairie are Community & Social Service (40 | 13.8%), Management (38 | 13.1%), Education Instruction & Library (23 | 7.9%), Education, Arts & Media (14 | 4.8%), and Business & Financial (12 | 4.1%).
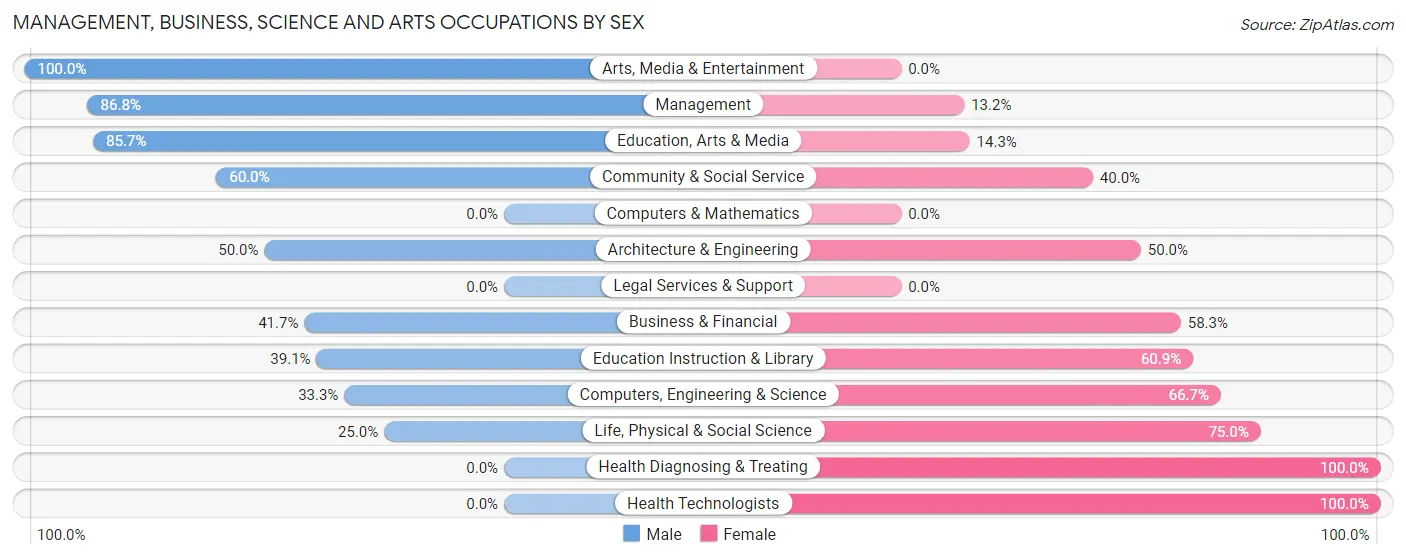
Management, Business, Science and Arts Occupations by Sex
Within the Management, Business, Science and Arts occupations in Pretty Prairie, the most male-oriented occupations are Arts, Media & Entertainment (100.0%), Management (86.8%), and Education, Arts & Media (85.7%), while the most female-oriented occupations are Health Diagnosing & Treating (100.0%), Health Technologists (100.0%), and Life, Physical & Social Science (75.0%).
| Occupation | Male | Female |
| Management | 33 (86.8%) | 5 (13.2%) |
| Business & Financial | 5 (41.7%) | 7 (58.3%) |
| Computers, Engineering & Science | 4 (33.3%) | 8 (66.7%) |
| Computers & Mathematics | 0 (0.0%) | 0 (0.0%) |
| Architecture & Engineering | 2 (50.0%) | 2 (50.0%) |
| Life, Physical & Social Science | 2 (25.0%) | 6 (75.0%) |
| Community & Social Service | 24 (60.0%) | 16 (40.0%) |
| Education, Arts & Media | 12 (85.7%) | 2 (14.3%) |
| Legal Services & Support | 0 (0.0%) | 0 (0.0%) |
| Education Instruction & Library | 9 (39.1%) | 14 (60.9%) |
| Arts, Media & Entertainment | 3 (100.0%) | 0 (0.0%) |
| Health Diagnosing & Treating | 0 (0.0%) | 11 (100.0%) |
| Health Technologists | 0 (0.0%) | 6 (100.0%) |
| Total (Category) | 66 (58.4%) | 47 (41.6%) |
| Total (Overall) | 160 (55.0%) | 131 (45.0%) |
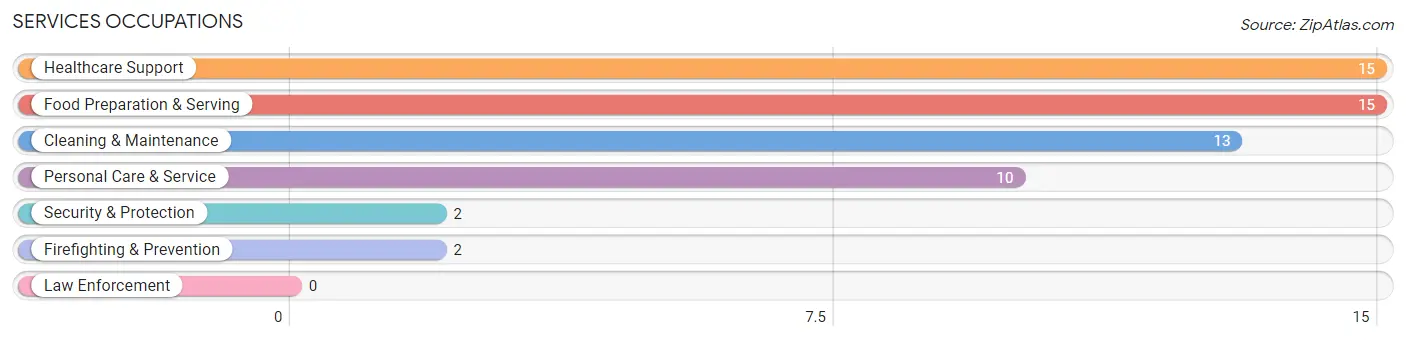
Services Occupations
The most common Services occupations in Pretty Prairie are Healthcare Support (15 | 5.1%), Food Preparation & Serving (15 | 5.1%), Cleaning & Maintenance (13 | 4.5%), Personal Care & Service (10 | 3.4%), and Security & Protection (2 | 0.7%).
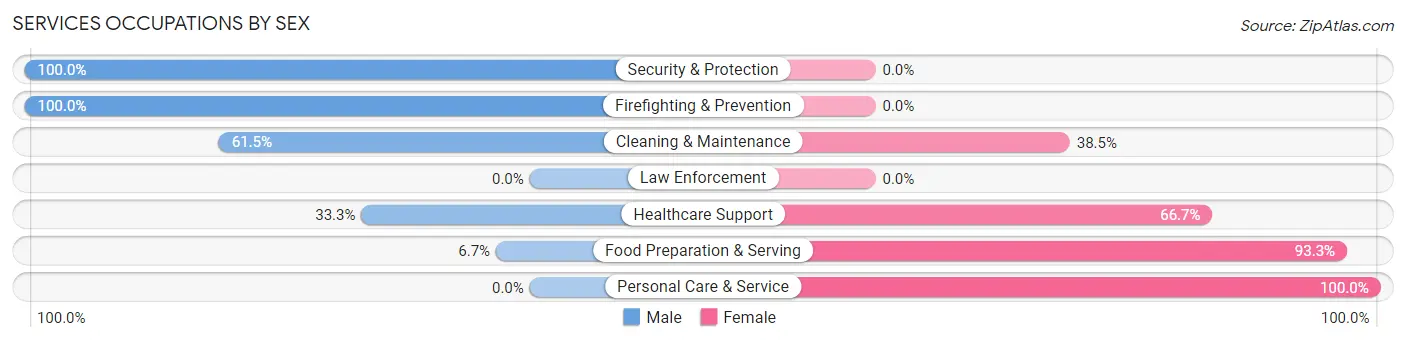
Services Occupations by Sex
Within the Services occupations in Pretty Prairie, the most male-oriented occupations are Security & Protection (100.0%), Firefighting & Prevention (100.0%), and Cleaning & Maintenance (61.5%), while the most female-oriented occupations are Personal Care & Service (100.0%), Food Preparation & Serving (93.3%), and Healthcare Support (66.7%).
| Occupation | Male | Female |
| Healthcare Support | 5 (33.3%) | 10 (66.7%) |
| Security & Protection | 2 (100.0%) | 0 (0.0%) |
| Firefighting & Prevention | 2 (100.0%) | 0 (0.0%) |
| Law Enforcement | 0 (0.0%) | 0 (0.0%) |
| Food Preparation & Serving | 1 (6.7%) | 14 (93.3%) |
| Cleaning & Maintenance | 8 (61.5%) | 5 (38.5%) |
| Personal Care & Service | 0 (0.0%) | 10 (100.0%) |
| Total (Category) | 16 (29.1%) | 39 (70.9%) |
| Total (Overall) | 160 (55.0%) | 131 (45.0%) |
Sales and Office Occupations
The most common Sales and Office occupations in Pretty Prairie are Office & Administration (36 | 12.4%), and Sales & Related (10 | 3.4%).
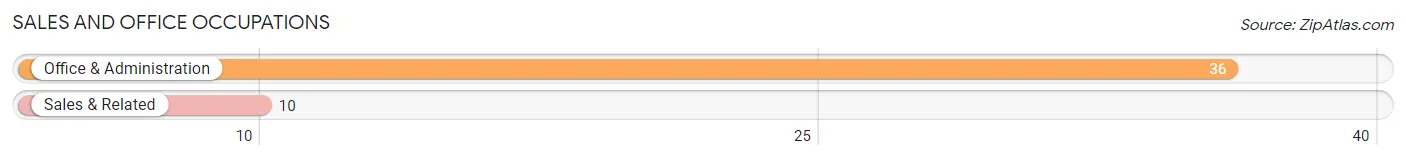
Sales and Office Occupations by Sex
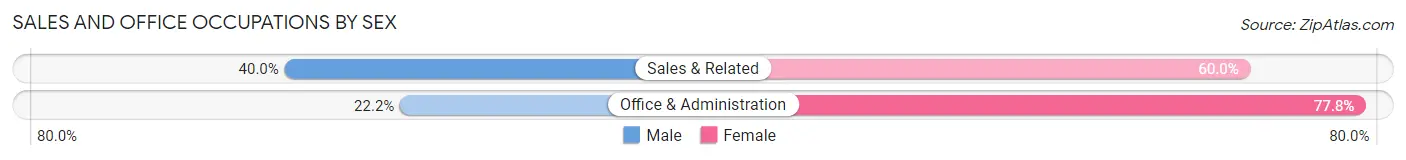
| Occupation | Male | Female |
| Sales & Related | 4 (40.0%) | 6 (60.0%) |
| Office & Administration | 8 (22.2%) | 28 (77.8%) |
| Total (Category) | 12 (26.1%) | 34 (73.9%) |
| Total (Overall) | 160 (55.0%) | 131 (45.0%) |
Natural Resources, Construction and Maintenance Occupations
The most common Natural Resources, Construction and Maintenance occupations in Pretty Prairie are Installation, Maintenance & Repair (12 | 4.1%), Construction & Extraction (11 | 3.8%), and Farming, Fishing & Forestry (9 | 3.1%).
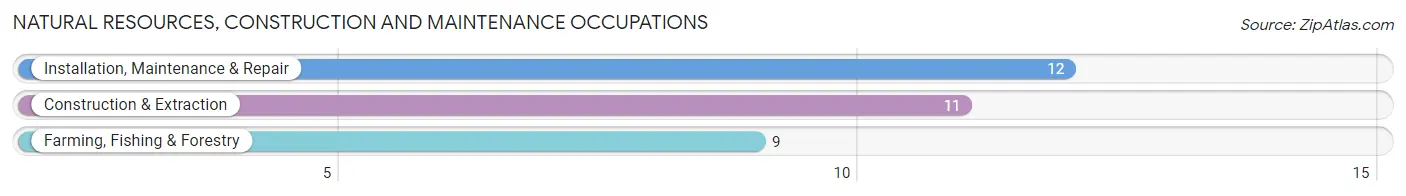
Natural Resources, Construction and Maintenance Occupations by Sex
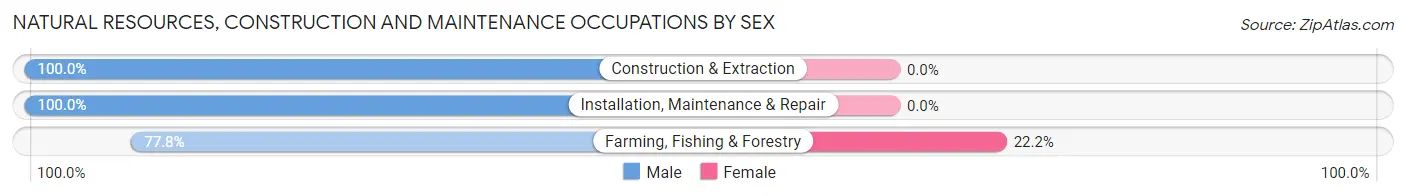
| Occupation | Male | Female |
| Farming, Fishing & Forestry | 7 (77.8%) | 2 (22.2%) |
| Construction & Extraction | 11 (100.0%) | 0 (0.0%) |
| Installation, Maintenance & Repair | 12 (100.0%) | 0 (0.0%) |
| Total (Category) | 30 (93.8%) | 2 (6.2%) |
| Total (Overall) | 160 (55.0%) | 131 (45.0%) |
Production, Transportation and Moving Occupations
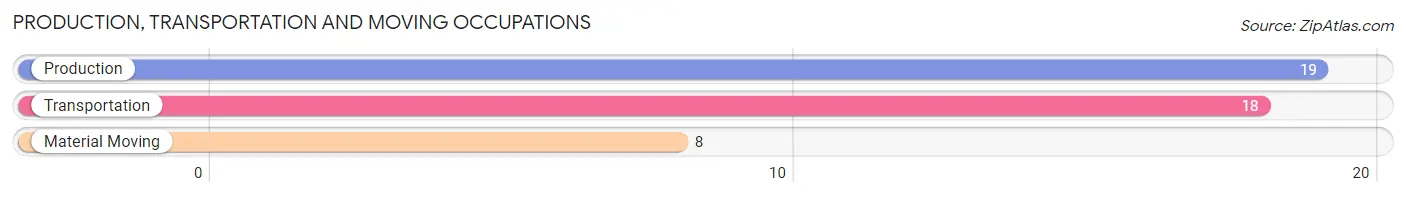
The most common Production, Transportation and Moving occupations in Pretty Prairie are Production (19 | 6.5%), Transportation (18 | 6.2%), and Material Moving (8 | 2.8%).
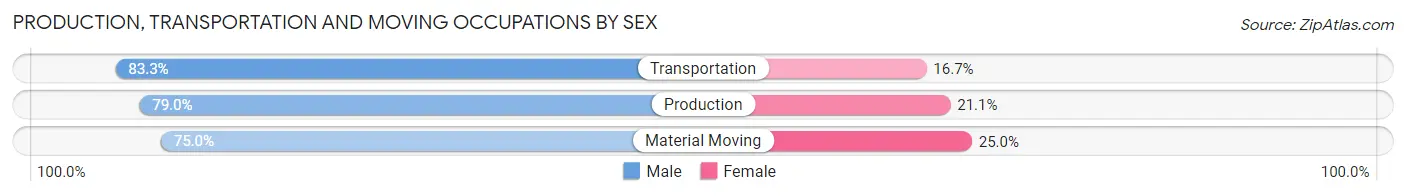
Production, Transportation and Moving Occupations by Sex
| Occupation | Male | Female |
| Production | 15 (78.9%) | 4 (21.0%) |
| Transportation | 15 (83.3%) | 3 (16.7%) |
| Material Moving | 6 (75.0%) | 2 (25.0%) |
| Total (Category) | 36 (80.0%) | 9 (20.0%) |
| Total (Overall) | 160 (55.0%) | 131 (45.0%) |
Employment Industries by Sex in Pretty Prairie
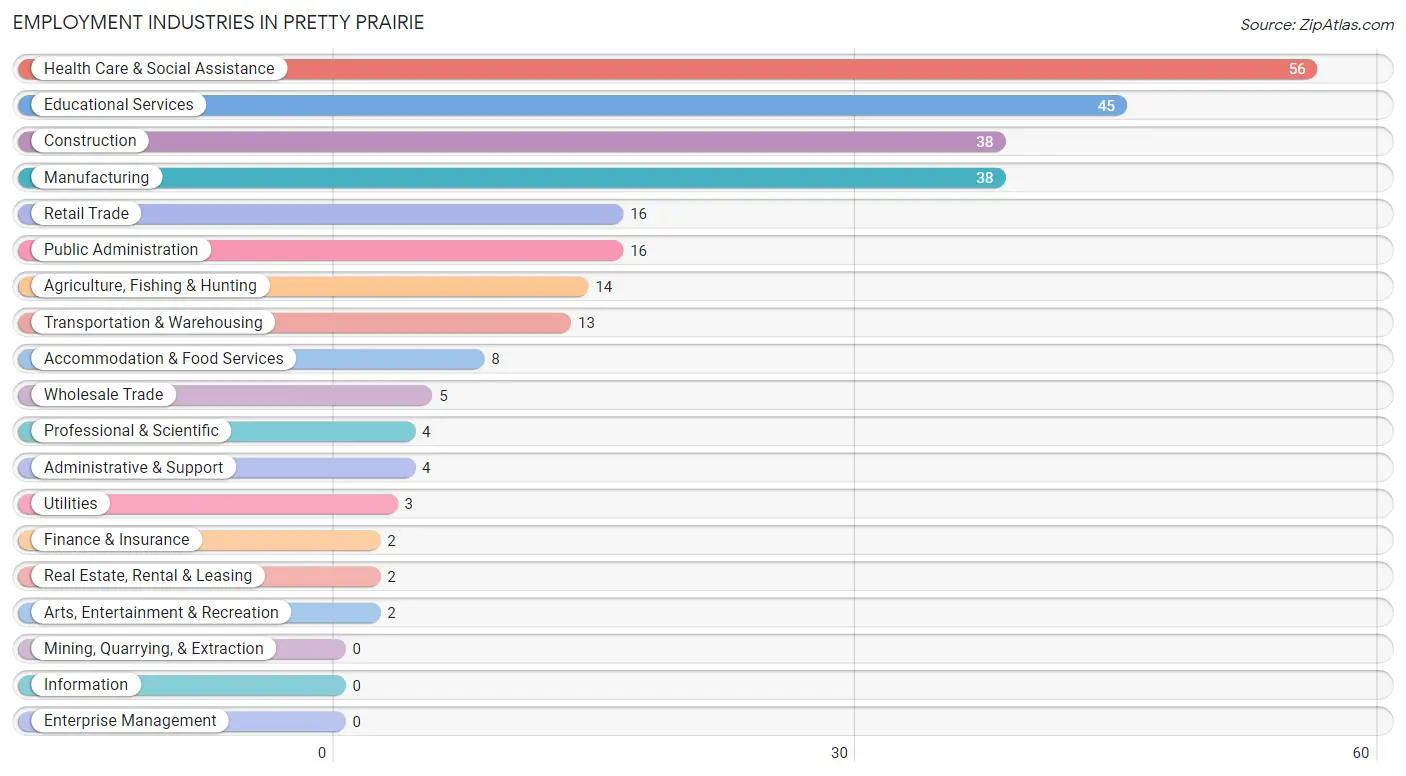
Employment Industries in Pretty Prairie
The major employment industries in Pretty Prairie include Health Care & Social Assistance (56 | 19.2%), Educational Services (45 | 15.5%), Construction (38 | 13.1%), Manufacturing (38 | 13.1%), and Retail Trade (16 | 5.5%).
Employment Industries by Sex in Pretty Prairie
The Pretty Prairie industries that see more men than women are Wholesale Trade (100.0%), Transportation & Warehousing (100.0%), and Utilities (100.0%), whereas the industries that tend to have a higher number of women are Professional & Scientific (100.0%), Arts, Entertainment & Recreation (100.0%), and Accommodation & Food Services (100.0%).
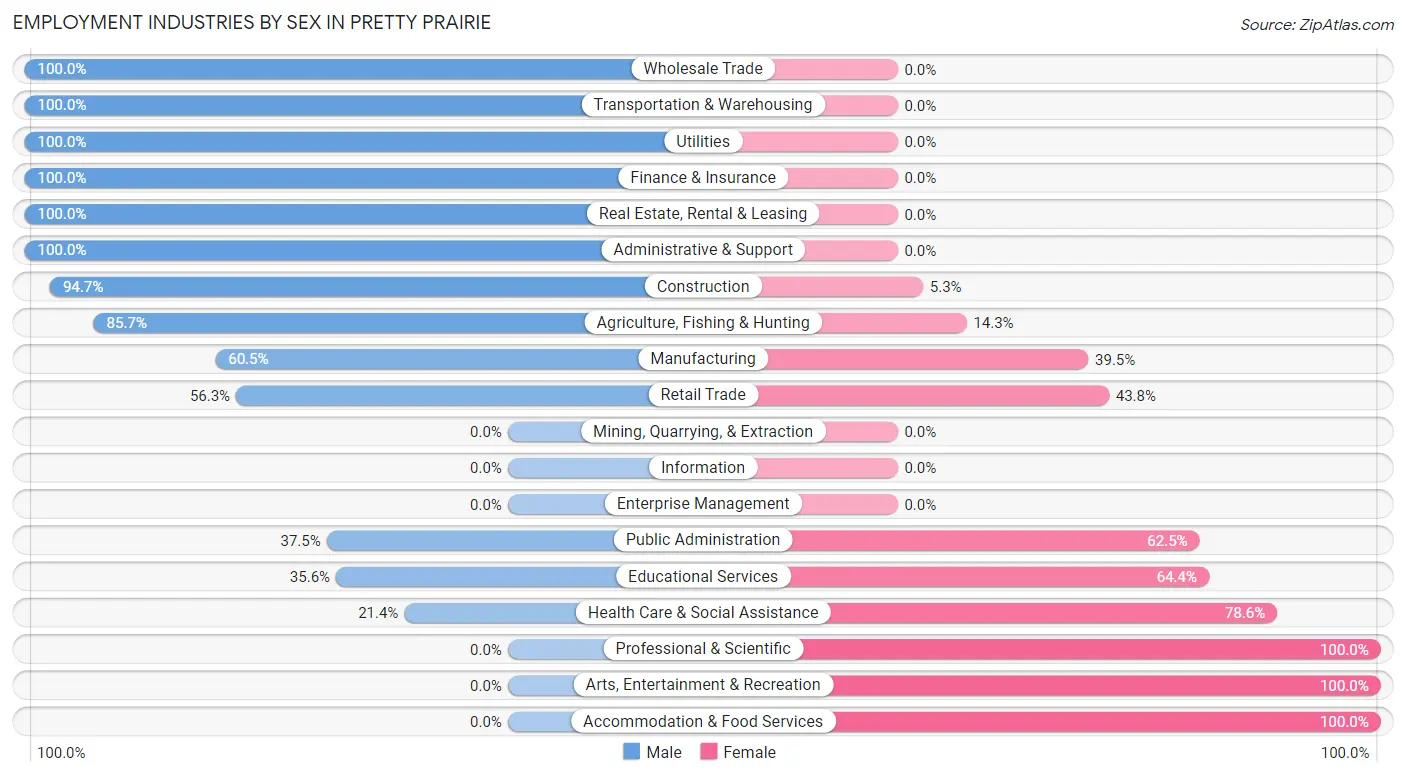
| Industry | Male | Female |
| Agriculture, Fishing & Hunting | 12 (85.7%) | 2 (14.3%) |
| Mining, Quarrying, & Extraction | 0 (0.0%) | 0 (0.0%) |
| Construction | 36 (94.7%) | 2 (5.3%) |
| Manufacturing | 23 (60.5%) | 15 (39.5%) |
| Wholesale Trade | 5 (100.0%) | 0 (0.0%) |
| Retail Trade | 9 (56.2%) | 7 (43.8%) |
| Transportation & Warehousing | 13 (100.0%) | 0 (0.0%) |
| Utilities | 3 (100.0%) | 0 (0.0%) |
| Information | 0 (0.0%) | 0 (0.0%) |
| Finance & Insurance | 2 (100.0%) | 0 (0.0%) |
| Real Estate, Rental & Leasing | 2 (100.0%) | 0 (0.0%) |
| Professional & Scientific | 0 (0.0%) | 4 (100.0%) |
| Enterprise Management | 0 (0.0%) | 0 (0.0%) |
| Administrative & Support | 4 (100.0%) | 0 (0.0%) |
| Educational Services | 16 (35.6%) | 29 (64.4%) |
| Health Care & Social Assistance | 12 (21.4%) | 44 (78.6%) |
| Arts, Entertainment & Recreation | 0 (0.0%) | 2 (100.0%) |
| Accommodation & Food Services | 0 (0.0%) | 8 (100.0%) |
| Public Administration | 6 (37.5%) | 10 (62.5%) |
| Total | 160 (55.0%) | 131 (45.0%) |
Education in Pretty Prairie
School Enrollment in Pretty Prairie
The most common levels of schooling among the 135 students in Pretty Prairie are elementary school (43 | 31.9%), middle school (41 | 30.4%), and high school (18 | 13.3%).
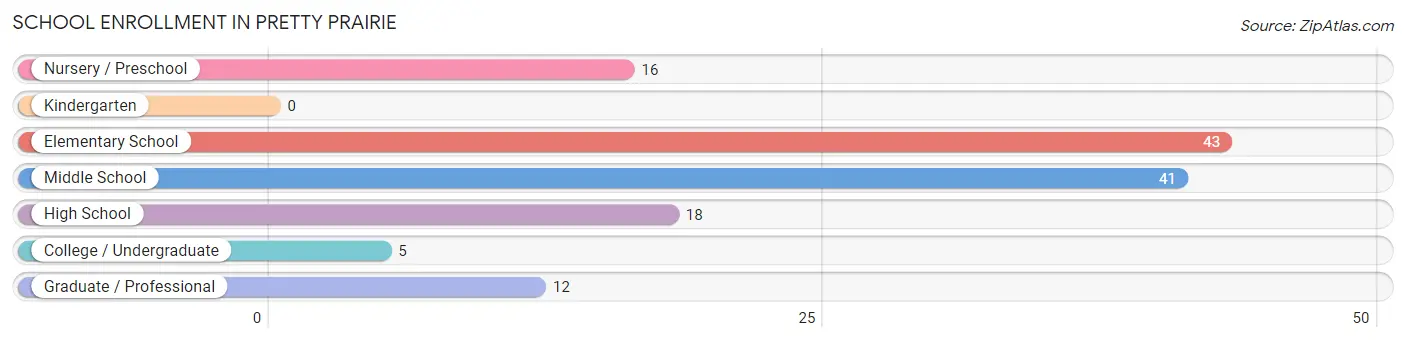
| School Level | # Students | % Students |
| Nursery / Preschool | 16 | 11.8% |
| Kindergarten | 0 | 0.0% |
| Elementary School | 43 | 31.9% |
| Middle School | 41 | 30.4% |
| High School | 18 | 13.3% |
| College / Undergraduate | 5 | 3.7% |
| Graduate / Professional | 12 | 8.9% |
| Total | 135 | 100.0% |
School Enrollment by Age by Funding Source in Pretty Prairie
Out of a total of 135 students who are enrolled in schools in Pretty Prairie, 7 (5.2%) attend a private institution, while the remaining 128 (94.8%) are enrolled in public schools. The age group of 25 to 34 year olds has the highest likelihood of being enrolled in private schools, with 4 (100.0% in the age bracket) enrolled. Conversely, the age group of 3 to 4 year olds has the lowest likelihood of being enrolled in a private school, with 7 (100.0% in the age bracket) attending a public institution.
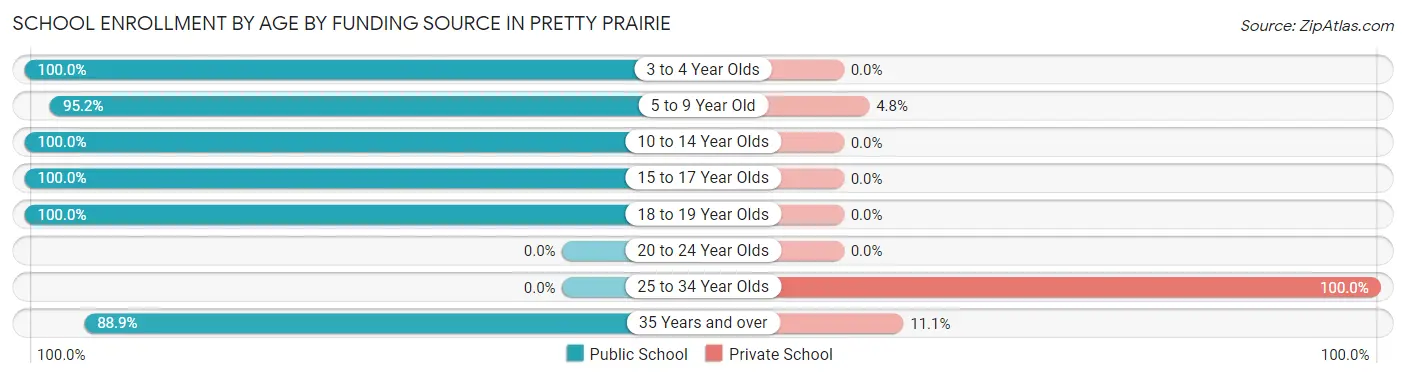
| Age Bracket | Public School | Private School |
| 3 to 4 Year Olds | 7 (100.0%) | 0 (0.0%) |
| 5 to 9 Year Old | 40 (95.2%) | 2 (4.8%) |
| 10 to 14 Year Olds | 52 (100.0%) | 0 (0.0%) |
| 15 to 17 Year Olds | 13 (100.0%) | 0 (0.0%) |
| 18 to 19 Year Olds | 8 (100.0%) | 0 (0.0%) |
| 20 to 24 Year Olds | 0 (0.0%) | 0 (0.0%) |
| 25 to 34 Year Olds | 0 (0.0%) | 4 (100.0%) |
| 35 Years and over | 8 (88.9%) | 1 (11.1%) |
| Total | 128 (94.8%) | 7 (5.2%) |
Educational Attainment by Field of Study in Pretty Prairie
Education (41 | 25.2%), business (40 | 24.5%), social sciences (15 | 9.2%), literature & languages (14 | 8.6%), and bio, nature & agricultural (11 | 6.8%) are the most common fields of study among 163 individuals in Pretty Prairie who have obtained a bachelor's degree or higher.
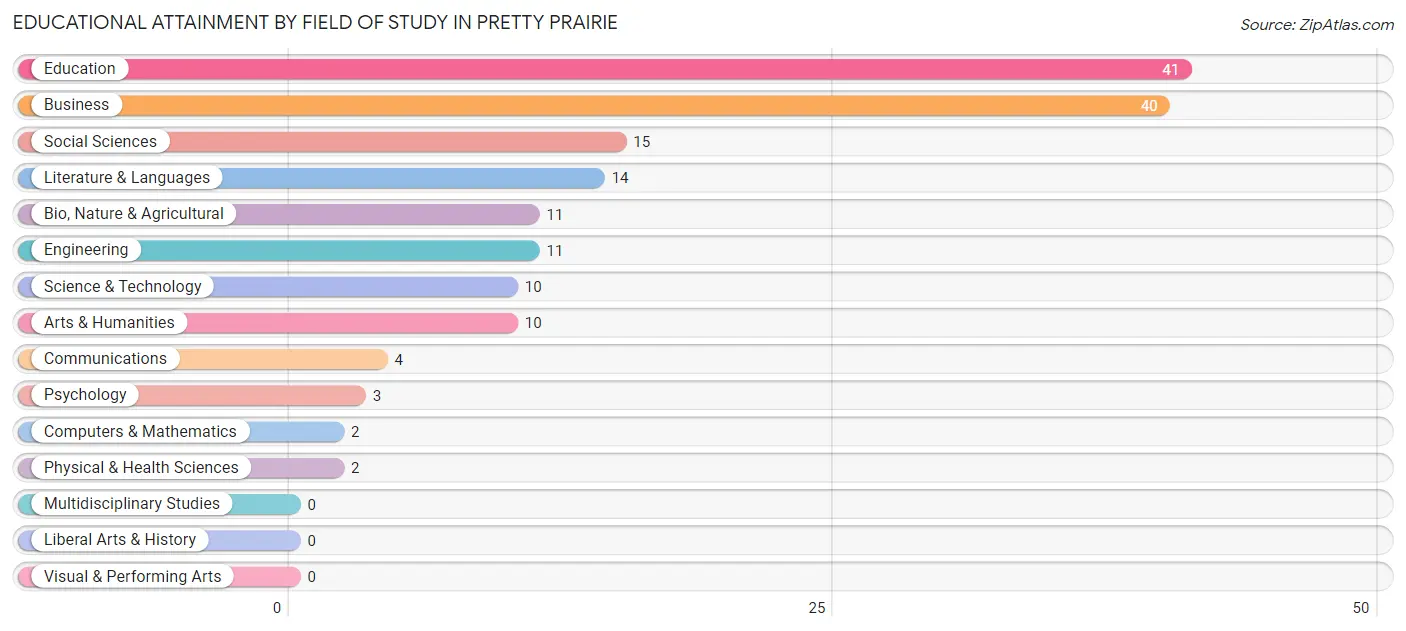
| Field of Study | # Graduates | % Graduates |
| Computers & Mathematics | 2 | 1.2% |
| Bio, Nature & Agricultural | 11 | 6.8% |
| Physical & Health Sciences | 2 | 1.2% |
| Psychology | 3 | 1.8% |
| Social Sciences | 15 | 9.2% |
| Engineering | 11 | 6.8% |
| Multidisciplinary Studies | 0 | 0.0% |
| Science & Technology | 10 | 6.1% |
| Business | 40 | 24.5% |
| Education | 41 | 25.2% |
| Literature & Languages | 14 | 8.6% |
| Liberal Arts & History | 0 | 0.0% |
| Visual & Performing Arts | 0 | 0.0% |
| Communications | 4 | 2.5% |
| Arts & Humanities | 10 | 6.1% |
| Total | 163 | 100.0% |
Transportation & Commute in Pretty Prairie
Vehicle Availability by Sex in Pretty Prairie
The most prevalent vehicle ownership categories in Pretty Prairie are males with 2 vehicles (76, accounting for 52.8%) and females with 2 vehicles (43, making up 60.3%).
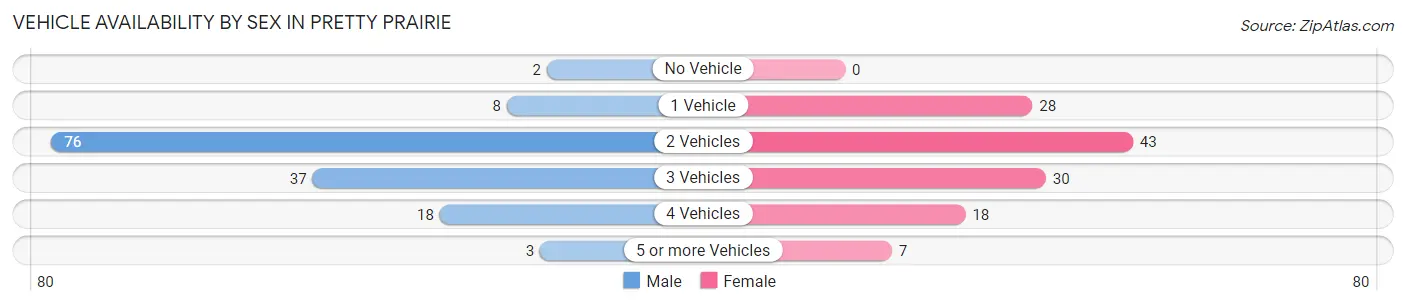
| Vehicles Available | Male | Female |
| No Vehicle | 2 (1.4%) | 0 (0.0%) |
| 1 Vehicle | 8 (5.6%) | 28 (22.2%) |
| 2 Vehicles | 76 (52.8%) | 43 (34.1%) |
| 3 Vehicles | 37 (25.7%) | 30 (23.8%) |
| 4 Vehicles | 18 (12.5%) | 18 (14.3%) |
| 5 or more Vehicles | 3 (2.1%) | 7 (5.6%) |
| Total | 144 (100.0%) | 126 (100.0%) |
Commute Time in Pretty Prairie
The most frequently occuring commute durations in Pretty Prairie are less than 5 minutes (76 commuters, 29.2%), 30 to 34 minutes (49 commuters, 18.9%), and 25 to 29 minutes (24 commuters, 9.2%).
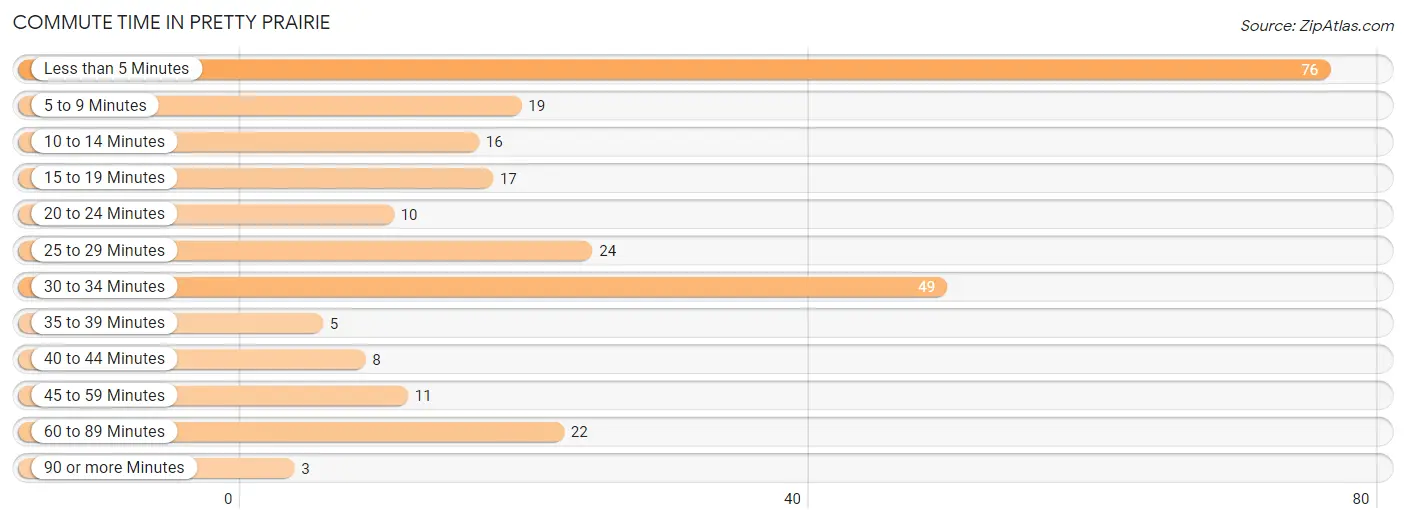
| Commute Time | # Commuters | % Commuters |
| Less than 5 Minutes | 76 | 29.2% |
| 5 to 9 Minutes | 19 | 7.3% |
| 10 to 14 Minutes | 16 | 6.1% |
| 15 to 19 Minutes | 17 | 6.5% |
| 20 to 24 Minutes | 10 | 3.8% |
| 25 to 29 Minutes | 24 | 9.2% |
| 30 to 34 Minutes | 49 | 18.9% |
| 35 to 39 Minutes | 5 | 1.9% |
| 40 to 44 Minutes | 8 | 3.1% |
| 45 to 59 Minutes | 11 | 4.2% |
| 60 to 89 Minutes | 22 | 8.5% |
| 90 or more Minutes | 3 | 1.1% |
Commute Time by Sex in Pretty Prairie
The most common commute times in Pretty Prairie are 30 to 34 minutes (39 commuters, 26.2%) for males and less than 5 minutes (46 commuters, 41.4%) for females.
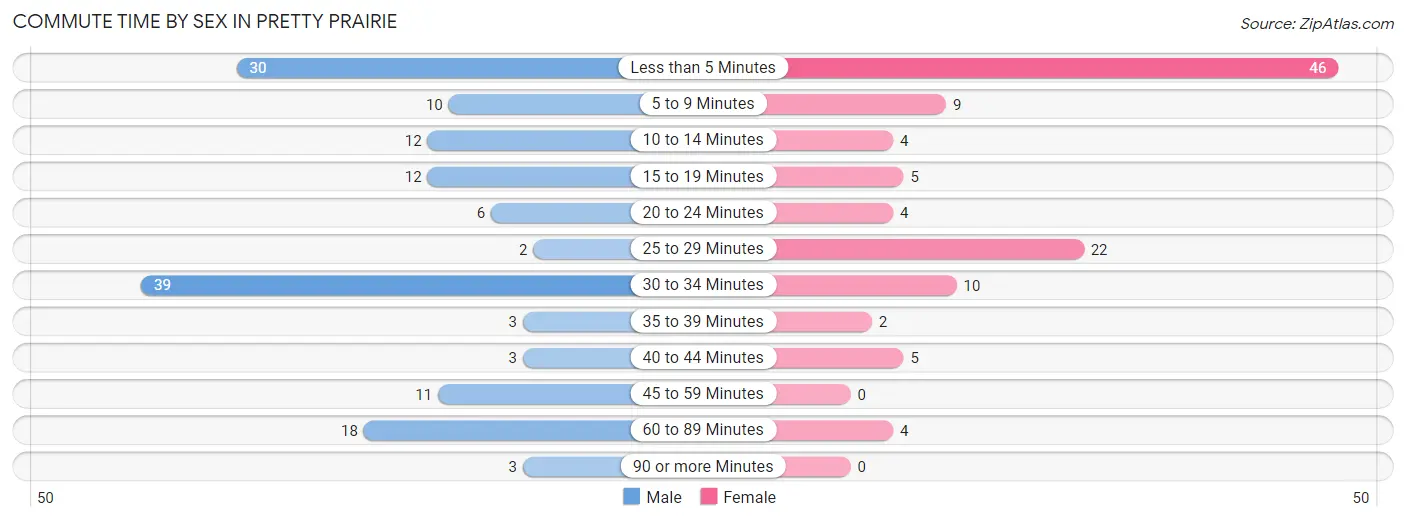
| Commute Time | Male | Female |
| Less than 5 Minutes | 30 (20.1%) | 46 (41.4%) |
| 5 to 9 Minutes | 10 (6.7%) | 9 (8.1%) |
| 10 to 14 Minutes | 12 (8.1%) | 4 (3.6%) |
| 15 to 19 Minutes | 12 (8.1%) | 5 (4.5%) |
| 20 to 24 Minutes | 6 (4.0%) | 4 (3.6%) |
| 25 to 29 Minutes | 2 (1.3%) | 22 (19.8%) |
| 30 to 34 Minutes | 39 (26.2%) | 10 (9.0%) |
| 35 to 39 Minutes | 3 (2.0%) | 2 (1.8%) |
| 40 to 44 Minutes | 3 (2.0%) | 5 (4.5%) |
| 45 to 59 Minutes | 11 (7.4%) | 0 (0.0%) |
| 60 to 89 Minutes | 18 (12.1%) | 4 (3.6%) |
| 90 or more Minutes | 3 (2.0%) | 0 (0.0%) |
Time of Departure to Work by Sex in Pretty Prairie
The most frequent times of departure to work in Pretty Prairie are 7:30 AM to 7:59 AM (45, 30.2%) for males and 7:30 AM to 7:59 AM (23, 20.7%) for females.
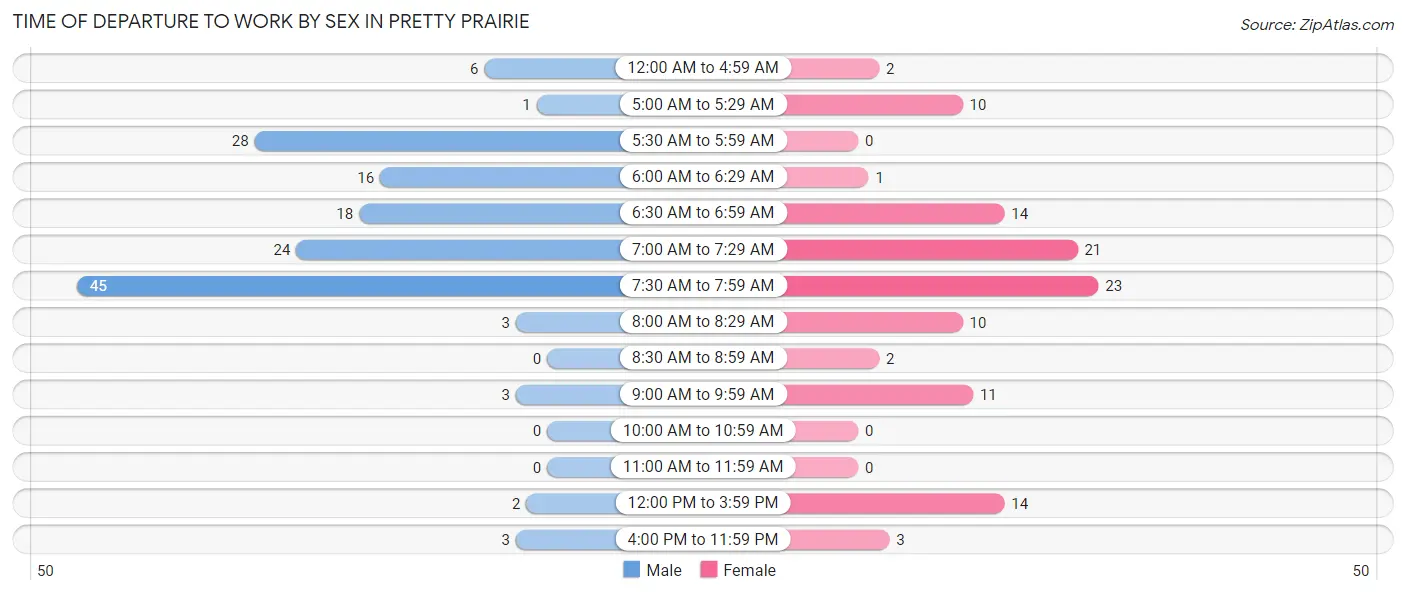
| Time of Departure | Male | Female |
| 12:00 AM to 4:59 AM | 6 (4.0%) | 2 (1.8%) |
| 5:00 AM to 5:29 AM | 1 (0.7%) | 10 (9.0%) |
| 5:30 AM to 5:59 AM | 28 (18.8%) | 0 (0.0%) |
| 6:00 AM to 6:29 AM | 16 (10.7%) | 1 (0.9%) |
| 6:30 AM to 6:59 AM | 18 (12.1%) | 14 (12.6%) |
| 7:00 AM to 7:29 AM | 24 (16.1%) | 21 (18.9%) |
| 7:30 AM to 7:59 AM | 45 (30.2%) | 23 (20.7%) |
| 8:00 AM to 8:29 AM | 3 (2.0%) | 10 (9.0%) |
| 8:30 AM to 8:59 AM | 0 (0.0%) | 2 (1.8%) |
| 9:00 AM to 9:59 AM | 3 (2.0%) | 11 (9.9%) |
| 10:00 AM to 10:59 AM | 0 (0.0%) | 0 (0.0%) |
| 11:00 AM to 11:59 AM | 0 (0.0%) | 0 (0.0%) |
| 12:00 PM to 3:59 PM | 2 (1.3%) | 14 (12.6%) |
| 4:00 PM to 11:59 PM | 3 (2.0%) | 3 (2.7%) |
| Total | 149 (100.0%) | 111 (100.0%) |
Housing Occupancy in Pretty Prairie
Occupancy by Ownership in Pretty Prairie
Of the total 250 dwellings in Pretty Prairie, owner-occupied units account for 203 (81.2%), while renter-occupied units make up 47 (18.8%).
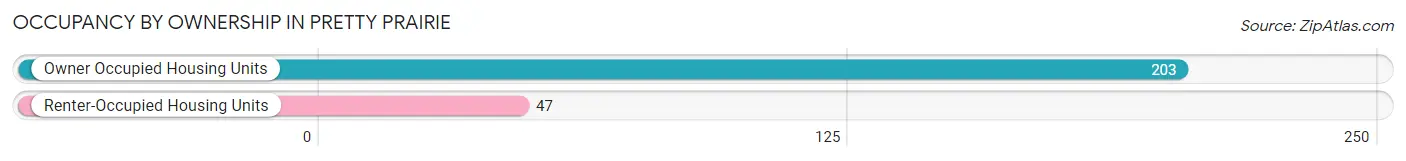
| Occupancy | # Housing Units | % Housing Units |
| Owner Occupied Housing Units | 203 | 81.2% |
| Renter-Occupied Housing Units | 47 | 18.8% |
| Total Occupied Housing Units | 250 | 100.0% |
Occupancy by Household Size in Pretty Prairie
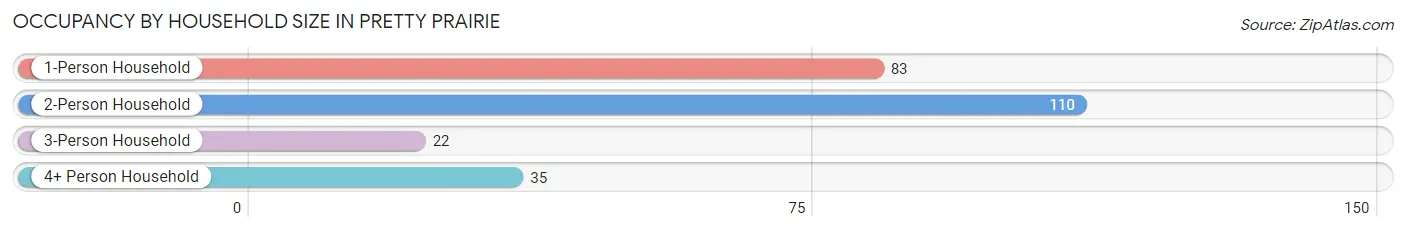
| Household Size | # Housing Units | % Housing Units |
| 1-Person Household | 83 | 33.2% |
| 2-Person Household | 110 | 44.0% |
| 3-Person Household | 22 | 8.8% |
| 4+ Person Household | 35 | 14.0% |
| Total Housing Units | 250 | 100.0% |
Occupancy by Ownership by Household Size in Pretty Prairie
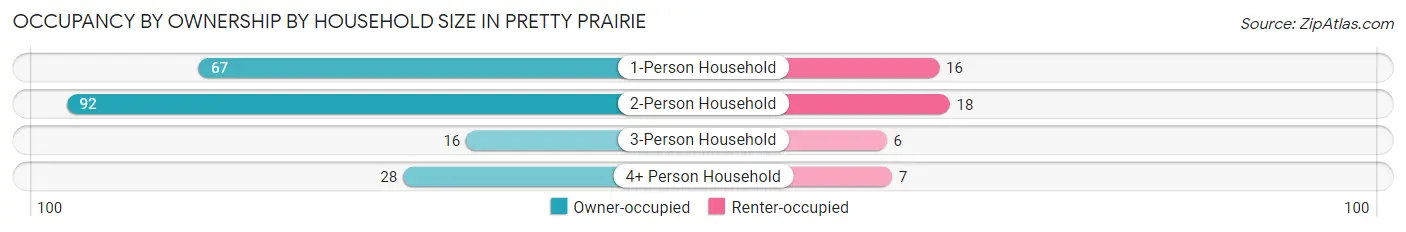
| Household Size | Owner-occupied | Renter-occupied |
| 1-Person Household | 67 (80.7%) | 16 (19.3%) |
| 2-Person Household | 92 (83.6%) | 18 (16.4%) |
| 3-Person Household | 16 (72.7%) | 6 (27.3%) |
| 4+ Person Household | 28 (80.0%) | 7 (20.0%) |
| Total Housing Units | 203 (81.2%) | 47 (18.8%) |
Occupancy by Educational Attainment in Pretty Prairie
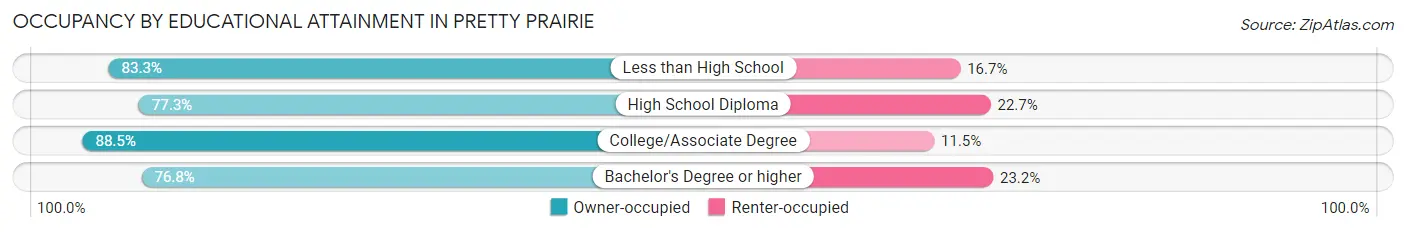
| Household Size | Owner-occupied | Renter-occupied |
| Less than High School | 5 (83.3%) | 1 (16.7%) |
| High School Diploma | 58 (77.3%) | 17 (22.7%) |
| College/Associate Degree | 77 (88.5%) | 10 (11.5%) |
| Bachelor's Degree or higher | 63 (76.8%) | 19 (23.2%) |
Occupancy by Age of Householder in Pretty Prairie
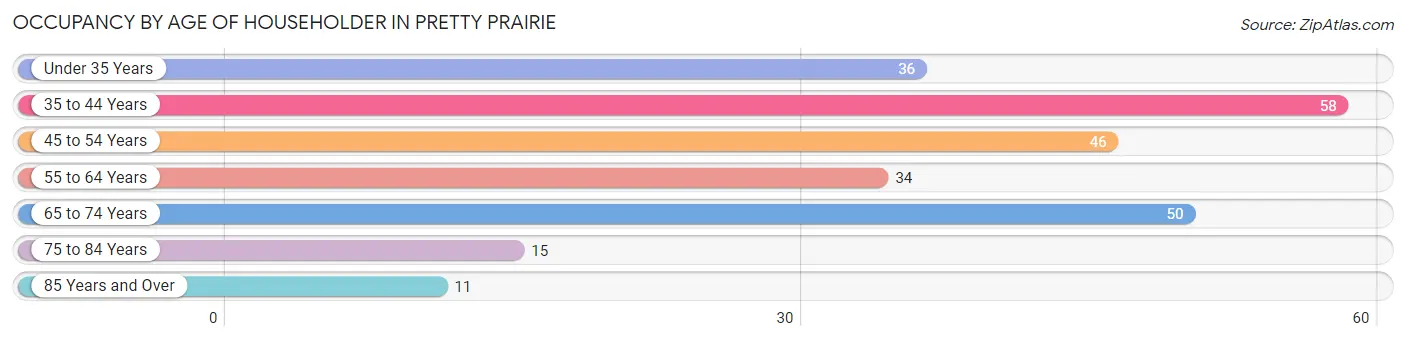
| Age Bracket | # Households | % Households |
| Under 35 Years | 36 | 14.4% |
| 35 to 44 Years | 58 | 23.2% |
| 45 to 54 Years | 46 | 18.4% |
| 55 to 64 Years | 34 | 13.6% |
| 65 to 74 Years | 50 | 20.0% |
| 75 to 84 Years | 15 | 6.0% |
| 85 Years and Over | 11 | 4.4% |
| Total | 250 | 100.0% |
Housing Finances in Pretty Prairie
Median Income by Occupancy in Pretty Prairie
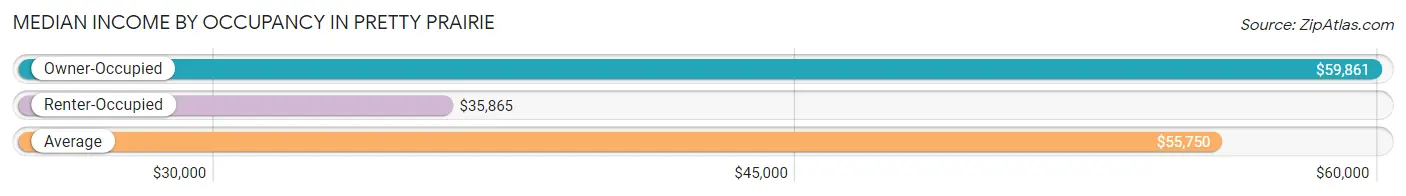
| Occupancy Type | # Households | Median Income |
| Owner-Occupied | 203 (81.2%) | $59,861 |
| Renter-Occupied | 47 (18.8%) | $35,865 |
| Average | 250 (100.0%) | $55,750 |
Occupancy by Householder Income Bracket in Pretty Prairie
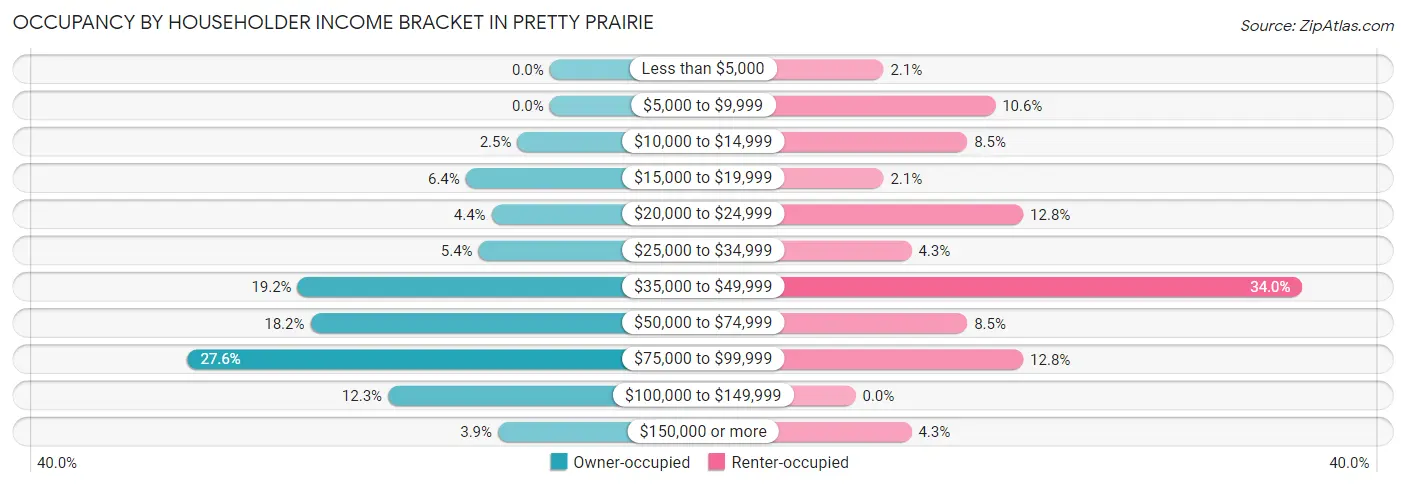
| Income Bracket | Owner-occupied | Renter-occupied |
| Less than $5,000 | 0 (0.0%) | 1 (2.1%) |
| $5,000 to $9,999 | 0 (0.0%) | 5 (10.6%) |
| $10,000 to $14,999 | 5 (2.5%) | 4 (8.5%) |
| $15,000 to $19,999 | 13 (6.4%) | 1 (2.1%) |
| $20,000 to $24,999 | 9 (4.4%) | 6 (12.8%) |
| $25,000 to $34,999 | 11 (5.4%) | 2 (4.3%) |
| $35,000 to $49,999 | 39 (19.2%) | 16 (34.0%) |
| $50,000 to $74,999 | 37 (18.2%) | 4 (8.5%) |
| $75,000 to $99,999 | 56 (27.6%) | 6 (12.8%) |
| $100,000 to $149,999 | 25 (12.3%) | 0 (0.0%) |
| $150,000 or more | 8 (3.9%) | 2 (4.3%) |
| Total | 203 (100.0%) | 47 (100.0%) |
Monthly Housing Cost Tiers in Pretty Prairie
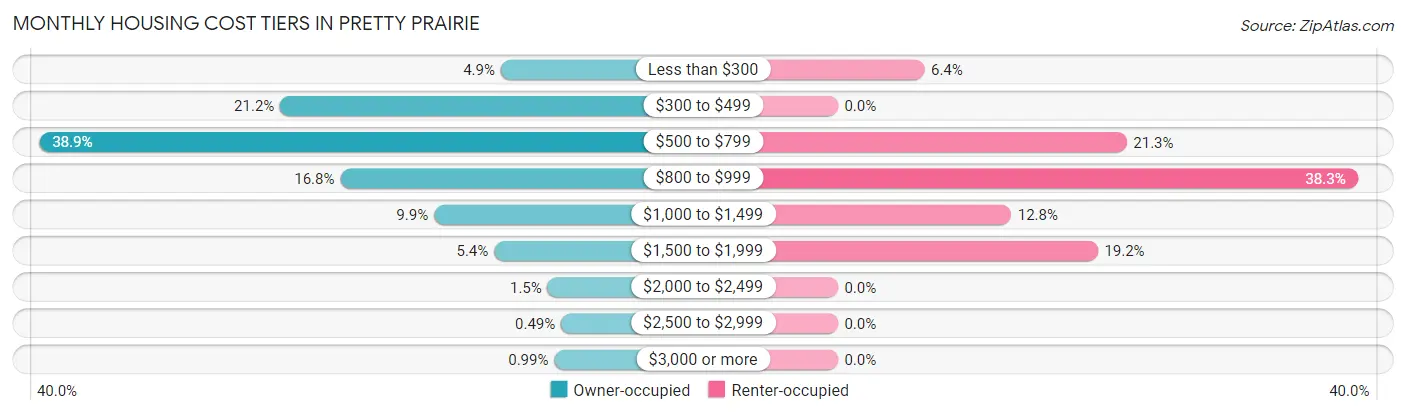
| Monthly Cost | Owner-occupied | Renter-occupied |
| Less than $300 | 10 (4.9%) | 3 (6.4%) |
| $300 to $499 | 43 (21.2%) | 0 (0.0%) |
| $500 to $799 | 79 (38.9%) | 10 (21.3%) |
| $800 to $999 | 34 (16.8%) | 18 (38.3%) |
| $1,000 to $1,499 | 20 (9.9%) | 6 (12.8%) |
| $1,500 to $1,999 | 11 (5.4%) | 9 (19.2%) |
| $2,000 to $2,499 | 3 (1.5%) | 0 (0.0%) |
| $2,500 to $2,999 | 1 (0.5%) | 0 (0.0%) |
| $3,000 or more | 2 (1.0%) | 0 (0.0%) |
| Total | 203 (100.0%) | 47 (100.0%) |
Physical Housing Characteristics in Pretty Prairie
Housing Structures in Pretty Prairie
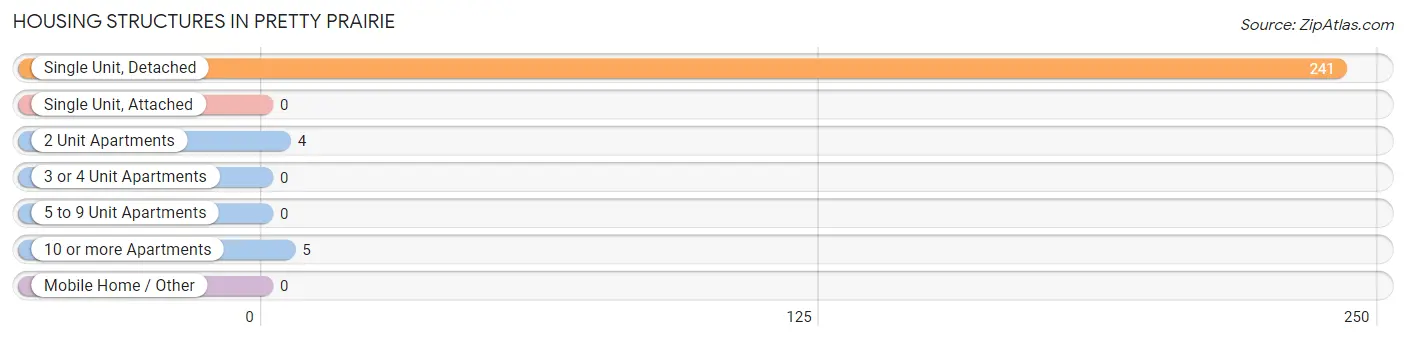
| Structure Type | # Housing Units | % Housing Units |
| Single Unit, Detached | 241 | 96.4% |
| Single Unit, Attached | 0 | 0.0% |
| 2 Unit Apartments | 4 | 1.6% |
| 3 or 4 Unit Apartments | 0 | 0.0% |
| 5 to 9 Unit Apartments | 0 | 0.0% |
| 10 or more Apartments | 5 | 2.0% |
| Mobile Home / Other | 0 | 0.0% |
| Total | 250 | 100.0% |
Housing Structures by Occupancy in Pretty Prairie
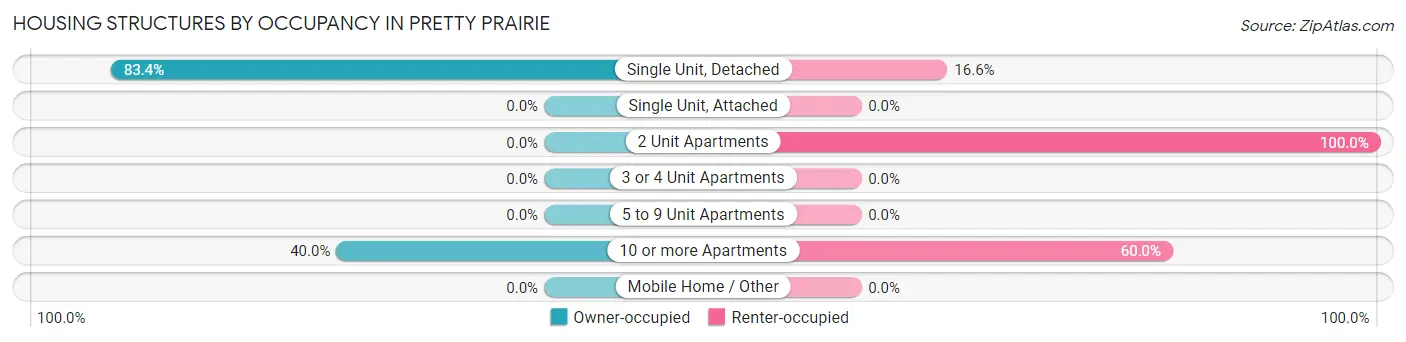
| Structure Type | Owner-occupied | Renter-occupied |
| Single Unit, Detached | 201 (83.4%) | 40 (16.6%) |
| Single Unit, Attached | 0 (0.0%) | 0 (0.0%) |
| 2 Unit Apartments | 0 (0.0%) | 4 (100.0%) |
| 3 or 4 Unit Apartments | 0 (0.0%) | 0 (0.0%) |
| 5 to 9 Unit Apartments | 0 (0.0%) | 0 (0.0%) |
| 10 or more Apartments | 2 (40.0%) | 3 (60.0%) |
| Mobile Home / Other | 0 (0.0%) | 0 (0.0%) |
| Total | 203 (81.2%) | 47 (18.8%) |
Housing Structures by Number of Rooms in Pretty Prairie
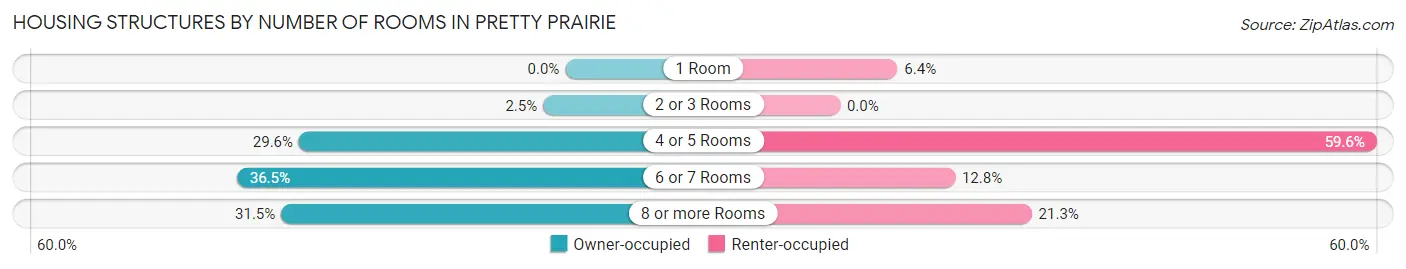
| Number of Rooms | Owner-occupied | Renter-occupied |
| 1 Room | 0 (0.0%) | 3 (6.4%) |
| 2 or 3 Rooms | 5 (2.5%) | 0 (0.0%) |
| 4 or 5 Rooms | 60 (29.6%) | 28 (59.6%) |
| 6 or 7 Rooms | 74 (36.4%) | 6 (12.8%) |
| 8 or more Rooms | 64 (31.5%) | 10 (21.3%) |
| Total | 203 (100.0%) | 47 (100.0%) |
Housing Structure by Heating Type in Pretty Prairie
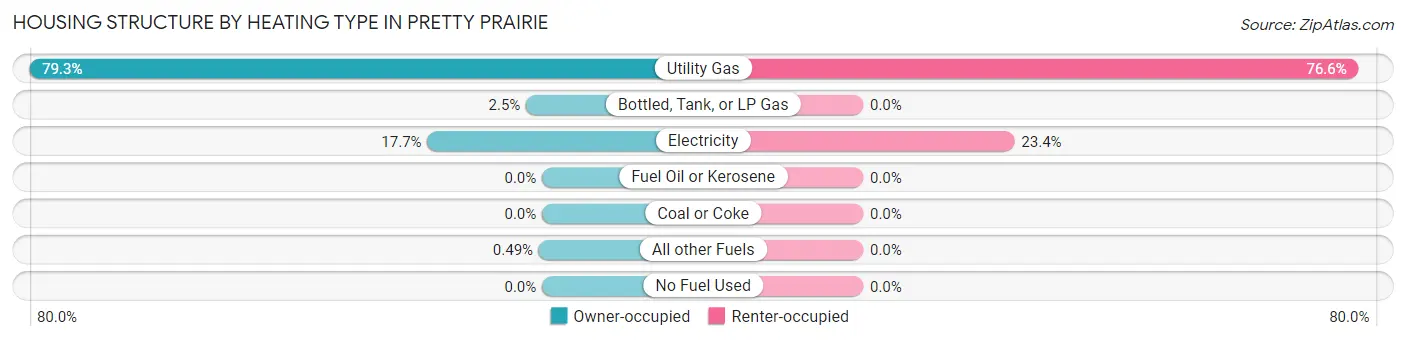
| Heating Type | Owner-occupied | Renter-occupied |
| Utility Gas | 161 (79.3%) | 36 (76.6%) |
| Bottled, Tank, or LP Gas | 5 (2.5%) | 0 (0.0%) |
| Electricity | 36 (17.7%) | 11 (23.4%) |
| Fuel Oil or Kerosene | 0 (0.0%) | 0 (0.0%) |
| Coal or Coke | 0 (0.0%) | 0 (0.0%) |
| All other Fuels | 1 (0.5%) | 0 (0.0%) |
| No Fuel Used | 0 (0.0%) | 0 (0.0%) |
| Total | 203 (100.0%) | 47 (100.0%) |
Household Vehicle Usage in Pretty Prairie
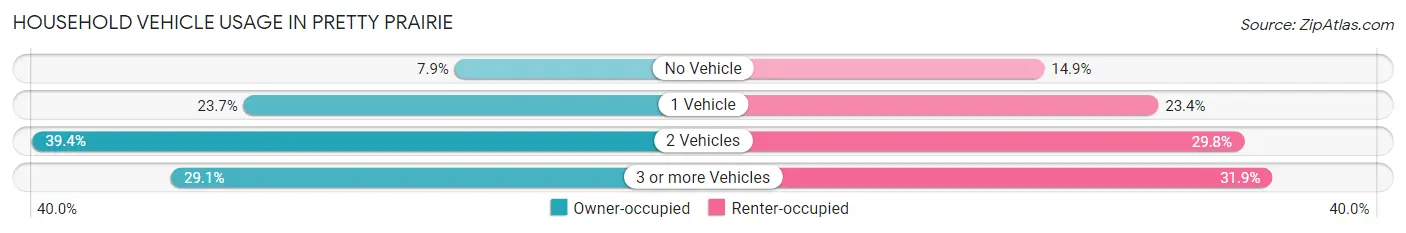
| Vehicles per Household | Owner-occupied | Renter-occupied |
| No Vehicle | 16 (7.9%) | 7 (14.9%) |
| 1 Vehicle | 48 (23.6%) | 11 (23.4%) |
| 2 Vehicles | 80 (39.4%) | 14 (29.8%) |
| 3 or more Vehicles | 59 (29.1%) | 15 (31.9%) |
| Total | 203 (100.0%) | 47 (100.0%) |
Real Estate & Mortgages in Pretty Prairie
Real Estate and Mortgage Overview in Pretty Prairie
| Characteristic | Without Mortgage | With Mortgage |
| Housing Units | 133 | 70 |
| Median Property Value | $76,300 | $78,200 |
| Median Household Income | $58,194 | $3 |
| Monthly Housing Costs | $582 | $0 |
| Real Estate Taxes | $1,881 | $0 |
Property Value by Mortgage Status in Pretty Prairie
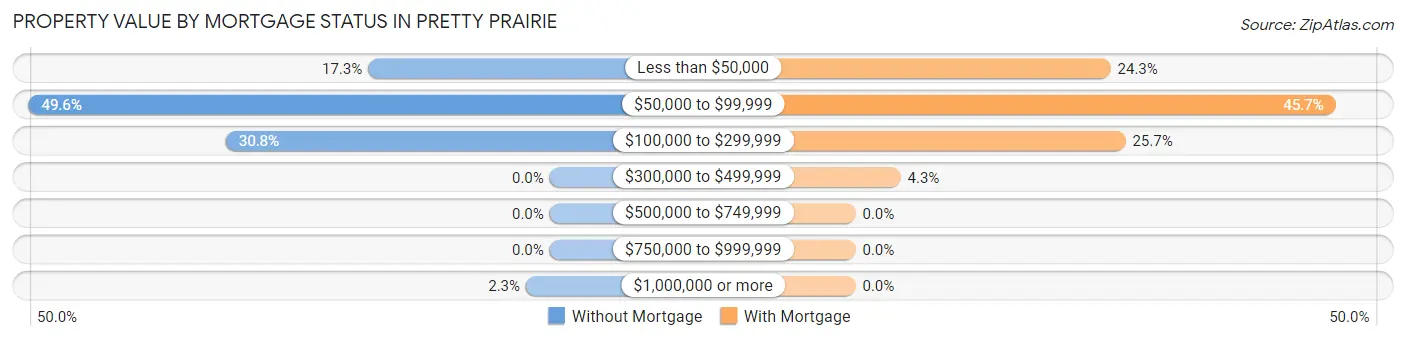
| Property Value | Without Mortgage | With Mortgage |
| Less than $50,000 | 23 (17.3%) | 17 (24.3%) |
| $50,000 to $99,999 | 66 (49.6%) | 32 (45.7%) |
| $100,000 to $299,999 | 41 (30.8%) | 18 (25.7%) |
| $300,000 to $499,999 | 0 (0.0%) | 3 (4.3%) |
| $500,000 to $749,999 | 0 (0.0%) | 0 (0.0%) |
| $750,000 to $999,999 | 0 (0.0%) | 0 (0.0%) |
| $1,000,000 or more | 3 (2.3%) | 0 (0.0%) |
| Total | 133 (100.0%) | 70 (100.0%) |
Household Income by Mortgage Status in Pretty Prairie
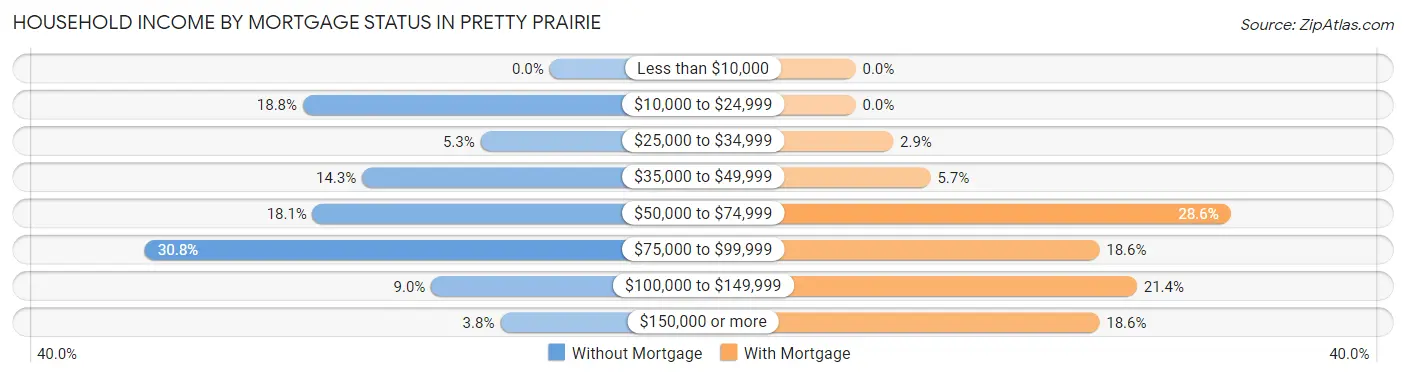
| Household Income | Without Mortgage | With Mortgage |
| Less than $10,000 | 0 (0.0%) | 0 (0.0%) |
| $10,000 to $24,999 | 25 (18.8%) | 0 (0.0%) |
| $25,000 to $34,999 | 7 (5.3%) | 2 (2.9%) |
| $35,000 to $49,999 | 19 (14.3%) | 4 (5.7%) |
| $50,000 to $74,999 | 24 (18.0%) | 20 (28.6%) |
| $75,000 to $99,999 | 41 (30.8%) | 13 (18.6%) |
| $100,000 to $149,999 | 12 (9.0%) | 15 (21.4%) |
| $150,000 or more | 5 (3.8%) | 13 (18.6%) |
| Total | 133 (100.0%) | 70 (100.0%) |
Property Value to Household Income Ratio in Pretty Prairie
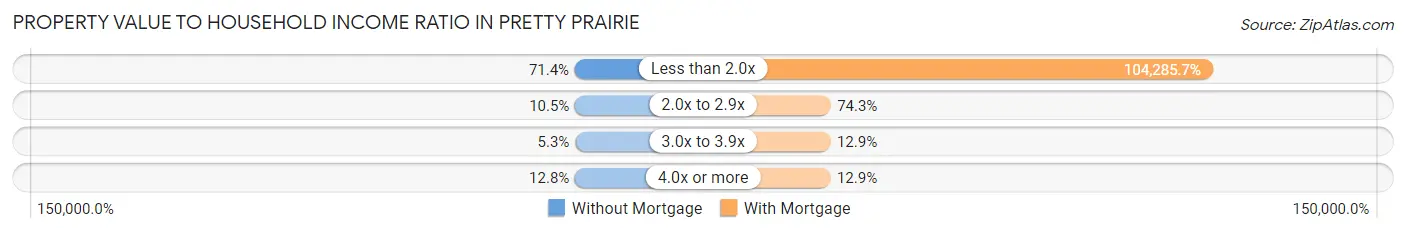
| Value-to-Income Ratio | Without Mortgage | With Mortgage |
| Less than 2.0x | 95 (71.4%) | 73,000 (104,285.7%) |
| 2.0x to 2.9x | 14 (10.5%) | 52 (74.3%) |
| 3.0x to 3.9x | 7 (5.3%) | 9 (12.9%) |
| 4.0x or more | 17 (12.8%) | 9 (12.9%) |
| Total | 133 (100.0%) | 70 (100.0%) |
Real Estate Taxes by Mortgage Status in Pretty Prairie
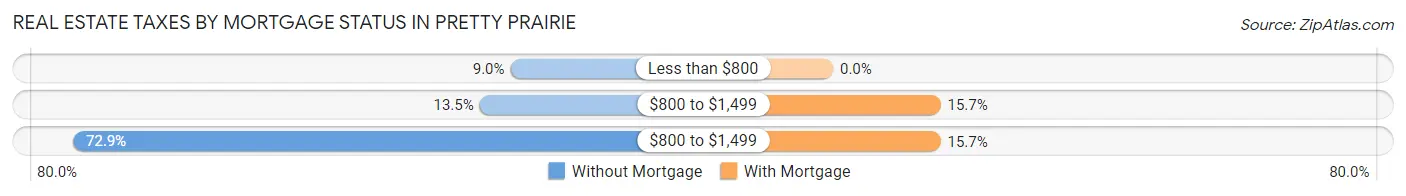
| Property Taxes | Without Mortgage | With Mortgage |
| Less than $800 | 12 (9.0%) | 0 (0.0%) |
| $800 to $1,499 | 18 (13.5%) | 11 (15.7%) |
| $800 to $1,499 | 97 (72.9%) | 11 (15.7%) |
| Total | 133 (100.0%) | 70 (100.0%) |
Health & Disability in Pretty Prairie
Health Insurance Coverage by Age in Pretty Prairie
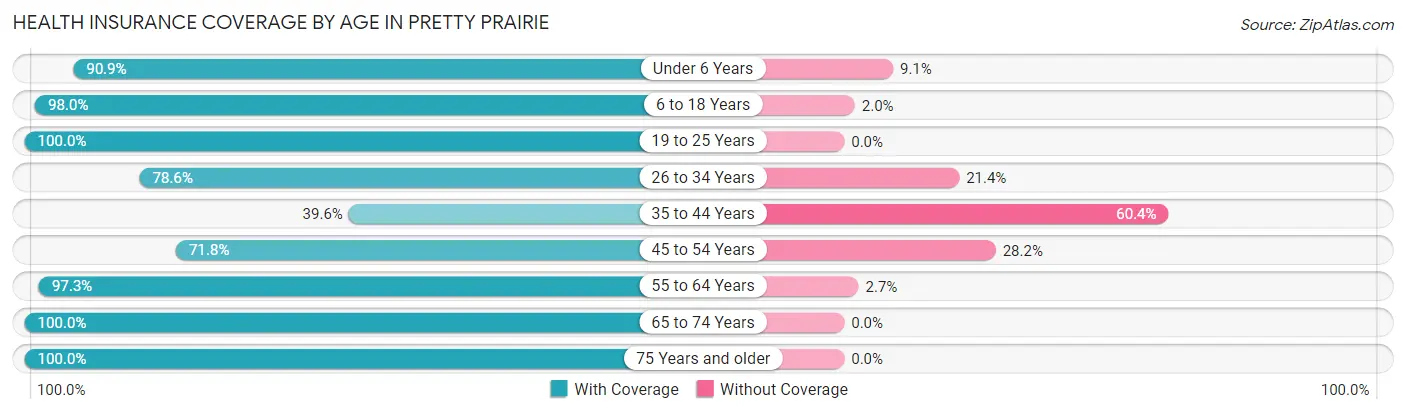
| Age Bracket | With Coverage | Without Coverage |
| Under 6 Years | 30 (90.9%) | 3 (9.1%) |
| 6 to 18 Years | 100 (98.0%) | 2 (2.0%) |
| 19 to 25 Years | 11 (100.0%) | 0 (0.0%) |
| 26 to 34 Years | 44 (78.6%) | 12 (21.4%) |
| 35 to 44 Years | 55 (39.6%) | 84 (60.4%) |
| 45 to 54 Years | 61 (71.8%) | 24 (28.2%) |
| 55 to 64 Years | 73 (97.3%) | 2 (2.7%) |
| 65 to 74 Years | 79 (100.0%) | 0 (0.0%) |
| 75 Years and older | 37 (100.0%) | 0 (0.0%) |
| Total | 490 (79.4%) | 127 (20.6%) |
Health Insurance Coverage by Citizenship Status in Pretty Prairie
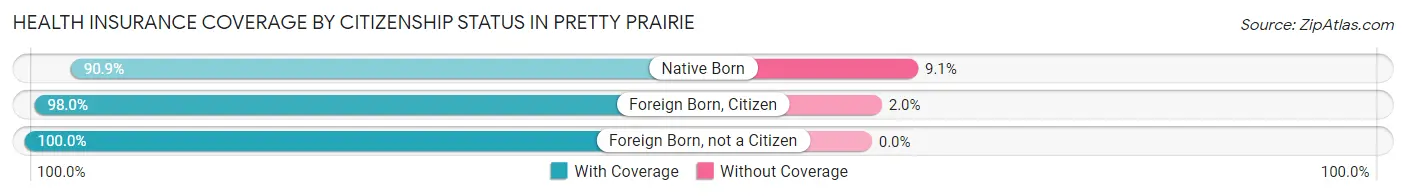
| Citizenship Status | With Coverage | Without Coverage |
| Native Born | 30 (90.9%) | 3 (9.1%) |
| Foreign Born, Citizen | 100 (98.0%) | 2 (2.0%) |
| Foreign Born, not a Citizen | 11 (100.0%) | 0 (0.0%) |
Health Insurance Coverage by Household Income in Pretty Prairie
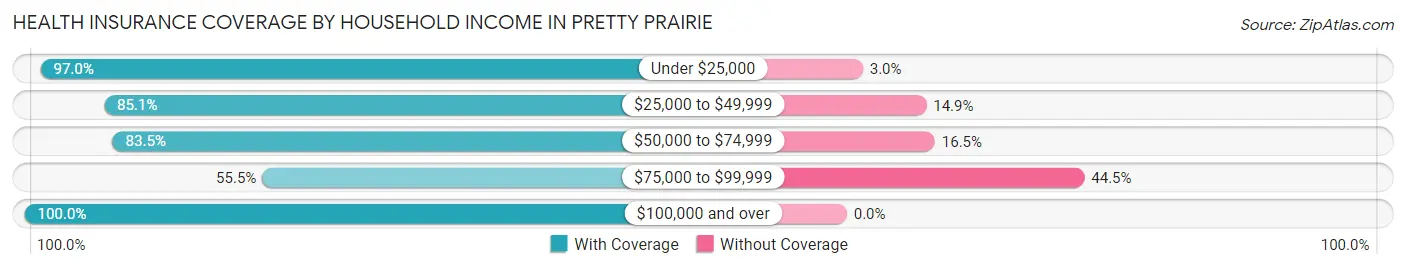
| Household Income | With Coverage | Without Coverage |
| Under $25,000 | 65 (97.0%) | 2 (3.0%) |
| $25,000 to $49,999 | 120 (85.1%) | 21 (14.9%) |
| $50,000 to $74,999 | 86 (83.5%) | 17 (16.5%) |
| $75,000 to $99,999 | 96 (55.5%) | 77 (44.5%) |
| $100,000 and over | 99 (100.0%) | 0 (0.0%) |
Public vs Private Health Insurance Coverage by Age in Pretty Prairie
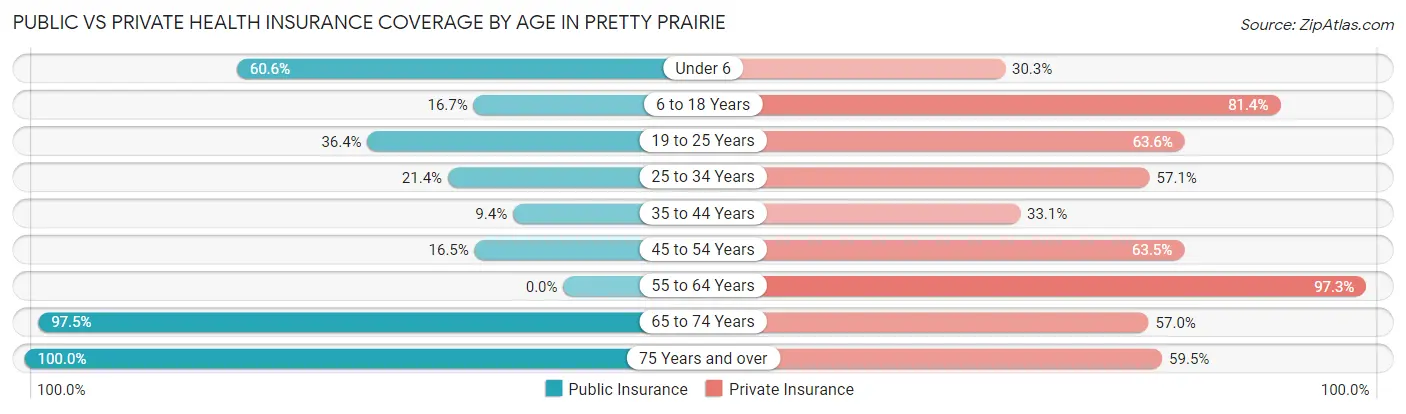
| Age Bracket | Public Insurance | Private Insurance |
| Under 6 | 20 (60.6%) | 10 (30.3%) |
| 6 to 18 Years | 17 (16.7%) | 83 (81.4%) |
| 19 to 25 Years | 4 (36.4%) | 7 (63.6%) |
| 25 to 34 Years | 12 (21.4%) | 32 (57.1%) |
| 35 to 44 Years | 13 (9.3%) | 46 (33.1%) |
| 45 to 54 Years | 14 (16.5%) | 54 (63.5%) |
| 55 to 64 Years | 0 (0.0%) | 73 (97.3%) |
| 65 to 74 Years | 77 (97.5%) | 45 (57.0%) |
| 75 Years and over | 37 (100.0%) | 22 (59.5%) |
| Total | 194 (31.4%) | 372 (60.3%) |
Disability Status by Sex by Age in Pretty Prairie
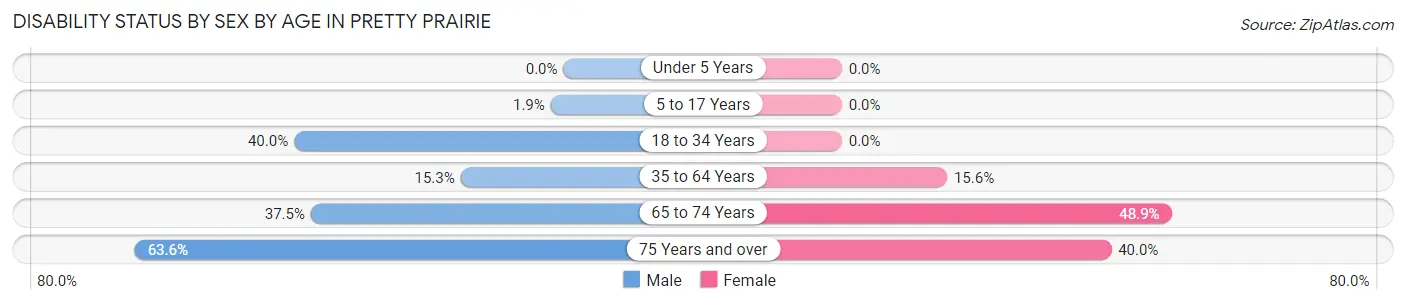
| Age Bracket | Male | Female |
| Under 5 Years | 0 (0.0%) | 0 (0.0%) |
| 5 to 17 Years | 1 (1.9%) | 0 (0.0%) |
| 18 to 34 Years | 12 (40.0%) | 0 (0.0%) |
| 35 to 64 Years | 31 (15.3%) | 15 (15.6%) |
| 65 to 74 Years | 12 (37.5%) | 23 (48.9%) |
| 75 Years and over | 14 (63.6%) | 6 (40.0%) |
Disability Class by Sex by Age in Pretty Prairie
Disability Class: Hearing Difficulty
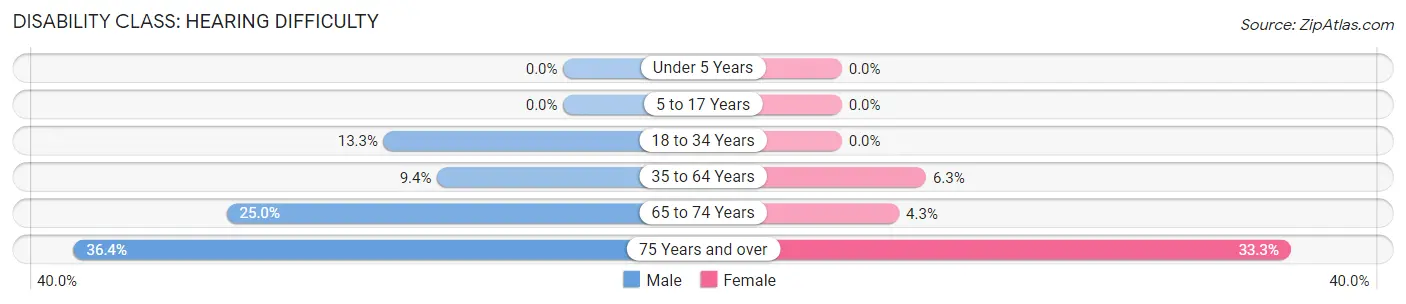
| Age Bracket | Male | Female |
| Under 5 Years | 0 (0.0%) | 0 (0.0%) |
| 5 to 17 Years | 0 (0.0%) | 0 (0.0%) |
| 18 to 34 Years | 4 (13.3%) | 0 (0.0%) |
| 35 to 64 Years | 19 (9.4%) | 6 (6.2%) |
| 65 to 74 Years | 8 (25.0%) | 2 (4.3%) |
| 75 Years and over | 8 (36.4%) | 5 (33.3%) |
Disability Class: Vision Difficulty
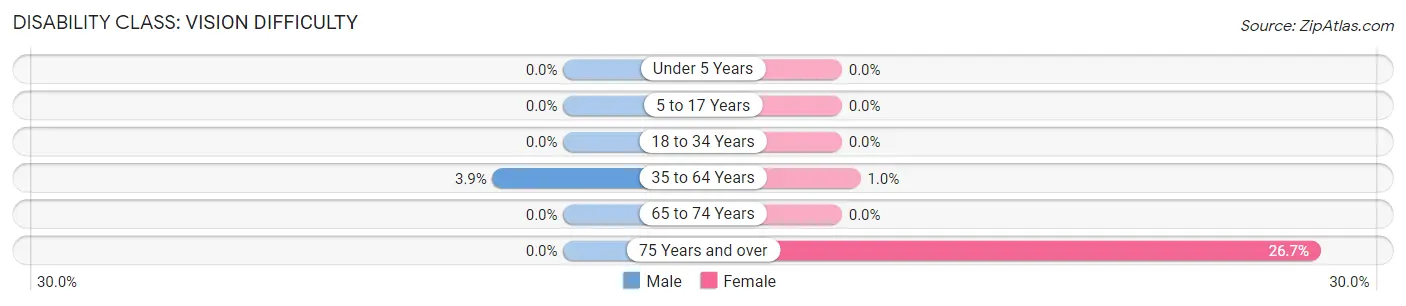
| Age Bracket | Male | Female |
| Under 5 Years | 0 (0.0%) | 0 (0.0%) |
| 5 to 17 Years | 0 (0.0%) | 0 (0.0%) |
| 18 to 34 Years | 0 (0.0%) | 0 (0.0%) |
| 35 to 64 Years | 8 (3.9%) | 1 (1.0%) |
| 65 to 74 Years | 0 (0.0%) | 0 (0.0%) |
| 75 Years and over | 0 (0.0%) | 4 (26.7%) |
Disability Class: Cognitive Difficulty
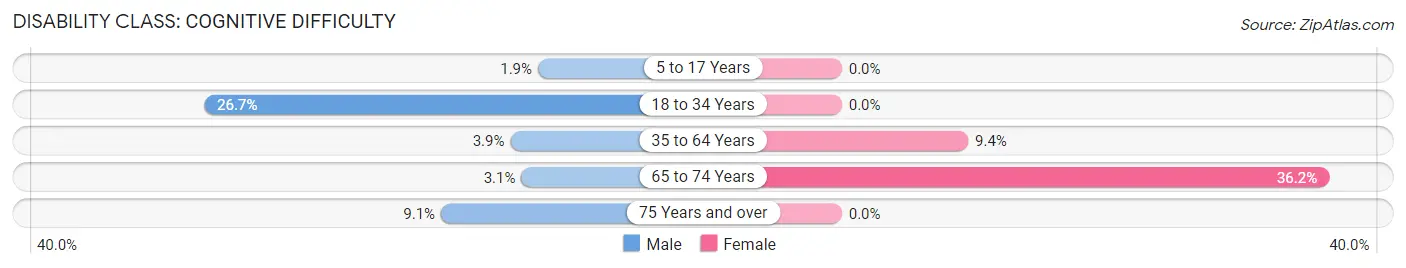
| Age Bracket | Male | Female |
| 5 to 17 Years | 1 (1.9%) | 0 (0.0%) |
| 18 to 34 Years | 8 (26.7%) | 0 (0.0%) |
| 35 to 64 Years | 8 (3.9%) | 9 (9.4%) |
| 65 to 74 Years | 1 (3.1%) | 17 (36.2%) |
| 75 Years and over | 2 (9.1%) | 0 (0.0%) |
Disability Class: Ambulatory Difficulty
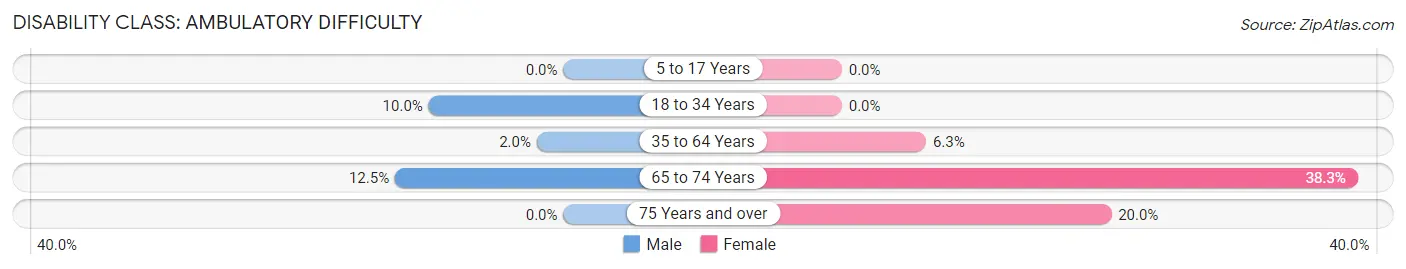
| Age Bracket | Male | Female |
| 5 to 17 Years | 0 (0.0%) | 0 (0.0%) |
| 18 to 34 Years | 3 (10.0%) | 0 (0.0%) |
| 35 to 64 Years | 4 (2.0%) | 6 (6.2%) |
| 65 to 74 Years | 4 (12.5%) | 18 (38.3%) |
| 75 Years and over | 0 (0.0%) | 3 (20.0%) |
Disability Class: Self-Care Difficulty
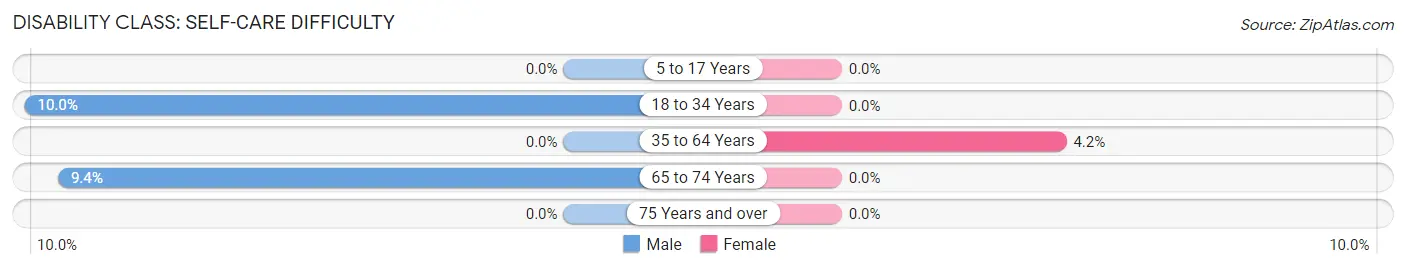
| Age Bracket | Male | Female |
| 5 to 17 Years | 0 (0.0%) | 0 (0.0%) |
| 18 to 34 Years | 3 (10.0%) | 0 (0.0%) |
| 35 to 64 Years | 0 (0.0%) | 4 (4.2%) |
| 65 to 74 Years | 3 (9.4%) | 0 (0.0%) |
| 75 Years and over | 0 (0.0%) | 0 (0.0%) |
Technology Access in Pretty Prairie
Computing Device Access in Pretty Prairie
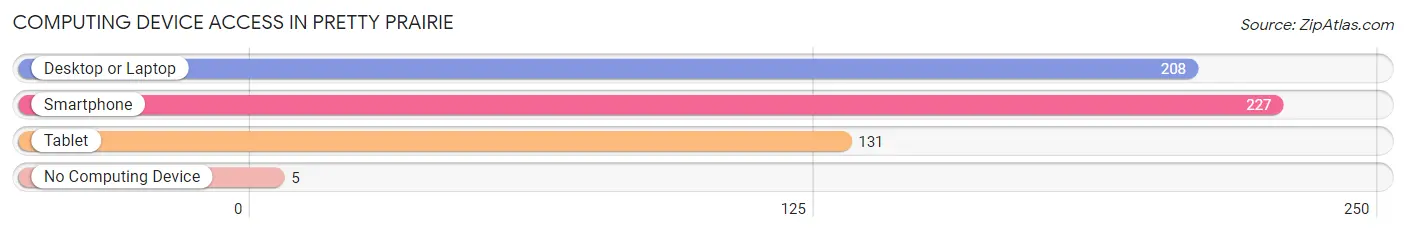
| Device Type | # Households | % Households |
| Desktop or Laptop | 208 | 83.2% |
| Smartphone | 227 | 90.8% |
| Tablet | 131 | 52.4% |
| No Computing Device | 5 | 2.0% |
| Total | 250 | 100.0% |
Internet Access in Pretty Prairie
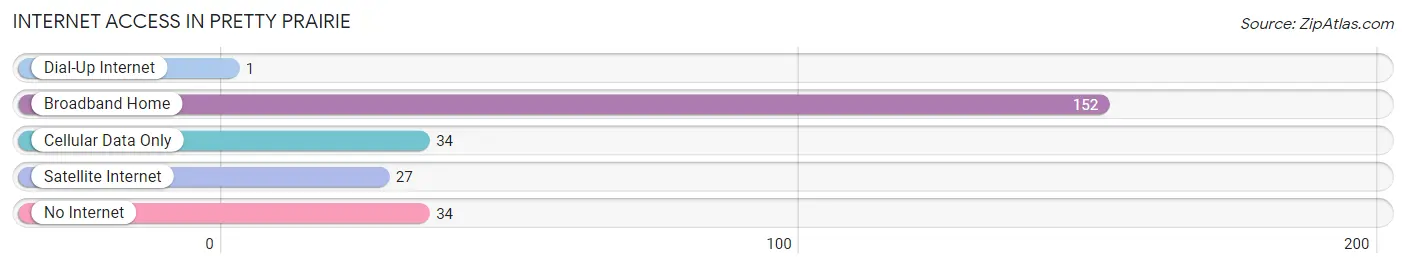
| Internet Type | # Households | % Households |
| Dial-Up Internet | 1 | 0.4% |
| Broadband Home | 152 | 60.8% |
| Cellular Data Only | 34 | 13.6% |
| Satellite Internet | 27 | 10.8% |
| No Internet | 34 | 13.6% |
| Total | 250 | 100.0% |
Pretty Prairie Summary
History
Pretty Prairie, Kansas is a small town located in Reno County, Kansas. It was founded in 1887 by a group of settlers from Indiana. The town was named after the nearby Pretty Prairie Creek, which was named by the Native Americans who lived in the area. The town was originally a farming community, but it has since grown to include a variety of businesses and services.
The first settlers in Pretty Prairie were mostly farmers, but the town soon became a hub for the surrounding area. In the early 1900s, the town was home to a variety of businesses, including a bank, a hotel, a general store, a blacksmith, a livery stable, a post office, and a school. The town also had a newspaper, the Pretty Prairie Herald, which was published from 1902 to 1910.
In the 1920s, the town began to experience a period of growth. The population increased from around 500 in 1920 to over 1,000 in 1930. During this time, the town was home to a variety of businesses, including a movie theater, a bowling alley, a drug store, a hardware store, and a variety of other stores.
In the 1950s, the town experienced a period of decline. Many of the businesses closed, and the population decreased to around 500. However, in the late 1970s, the town began to experience a period of revitalization. The population increased to over 1,000, and new businesses opened, including a grocery store, a restaurant, and a gas station.
Geography
Pretty Prairie is located in Reno County, Kansas, about 25 miles northwest of Wichita. The town is situated on the banks of Pretty Prairie Creek, which flows through the town and into the Arkansas River. The town is located in the Great Plains region of the United States, and the climate is characterized by hot summers and cold winters.
The town covers an area of 1.2 square miles, and the elevation is 1,541 feet above sea level. The town is located in the Central Time Zone, and the zip code is 67570.
Economy
Pretty Prairie is a small town with a population of around 1,000 people. The town is home to a variety of businesses, including a grocery store, a restaurant, a gas station, a hardware store, and a variety of other stores. The town is also home to a variety of agricultural businesses, including cattle ranches, grain elevators, and feed mills.
The town is also home to a variety of manufacturing businesses, including a furniture factory, a plastics factory, and a metal fabrication plant. The town is also home to a variety of service businesses, including a bank, a post office, and a variety of other businesses.
Demographics
As of the 2010 census, the population of Pretty Prairie was 1,039. The racial makeup of the town was 97.3% White, 0.3% African American, 0.2% Native American, 0.2% Asian, 0.1% Pacific Islander, 0.7% from other races, and 1.3% from two or more races. Hispanic or Latino of any race were 2.2% of the population.
The median income for a household in the town was $41,250, and the median income for a family was $45,000. The per capita income for the town was $19,845. About 8.3% of families and 10.2% of the population were below the poverty line, including 14.3% of those under age 18 and 6.3% of those age 65 or over.
Common Questions
What is Per Capita Income in Pretty Prairie?
Per Capita income in Pretty Prairie is $30,257.
What is the Median Family Income in Pretty Prairie?
Median Family Income in Pretty Prairie is $56,667.
What is the Median Household income in Pretty Prairie?
Median Household Income in Pretty Prairie is $55,750.
What is Income or Wage Gap in Pretty Prairie?
Income or Wage Gap in Pretty Prairie is 23.2%.
Women in Pretty Prairie earn 76.8 cents for every dollar earned by a man.
What is Inequality or Gini Index in Pretty Prairie?
Inequality or Gini Index in Pretty Prairie is 0.37.
What is the Total Population of Pretty Prairie?
Total Population of Pretty Prairie is 638.
What is the Total Male Population of Pretty Prairie?
Total Male Population of Pretty Prairie is 366.
What is the Total Female Population of Pretty Prairie?
Total Female Population of Pretty Prairie is 272.
What is the Ratio of Males per 100 Females in Pretty Prairie?
There are 134.56 Males per 100 Females in Pretty Prairie.
What is the Ratio of Females per 100 Males in Pretty Prairie?
There are 74.32 Females per 100 Males in Pretty Prairie.
What is the Median Population Age in Pretty Prairie?
Median Population Age in Pretty Prairie is 42.5 Years.
What is the Average Family Size in Pretty Prairie
Average Family Size in Pretty Prairie is 3.0 People.
What is the Average Household Size in Pretty Prairie
Average Household Size in Pretty Prairie is 2.3 People.
How Large is the Labor Force in Pretty Prairie?
There are 294 People in the Labor Forcein in Pretty Prairie.
What is the Percentage of People in the Labor Force in Pretty Prairie?
57.8% of People are in the Labor Force in Pretty Prairie.
What is the Unemployment Rate in Pretty Prairie?
Unemployment Rate in Pretty Prairie is 1.0%.