Marysville, KS Map & Demographics
Marysville Map
Marysville Overview
$35,131
PER CAPITA INCOME
$79,574
AVG FAMILY INCOME
$53,424
AVG HOUSEHOLD INCOME
31.7%
WAGE / INCOME GAP [ % ]
68.3¢/ $1
WAGE / INCOME GAP [ $ ]
0.49
INEQUALITY / GINI INDEX
3,414
TOTAL POPULATION
1,733
MALE POPULATION
1,681
FEMALE POPULATION
103.09
MALES / 100 FEMALES
97.00
FEMALES / 100 MALES
38.8
MEDIAN AGE
3.2
AVG FAMILY SIZE
2.3
AVG HOUSEHOLD SIZE
1,656
LABOR FORCE [ PEOPLE ]
65.3%
PERCENT IN LABOR FORCE
3.1%
UNEMPLOYMENT RATE
Marysville Zip Codes
Marysville Area Codes
Income in Marysville
Income Overview in Marysville
Per Capita Income in Marysville is $35,131, while median incomes of families and households are $79,574 and $53,424 respectively.
| Characteristic | Number | Measure |
| Per Capita Income | 3,414 | $35,131 |
| Median Family Income | 799 | $79,574 |
| Mean Family Income | 799 | $109,042 |
| Median Household Income | 1,443 | $53,424 |
| Mean Household Income | 1,443 | $78,584 |
| Income Deficit | 799 | $0 |
| Wage / Income Gap (%) | 3,414 | 31.73% |
| Wage / Income Gap ($) | 3,414 | 68.27¢ per $1 |
| Gini / Inequality Index | 3,414 | 0.49 |
Earnings by Sex in Marysville
Average Earnings in Marysville are $41,172, $47,379 for men and $32,344 for women, a difference of 31.7%.
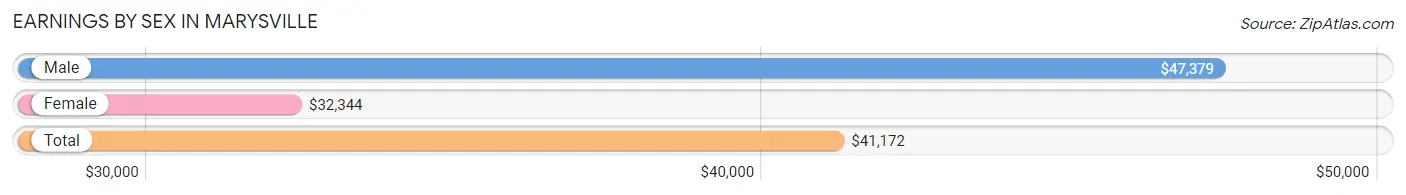
| Sex | Number | Average Earnings |
| Male | 901 (52.2%) | $47,379 |
| Female | 824 (47.8%) | $32,344 |
| Total | 1,725 (100.0%) | $41,172 |
Earnings by Sex by Income Bracket in Marysville
The most common earnings brackets in Marysville are $100,000+ for men (187 | 20.7%) and $25,000 to $29,999 for women (99 | 12.0%).
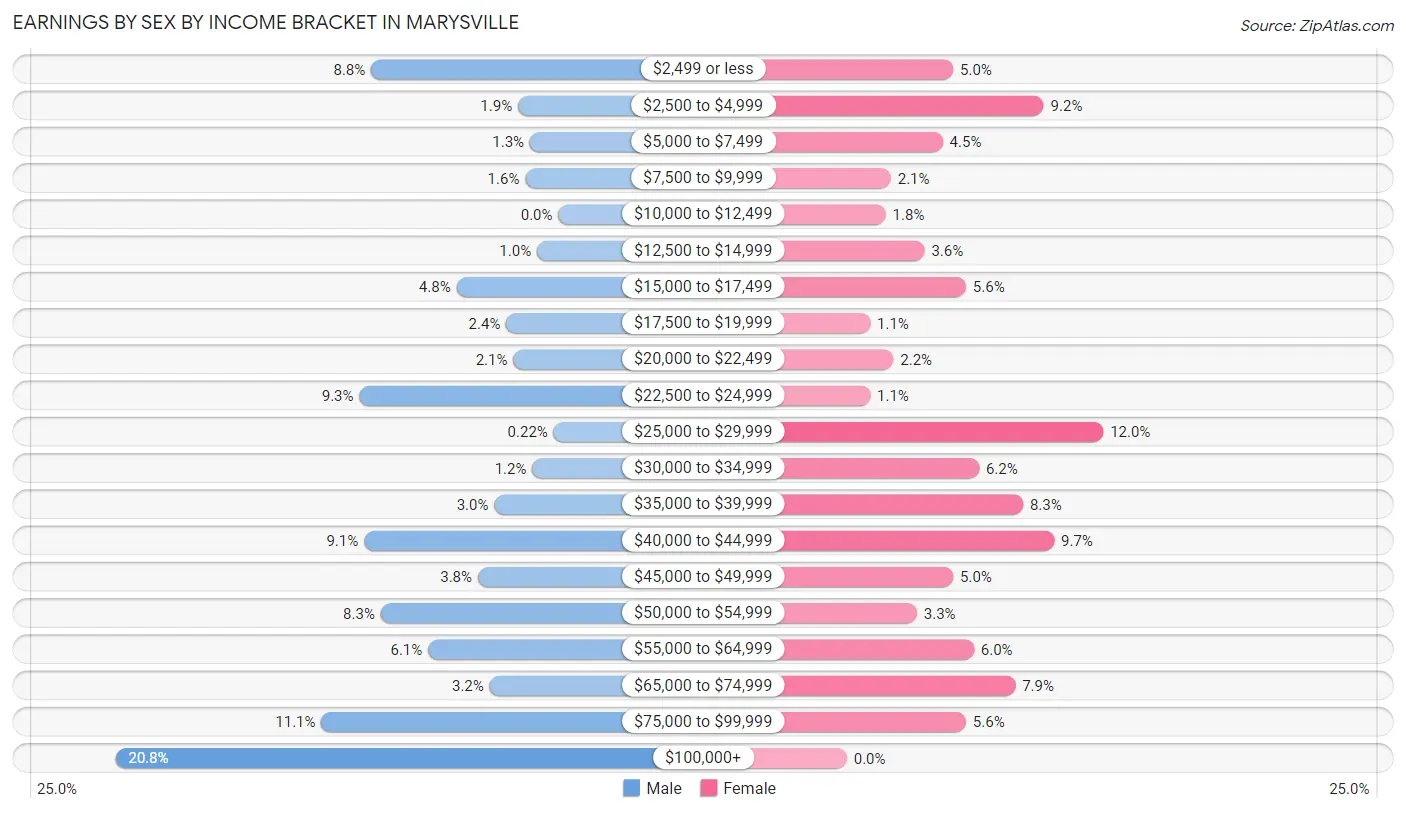
| Income | Male | Female |
| $2,499 or less | 79 (8.8%) | 41 (5.0%) |
| $2,500 to $4,999 | 17 (1.9%) | 76 (9.2%) |
| $5,000 to $7,499 | 12 (1.3%) | 37 (4.5%) |
| $7,500 to $9,999 | 14 (1.5%) | 17 (2.1%) |
| $10,000 to $12,499 | 0 (0.0%) | 15 (1.8%) |
| $12,500 to $14,999 | 9 (1.0%) | 30 (3.6%) |
| $15,000 to $17,499 | 43 (4.8%) | 46 (5.6%) |
| $17,500 to $19,999 | 22 (2.4%) | 9 (1.1%) |
| $20,000 to $22,499 | 19 (2.1%) | 18 (2.2%) |
| $22,500 to $24,999 | 84 (9.3%) | 9 (1.1%) |
| $25,000 to $29,999 | 2 (0.2%) | 99 (12.0%) |
| $30,000 to $34,999 | 11 (1.2%) | 51 (6.2%) |
| $35,000 to $39,999 | 27 (3.0%) | 68 (8.3%) |
| $40,000 to $44,999 | 82 (9.1%) | 80 (9.7%) |
| $45,000 to $49,999 | 34 (3.8%) | 41 (5.0%) |
| $50,000 to $54,999 | 75 (8.3%) | 27 (3.3%) |
| $55,000 to $64,999 | 55 (6.1%) | 49 (5.9%) |
| $65,000 to $74,999 | 29 (3.2%) | 65 (7.9%) |
| $75,000 to $99,999 | 100 (11.1%) | 46 (5.6%) |
| $100,000+ | 187 (20.7%) | 0 (0.0%) |
| Total | 901 (100.0%) | 824 (100.0%) |
Earnings by Sex by Educational Attainment in Marysville
Average earnings in Marysville are $56,711 for men and $35,167 for women, a difference of 38.0%. Men with an educational attainment of bachelor's degree enjoy the highest average annual earnings of $112,591, while those with less than high school education earn the least with $2,499. Women with an educational attainment of graduate degree earn the most with the average annual earnings of $53,553, while those with high school diploma education have the smallest earnings of $25,144.
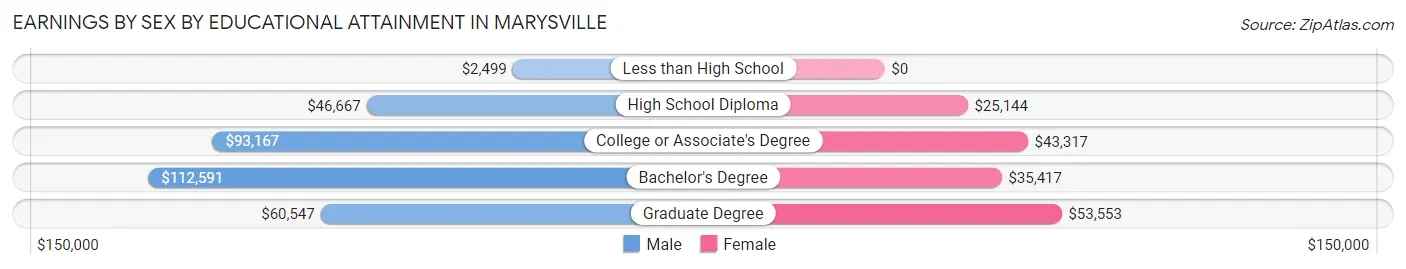
| Educational Attainment | Male Income | Female Income |
| Less than High School | $2,499 | $0 |
| High School Diploma | $46,667 | $25,144 |
| College or Associate's Degree | $93,167 | $43,317 |
| Bachelor's Degree | $112,591 | $35,417 |
| Graduate Degree | $60,547 | $53,553 |
| Total | $56,711 | $35,167 |
Family Income in Marysville
Family Income Brackets in Marysville
According to the Marysville family income data, there are 168 families falling into the $100,000 to $149,999 income range, which is the most common income bracket and makes up 21.0% of all families. Conversely, the less than $10,000 income bracket is the least frequent group with only 8 families (1.0%) belonging to this category.
| Income Bracket | # Families | % Families |
| Less than $10,000 | 8 | 1.0% |
| $10,000 to $14,999 | 31 | 3.9% |
| $15,000 to $24,999 | 72 | 9.0% |
| $25,000 to $34,999 | 51 | 6.4% |
| $35,000 to $49,999 | 67 | 8.4% |
| $50,000 to $74,999 | 134 | 16.8% |
| $75,000 to $99,999 | 91 | 11.4% |
| $100,000 to $149,999 | 168 | 21.0% |
| $150,000 to $199,999 | 96 | 12.0% |
| $200,000+ | 81 | 10.1% |
Family Income by Famaliy Size in Marysville
3-person families (88 | 11.0%) account for the highest median family income in Marysville with $116,607 per family, while 3-person families (88 | 11.0%) have the highest median income of $38,869 per family member.
| Income Bracket | # Families | Median Income |
| 2-Person Families | 442 (55.3%) | $65,625 |
| 3-Person Families | 88 (11.0%) | $116,607 |
| 4-Person Families | 124 (15.5%) | $92,375 |
| 5-Person Families | 115 (14.4%) | $79,716 |
| 6-Person Families | 30 (3.7%) | $0 |
| 7+ Person Families | 0 (0.0%) | $0 |
| Total | 799 (100.0%) | $79,574 |
Family Income by Number of Earners in Marysville
| Number of Earners | # Families | Median Income |
| No Earners | 106 (13.3%) | $0 |
| 1 Earner | 239 (29.9%) | $37,266 |
| 2 Earners | 355 (44.4%) | $117,232 |
| 3+ Earners | 99 (12.4%) | $148,393 |
| Total | 799 (100.0%) | $79,574 |
Household Income in Marysville
Household Income Brackets in Marysville
With 214 households falling in the category, the $100,000 to $149,999 income range is the most frequent in Marysville, accounting for 14.8% of all households. In contrast, only 78 households (5.4%) fall into the less than $10,000 income bracket, making it the least populous group.
| Income Bracket | # Households | % Households |
| Less than $10,000 | 78 | 5.4% |
| $10,000 to $14,999 | 149 | 10.3% |
| $15,000 to $24,999 | 100 | 6.9% |
| $25,000 to $34,999 | 175 | 12.1% |
| $35,000 to $49,999 | 190 | 13.2% |
| $50,000 to $74,999 | 188 | 13.0% |
| $75,000 to $99,999 | 175 | 12.1% |
| $100,000 to $149,999 | 214 | 14.8% |
| $150,000 to $199,999 | 97 | 6.7% |
| $200,000+ | 81 | 5.6% |
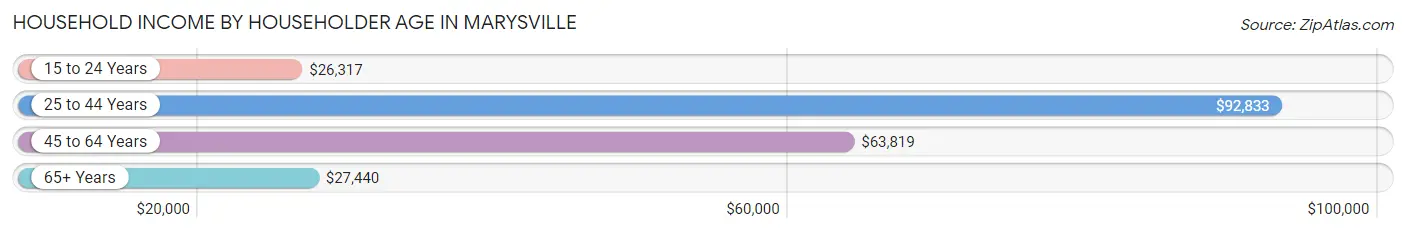
Household Income by Householder Age in Marysville
The median household income in Marysville is $53,424, with the highest median household income of $92,833 found in the 25 to 44 years age bracket for the primary householder. A total of 404 households (28.0%) fall into this category. Meanwhile, the 15 to 24 years age bracket for the primary householder has the lowest median household income of $26,317, with 83 households (5.8%) in this group.
| Income Bracket | # Households | Median Income |
| 15 to 24 Years | 83 (5.8%) | $26,317 |
| 25 to 44 Years | 404 (28.0%) | $92,833 |
| 45 to 64 Years | 458 (31.7%) | $63,819 |
| 65+ Years | 498 (34.5%) | $27,440 |
| Total | 1,443 (100.0%) | $53,424 |
Poverty in Marysville
Income Below Poverty by Sex and Age in Marysville
With 12.6% poverty level for males and 14.0% for females among the residents of Marysville, 75 year old and over males and 12 to 14 year old females are the most vulnerable to poverty, with 78 males (55.3%) and 47 females (34.8%) in their respective age groups living below the poverty level.
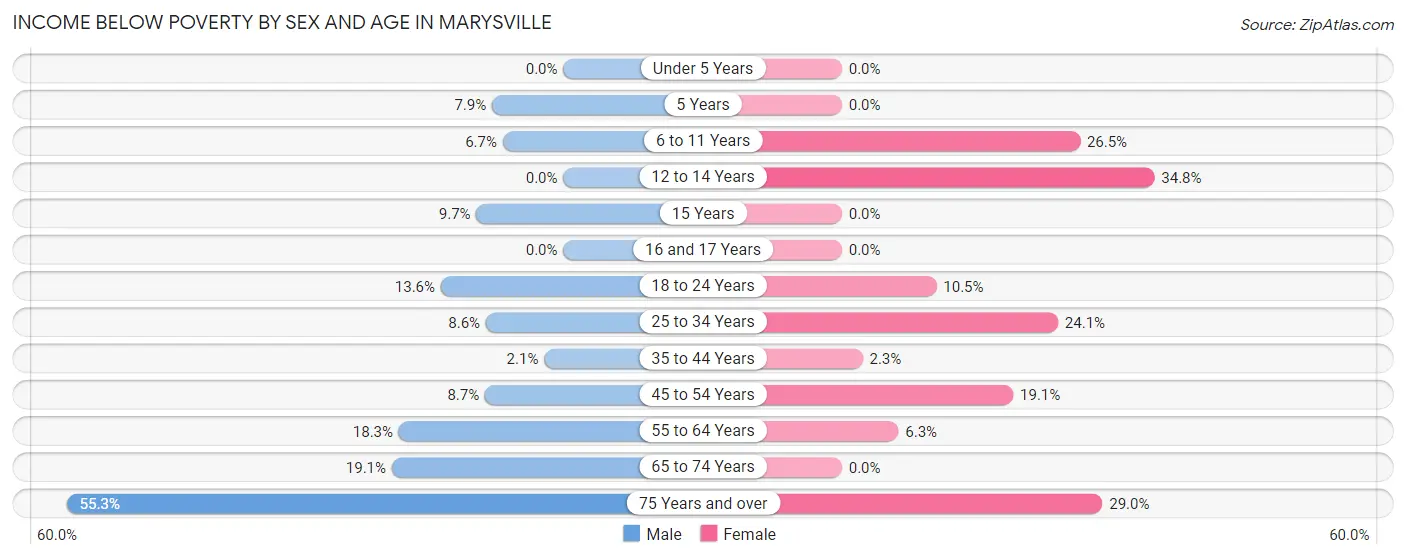
| Age Bracket | Male | Female |
| Under 5 Years | 0 (0.0%) | 0 (0.0%) |
| 5 Years | 5 (7.9%) | 0 (0.0%) |
| 6 to 11 Years | 6 (6.7%) | 48 (26.5%) |
| 12 to 14 Years | 0 (0.0%) | 47 (34.8%) |
| 15 Years | 6 (9.7%) | 0 (0.0%) |
| 16 and 17 Years | 0 (0.0%) | 0 (0.0%) |
| 18 to 24 Years | 21 (13.6%) | 2 (10.5%) |
| 25 to 34 Years | 10 (8.6%) | 26 (24.1%) |
| 35 to 44 Years | 6 (2.1%) | 6 (2.3%) |
| 45 to 54 Years | 13 (8.7%) | 33 (19.1%) |
| 55 to 64 Years | 35 (18.3%) | 16 (6.3%) |
| 65 to 74 Years | 34 (19.1%) | 0 (0.0%) |
| 75 Years and over | 78 (55.3%) | 47 (29.0%) |
| Total | 214 (12.6%) | 225 (14.0%) |
Income Above Poverty by Sex and Age in Marysville
According to the poverty statistics in Marysville, males aged under 5 years and females aged under 5 years are the age groups that are most secure financially, with 100.0% of males and 100.0% of females in these age groups living above the poverty line.

| Age Bracket | Male | Female |
| Under 5 Years | 105 (100.0%) | 94 (100.0%) |
| 5 Years | 58 (92.1%) | 0 (0.0%) |
| 6 to 11 Years | 83 (93.3%) | 133 (73.5%) |
| 12 to 14 Years | 133 (100.0%) | 88 (65.2%) |
| 15 Years | 56 (90.3%) | 16 (100.0%) |
| 16 and 17 Years | 37 (100.0%) | 61 (100.0%) |
| 18 to 24 Years | 133 (86.4%) | 17 (89.5%) |
| 25 to 34 Years | 106 (91.4%) | 82 (75.9%) |
| 35 to 44 Years | 276 (97.9%) | 254 (97.7%) |
| 45 to 54 Years | 136 (91.3%) | 140 (80.9%) |
| 55 to 64 Years | 156 (81.7%) | 238 (93.7%) |
| 65 to 74 Years | 144 (80.9%) | 146 (100.0%) |
| 75 Years and over | 63 (44.7%) | 115 (71.0%) |
| Total | 1,486 (87.4%) | 1,384 (86.0%) |
Income Below Poverty Among Married-Couple Families in Marysville
The poverty statistics for married-couple families in Marysville show that 1.3% or 8 of the total 594 families live below the poverty line. Families with no children have the highest poverty rate of 2.5%, comprising of 8 families. On the other hand, families with 1 or 2 children have the lowest poverty rate of 0.0%, which includes 0 families.
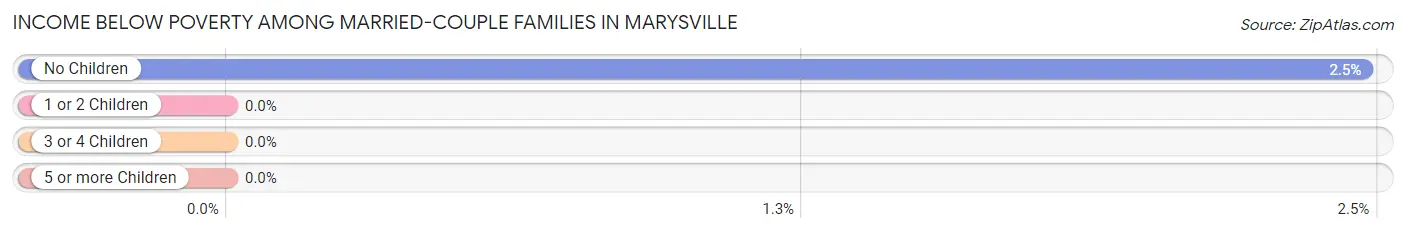
| Children | Above Poverty | Below Poverty |
| No Children | 316 (97.5%) | 8 (2.5%) |
| 1 or 2 Children | 143 (100.0%) | 0 (0.0%) |
| 3 or 4 Children | 127 (100.0%) | 0 (0.0%) |
| 5 or more Children | 0 (0.0%) | 0 (0.0%) |
| Total | 586 (98.7%) | 8 (1.3%) |
Income Below Poverty Among Single-Parent Households in Marysville
According to the poverty data in Marysville, 20.0% or 24 single-father households and 34.1% or 29 single-mother households are living below the poverty line. Among single-father households, those with no children have the highest poverty rate, with 24 households (100.0%) experiencing poverty. Likewise, among single-mother households, those with 3 or 4 children have the highest poverty rate, with 22 households (100.0%) falling below the poverty line.
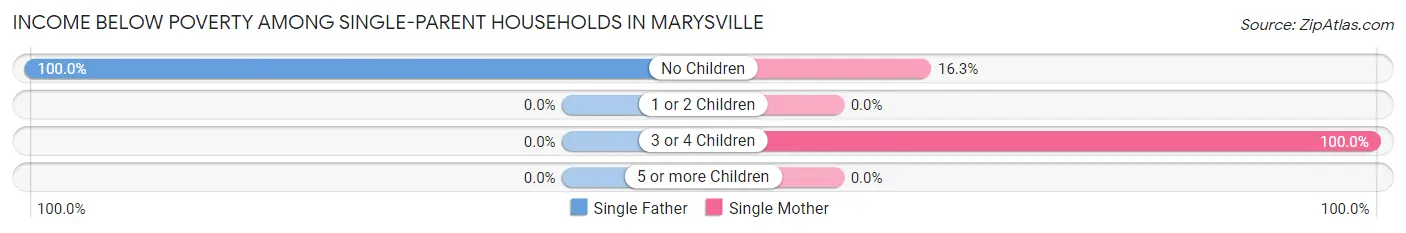
| Children | Single Father | Single Mother |
| No Children | 24 (100.0%) | 7 (16.3%) |
| 1 or 2 Children | 0 (0.0%) | 0 (0.0%) |
| 3 or 4 Children | 0 (0.0%) | 22 (100.0%) |
| 5 or more Children | 0 (0.0%) | 0 (0.0%) |
| Total | 24 (20.0%) | 29 (34.1%) |
Income Below Poverty Among Married-Couple vs Single-Parent Households in Marysville
The poverty data for Marysville shows that 8 of the married-couple family households (1.3%) and 53 of the single-parent households (25.9%) are living below the poverty level. Within the married-couple family households, those with no children have the highest poverty rate, with 8 households (2.5%) falling below the poverty line. Among the single-parent households, those with no children have the highest poverty rate, with 31 household (46.3%) living below poverty.
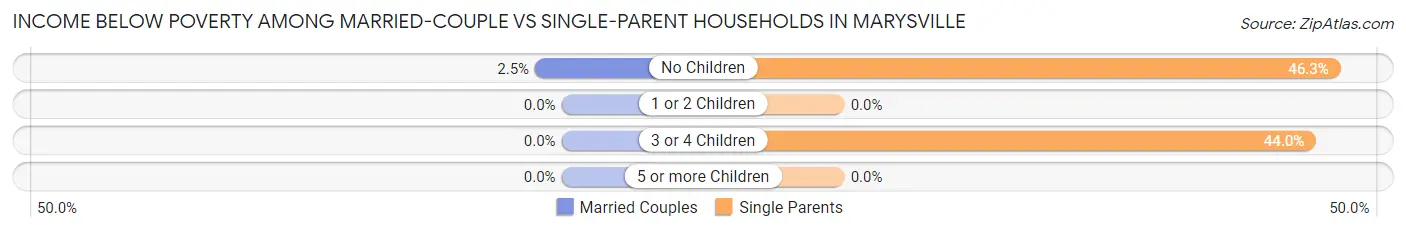
| Children | Married-Couple Families | Single-Parent Households |
| No Children | 8 (2.5%) | 31 (46.3%) |
| 1 or 2 Children | 0 (0.0%) | 0 (0.0%) |
| 3 or 4 Children | 0 (0.0%) | 22 (44.0%) |
| 5 or more Children | 0 (0.0%) | 0 (0.0%) |
| Total | 8 (1.3%) | 53 (25.9%) |
Race in Marysville
The most populous races in Marysville are White / Caucasian (3,093 | 90.6%), Two or more Races (193 | 5.7%), and Hispanic or Latino (156 | 4.6%).
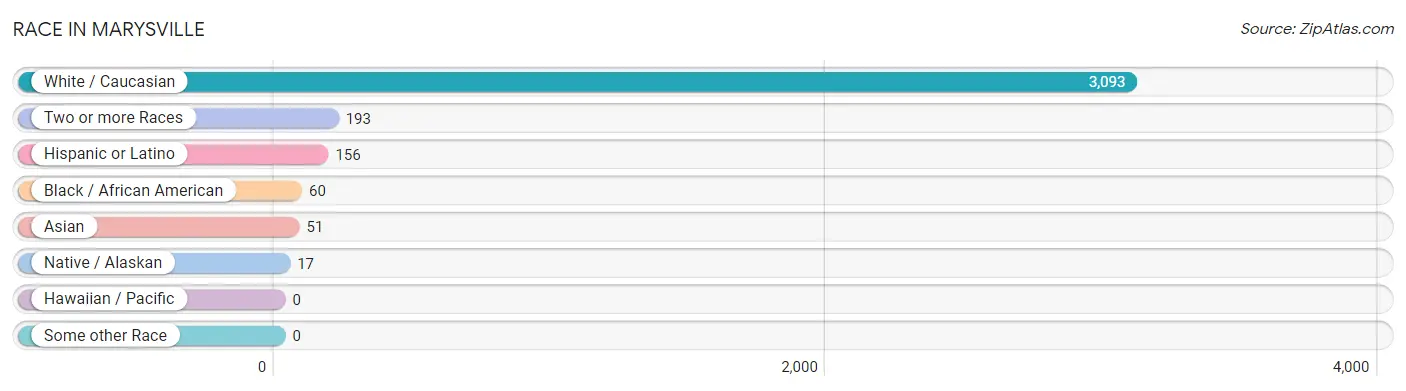
| Race | # Population | % Population |
| Asian | 51 | 1.5% |
| Black / African American | 60 | 1.8% |
| Hawaiian / Pacific | 0 | 0.0% |
| Hispanic or Latino | 156 | 4.6% |
| Native / Alaskan | 17 | 0.5% |
| White / Caucasian | 3,093 | 90.6% |
| Two or more Races | 193 | 5.7% |
| Some other Race | 0 | 0.0% |
| Total | 3,414 | 100.0% |
Ancestry in Marysville
The most populous ancestries reported in Marysville are German (1,398 | 40.9%), English (397 | 11.6%), Irish (331 | 9.7%), American (208 | 6.1%), and Swedish (143 | 4.2%), together accounting for 72.6% of all Marysville residents.
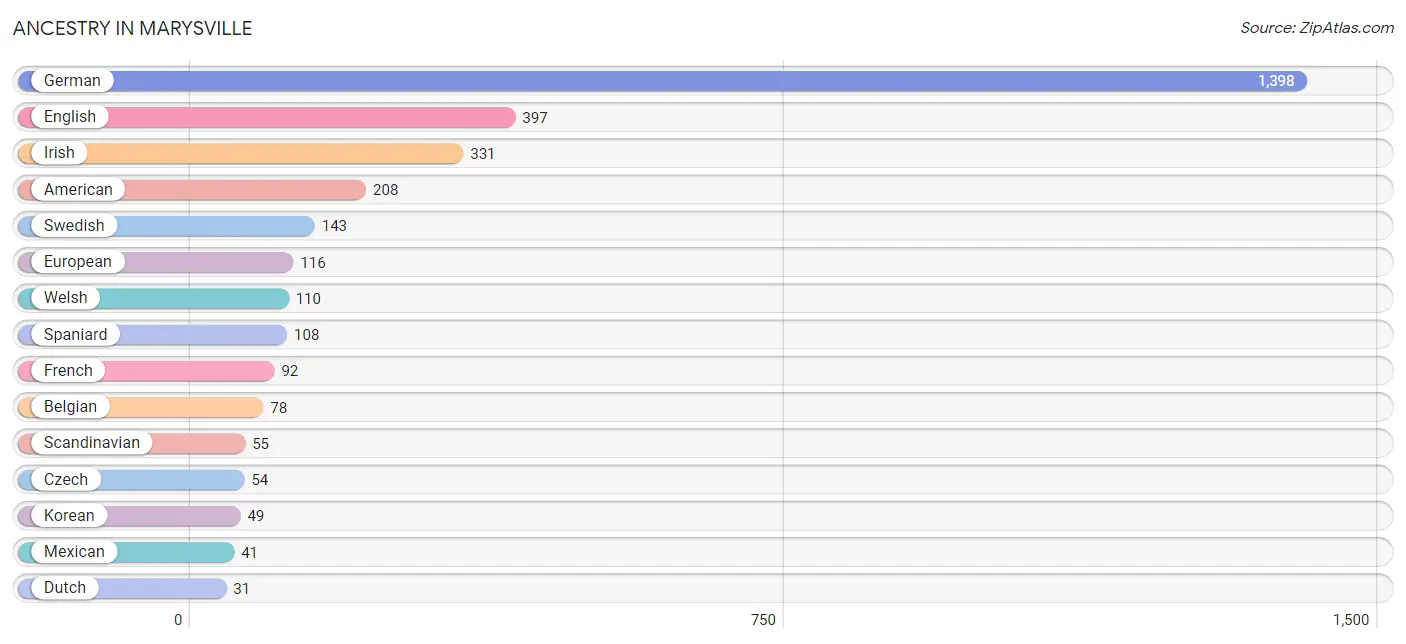
| Ancestry | # Population | % Population |
| American | 208 | 6.1% |
| Austrian | 8 | 0.2% |
| Belgian | 78 | 2.3% |
| Central American | 7 | 0.2% |
| Cherokee | 13 | 0.4% |
| Czech | 54 | 1.6% |
| Danish | 22 | 0.6% |
| Dutch | 31 | 0.9% |
| English | 397 | 11.6% |
| European | 116 | 3.4% |
| Finnish | 16 | 0.5% |
| French | 92 | 2.7% |
| French Canadian | 19 | 0.6% |
| German | 1,398 | 40.9% |
| Guatemalan | 7 | 0.2% |
| Irish | 331 | 9.7% |
| Korean | 49 | 1.4% |
| Mexican | 41 | 1.2% |
| Northern European | 17 | 0.5% |
| Norwegian | 14 | 0.4% |
| Polish | 16 | 0.5% |
| Russian | 30 | 0.9% |
| Scandinavian | 55 | 1.6% |
| Scotch-Irish | 16 | 0.5% |
| Spaniard | 108 | 3.2% |
| Sri Lankan | 2 | 0.1% |
| Swedish | 143 | 4.2% |
| Welsh | 110 | 3.2% | View All 28 Rows |
Immigrants in Marysville
The most numerous immigrant groups reported in Marysville came from Asia (50 | 1.5%), Central America (48 | 1.4%), Latin America (48 | 1.4%), Mexico (41 | 1.2%), and South Eastern Asia (32 | 0.9%), together accounting for 6.4% of all Marysville residents.
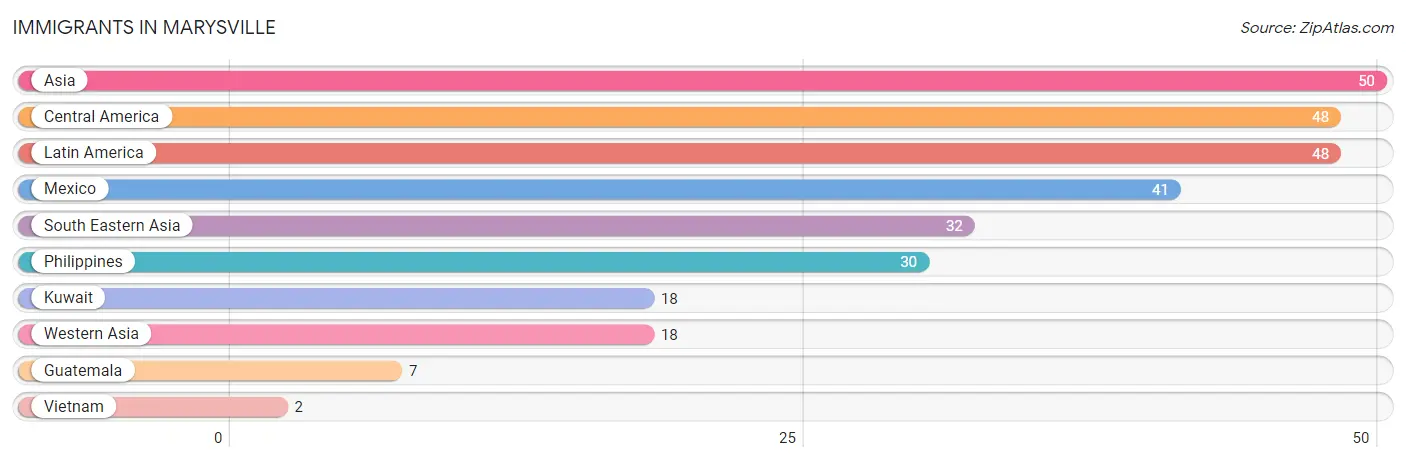
| Immigration Origin | # Population | % Population |
| Asia | 50 | 1.5% |
| Central America | 48 | 1.4% |
| Guatemala | 7 | 0.2% |
| Kuwait | 18 | 0.5% |
| Latin America | 48 | 1.4% |
| Mexico | 41 | 1.2% |
| Philippines | 30 | 0.9% |
| South Eastern Asia | 32 | 0.9% |
| Vietnam | 2 | 0.1% |
| Western Asia | 18 | 0.5% | View All 10 Rows |
Sex and Age in Marysville
Sex and Age in Marysville
The most populous age groups in Marysville are 10 to 14 Years (181 | 10.4%) for men and 35 to 39 Years (203 | 12.1%) for women.
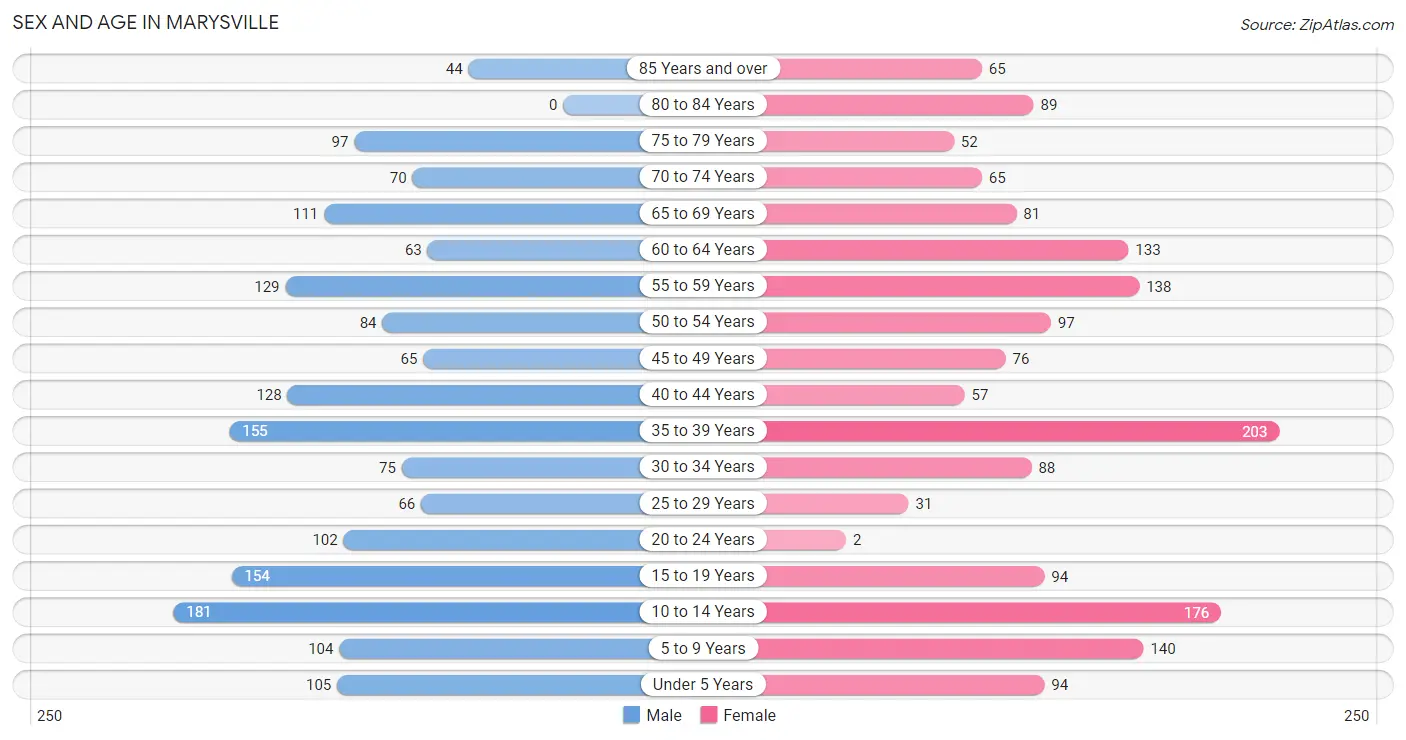
| Age Bracket | Male | Female |
| Under 5 Years | 105 (6.1%) | 94 (5.6%) |
| 5 to 9 Years | 104 (6.0%) | 140 (8.3%) |
| 10 to 14 Years | 181 (10.4%) | 176 (10.5%) |
| 15 to 19 Years | 154 (8.9%) | 94 (5.6%) |
| 20 to 24 Years | 102 (5.9%) | 2 (0.1%) |
| 25 to 29 Years | 66 (3.8%) | 31 (1.8%) |
| 30 to 34 Years | 75 (4.3%) | 88 (5.2%) |
| 35 to 39 Years | 155 (8.9%) | 203 (12.1%) |
| 40 to 44 Years | 128 (7.4%) | 57 (3.4%) |
| 45 to 49 Years | 65 (3.7%) | 76 (4.5%) |
| 50 to 54 Years | 84 (4.9%) | 97 (5.8%) |
| 55 to 59 Years | 129 (7.4%) | 138 (8.2%) |
| 60 to 64 Years | 63 (3.6%) | 133 (7.9%) |
| 65 to 69 Years | 111 (6.4%) | 81 (4.8%) |
| 70 to 74 Years | 70 (4.0%) | 65 (3.9%) |
| 75 to 79 Years | 97 (5.6%) | 52 (3.1%) |
| 80 to 84 Years | 0 (0.0%) | 89 (5.3%) |
| 85 Years and over | 44 (2.5%) | 65 (3.9%) |
| Total | 1,733 (100.0%) | 1,681 (100.0%) |
Families and Households in Marysville
Median Family Size in Marysville
The median family size in Marysville is 3.19 persons per family, with single female/mother families (85 | 10.6%) accounting for the largest median family size of 3.36 persons per family. On the other hand, single male/father families (120 | 15.0%) represent the smallest median family size with 2.41 persons per family.
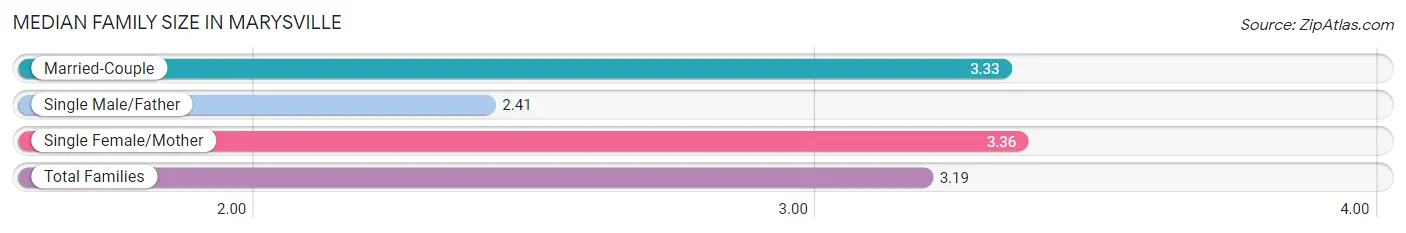
| Family Type | # Families | Family Size |
| Married-Couple | 594 (74.3%) | 3.33 |
| Single Male/Father | 120 (15.0%) | 2.41 |
| Single Female/Mother | 85 (10.6%) | 3.36 |
| Total Families | 799 (100.0%) | 3.19 |
Median Household Size in Marysville
The median household size in Marysville is 2.29 persons per household, with single female/mother households (85 | 5.9%) accounting for the largest median household size of 3.36 persons per household. non-family households (644 | 44.6%) represent the smallest median household size with 1.11 persons per household.
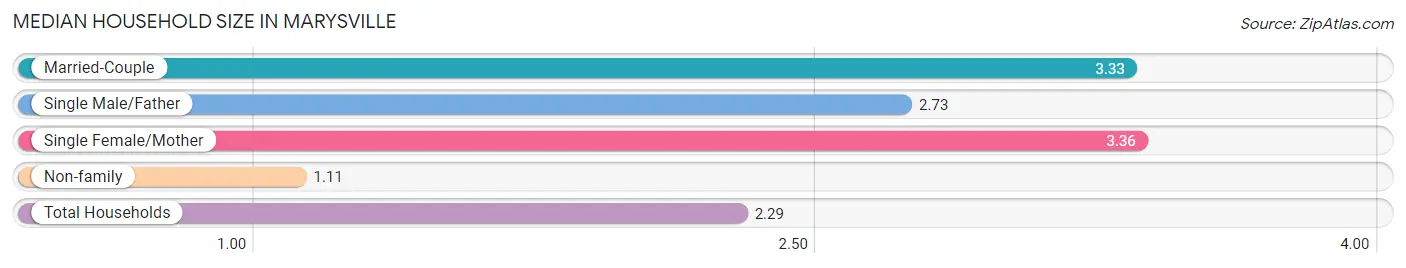
| Household Type | # Households | Household Size |
| Married-Couple | 594 (41.2%) | 3.33 |
| Single Male/Father | 120 (8.3%) | 2.73 |
| Single Female/Mother | 85 (5.9%) | 3.36 |
| Non-family | 644 (44.6%) | 1.11 |
| Total Households | 1,443 (100.0%) | 2.29 |
Household Size by Marriage Status in Marysville
Out of a total of 1,443 households in Marysville, 799 (55.4%) are family households, while 644 (44.6%) are nonfamily households. The most numerous type of family households are 2-person households, comprising 386, and the most common type of nonfamily households are 1-person households, comprising 590.
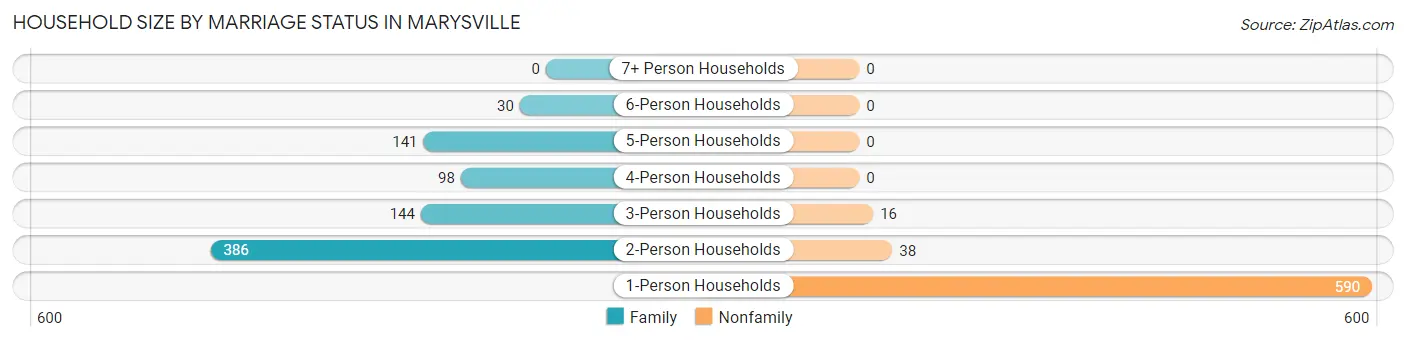
| Household Size | Family Households | Nonfamily Households |
| 1-Person Households | - | 590 (40.9%) |
| 2-Person Households | 386 (26.8%) | 38 (2.6%) |
| 3-Person Households | 144 (10.0%) | 16 (1.1%) |
| 4-Person Households | 98 (6.8%) | 0 (0.0%) |
| 5-Person Households | 141 (9.8%) | 0 (0.0%) |
| 6-Person Households | 30 (2.1%) | 0 (0.0%) |
| 7+ Person Households | 0 (0.0%) | 0 (0.0%) |
| Total | 799 (55.4%) | 644 (44.6%) |
Female Fertility in Marysville
Fertility by Age in Marysville
Average fertility rate in Marysville is 72.0 births per 1,000 women. Women in the age bracket of 20 to 34 years have the highest fertility rate with 223.0 births per 1,000 women. Women in the age bracket of 20 to 34 years acount for 62.8% of all women with births.
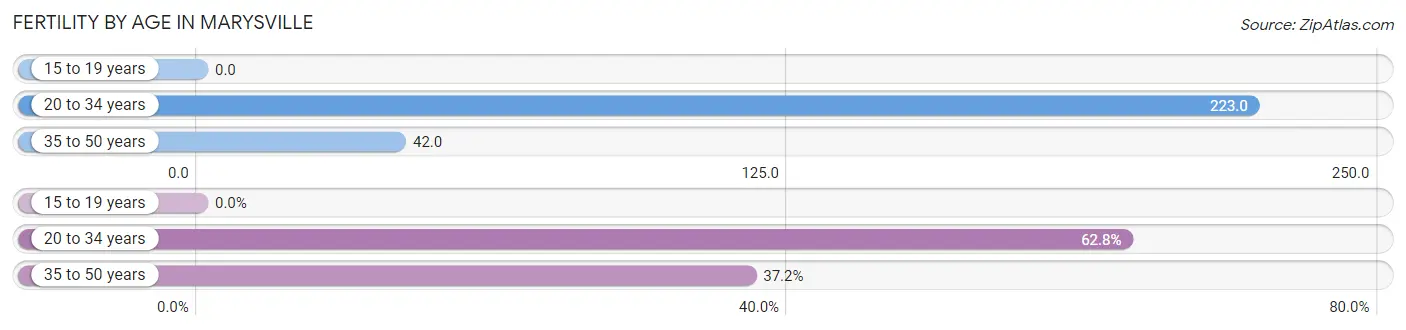
| Age Bracket | Women with Births | Births / 1,000 Women |
| 15 to 19 years | 0 (0.0%) | 0.0 |
| 20 to 34 years | 27 (62.8%) | 223.0 |
| 35 to 50 years | 16 (37.2%) | 42.0 |
| Total | 43 (100.0%) | 72.0 |
Fertility by Age by Marriage Status in Marysville
95.3% of women with births (43) in Marysville are married. The highest percentage of unmarried women with births falls into 20 to 34 years age bracket with 7.4% of them unmarried at the time of birth, while the lowest percentage of unmarried women with births belong to 35 to 50 years age bracket with 0.0% of them unmarried.
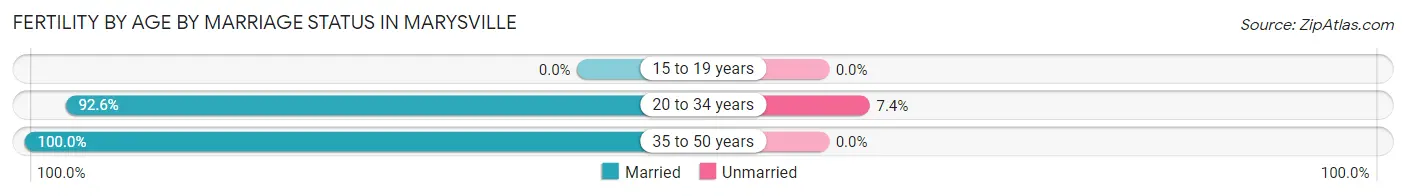
| Age Bracket | Married | Unmarried |
| 15 to 19 years | 0 (0.0%) | 0 (0.0%) |
| 20 to 34 years | 25 (92.6%) | 2 (7.4%) |
| 35 to 50 years | 16 (100.0%) | 0 (0.0%) |
| Total | 41 (95.4%) | 2 (4.6%) |
Fertility by Education in Marysville
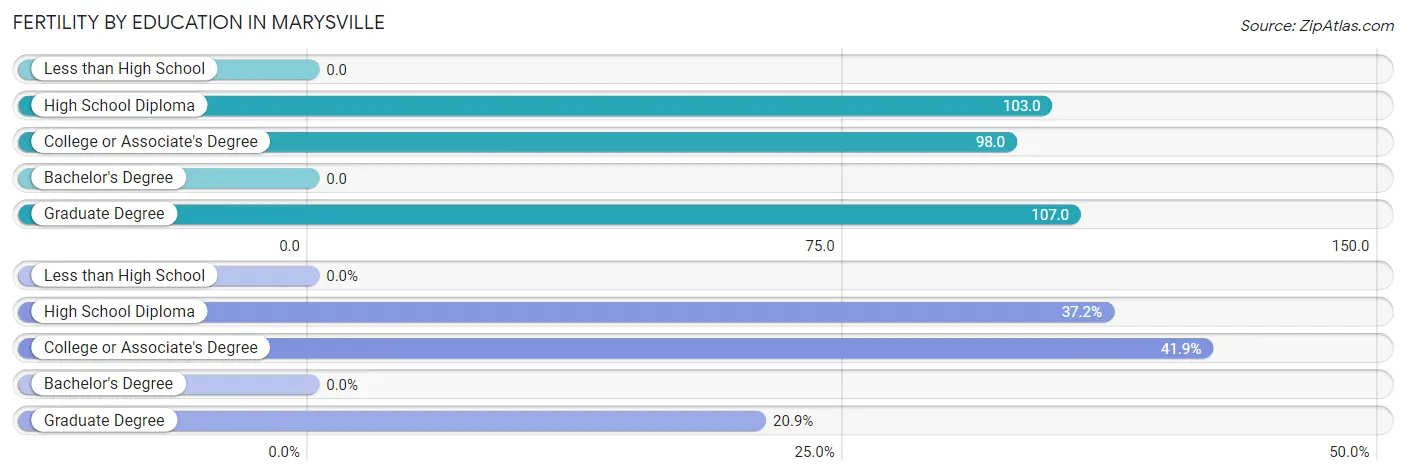
| Educational Attainment | Women with Births | Births / 1,000 Women |
| Less than High School | 0 (0.0%) | 0.0 |
| High School Diploma | 16 (37.2%) | 103.0 |
| College or Associate's Degree | 18 (41.9%) | 98.0 |
| Bachelor's Degree | 0 (0.0%) | 0.0 |
| Graduate Degree | 9 (20.9%) | 107.0 |
| Total | 43 (100.0%) | 72.0 |
Fertility by Education by Marriage Status in Marysville
4.6% of women with births in Marysville are unmarried. Women with the educational attainment of high school diploma are most likely to be married with 100.0% of them married at childbirth, while women with the educational attainment of college or associate's degree are least likely to be married with 11.1% of them unmarried at childbirth.
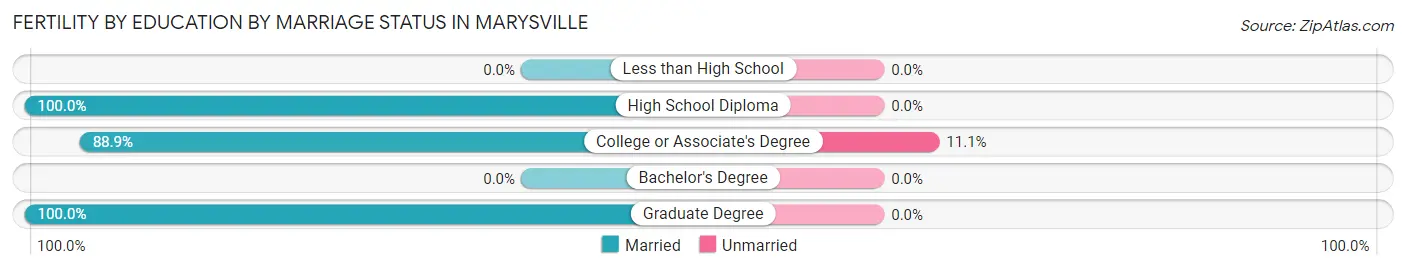
| Educational Attainment | Married | Unmarried |
| Less than High School | 0 (0.0%) | 0 (0.0%) |
| High School Diploma | 16 (100.0%) | 0 (0.0%) |
| College or Associate's Degree | 16 (88.9%) | 2 (11.1%) |
| Bachelor's Degree | 0 (0.0%) | 0 (0.0%) |
| Graduate Degree | 9 (100.0%) | 0 (0.0%) |
| Total | 41 (95.4%) | 2 (4.6%) |
Employment Characteristics in Marysville
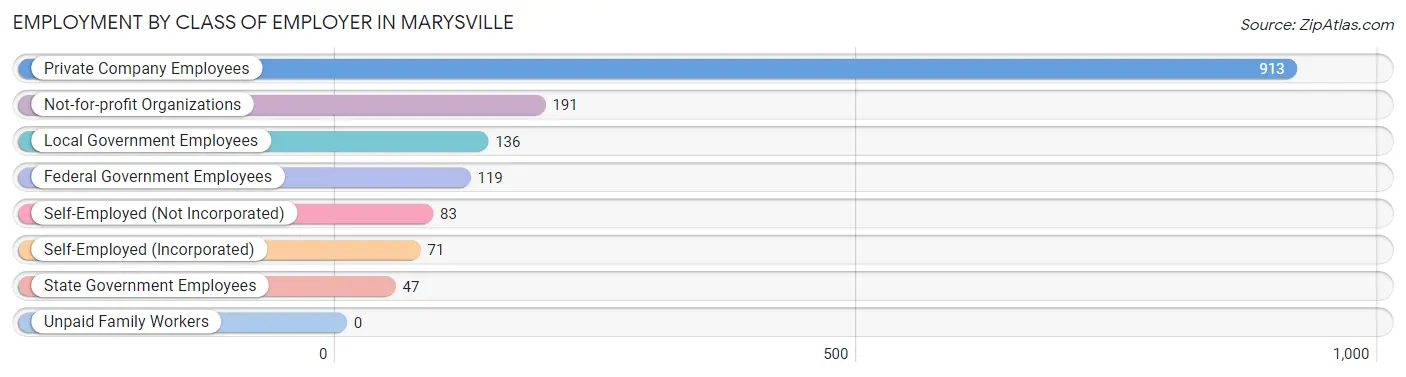
Employment by Class of Employer in Marysville
Among the 1,560 employed individuals in Marysville, private company employees (913 | 58.5%), not-for-profit organizations (191 | 12.2%), and local government employees (136 | 8.7%) make up the most common classes of employment.
| Employer Class | # Employees | % Employees |
| Private Company Employees | 913 | 58.5% |
| Self-Employed (Incorporated) | 71 | 4.5% |
| Self-Employed (Not Incorporated) | 83 | 5.3% |
| Not-for-profit Organizations | 191 | 12.2% |
| Local Government Employees | 136 | 8.7% |
| State Government Employees | 47 | 3.0% |
| Federal Government Employees | 119 | 7.6% |
| Unpaid Family Workers | 0 | 0.0% |
| Total | 1,560 | 100.0% |
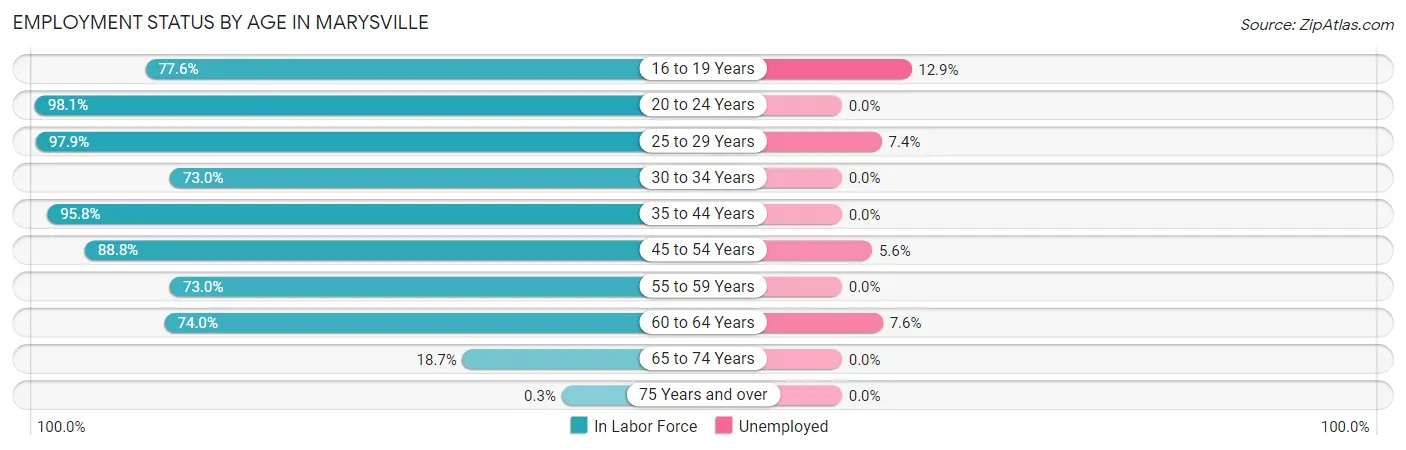
Employment Status by Age in Marysville
According to the labor force statistics for Marysville, out of the total population over 16 years of age (2,536), 65.3% or 1,656 individuals are in the labor force, with 3.1% or 51 of them unemployed. The age group with the highest labor force participation rate is 20 to 24 years, with 98.1% or 102 individuals in the labor force. Within the labor force, the 16 to 19 years age range has the highest percentage of unemployed individuals, with 12.9% or 17 of them being unemployed.
| Age Bracket | In Labor Force | Unemployed |
| 16 to 19 Years | 132 (77.6%) | 17 (12.9%) |
| 20 to 24 Years | 102 (98.1%) | 0 (0.0%) |
| 25 to 29 Years | 95 (97.9%) | 7 (7.4%) |
| 30 to 34 Years | 119 (73.0%) | 0 (0.0%) |
| 35 to 44 Years | 520 (95.8%) | 0 (0.0%) |
| 45 to 54 Years | 286 (88.8%) | 16 (5.6%) |
| 55 to 59 Years | 195 (73.0%) | 0 (0.0%) |
| 60 to 64 Years | 145 (74.0%) | 11 (7.6%) |
| 65 to 74 Years | 61 (18.7%) | 0 (0.0%) |
| 75 Years and over | 1 (0.3%) | 0 (0.0%) |
| Total | 1,656 (65.3%) | 51 (3.1%) |
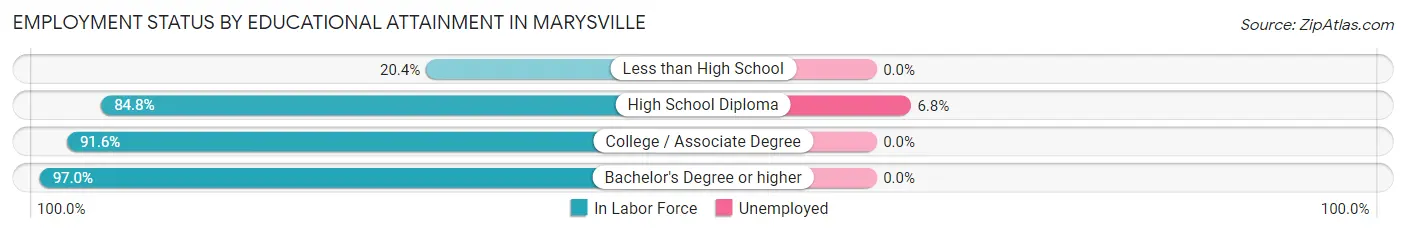
Employment Status by Educational Attainment in Marysville
According to labor force statistics for Marysville, 85.6% of individuals (1,359) out of the total population between 25 and 64 years of age (1,588) are in the labor force, with 2.5% or 34 of them being unemployed. The group with the highest labor force participation rate are those with the educational attainment of bachelor's degree or higher, with 97.0% or 458 individuals in the labor force. Within the labor force, individuals with high school diploma education have the highest percentage of unemployment, with 6.8% or 34 of them being unemployed.
| Educational Attainment | In Labor Force | Unemployed |
| Less than High School | 23 (20.4%) | 0 (0.0%) |
| High School Diploma | 498 (84.8%) | 40 (6.8%) |
| College / Associate Degree | 381 (91.6%) | 0 (0.0%) |
| Bachelor's Degree or higher | 458 (97.0%) | 0 (0.0%) |
| Total | 1,359 (85.6%) | 40 (2.5%) |
Employment Occupations by Sex in Marysville
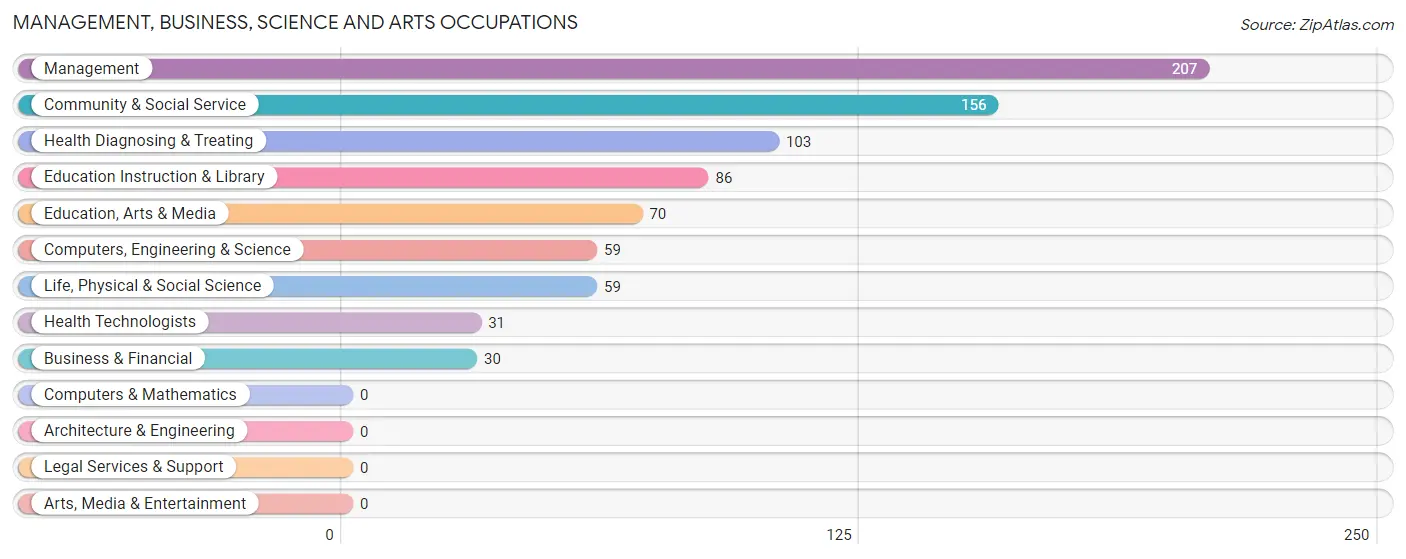
Management, Business, Science and Arts Occupations
The most common Management, Business, Science and Arts occupations in Marysville are Management (207 | 12.9%), Community & Social Service (156 | 9.7%), Health Diagnosing & Treating (103 | 6.4%), Education Instruction & Library (86 | 5.4%), and Education, Arts & Media (70 | 4.4%).
Management, Business, Science and Arts Occupations by Sex
Within the Management, Business, Science and Arts occupations in Marysville, the most male-oriented occupations are Management (79.7%), Health Technologists (64.5%), and Business & Financial (53.3%), while the most female-oriented occupations are Computers, Engineering & Science (100.0%), Life, Physical & Social Science (100.0%), and Education, Arts & Media (100.0%).
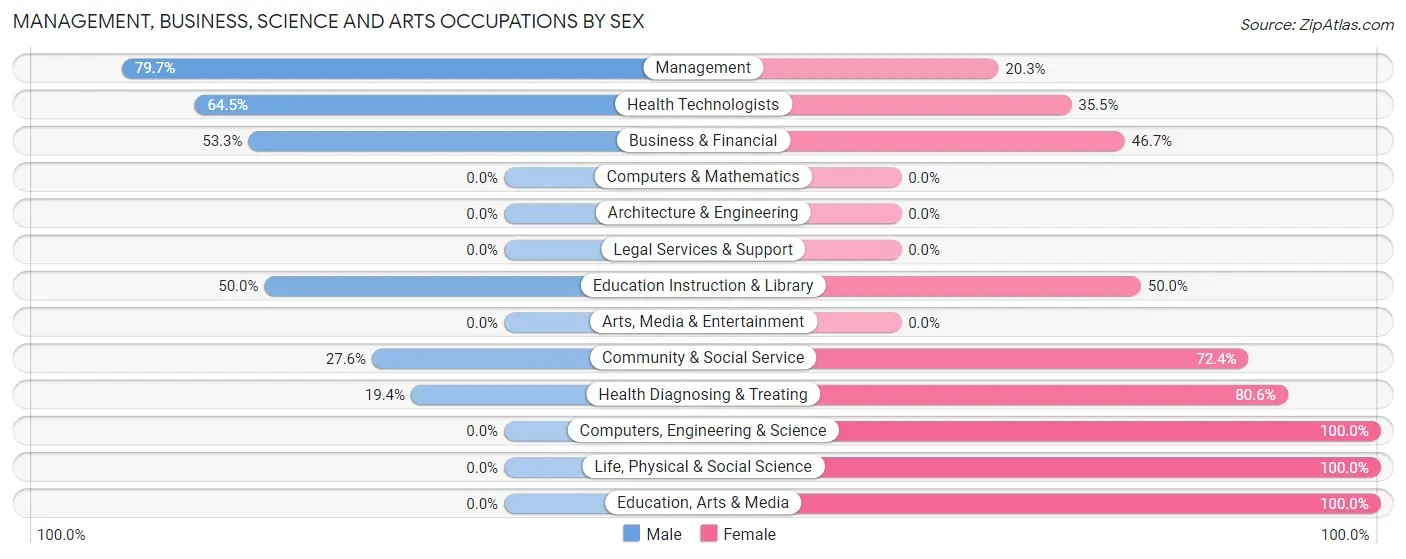
| Occupation | Male | Female |
| Management | 165 (79.7%) | 42 (20.3%) |
| Business & Financial | 16 (53.3%) | 14 (46.7%) |
| Computers, Engineering & Science | 0 (0.0%) | 59 (100.0%) |
| Computers & Mathematics | 0 (0.0%) | 0 (0.0%) |
| Architecture & Engineering | 0 (0.0%) | 0 (0.0%) |
| Life, Physical & Social Science | 0 (0.0%) | 59 (100.0%) |
| Community & Social Service | 43 (27.6%) | 113 (72.4%) |
| Education, Arts & Media | 0 (0.0%) | 70 (100.0%) |
| Legal Services & Support | 0 (0.0%) | 0 (0.0%) |
| Education Instruction & Library | 43 (50.0%) | 43 (50.0%) |
| Arts, Media & Entertainment | 0 (0.0%) | 0 (0.0%) |
| Health Diagnosing & Treating | 20 (19.4%) | 83 (80.6%) |
| Health Technologists | 20 (64.5%) | 11 (35.5%) |
| Total (Category) | 244 (44.0%) | 311 (56.0%) |
| Total (Overall) | 842 (52.5%) | 763 (47.5%) |
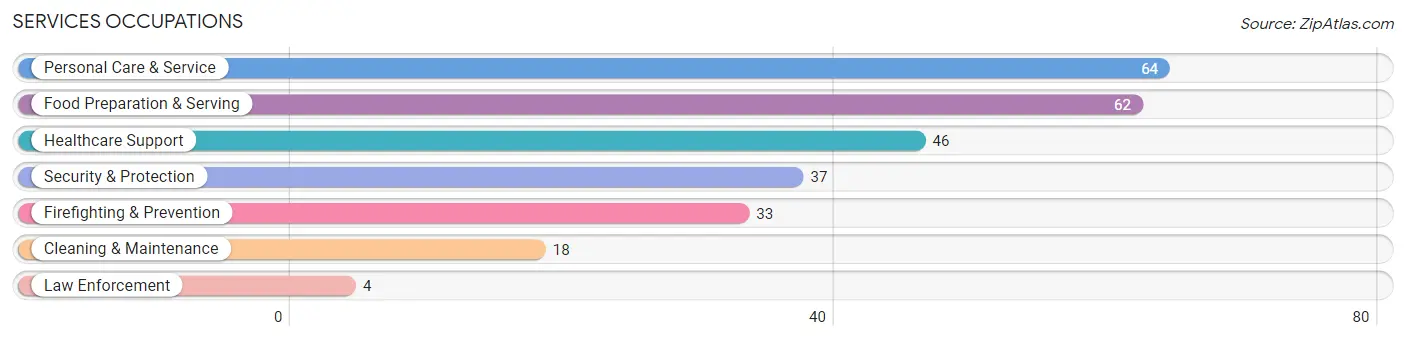
Services Occupations
The most common Services occupations in Marysville are Personal Care & Service (64 | 4.0%), Food Preparation & Serving (62 | 3.9%), Healthcare Support (46 | 2.9%), Security & Protection (37 | 2.3%), and Firefighting & Prevention (33 | 2.1%).
Services Occupations by Sex
Within the Services occupations in Marysville, the most male-oriented occupations are Security & Protection (100.0%), Firefighting & Prevention (100.0%), and Law Enforcement (100.0%), while the most female-oriented occupations are Cleaning & Maintenance (100.0%), Personal Care & Service (100.0%), and Food Preparation & Serving (71.0%).
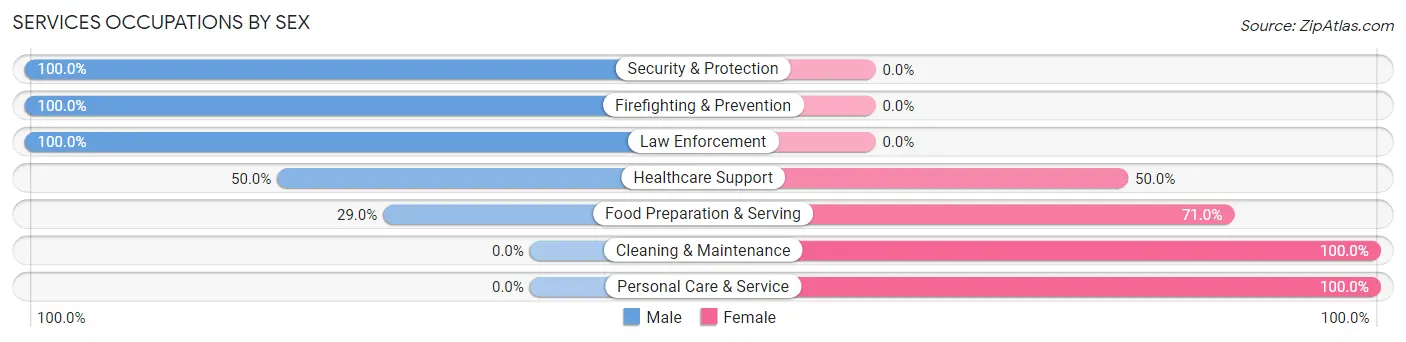
| Occupation | Male | Female |
| Healthcare Support | 23 (50.0%) | 23 (50.0%) |
| Security & Protection | 37 (100.0%) | 0 (0.0%) |
| Firefighting & Prevention | 33 (100.0%) | 0 (0.0%) |
| Law Enforcement | 4 (100.0%) | 0 (0.0%) |
| Food Preparation & Serving | 18 (29.0%) | 44 (71.0%) |
| Cleaning & Maintenance | 0 (0.0%) | 18 (100.0%) |
| Personal Care & Service | 0 (0.0%) | 64 (100.0%) |
| Total (Category) | 78 (34.4%) | 149 (65.6%) |
| Total (Overall) | 842 (52.5%) | 763 (47.5%) |
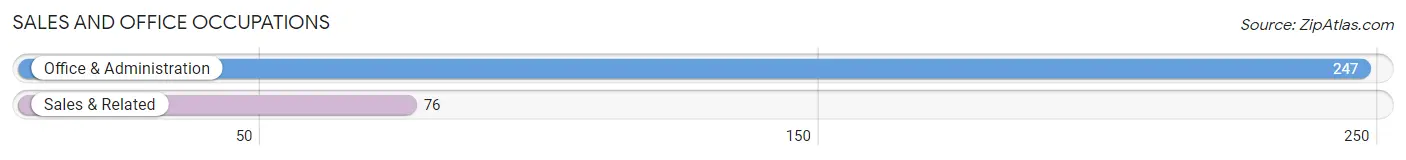
Sales and Office Occupations
The most common Sales and Office occupations in Marysville are Office & Administration (247 | 15.4%), and Sales & Related (76 | 4.7%).
Sales and Office Occupations by Sex
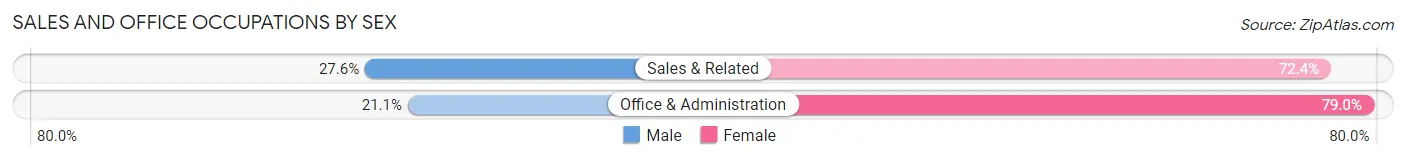
| Occupation | Male | Female |
| Sales & Related | 21 (27.6%) | 55 (72.4%) |
| Office & Administration | 52 (21.0%) | 195 (78.9%) |
| Total (Category) | 73 (22.6%) | 250 (77.4%) |
| Total (Overall) | 842 (52.5%) | 763 (47.5%) |
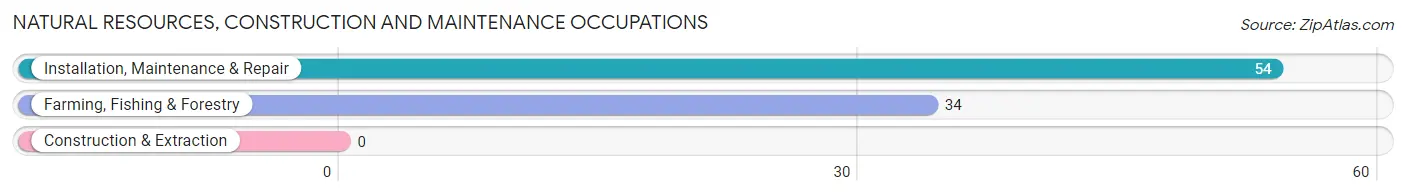
Natural Resources, Construction and Maintenance Occupations
The most common Natural Resources, Construction and Maintenance occupations in Marysville are Installation, Maintenance & Repair (54 | 3.4%), and Farming, Fishing & Forestry (34 | 2.1%).
Natural Resources, Construction and Maintenance Occupations by Sex
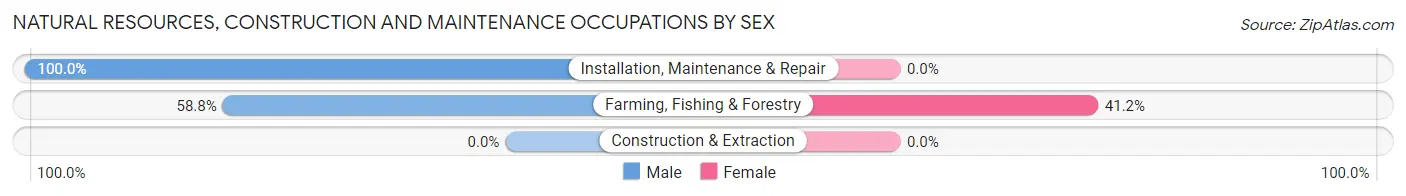
| Occupation | Male | Female |
| Farming, Fishing & Forestry | 20 (58.8%) | 14 (41.2%) |
| Construction & Extraction | 0 (0.0%) | 0 (0.0%) |
| Installation, Maintenance & Repair | 54 (100.0%) | 0 (0.0%) |
| Total (Category) | 74 (84.1%) | 14 (15.9%) |
| Total (Overall) | 842 (52.5%) | 763 (47.5%) |
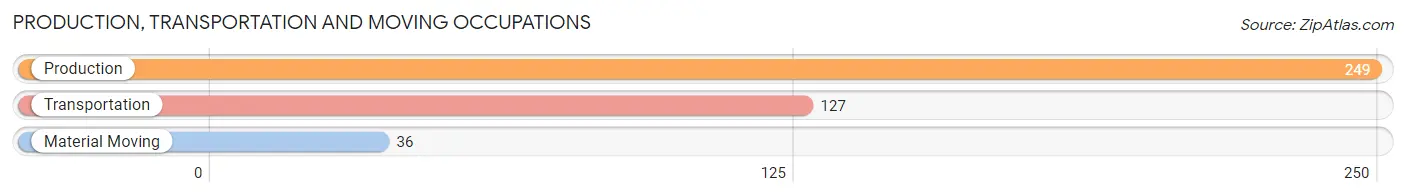
Production, Transportation and Moving Occupations
The most common Production, Transportation and Moving occupations in Marysville are Production (249 | 15.5%), Transportation (127 | 7.9%), and Material Moving (36 | 2.2%).
Production, Transportation and Moving Occupations by Sex
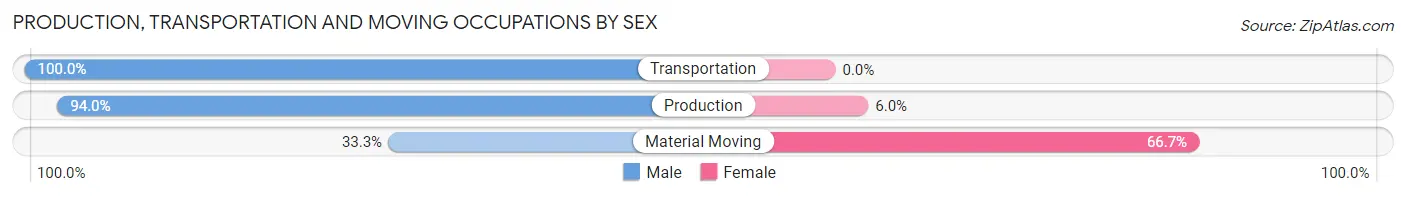
| Occupation | Male | Female |
| Production | 234 (94.0%) | 15 (6.0%) |
| Transportation | 127 (100.0%) | 0 (0.0%) |
| Material Moving | 12 (33.3%) | 24 (66.7%) |
| Total (Category) | 373 (90.5%) | 39 (9.5%) |
| Total (Overall) | 842 (52.5%) | 763 (47.5%) |
Employment Industries by Sex in Marysville
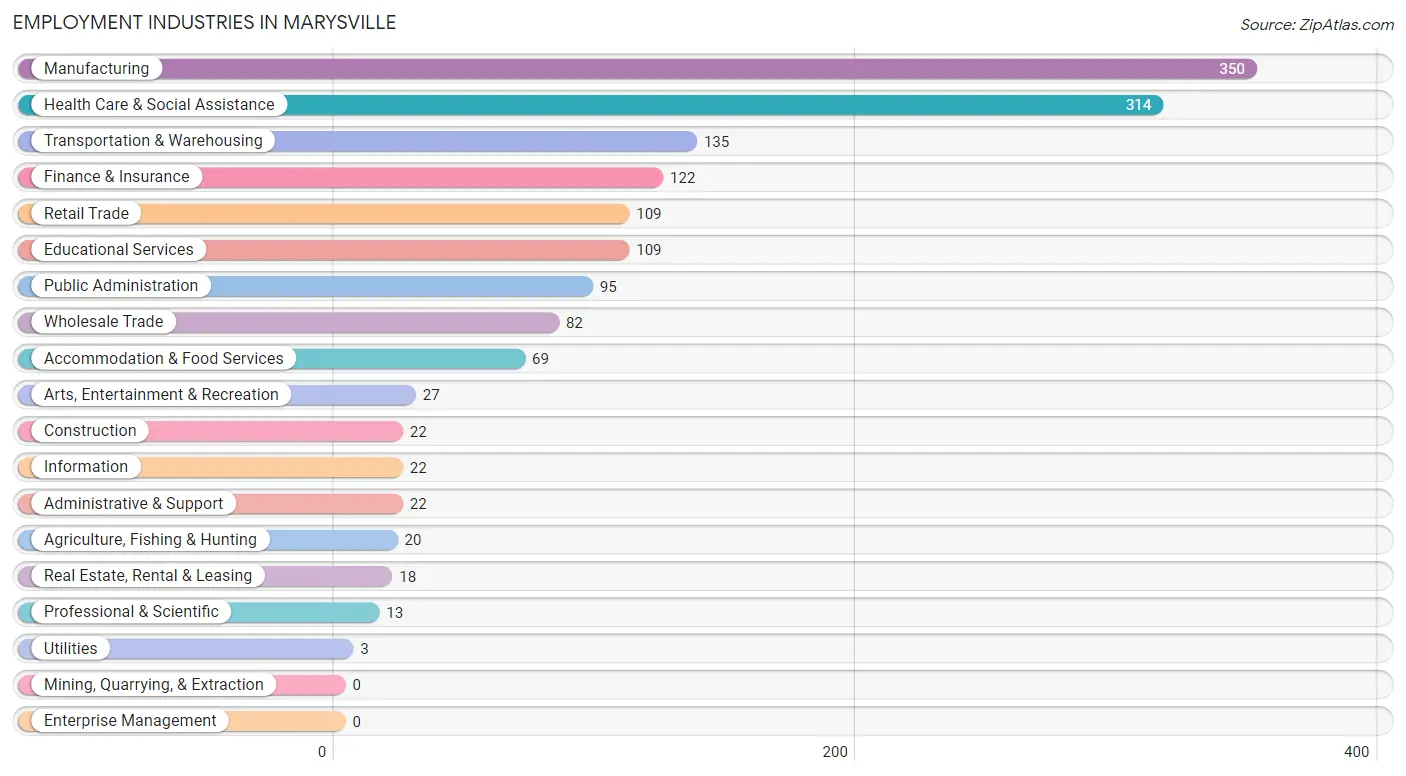
Employment Industries in Marysville
The major employment industries in Marysville include Manufacturing (350 | 21.8%), Health Care & Social Assistance (314 | 19.6%), Transportation & Warehousing (135 | 8.4%), Finance & Insurance (122 | 7.6%), and Retail Trade (109 | 6.8%).
Employment Industries by Sex in Marysville
The Marysville industries that see more men than women are Agriculture, Fishing & Hunting (100.0%), Construction (100.0%), and Utilities (100.0%), whereas the industries that tend to have a higher number of women are Information (100.0%), Professional & Scientific (100.0%), and Retail Trade (94.5%).
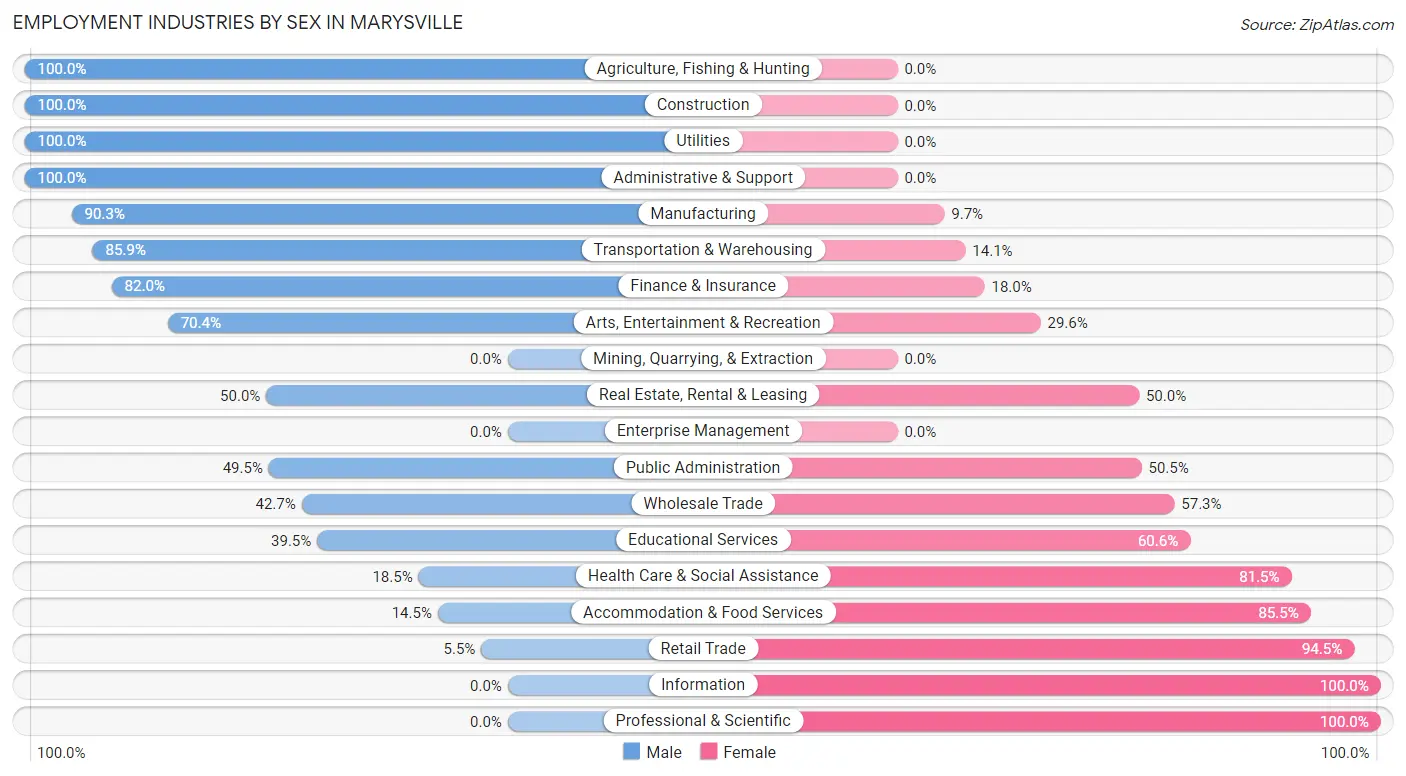
| Industry | Male | Female |
| Agriculture, Fishing & Hunting | 20 (100.0%) | 0 (0.0%) |
| Mining, Quarrying, & Extraction | 0 (0.0%) | 0 (0.0%) |
| Construction | 22 (100.0%) | 0 (0.0%) |
| Manufacturing | 316 (90.3%) | 34 (9.7%) |
| Wholesale Trade | 35 (42.7%) | 47 (57.3%) |
| Retail Trade | 6 (5.5%) | 103 (94.5%) |
| Transportation & Warehousing | 116 (85.9%) | 19 (14.1%) |
| Utilities | 3 (100.0%) | 0 (0.0%) |
| Information | 0 (0.0%) | 22 (100.0%) |
| Finance & Insurance | 100 (82.0%) | 22 (18.0%) |
| Real Estate, Rental & Leasing | 9 (50.0%) | 9 (50.0%) |
| Professional & Scientific | 0 (0.0%) | 13 (100.0%) |
| Enterprise Management | 0 (0.0%) | 0 (0.0%) |
| Administrative & Support | 22 (100.0%) | 0 (0.0%) |
| Educational Services | 43 (39.5%) | 66 (60.6%) |
| Health Care & Social Assistance | 58 (18.5%) | 256 (81.5%) |
| Arts, Entertainment & Recreation | 19 (70.4%) | 8 (29.6%) |
| Accommodation & Food Services | 10 (14.5%) | 59 (85.5%) |
| Public Administration | 47 (49.5%) | 48 (50.5%) |
| Total | 842 (52.5%) | 763 (47.5%) |
Education in Marysville
School Enrollment in Marysville
The most common levels of schooling among the 886 students in Marysville are middle school (265 | 29.9%), high school (239 | 27.0%), and elementary school (202 | 22.8%).
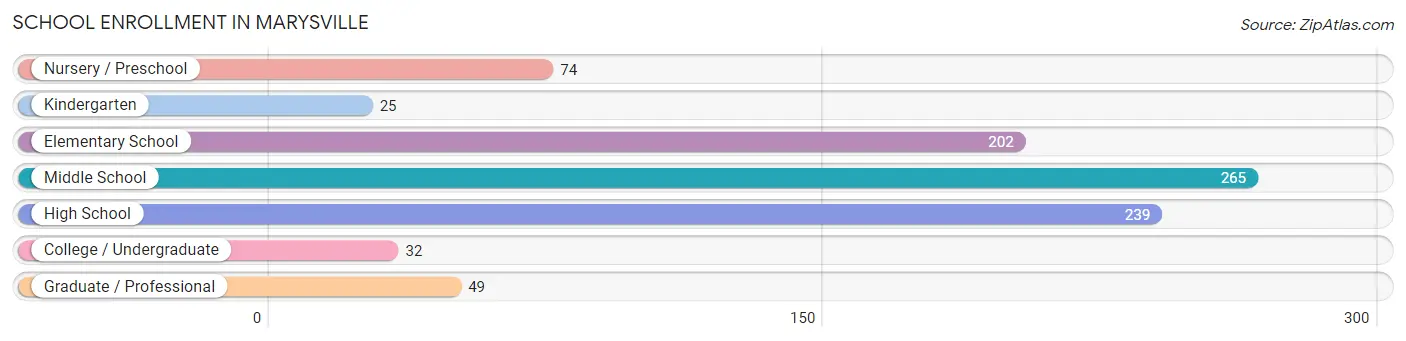
| School Level | # Students | % Students |
| Nursery / Preschool | 74 | 8.4% |
| Kindergarten | 25 | 2.8% |
| Elementary School | 202 | 22.8% |
| Middle School | 265 | 29.9% |
| High School | 239 | 27.0% |
| College / Undergraduate | 32 | 3.6% |
| Graduate / Professional | 49 | 5.5% |
| Total | 886 | 100.0% |
School Enrollment by Age by Funding Source in Marysville
Out of a total of 886 students who are enrolled in schools in Marysville, 100 (11.3%) attend a private institution, while the remaining 786 (88.7%) are enrolled in public schools. The age group of 3 to 4 year olds has the highest likelihood of being enrolled in private schools, with 23 (39.0% in the age bracket) enrolled. Conversely, the age group of 15 to 17 year olds has the lowest likelihood of being enrolled in a private school, with 176 (100.0% in the age bracket) attending a public institution.
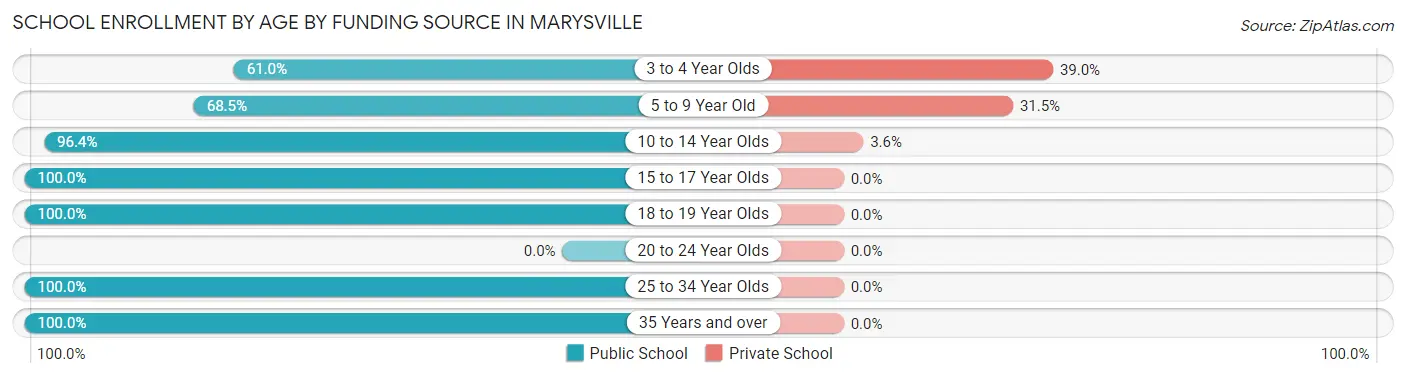
| Age Bracket | Public School | Private School |
| 3 to 4 Year Olds | 36 (61.0%) | 23 (39.0%) |
| 5 to 9 Year Old | 139 (68.5%) | 64 (31.5%) |
| 10 to 14 Year Olds | 344 (96.4%) | 13 (3.6%) |
| 15 to 17 Year Olds | 176 (100.0%) | 0 (0.0%) |
| 18 to 19 Year Olds | 10 (100.0%) | 0 (0.0%) |
| 20 to 24 Year Olds | 0 (0.0%) | 0 (0.0%) |
| 25 to 34 Year Olds | 35 (100.0%) | 0 (0.0%) |
| 35 Years and over | 46 (100.0%) | 0 (0.0%) |
| Total | 786 (88.7%) | 100 (11.3%) |
Educational Attainment by Field of Study in Marysville
Education (222 | 30.0%), business (124 | 16.8%), arts & humanities (118 | 16.0%), science & technology (94 | 12.7%), and bio, nature & agricultural (82 | 11.1%) are the most common fields of study among 740 individuals in Marysville who have obtained a bachelor's degree or higher.
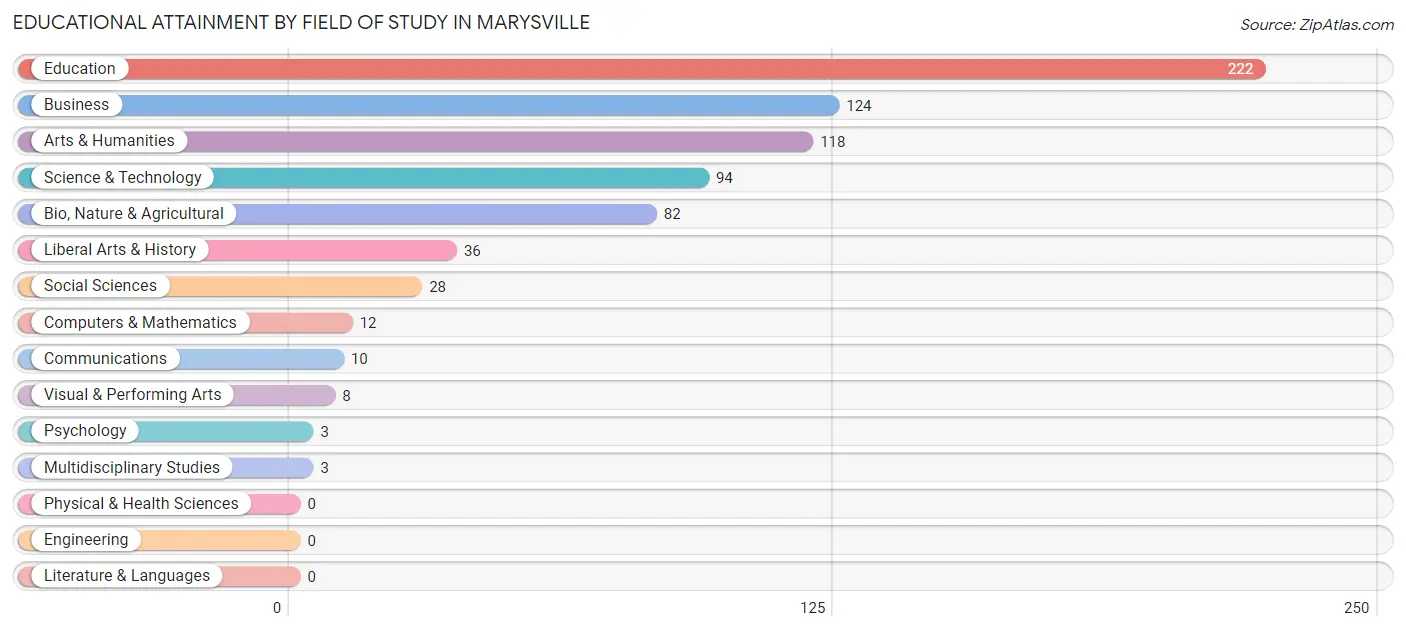
| Field of Study | # Graduates | % Graduates |
| Computers & Mathematics | 12 | 1.6% |
| Bio, Nature & Agricultural | 82 | 11.1% |
| Physical & Health Sciences | 0 | 0.0% |
| Psychology | 3 | 0.4% |
| Social Sciences | 28 | 3.8% |
| Engineering | 0 | 0.0% |
| Multidisciplinary Studies | 3 | 0.4% |
| Science & Technology | 94 | 12.7% |
| Business | 124 | 16.8% |
| Education | 222 | 30.0% |
| Literature & Languages | 0 | 0.0% |
| Liberal Arts & History | 36 | 4.9% |
| Visual & Performing Arts | 8 | 1.1% |
| Communications | 10 | 1.3% |
| Arts & Humanities | 118 | 16.0% |
| Total | 740 | 100.0% |
Transportation & Commute in Marysville
Vehicle Availability by Sex in Marysville
The most prevalent vehicle ownership categories in Marysville are males with 2 vehicles (354, accounting for 43.0%) and females with 2 vehicles (286, making up 48.0%).
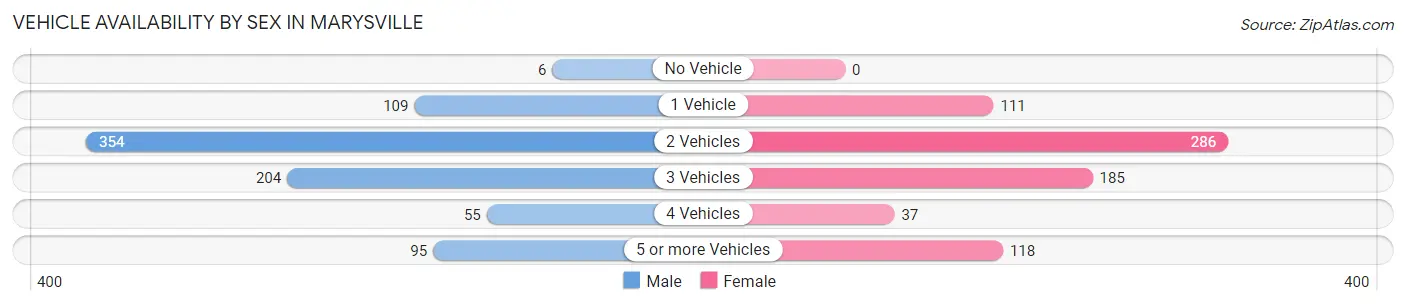
| Vehicles Available | Male | Female |
| No Vehicle | 6 (0.7%) | 0 (0.0%) |
| 1 Vehicle | 109 (13.2%) | 111 (15.1%) |
| 2 Vehicles | 354 (43.0%) | 286 (38.8%) |
| 3 Vehicles | 204 (24.8%) | 185 (25.1%) |
| 4 Vehicles | 55 (6.7%) | 37 (5.0%) |
| 5 or more Vehicles | 95 (11.5%) | 118 (16.0%) |
| Total | 823 (100.0%) | 737 (100.0%) |
Commute Time in Marysville
The most frequently occuring commute durations in Marysville are 5 to 9 minutes (510 commuters, 35.1%), less than 5 minutes (352 commuters, 24.3%), and 10 to 14 minutes (178 commuters, 12.3%).
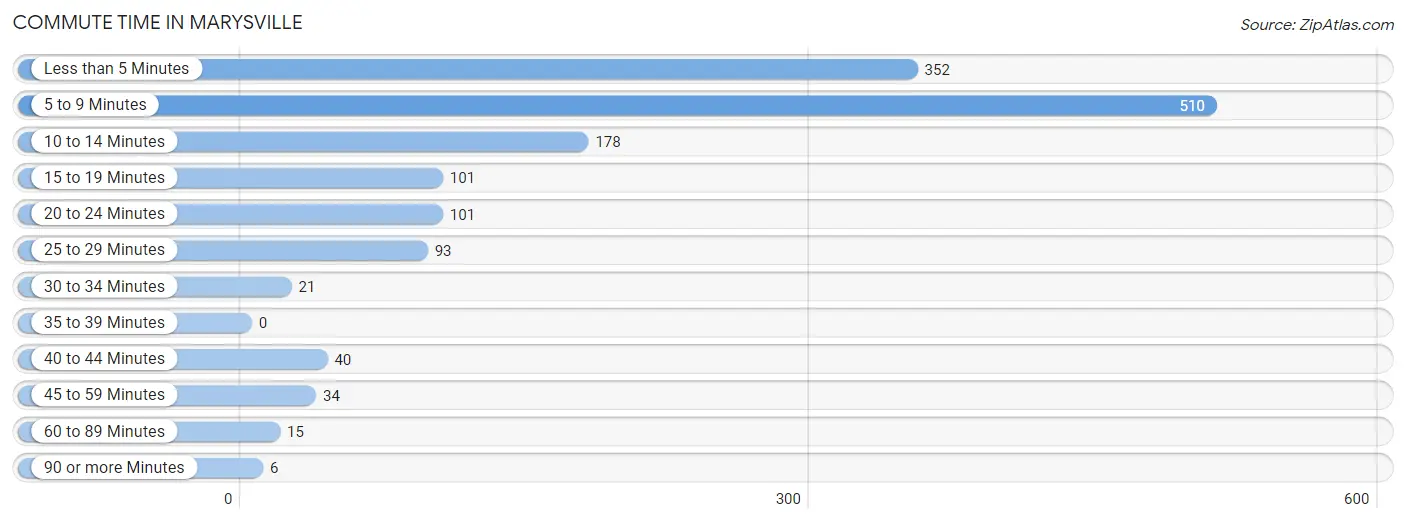
| Commute Time | # Commuters | % Commuters |
| Less than 5 Minutes | 352 | 24.3% |
| 5 to 9 Minutes | 510 | 35.1% |
| 10 to 14 Minutes | 178 | 12.3% |
| 15 to 19 Minutes | 101 | 7.0% |
| 20 to 24 Minutes | 101 | 7.0% |
| 25 to 29 Minutes | 93 | 6.4% |
| 30 to 34 Minutes | 21 | 1.5% |
| 35 to 39 Minutes | 0 | 0.0% |
| 40 to 44 Minutes | 40 | 2.8% |
| 45 to 59 Minutes | 34 | 2.3% |
| 60 to 89 Minutes | 15 | 1.0% |
| 90 or more Minutes | 6 | 0.4% |
Commute Time by Sex in Marysville
The most common commute times in Marysville are 5 to 9 minutes (252 commuters, 31.9%) for males and 5 to 9 minutes (258 commuters, 39.1%) for females.
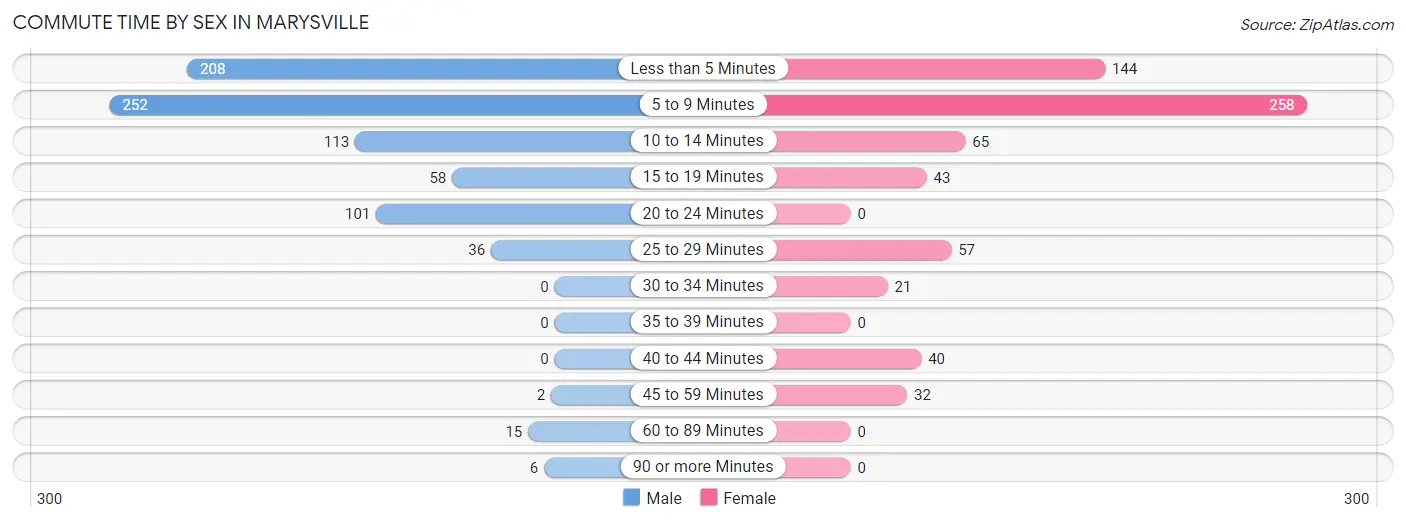
| Commute Time | Male | Female |
| Less than 5 Minutes | 208 (26.3%) | 144 (21.8%) |
| 5 to 9 Minutes | 252 (31.9%) | 258 (39.1%) |
| 10 to 14 Minutes | 113 (14.3%) | 65 (9.9%) |
| 15 to 19 Minutes | 58 (7.3%) | 43 (6.5%) |
| 20 to 24 Minutes | 101 (12.8%) | 0 (0.0%) |
| 25 to 29 Minutes | 36 (4.5%) | 57 (8.6%) |
| 30 to 34 Minutes | 0 (0.0%) | 21 (3.2%) |
| 35 to 39 Minutes | 0 (0.0%) | 0 (0.0%) |
| 40 to 44 Minutes | 0 (0.0%) | 40 (6.1%) |
| 45 to 59 Minutes | 2 (0.3%) | 32 (4.9%) |
| 60 to 89 Minutes | 15 (1.9%) | 0 (0.0%) |
| 90 or more Minutes | 6 (0.8%) | 0 (0.0%) |
Time of Departure to Work by Sex in Marysville
The most frequent times of departure to work in Marysville are 7:30 AM to 7:59 AM (224, 28.3%) for males and 7:30 AM to 7:59 AM (192, 29.1%) for females.
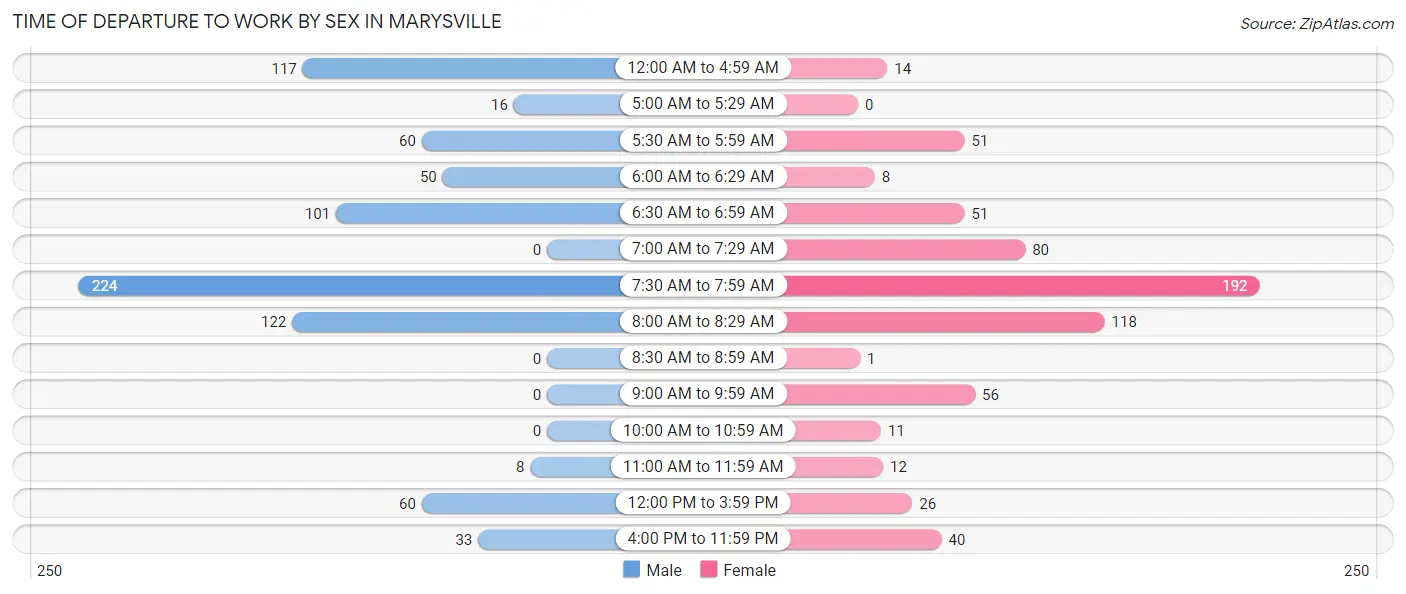
| Time of Departure | Male | Female |
| 12:00 AM to 4:59 AM | 117 (14.8%) | 14 (2.1%) |
| 5:00 AM to 5:29 AM | 16 (2.0%) | 0 (0.0%) |
| 5:30 AM to 5:59 AM | 60 (7.6%) | 51 (7.7%) |
| 6:00 AM to 6:29 AM | 50 (6.3%) | 8 (1.2%) |
| 6:30 AM to 6:59 AM | 101 (12.8%) | 51 (7.7%) |
| 7:00 AM to 7:29 AM | 0 (0.0%) | 80 (12.1%) |
| 7:30 AM to 7:59 AM | 224 (28.3%) | 192 (29.1%) |
| 8:00 AM to 8:29 AM | 122 (15.4%) | 118 (17.9%) |
| 8:30 AM to 8:59 AM | 0 (0.0%) | 1 (0.2%) |
| 9:00 AM to 9:59 AM | 0 (0.0%) | 56 (8.5%) |
| 10:00 AM to 10:59 AM | 0 (0.0%) | 11 (1.7%) |
| 11:00 AM to 11:59 AM | 8 (1.0%) | 12 (1.8%) |
| 12:00 PM to 3:59 PM | 60 (7.6%) | 26 (3.9%) |
| 4:00 PM to 11:59 PM | 33 (4.2%) | 40 (6.1%) |
| Total | 791 (100.0%) | 660 (100.0%) |
Housing Occupancy in Marysville
Occupancy by Ownership in Marysville
Of the total 1,443 dwellings in Marysville, owner-occupied units account for 1,069 (74.1%), while renter-occupied units make up 374 (25.9%).
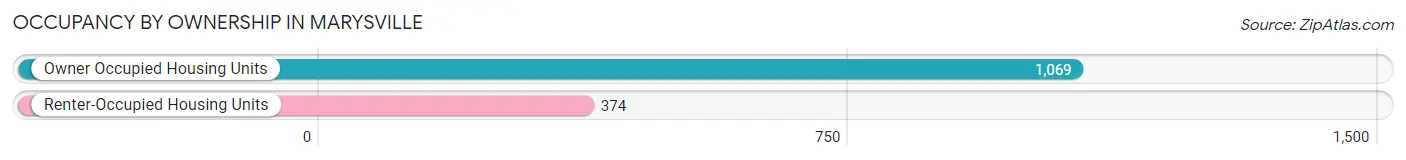
| Occupancy | # Housing Units | % Housing Units |
| Owner Occupied Housing Units | 1,069 | 74.1% |
| Renter-Occupied Housing Units | 374 | 25.9% |
| Total Occupied Housing Units | 1,443 | 100.0% |
Occupancy by Household Size in Marysville
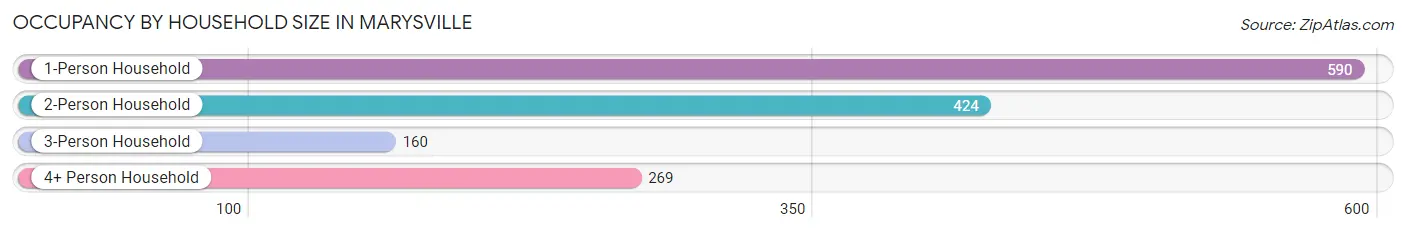
| Household Size | # Housing Units | % Housing Units |
| 1-Person Household | 590 | 40.9% |
| 2-Person Household | 424 | 29.4% |
| 3-Person Household | 160 | 11.1% |
| 4+ Person Household | 269 | 18.6% |
| Total Housing Units | 1,443 | 100.0% |
Occupancy by Ownership by Household Size in Marysville
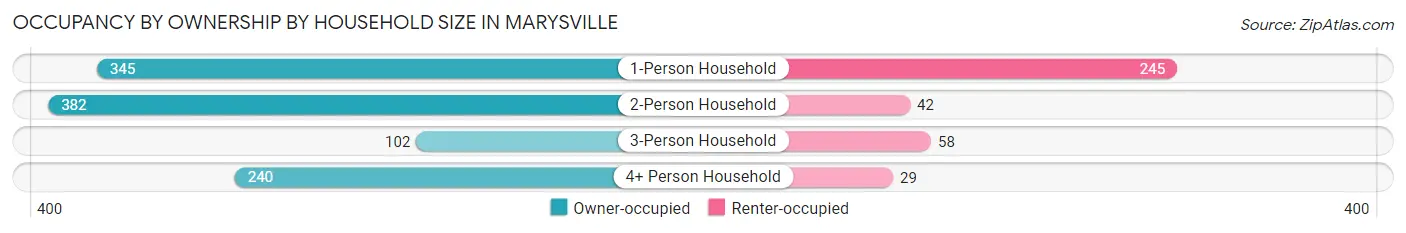
| Household Size | Owner-occupied | Renter-occupied |
| 1-Person Household | 345 (58.5%) | 245 (41.5%) |
| 2-Person Household | 382 (90.1%) | 42 (9.9%) |
| 3-Person Household | 102 (63.7%) | 58 (36.2%) |
| 4+ Person Household | 240 (89.2%) | 29 (10.8%) |
| Total Housing Units | 1,069 (74.1%) | 374 (25.9%) |
Occupancy by Educational Attainment in Marysville
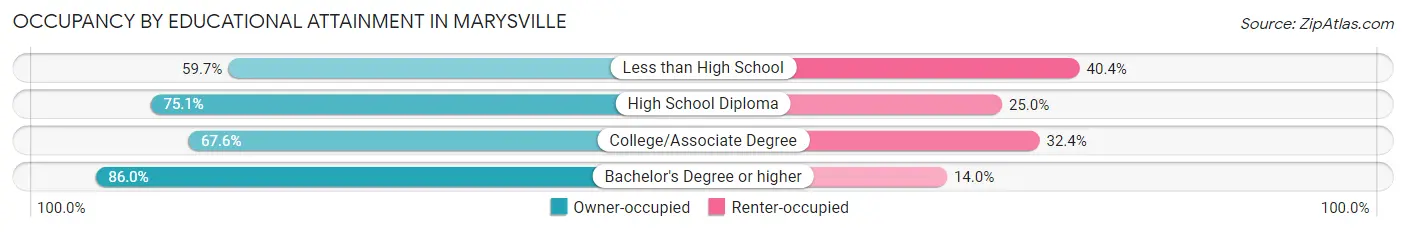
| Household Size | Owner-occupied | Renter-occupied |
| Less than High School | 68 (59.7%) | 46 (40.4%) |
| High School Diploma | 388 (75.0%) | 129 (24.9%) |
| College/Associate Degree | 313 (67.6%) | 150 (32.4%) |
| Bachelor's Degree or higher | 300 (86.0%) | 49 (14.0%) |
Occupancy by Age of Householder in Marysville
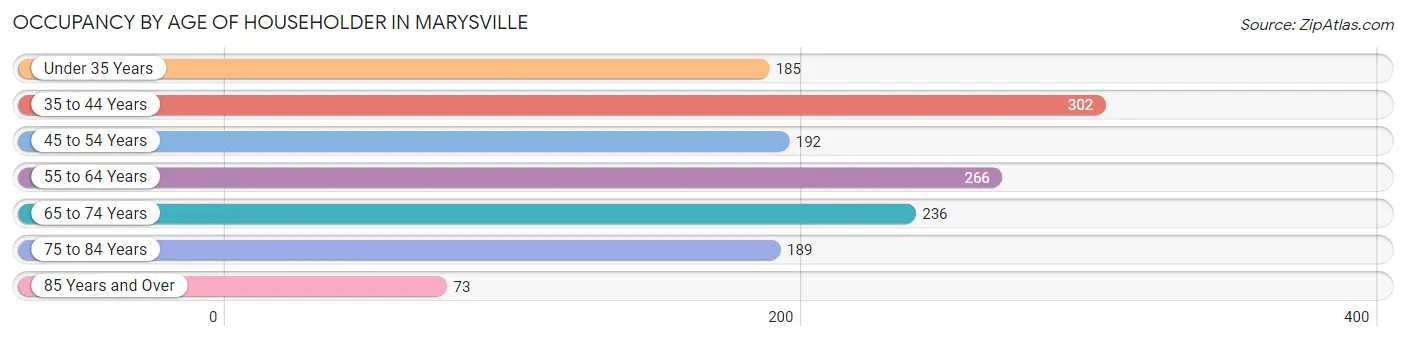
| Age Bracket | # Households | % Households |
| Under 35 Years | 185 | 12.8% |
| 35 to 44 Years | 302 | 20.9% |
| 45 to 54 Years | 192 | 13.3% |
| 55 to 64 Years | 266 | 18.4% |
| 65 to 74 Years | 236 | 16.4% |
| 75 to 84 Years | 189 | 13.1% |
| 85 Years and Over | 73 | 5.1% |
| Total | 1,443 | 100.0% |
Housing Finances in Marysville
Median Income by Occupancy in Marysville
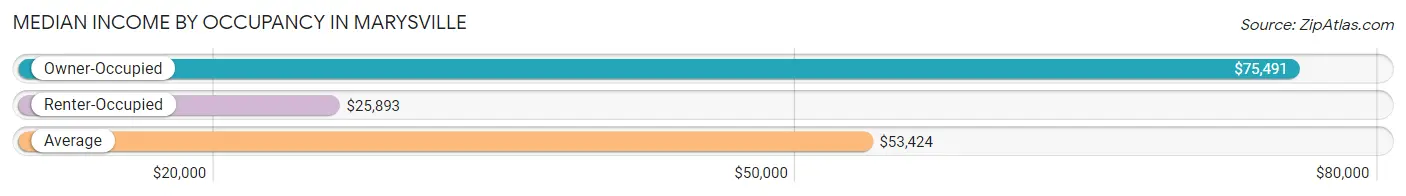
| Occupancy Type | # Households | Median Income |
| Owner-Occupied | 1,069 (74.1%) | $75,491 |
| Renter-Occupied | 374 (25.9%) | $25,893 |
| Average | 1,443 (100.0%) | $53,424 |
Occupancy by Householder Income Bracket in Marysville
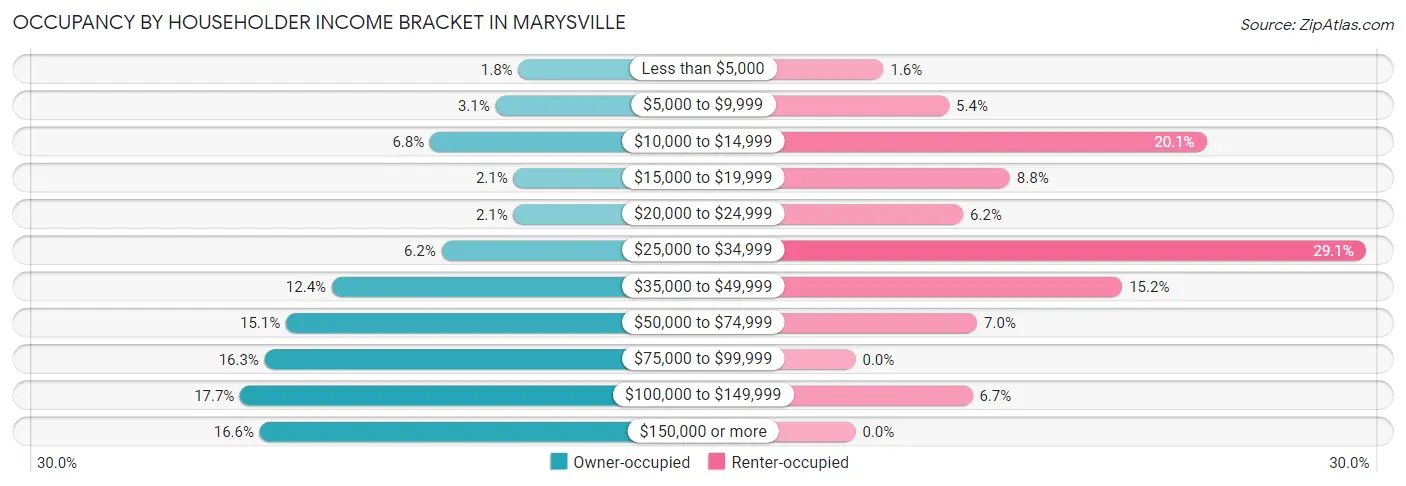
| Income Bracket | Owner-occupied | Renter-occupied |
| Less than $5,000 | 19 (1.8%) | 6 (1.6%) |
| $5,000 to $9,999 | 33 (3.1%) | 20 (5.3%) |
| $10,000 to $14,999 | 73 (6.8%) | 75 (20.1%) |
| $15,000 to $19,999 | 22 (2.1%) | 33 (8.8%) |
| $20,000 to $24,999 | 22 (2.1%) | 23 (6.1%) |
| $25,000 to $34,999 | 66 (6.2%) | 109 (29.1%) |
| $35,000 to $49,999 | 133 (12.4%) | 57 (15.2%) |
| $50,000 to $74,999 | 161 (15.1%) | 26 (7.0%) |
| $75,000 to $99,999 | 174 (16.3%) | 0 (0.0%) |
| $100,000 to $149,999 | 189 (17.7%) | 25 (6.7%) |
| $150,000 or more | 177 (16.6%) | 0 (0.0%) |
| Total | 1,069 (100.0%) | 374 (100.0%) |
Monthly Housing Cost Tiers in Marysville
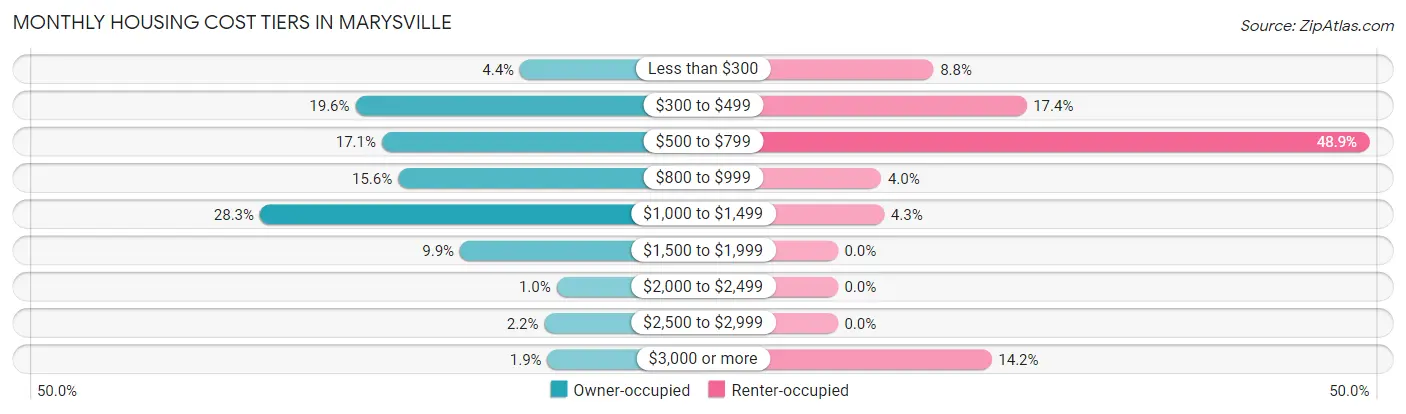
| Monthly Cost | Owner-occupied | Renter-occupied |
| Less than $300 | 47 (4.4%) | 33 (8.8%) |
| $300 to $499 | 209 (19.6%) | 65 (17.4%) |
| $500 to $799 | 183 (17.1%) | 183 (48.9%) |
| $800 to $999 | 167 (15.6%) | 15 (4.0%) |
| $1,000 to $1,499 | 303 (28.3%) | 16 (4.3%) |
| $1,500 to $1,999 | 106 (9.9%) | 0 (0.0%) |
| $2,000 to $2,499 | 11 (1.0%) | 0 (0.0%) |
| $2,500 to $2,999 | 23 (2.1%) | 0 (0.0%) |
| $3,000 or more | 20 (1.9%) | 53 (14.2%) |
| Total | 1,069 (100.0%) | 374 (100.0%) |
Physical Housing Characteristics in Marysville
Housing Structures in Marysville
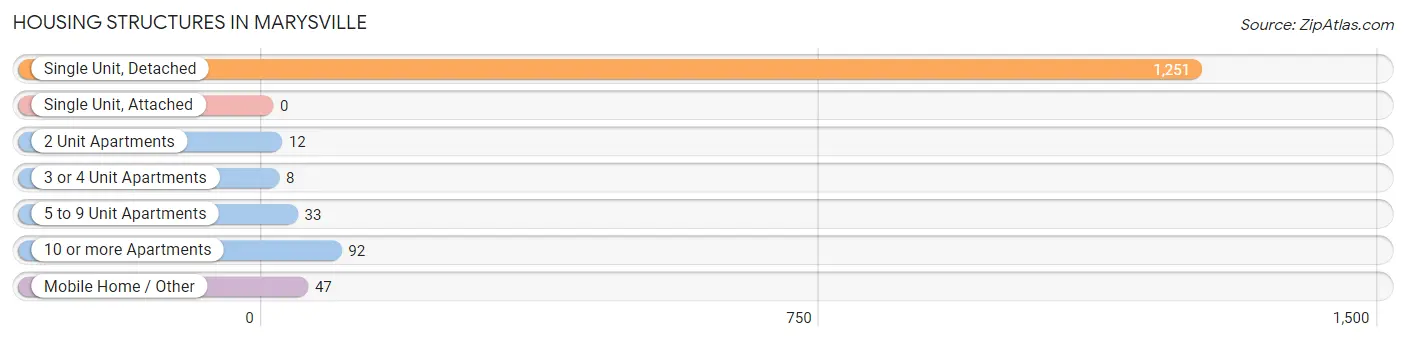
| Structure Type | # Housing Units | % Housing Units |
| Single Unit, Detached | 1,251 | 86.7% |
| Single Unit, Attached | 0 | 0.0% |
| 2 Unit Apartments | 12 | 0.8% |
| 3 or 4 Unit Apartments | 8 | 0.5% |
| 5 to 9 Unit Apartments | 33 | 2.3% |
| 10 or more Apartments | 92 | 6.4% |
| Mobile Home / Other | 47 | 3.3% |
| Total | 1,443 | 100.0% |
Housing Structures by Occupancy in Marysville
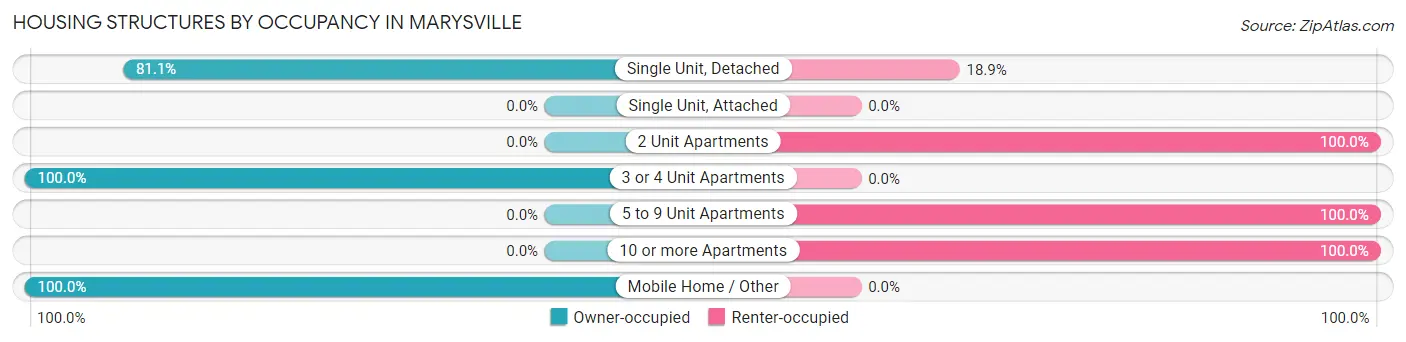
| Structure Type | Owner-occupied | Renter-occupied |
| Single Unit, Detached | 1,014 (81.1%) | 237 (18.9%) |
| Single Unit, Attached | 0 (0.0%) | 0 (0.0%) |
| 2 Unit Apartments | 0 (0.0%) | 12 (100.0%) |
| 3 or 4 Unit Apartments | 8 (100.0%) | 0 (0.0%) |
| 5 to 9 Unit Apartments | 0 (0.0%) | 33 (100.0%) |
| 10 or more Apartments | 0 (0.0%) | 92 (100.0%) |
| Mobile Home / Other | 47 (100.0%) | 0 (0.0%) |
| Total | 1,069 (74.1%) | 374 (25.9%) |
Housing Structures by Number of Rooms in Marysville
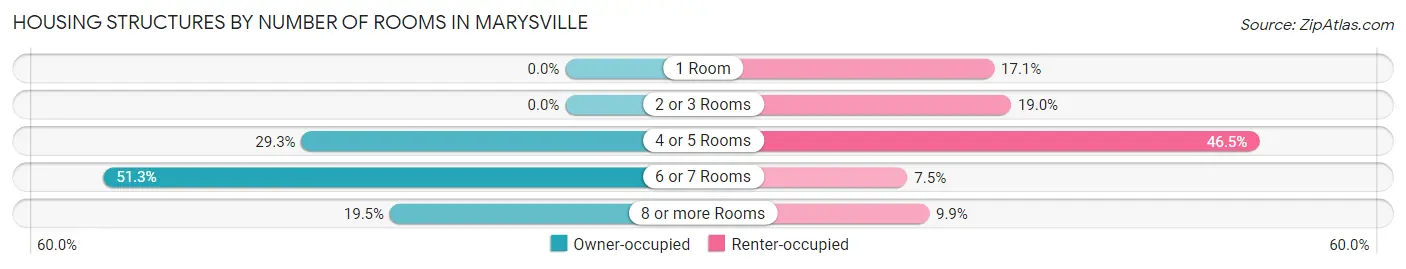
| Number of Rooms | Owner-occupied | Renter-occupied |
| 1 Room | 0 (0.0%) | 64 (17.1%) |
| 2 or 3 Rooms | 0 (0.0%) | 71 (19.0%) |
| 4 or 5 Rooms | 313 (29.3%) | 174 (46.5%) |
| 6 or 7 Rooms | 548 (51.3%) | 28 (7.5%) |
| 8 or more Rooms | 208 (19.5%) | 37 (9.9%) |
| Total | 1,069 (100.0%) | 374 (100.0%) |
Housing Structure by Heating Type in Marysville
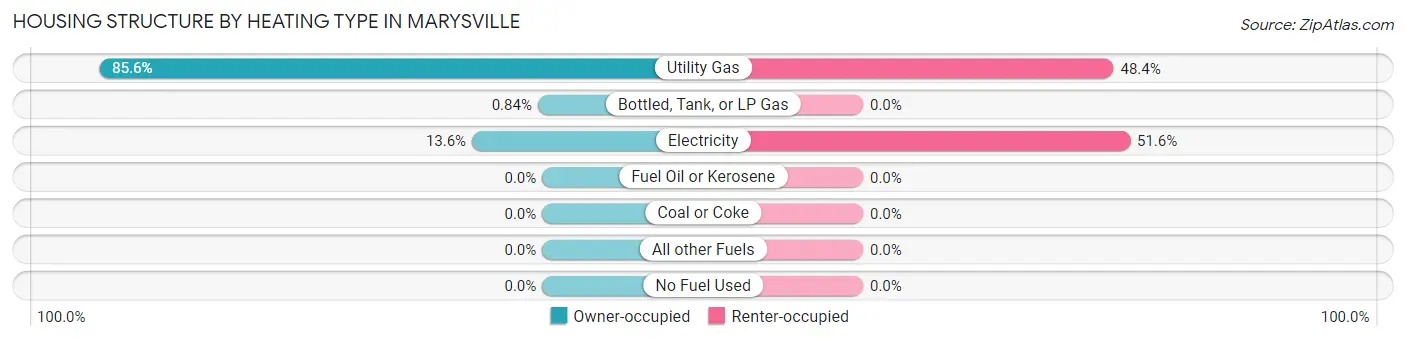
| Heating Type | Owner-occupied | Renter-occupied |
| Utility Gas | 915 (85.6%) | 181 (48.4%) |
| Bottled, Tank, or LP Gas | 9 (0.8%) | 0 (0.0%) |
| Electricity | 145 (13.6%) | 193 (51.6%) |
| Fuel Oil or Kerosene | 0 (0.0%) | 0 (0.0%) |
| Coal or Coke | 0 (0.0%) | 0 (0.0%) |
| All other Fuels | 0 (0.0%) | 0 (0.0%) |
| No Fuel Used | 0 (0.0%) | 0 (0.0%) |
| Total | 1,069 (100.0%) | 374 (100.0%) |
Household Vehicle Usage in Marysville

| Vehicles per Household | Owner-occupied | Renter-occupied |
| No Vehicle | 26 (2.4%) | 31 (8.3%) |
| 1 Vehicle | 240 (22.5%) | 272 (72.7%) |
| 2 Vehicles | 427 (39.9%) | 71 (19.0%) |
| 3 or more Vehicles | 376 (35.2%) | 0 (0.0%) |
| Total | 1,069 (100.0%) | 374 (100.0%) |
Real Estate & Mortgages in Marysville
Real Estate and Mortgage Overview in Marysville
| Characteristic | Without Mortgage | With Mortgage |
| Housing Units | 532 | 537 |
| Median Property Value | $85,700 | $115,300 |
| Median Household Income | $46,607 | $88 |
| Monthly Housing Costs | $526 | $9 |
| Real Estate Taxes | $1,509 | $0 |
Property Value by Mortgage Status in Marysville
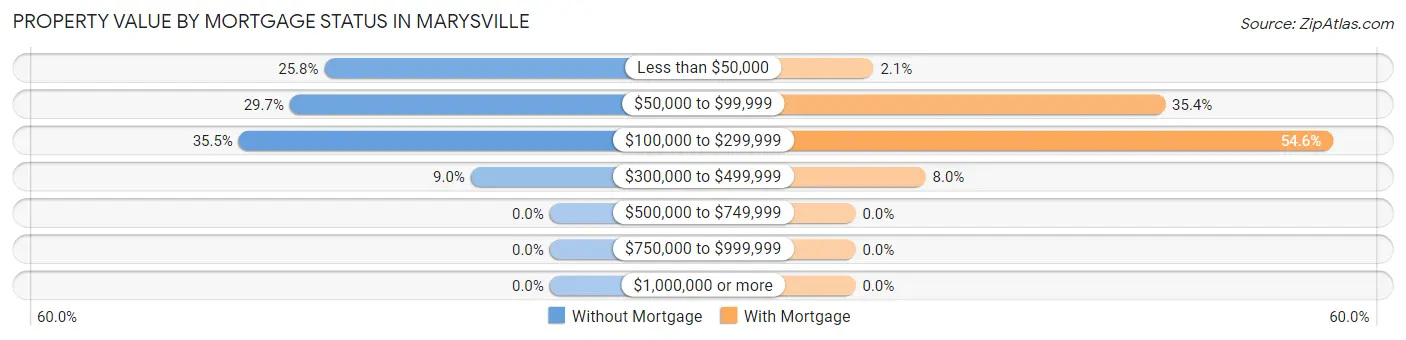
| Property Value | Without Mortgage | With Mortgage |
| Less than $50,000 | 137 (25.8%) | 11 (2.1%) |
| $50,000 to $99,999 | 158 (29.7%) | 190 (35.4%) |
| $100,000 to $299,999 | 189 (35.5%) | 293 (54.6%) |
| $300,000 to $499,999 | 48 (9.0%) | 43 (8.0%) |
| $500,000 to $749,999 | 0 (0.0%) | 0 (0.0%) |
| $750,000 to $999,999 | 0 (0.0%) | 0 (0.0%) |
| $1,000,000 or more | 0 (0.0%) | 0 (0.0%) |
| Total | 532 (100.0%) | 537 (100.0%) |
Household Income by Mortgage Status in Marysville
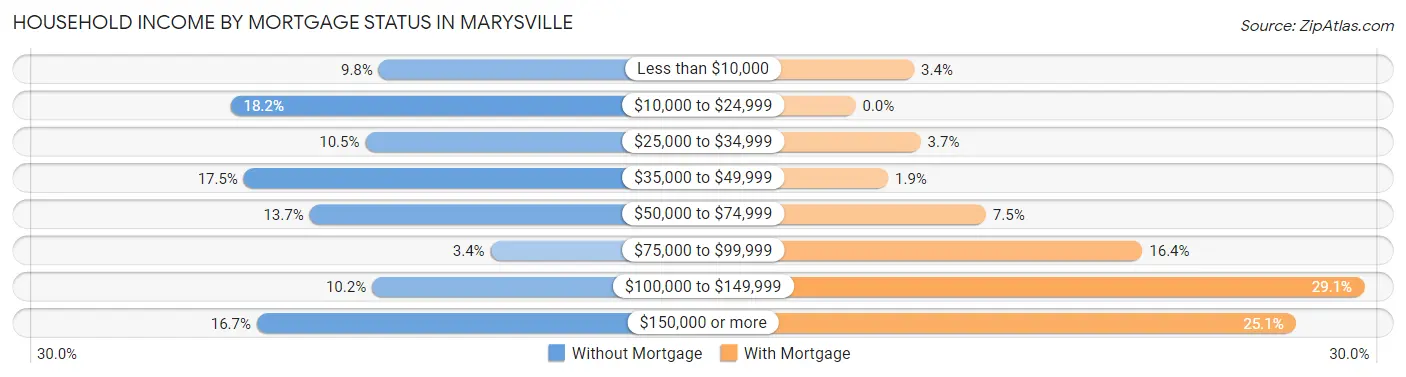
| Household Income | Without Mortgage | With Mortgage |
| Less than $10,000 | 52 (9.8%) | 18 (3.4%) |
| $10,000 to $24,999 | 97 (18.2%) | 0 (0.0%) |
| $25,000 to $34,999 | 56 (10.5%) | 20 (3.7%) |
| $35,000 to $49,999 | 93 (17.5%) | 10 (1.9%) |
| $50,000 to $74,999 | 73 (13.7%) | 40 (7.4%) |
| $75,000 to $99,999 | 18 (3.4%) | 88 (16.4%) |
| $100,000 to $149,999 | 54 (10.2%) | 156 (29.0%) |
| $150,000 or more | 89 (16.7%) | 135 (25.1%) |
| Total | 532 (100.0%) | 537 (100.0%) |
Property Value to Household Income Ratio in Marysville
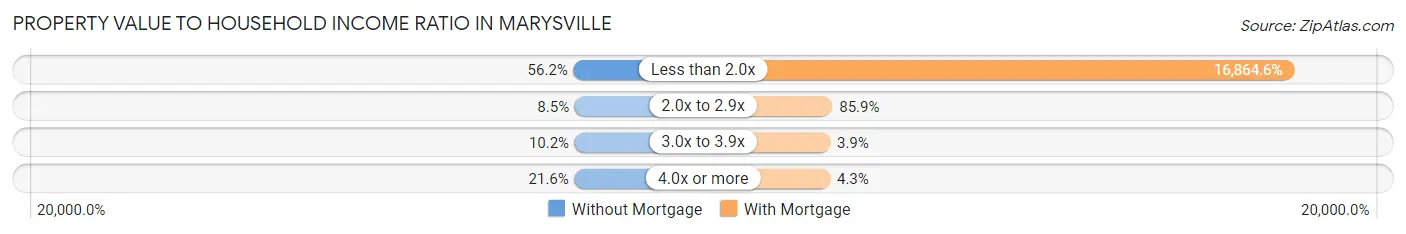
| Value-to-Income Ratio | Without Mortgage | With Mortgage |
| Less than 2.0x | 299 (56.2%) | 90,563 (16,864.6%) |
| 2.0x to 2.9x | 45 (8.5%) | 461 (85.9%) |
| 3.0x to 3.9x | 54 (10.2%) | 21 (3.9%) |
| 4.0x or more | 115 (21.6%) | 23 (4.3%) |
| Total | 532 (100.0%) | 537 (100.0%) |
Real Estate Taxes by Mortgage Status in Marysville
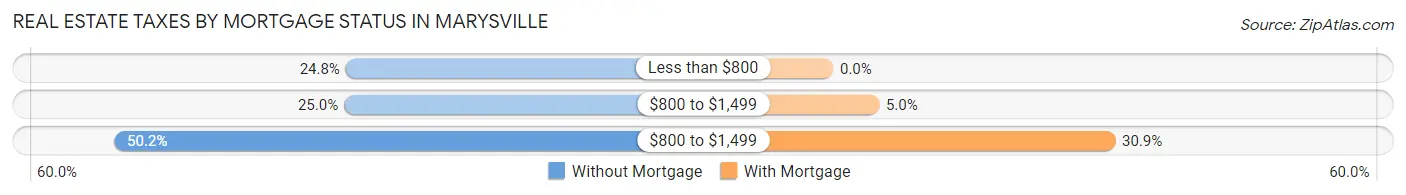
| Property Taxes | Without Mortgage | With Mortgage |
| Less than $800 | 132 (24.8%) | 0 (0.0%) |
| $800 to $1,499 | 133 (25.0%) | 27 (5.0%) |
| $800 to $1,499 | 267 (50.2%) | 166 (30.9%) |
| Total | 532 (100.0%) | 537 (100.0%) |
Health & Disability in Marysville
Health Insurance Coverage by Age in Marysville
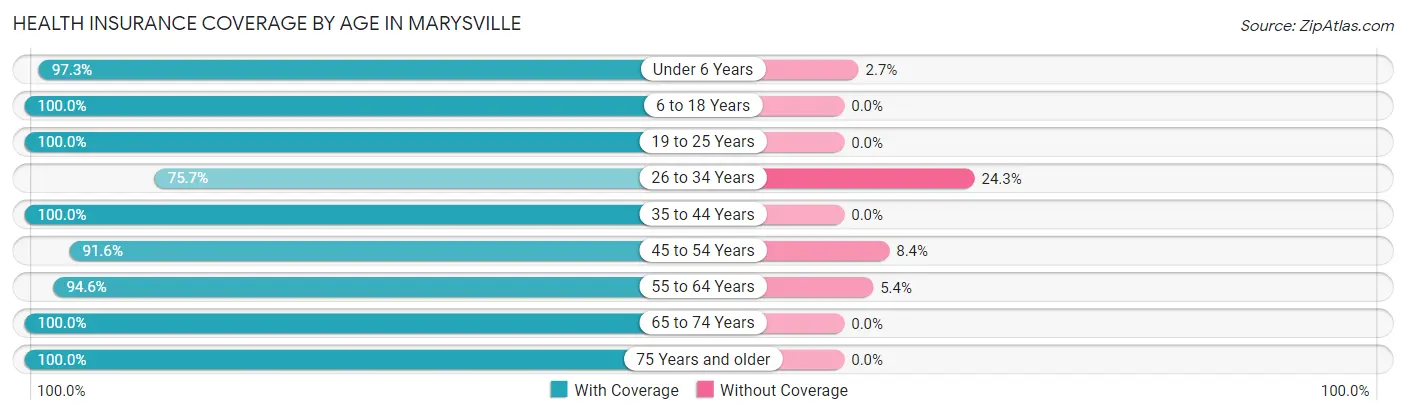
| Age Bracket | With Coverage | Without Coverage |
| Under 6 Years | 255 (97.3%) | 7 (2.7%) |
| 6 to 18 Years | 733 (100.0%) | 0 (0.0%) |
| 19 to 25 Years | 168 (100.0%) | 0 (0.0%) |
| 26 to 34 Years | 159 (75.7%) | 51 (24.3%) |
| 35 to 44 Years | 542 (100.0%) | 0 (0.0%) |
| 45 to 54 Years | 295 (91.6%) | 27 (8.4%) |
| 55 to 64 Years | 421 (94.6%) | 24 (5.4%) |
| 65 to 74 Years | 324 (100.0%) | 0 (0.0%) |
| 75 Years and older | 303 (100.0%) | 0 (0.0%) |
| Total | 3,200 (96.7%) | 109 (3.3%) |
Health Insurance Coverage by Citizenship Status in Marysville
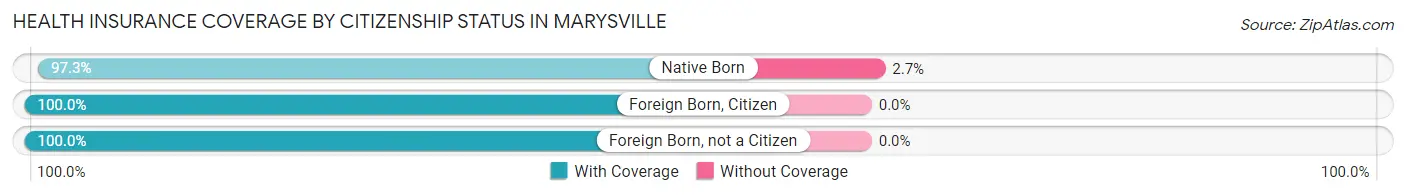
| Citizenship Status | With Coverage | Without Coverage |
| Native Born | 255 (97.3%) | 7 (2.7%) |
| Foreign Born, Citizen | 733 (100.0%) | 0 (0.0%) |
| Foreign Born, not a Citizen | 168 (100.0%) | 0 (0.0%) |
Health Insurance Coverage by Household Income in Marysville
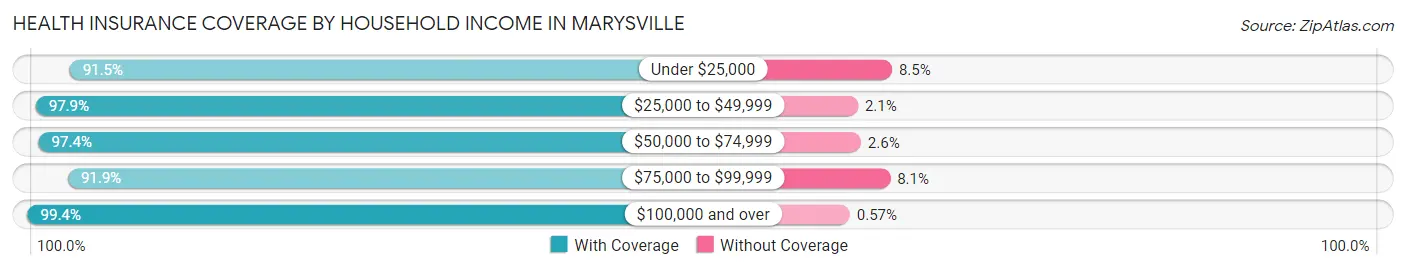
| Household Income | With Coverage | Without Coverage |
| Under $25,000 | 368 (91.5%) | 34 (8.5%) |
| $25,000 to $49,999 | 745 (97.9%) | 16 (2.1%) |
| $50,000 to $74,999 | 405 (97.4%) | 11 (2.6%) |
| $75,000 to $99,999 | 463 (91.9%) | 41 (8.1%) |
| $100,000 and over | 1,216 (99.4%) | 7 (0.6%) |
Public vs Private Health Insurance Coverage by Age in Marysville
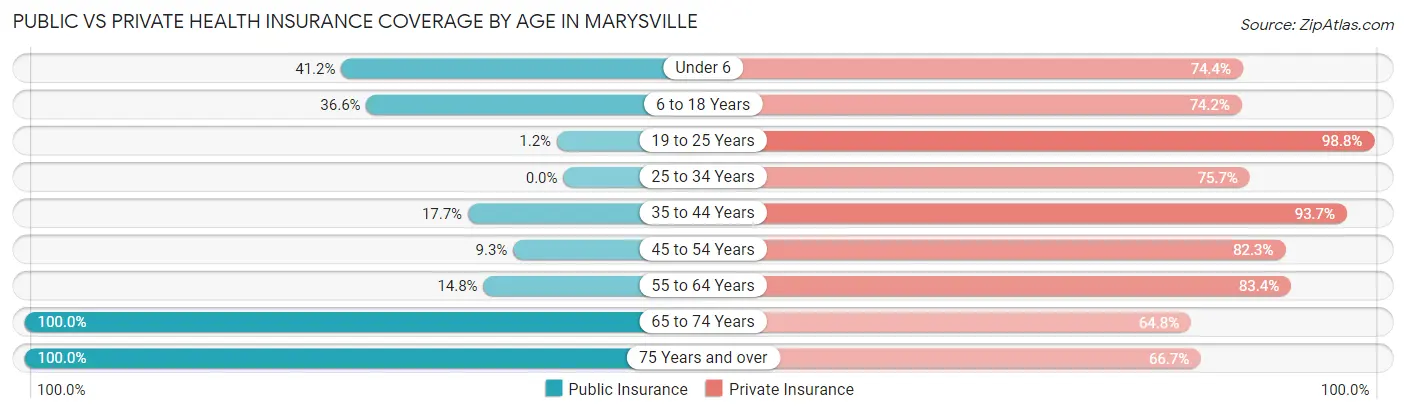
| Age Bracket | Public Insurance | Private Insurance |
| Under 6 | 108 (41.2%) | 195 (74.4%) |
| 6 to 18 Years | 268 (36.6%) | 544 (74.2%) |
| 19 to 25 Years | 2 (1.2%) | 166 (98.8%) |
| 25 to 34 Years | 0 (0.0%) | 159 (75.7%) |
| 35 to 44 Years | 96 (17.7%) | 508 (93.7%) |
| 45 to 54 Years | 30 (9.3%) | 265 (82.3%) |
| 55 to 64 Years | 66 (14.8%) | 371 (83.4%) |
| 65 to 74 Years | 324 (100.0%) | 210 (64.8%) |
| 75 Years and over | 303 (100.0%) | 202 (66.7%) |
| Total | 1,197 (36.2%) | 2,620 (79.2%) |
Disability Status by Sex by Age in Marysville
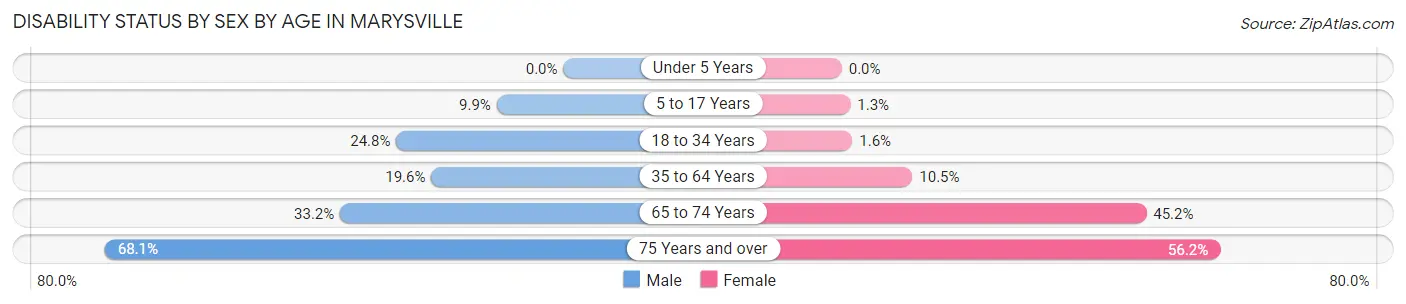
| Age Bracket | Male | Female |
| Under 5 Years | 0 (0.0%) | 0 (0.0%) |
| 5 to 17 Years | 38 (9.9%) | 5 (1.3%) |
| 18 to 34 Years | 67 (24.8%) | 2 (1.6%) |
| 35 to 64 Years | 122 (19.6%) | 72 (10.5%) |
| 65 to 74 Years | 59 (33.2%) | 66 (45.2%) |
| 75 Years and over | 96 (68.1%) | 91 (56.2%) |
Disability Class by Sex by Age in Marysville
Disability Class: Hearing Difficulty
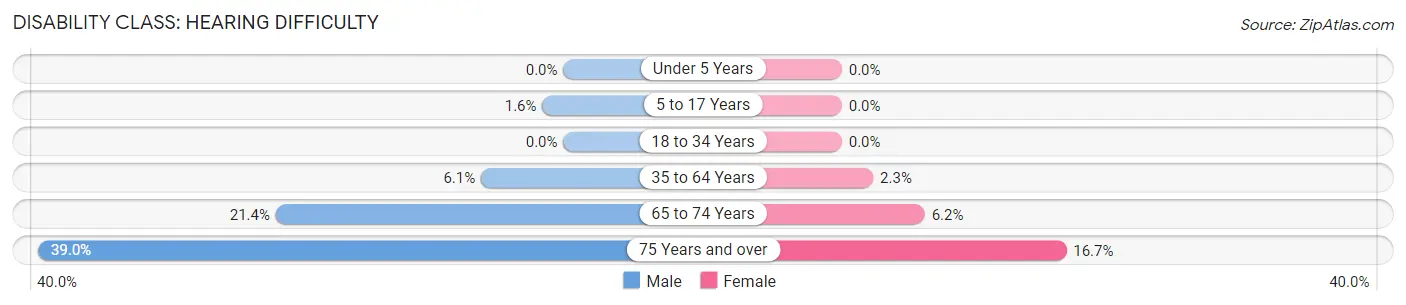
| Age Bracket | Male | Female |
| Under 5 Years | 0 (0.0%) | 0 (0.0%) |
| 5 to 17 Years | 6 (1.6%) | 0 (0.0%) |
| 18 to 34 Years | 0 (0.0%) | 0 (0.0%) |
| 35 to 64 Years | 38 (6.1%) | 16 (2.3%) |
| 65 to 74 Years | 38 (21.3%) | 9 (6.2%) |
| 75 Years and over | 55 (39.0%) | 27 (16.7%) |
Disability Class: Vision Difficulty
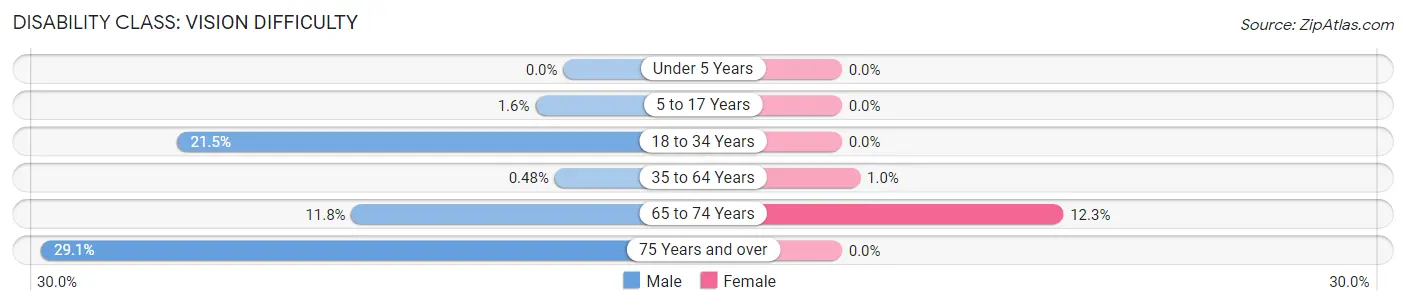
| Age Bracket | Male | Female |
| Under 5 Years | 0 (0.0%) | 0 (0.0%) |
| 5 to 17 Years | 6 (1.6%) | 0 (0.0%) |
| 18 to 34 Years | 58 (21.5%) | 0 (0.0%) |
| 35 to 64 Years | 3 (0.5%) | 7 (1.0%) |
| 65 to 74 Years | 21 (11.8%) | 18 (12.3%) |
| 75 Years and over | 41 (29.1%) | 0 (0.0%) |
Disability Class: Cognitive Difficulty
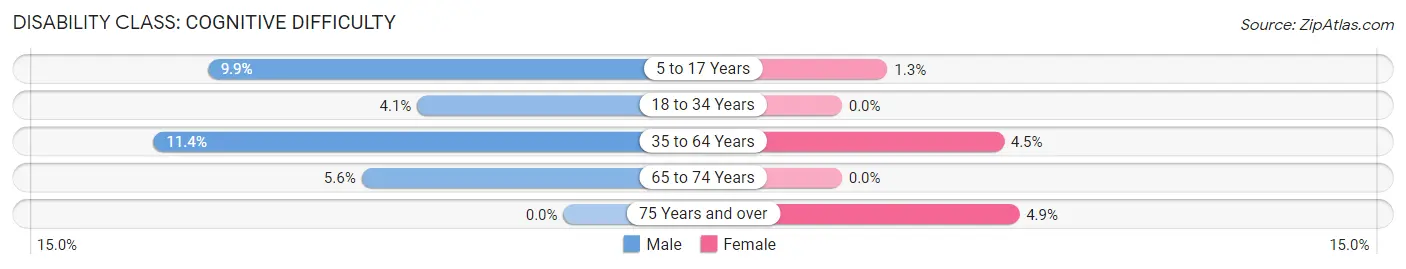
| Age Bracket | Male | Female |
| 5 to 17 Years | 38 (9.9%) | 5 (1.3%) |
| 18 to 34 Years | 11 (4.1%) | 0 (0.0%) |
| 35 to 64 Years | 71 (11.4%) | 31 (4.5%) |
| 65 to 74 Years | 10 (5.6%) | 0 (0.0%) |
| 75 Years and over | 0 (0.0%) | 8 (4.9%) |
Disability Class: Ambulatory Difficulty
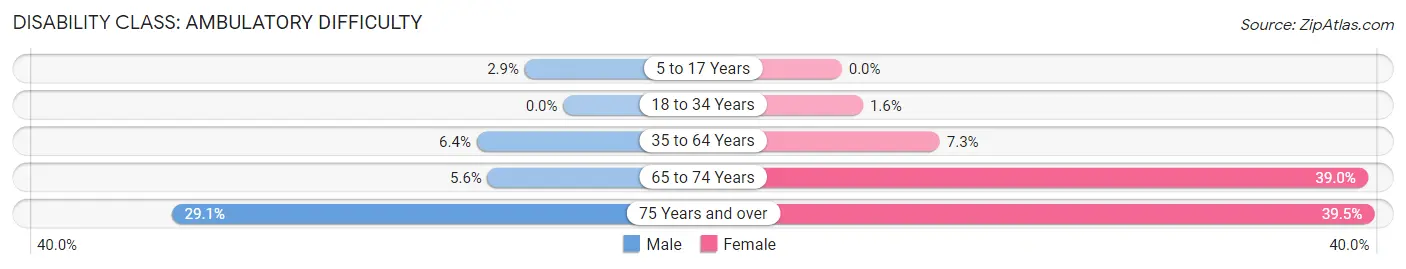
| Age Bracket | Male | Female |
| 5 to 17 Years | 11 (2.9%) | 0 (0.0%) |
| 18 to 34 Years | 0 (0.0%) | 2 (1.6%) |
| 35 to 64 Years | 40 (6.4%) | 50 (7.3%) |
| 65 to 74 Years | 10 (5.6%) | 57 (39.0%) |
| 75 Years and over | 41 (29.1%) | 64 (39.5%) |
Disability Class: Self-Care Difficulty
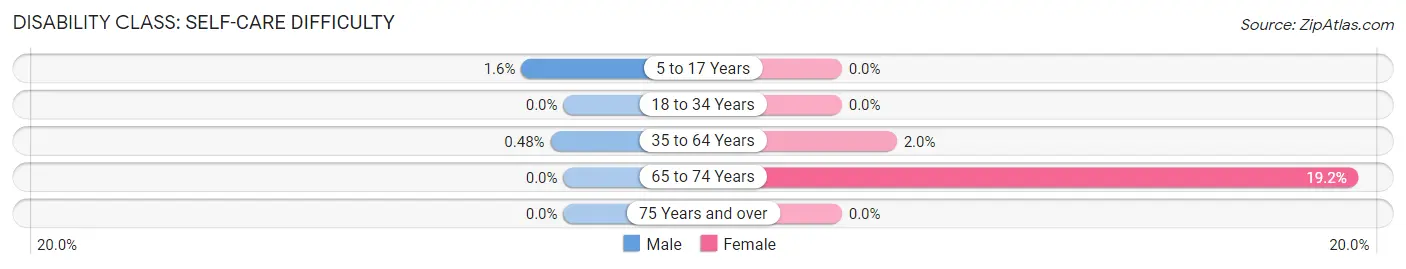
| Age Bracket | Male | Female |
| 5 to 17 Years | 6 (1.6%) | 0 (0.0%) |
| 18 to 34 Years | 0 (0.0%) | 0 (0.0%) |
| 35 to 64 Years | 3 (0.5%) | 14 (2.0%) |
| 65 to 74 Years | 0 (0.0%) | 28 (19.2%) |
| 75 Years and over | 0 (0.0%) | 0 (0.0%) |
Technology Access in Marysville
Computing Device Access in Marysville
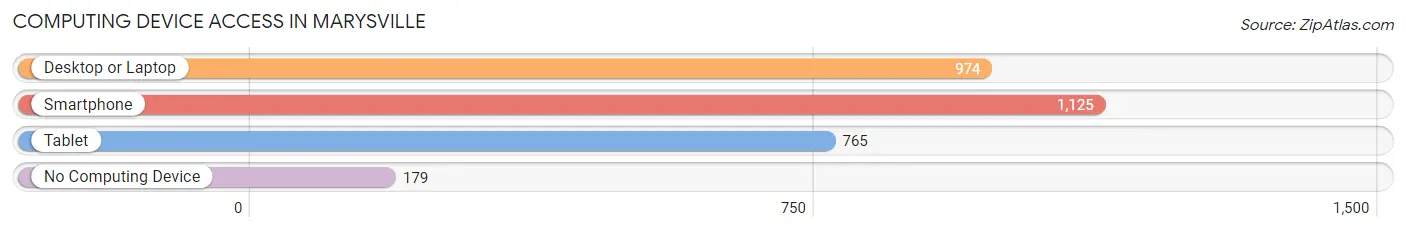
| Device Type | # Households | % Households |
| Desktop or Laptop | 974 | 67.5% |
| Smartphone | 1,125 | 78.0% |
| Tablet | 765 | 53.0% |
| No Computing Device | 179 | 12.4% |
| Total | 1,443 | 100.0% |
Internet Access in Marysville
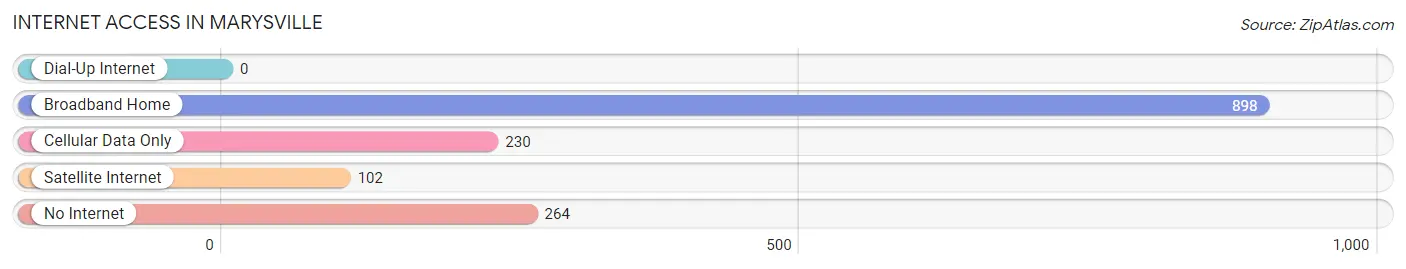
| Internet Type | # Households | % Households |
| Dial-Up Internet | 0 | 0.0% |
| Broadband Home | 898 | 62.2% |
| Cellular Data Only | 230 | 15.9% |
| Satellite Internet | 102 | 7.1% |
| No Internet | 264 | 18.3% |
| Total | 1,443 | 100.0% |
Marysville Summary
Marysville, Kansas is a small city located in Marshall County, in the northeastern part of the state. It is situated on the Big Blue River, and is the county seat of Marshall County. The city has a population of 2,845, according to the 2010 census.
History
The area that is now Marysville was first settled in 1854 by a group of settlers from Ohio. The town was originally called Blue Rapids, but was later renamed Marysville in honor of Mary Ann (Molly) Miller, the daughter of one of the original settlers. The town was officially incorporated in 1857.
In the late 19th century, Marysville was a bustling agricultural center, with a variety of businesses and industries. The town was also home to a number of churches, schools, and other civic organizations.
In the early 20th century, Marysville experienced a period of growth and prosperity. The town was home to a number of businesses, including a flour mill, a creamery, a canning factory, and a brickyard. The town also had a number of churches, schools, and other civic organizations.
In the mid-20th century, Marysville experienced a period of decline. The town’s population decreased, and many of the businesses and industries closed. The town’s economy shifted to focus on agriculture and tourism.
Geography
Marysville is located in northeastern Kansas, in Marshall County. The city is situated on the Big Blue River, and is surrounded by rolling hills and farmland. The city has a total area of 2.2 square miles, all of which is land.
The climate in Marysville is characterized by hot, humid summers and cold, dry winters. The average annual temperature is 54 degrees Fahrenheit, and the average annual precipitation is 33 inches.
Economy
The economy of Marysville is largely based on agriculture and tourism. The city is home to a number of farms, and the surrounding area is known for its production of corn, soybeans, and wheat.
The city is also home to a number of businesses, including restaurants, retail stores, and service providers. The city is also home to a number of manufacturing companies, including a plastics manufacturer and a metal fabrication company.
The city is also home to a number of tourist attractions, including the Marshall County Historical Museum, the Marysville Public Library, and the Marysville Golf Course.
Demographics
According to the 2010 census, the population of Marysville is 2,845. The population is predominantly white (94.3%), with small percentages of African American (2.2%), Native American (0.7%), Asian (0.5%), and other races (2.3%).
The median household income in Marysville is $41,944, and the median family income is $50,917. The median age of the population is 38.7 years. The city has a poverty rate of 16.3%.
Conclusion
Marysville, Kansas is a small city located in Marshall County, in the northeastern part of the state. It is situated on the Big Blue River, and is the county seat of Marshall County. The city has a population of 2,845, according to the 2010 census. The economy of Marysville is largely based on agriculture and tourism, and the city is home to a number of businesses, including restaurants, retail stores, and service providers. The population of Marysville is predominantly white, with small percentages of African American, Native American, Asian, and other races. The median household income in Marysville is $41,944, and the median family income is $50,917. The city has a poverty rate of 16.3%.
Common Questions
What is Per Capita Income in Marysville?
Per Capita income in Marysville is $35,131.
What is the Median Family Income in Marysville?
Median Family Income in Marysville is $79,574.
What is the Median Household income in Marysville?
Median Household Income in Marysville is $53,424.
What is Income or Wage Gap in Marysville?
Income or Wage Gap in Marysville is 31.7%.
Women in Marysville earn 68.3 cents for every dollar earned by a man.
What is Inequality or Gini Index in Marysville?
Inequality or Gini Index in Marysville is 0.49.
What is the Total Population of Marysville?
Total Population of Marysville is 3,414.
What is the Total Male Population of Marysville?
Total Male Population of Marysville is 1,733.
What is the Total Female Population of Marysville?
Total Female Population of Marysville is 1,681.
What is the Ratio of Males per 100 Females in Marysville?
There are 103.09 Males per 100 Females in Marysville.
What is the Ratio of Females per 100 Males in Marysville?
There are 97.00 Females per 100 Males in Marysville.
What is the Median Population Age in Marysville?
Median Population Age in Marysville is 38.8 Years.
What is the Average Family Size in Marysville
Average Family Size in Marysville is 3.2 People.
What is the Average Household Size in Marysville
Average Household Size in Marysville is 2.3 People.
How Large is the Labor Force in Marysville?
There are 1,656 People in the Labor Forcein in Marysville.
What is the Percentage of People in the Labor Force in Marysville?
65.3% of People are in the Labor Force in Marysville.
What is the Unemployment Rate in Marysville?
Unemployment Rate in Marysville is 3.1%.