Cities with the Highest Percentage of Owner-Occupied Units in Kansas
RELATED REPORTS & OPTIONS
Highest Owner-Occupied
Kansas
Compare Cities
Map of Cities with the Highest Percentage of Owner-Occupied Units in Kansas
0.0%
100.0%
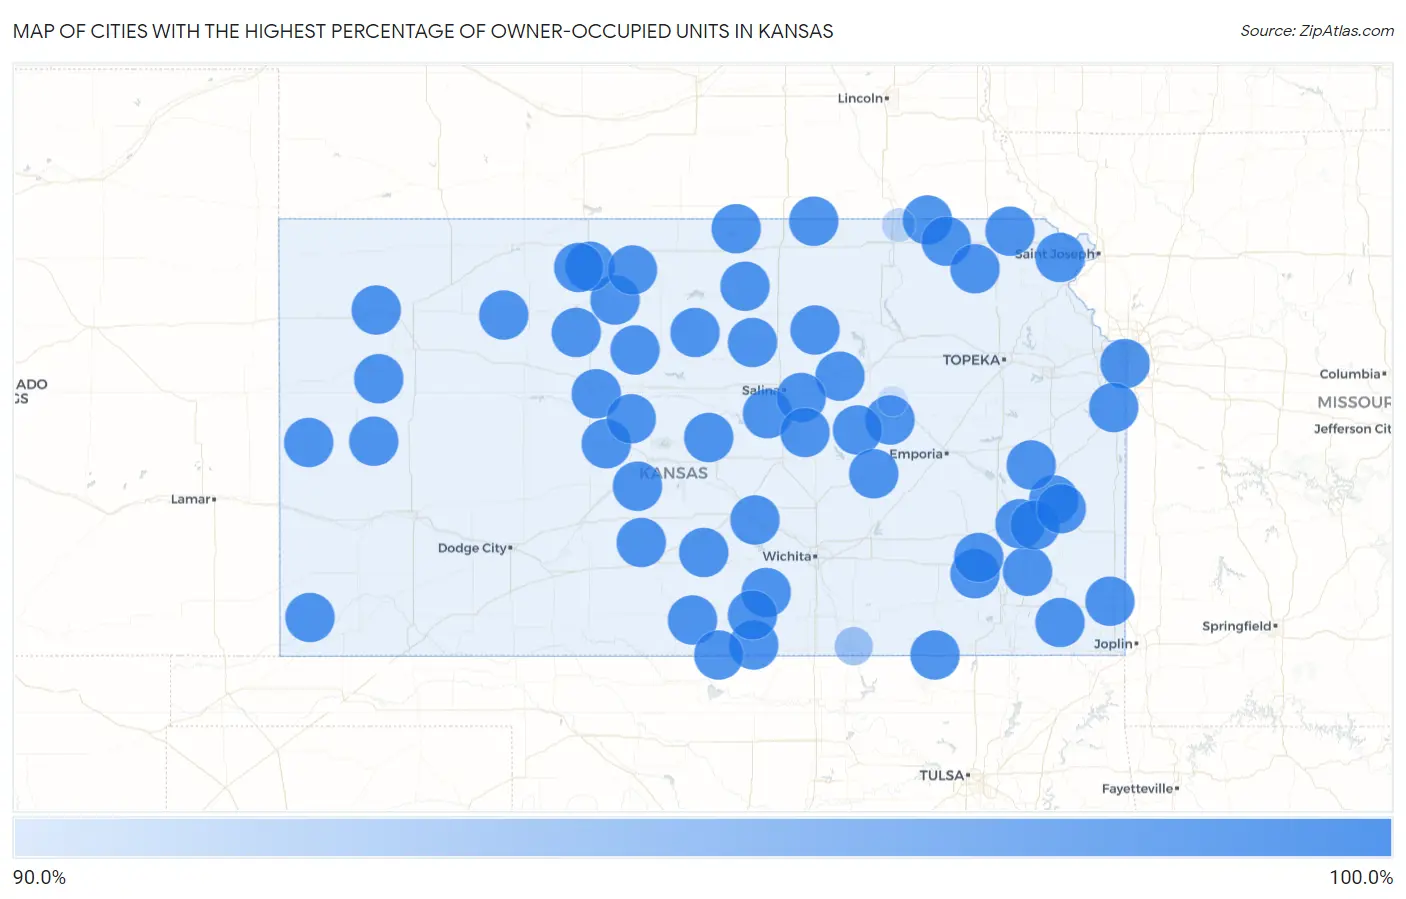
Cities with the Highest Percentage of Owner-Occupied Units in Kansas
| City | % Owner-Occupied | vs State | vs National | |
| 1. | Mission Hills | 100.0% | 66.9% (+33.1)#1 | 64.8% (+35.2)#5 |
| 2. | Chicopee | 100.0% | 66.9% (+33.1)#2 | 64.8% (+35.2)#350 |
| 3. | Elyria | 100.0% | 66.9% (+33.1)#3 | 64.8% (+35.2)#544 |
| 4. | Bremen | 100.0% | 66.9% (+33.1)#4 | 64.8% (+35.2)#659 |
| 5. | Dennis | 100.0% | 66.9% (+33.1)#5 | 64.8% (+35.2)#830 |
| 6. | Wilsey | 100.0% | 66.9% (+33.1)#6 | 64.8% (+35.2)#906 |
| 7. | Summerfield | 100.0% | 66.9% (+33.1)#7 | 64.8% (+35.2)#926 |
| 8. | Milton | 100.0% | 66.9% (+33.1)#8 | 64.8% (+35.2)#943 |
| 9. | Falun | 100.0% | 66.9% (+33.1)#9 | 64.8% (+35.2)#960 |
| 10. | Morland | 100.0% | 66.9% (+33.1)#10 | 64.8% (+35.2)#981 |
| 11. | Detroit | 100.0% | 66.9% (+33.1)#11 | 64.8% (+35.2)#986 |
| 12. | Bendena | 100.0% | 66.9% (+33.1)#13 | 64.8% (+35.2)#1,039 |
| 13. | Mentor | 100.0% | 66.9% (+33.1)#14 | 64.8% (+35.2)#1,040 |
| 14. | Earlton | 100.0% | 66.9% (+33.1)#15 | 64.8% (+35.2)#1,089 |
| 15. | Sycamore | 100.0% | 66.9% (+33.1)#16 | 64.8% (+35.2)#1,103 |
| 16. | Baileyville | 100.0% | 66.9% (+33.1)#17 | 64.8% (+35.2)#1,111 |
| 17. | Radley | 100.0% | 66.9% (+33.1)#18 | 64.8% (+35.2)#1,181 |
| 18. | Sharon | 100.0% | 66.9% (+33.1)#19 | 64.8% (+35.2)#1,202 |
| 19. | Hunter | 100.0% | 66.9% (+33.1)#20 | 64.8% (+35.2)#1,213 |
| 20. | Woodston | 100.0% | 66.9% (+33.1)#21 | 64.8% (+35.2)#1,263 |
| 21. | Croweburg | 100.0% | 66.9% (+33.1)#22 | 64.8% (+35.2)#1,314 |
| 22. | Bucyrus | 100.0% | 66.9% (+33.1)#23 | 64.8% (+35.2)#1,337 |
| 23. | Centropolis | 100.0% | 66.9% (+33.1)#24 | 64.8% (+35.2)#1,338 |
| 24. | Levant | 100.0% | 66.9% (+33.1)#25 | 64.8% (+35.2)#1,354 |
| 25. | Munjor | 100.0% | 66.9% (+33.1)#26 | 64.8% (+35.2)#1,357 |
| 26. | Kipp | 100.0% | 66.9% (+33.1)#27 | 64.8% (+35.2)#1,382 |
| 27. | Peck | 100.0% | 66.9% (+33.1)#28 | 64.8% (+35.2)#1,434 |
| 28. | Lost Springs | 100.0% | 66.9% (+33.1)#29 | 64.8% (+35.2)#1,467 |
| 29. | Yale | 100.0% | 66.9% (+33.1)#30 | 64.8% (+35.2)#1,488 |
| 30. | Horace | 100.0% | 66.9% (+33.1)#31 | 64.8% (+35.2)#1,540 |
| 31. | Farlington | 100.0% | 66.9% (+33.1)#32 | 64.8% (+35.2)#1,616 |
| 32. | Goff | 100.0% | 66.9% (+33.1)#33 | 64.8% (+35.2)#1,617 |
| 33. | Glade | 100.0% | 66.9% (+33.1)#34 | 64.8% (+35.2)#1,618 |
| 34. | Piqua | 100.0% | 66.9% (+33.1)#35 | 64.8% (+35.2)#1,619 |
| 35. | Zurich | 100.0% | 66.9% (+33.1)#36 | 64.8% (+35.2)#1,623 |
| 36. | New Albany | 100.0% | 66.9% (+33.1)#38 | 64.8% (+35.2)#1,720 |
| 37. | Shallow Water | 100.0% | 66.9% (+33.1)#39 | 64.8% (+35.2)#1,721 |
| 38. | Hallowell | 100.0% | 66.9% (+33.1)#40 | 64.8% (+35.2)#1,722 |
| 39. | Stuttgart | 100.0% | 66.9% (+33.1)#41 | 64.8% (+35.2)#1,729 |
| 40. | Somerset | 100.0% | 66.9% (+33.1)#42 | 64.8% (+35.2)#1,785 |
| 41. | Coyville | 100.0% | 66.9% (+33.1)#43 | 64.8% (+35.2)#1,796 |
| 42. | Furley | 100.0% | 66.9% (+33.1)#44 | 64.8% (+35.2)#1,797 |
| 43. | Mahaska | 100.0% | 66.9% (+33.1)#45 | 64.8% (+35.2)#1,807 |
| 44. | Elgin | 100.0% | 66.9% (+33.1)#46 | 64.8% (+35.2)#1,808 |
| 45. | Wabaunsee | 100.0% | 66.9% (+33.1)#47 | 64.8% (+35.2)#1,855 |
| 46. | Devon | 100.0% | 66.9% (+33.1)#48 | 64.8% (+35.2)#1,856 |
| 47. | Yoder | 100.0% | 66.9% (+33.1)#49 | 64.8% (+35.2)#1,886 |
| 48. | Bluff City | 100.0% | 66.9% (+33.1)#50 | 64.8% (+35.2)#1,897 |
| 49. | Marienthal | 100.0% | 66.9% (+33.1)#51 | 64.8% (+35.2)#1,898 |
| 50. | Newbury | 100.0% | 66.9% (+33.1)#52 | 64.8% (+35.2)#1,932 |
| 51. | Timken | 100.0% | 66.9% (+33.1)#53 | 64.8% (+35.2)#1,950 |
| 52. | Beaumont | 100.0% | 66.9% (+33.1)#54 | 64.8% (+35.2)#1,951 |
| 53. | Frederick | 100.0% | 66.9% (+33.1)#55 | 64.8% (+35.2)#1,995 |
| 54. | Paradise | 100.0% | 66.9% (+33.1)#56 | 64.8% (+35.2)#2,023 |
| 55. | Silverdale | 100.0% | 66.9% (+33.1)#57 | 64.8% (+35.2)#2,045 |
| 56. | Lone Elm | 100.0% | 66.9% (+33.1)#58 | 64.8% (+35.2)#2,046 |
| 57. | Ada | 100.0% | 66.9% (+33.1)#59 | 64.8% (+35.2)#2,063 |
| 58. | Idana | 100.0% | 66.9% (+33.1)#60 | 64.8% (+35.2)#2,064 |
| 59. | Neal | 100.0% | 66.9% (+33.1)#61 | 64.8% (+35.2)#2,065 |
| 60. | St. Benedict | 100.0% | 66.9% (+33.1)#62 | 64.8% (+35.2)#2,090 |
| 61. | South Mound | 100.0% | 66.9% (+33.1)#63 | 64.8% (+35.2)#2,154 |
| 62. | Russell Springs | 100.0% | 66.9% (+33.1)#64 | 64.8% (+35.2)#2,155 |
| 63. | Mont Ida | 100.0% | 66.9% (+33.1)#65 | 64.8% (+35.2)#2,156 |
| 64. | Webber | 100.0% | 66.9% (+33.1)#66 | 64.8% (+35.2)#2,172 |
| 65. | Zeandale | 100.0% | 66.9% (+33.1)#67 | 64.8% (+35.2)#2,173 |
| 66. | Danville | 100.0% | 66.9% (+33.1)#68 | 64.8% (+35.2)#2,231 |
| 67. | Scottsville | 100.0% | 66.9% (+33.1)#69 | 64.8% (+35.2)#2,232 |
| 68. | Bassett | 100.0% | 66.9% (+33.1)#70 | 64.8% (+35.2)#2,246 |
| 69. | Labette | 100.0% | 66.9% (+33.1)#71 | 64.8% (+35.2)#2,266 |
| 70. | New Salem | 100.0% | 66.9% (+33.1)#72 | 64.8% (+35.2)#2,268 |
| 71. | Bavaria | 100.0% | 66.9% (+33.1)#73 | 64.8% (+35.2)#2,269 |
| 72. | Speed | 100.0% | 66.9% (+33.1)#74 | 64.8% (+35.2)#2,270 |
| 73. | Urbana | 100.0% | 66.9% (+33.1)#75 | 64.8% (+35.2)#2,307 |
| 74. | Galatia | 100.0% | 66.9% (+33.1)#76 | 64.8% (+35.2)#2,308 |
| 75. | Big Bow | 100.0% | 66.9% (+33.1)#77 | 64.8% (+35.2)#2,327 |
| 76. | Richfield | 100.0% | 66.9% (+33.1)#78 | 64.8% (+35.2)#2,328 |
| 77. | Beaver | 100.0% | 66.9% (+33.1)#79 | 64.8% (+35.2)#2,355 |
| 78. | Eastshore | 100.0% | 66.9% (+33.1)#80 | 64.8% (+35.2)#2,372 |
| 79. | Oak Hill | 100.0% | 66.9% (+33.1)#81 | 64.8% (+35.2)#2,394 |
| 80. | Hamlin | 100.0% | 66.9% (+33.1)#82 | 64.8% (+35.2)#2,437 |
| 81. | Cedar | 100.0% | 66.9% (+33.1)#83 | 64.8% (+35.2)#2,458 |
| 82. | Radium | 100.0% | 66.9% (+33.1)#84 | 64.8% (+35.2)#2,459 |
| 83. | Byers | 100.0% | 66.9% (+33.1)#85 | 64.8% (+35.2)#2,484 |
| 84. | Ogallah | 100.0% | 66.9% (+33.1)#86 | 64.8% (+35.2)#2,485 |
| 85. | Mildred | 100.0% | 66.9% (+33.1)#87 | 64.8% (+35.2)#2,486 |
| 86. | Opolis | 100.0% | 66.9% (+33.1)#88 | 64.8% (+35.2)#2,501 |
| 87. | Harris | 100.0% | 66.9% (+33.1)#89 | 64.8% (+35.2)#2,503 |
| 88. | Garland | 100.0% | 66.9% (+33.1)#90 | 64.8% (+35.2)#2,504 |
| 89. | Waldron | 100.0% | 66.9% (+33.1)#91 | 64.8% (+35.2)#2,539 |
| 90. | Norway | 100.0% | 66.9% (+33.1)#92 | 64.8% (+35.2)#2,540 |
| 91. | Edson | 100.0% | 66.9% (+33.1)#93 | 64.8% (+35.2)#2,541 |
| 92. | Bridgeport | 100.0% | 66.9% (+33.1)#94 | 64.8% (+35.2)#2,562 |
| 93. | Roxbury | 100.0% | 66.9% (+33.1)#95 | 64.8% (+35.2)#2,576 |
| 94. | Woodruff | 100.0% | 66.9% (+33.1)#96 | 64.8% (+35.2)#2,611 |
| 95. | Penalosa | 100.0% | 66.9% (+33.1)#97 | 64.8% (+35.2)#2,622 |
| 96. | Cedar Point | 100.0% | 66.9% (+33.1)#98 | 64.8% (+35.2)#2,632 |
| 97. | Kelly | 100.0% | 66.9% (+33.1)#99 | 64.8% (+35.2)#2,637 |
| 98. | Parkerfield | 99.1% | 66.9% (+32.2)#100 | 64.8% (+34.2)#2,691 |
| 99. | Oketo | 98.7% | 66.9% (+31.8)#101 | 64.8% (+33.9)#2,736 |
| 100. | Parkerville | 98.4% | 66.9% (+31.6)#102 | 64.8% (+33.6)#2,781 |
Common Questions
What are the Top 10 Cities with the Highest Percentage of Owner-Occupied Units in Kansas?
Top 10 Cities with the Highest Percentage of Owner-Occupied Units in Kansas are:
#1
100.0%
#2
100.0%
#3
100.0%
#4
100.0%
#5
100.0%
#6
100.0%
#7
100.0%
#8
100.0%
#9
100.0%
#10
100.0%
What city has the Highest Percentage of Owner-Occupied Units in Kansas?
Mission Hills has the Highest Percentage of Owner-Occupied Units in Kansas with 100.0%.
What is the Percentage of Owner-Occupied Units in the State of Kansas?
Percentage of Owner-Occupied Units in Kansas is 66.9%.
What is the Percentage of Owner-Occupied Units in the United States?
Percentage of Owner-Occupied Units in the United States is 64.8%.