Ottawa vs Tlingit-Haida Wage/Income Gap
COMPARE
Ottawa
Tlingit-Haida
Wage/Income Gap
Wage/Income Gap Comparison
Ottawa
Tlingit-Haida
27.0%
WAGE/INCOME GAP
5.3/ 100
METRIC RATING
230th/ 347
METRIC RANK
24.0%
WAGE/INCOME GAP
98.7/ 100
METRIC RATING
104th/ 347
METRIC RANK
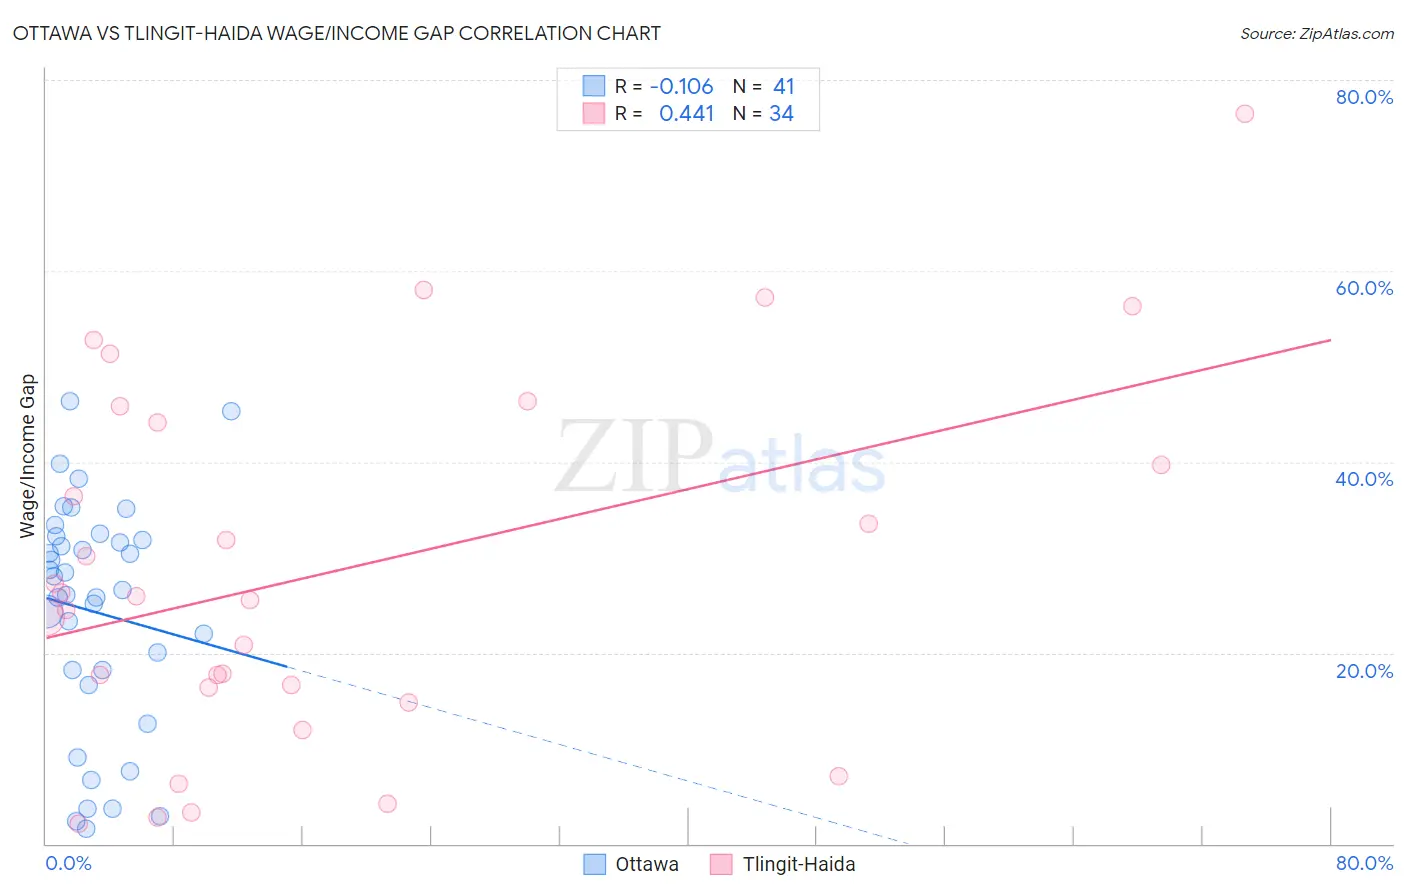
Ottawa vs Tlingit-Haida Wage/Income Gap Correlation Chart
The statistical analysis conducted on geographies consisting of 49,945,393 people shows a poor negative correlation between the proportion of Ottawa and wage/income gap percentage in the United States with a correlation coefficient (R) of -0.106 and weighted average of 27.0%. Similarly, the statistical analysis conducted on geographies consisting of 60,845,560 people shows a moderate positive correlation between the proportion of Tlingit-Haida and wage/income gap percentage in the United States with a correlation coefficient (R) of 0.441 and weighted average of 24.0%, a difference of 12.6%.
Wage/Income Gap Correlation Summary
| Measurement | Ottawa | Tlingit-Haida |
| Minimum | 1.6% | 2.1% |
| Maximum | 46.4% | 76.5% |
| Range | 44.8% | 74.4% |
| Mean | 24.3% | 28.6% |
| Median | 26.5% | 25.7% |
| Interquartile 25% (IQ1) | 17.4% | 16.3% |
| Interquartile 75% (IQ3) | 32.0% | 44.2% |
| Interquartile Range (IQR) | 14.6% | 27.9% |
| Standard Deviation (Sample) | 12.0% | 18.9% |
| Standard Deviation (Population) | 11.8% | 18.6% |
Similar Demographics by Wage/Income Gap
Demographics Similar to Ottawa by Wage/Income Gap
In terms of wage/income gap, the demographic groups most similar to Ottawa are Bhutanese (27.0%, a difference of 0.030%), Immigrants from Asia (27.0%, a difference of 0.050%), Argentinean (27.0%, a difference of 0.050%), Immigrants from Turkey (27.0%, a difference of 0.080%), and Spaniard (27.0%, a difference of 0.090%).
| Demographics | Rating | Rank | Wage/Income Gap |
| Jordanians | 8.0 /100 | #223 | Tragic 26.8% |
| Immigrants | Argentina | 7.2 /100 | #224 | Tragic 26.8% |
| Immigrants | Ireland | 6.5 /100 | #225 | Tragic 26.9% |
| Asians | 5.9 /100 | #226 | Tragic 26.9% |
| Spaniards | 5.6 /100 | #227 | Tragic 27.0% |
| Immigrants | Turkey | 5.6 /100 | #228 | Tragic 27.0% |
| Immigrants | Asia | 5.5 /100 | #229 | Tragic 27.0% |
| Ottawa | 5.3 /100 | #230 | Tragic 27.0% |
| Bhutanese | 5.3 /100 | #231 | Tragic 27.0% |
| Argentineans | 5.2 /100 | #232 | Tragic 27.0% |
| Immigrants | Brazil | 5.0 /100 | #233 | Tragic 27.0% |
| Immigrants | Pakistan | 4.9 /100 | #234 | Tragic 27.0% |
| Immigrants | Hungary | 4.8 /100 | #235 | Tragic 27.0% |
| Immigrants | Romania | 4.8 /100 | #236 | Tragic 27.0% |
| Immigrants | Eastern Asia | 4.4 /100 | #237 | Tragic 27.1% |
Demographics Similar to Tlingit-Haida by Wage/Income Gap
In terms of wage/income gap, the demographic groups most similar to Tlingit-Haida are Moroccan (24.0%, a difference of 0.060%), Sudanese (24.0%, a difference of 0.060%), Tsimshian (23.9%, a difference of 0.33%), Yaqui (24.0%, a difference of 0.36%), and Immigrants from Albania (24.0%, a difference of 0.37%).
| Demographics | Rating | Rank | Wage/Income Gap |
| Immigrants | Sudan | 99.4 /100 | #97 | Exceptional 23.6% |
| Immigrants | Latin America | 99.2 /100 | #98 | Exceptional 23.7% |
| Aleuts | 99.2 /100 | #99 | Exceptional 23.7% |
| Yakama | 99.2 /100 | #100 | Exceptional 23.7% |
| Japanese | 99.1 /100 | #101 | Exceptional 23.8% |
| Immigrants | Laos | 99.0 /100 | #102 | Exceptional 23.8% |
| Tsimshian | 98.9 /100 | #103 | Exceptional 23.9% |
| Tlingit-Haida | 98.7 /100 | #104 | Exceptional 24.0% |
| Moroccans | 98.6 /100 | #105 | Exceptional 24.0% |
| Sudanese | 98.6 /100 | #106 | Exceptional 24.0% |
| Yaqui | 98.4 /100 | #107 | Exceptional 24.0% |
| Immigrants | Albania | 98.4 /100 | #108 | Exceptional 24.0% |
| Ugandans | 98.3 /100 | #109 | Exceptional 24.1% |
| Immigrants | Morocco | 98.1 /100 | #110 | Exceptional 24.1% |
| Soviet Union | 97.6 /100 | #111 | Exceptional 24.2% |