Ottawa vs Slovak Wage/Income Gap
COMPARE
Ottawa
Slovak
Wage/Income Gap
Wage/Income Gap Comparison
Ottawa
Slovaks
27.0%
WAGE/INCOME GAP
5.3/ 100
METRIC RATING
230th/ 347
METRIC RANK
28.9%
WAGE/INCOME GAP
0.1/ 100
METRIC RATING
319th/ 347
METRIC RANK
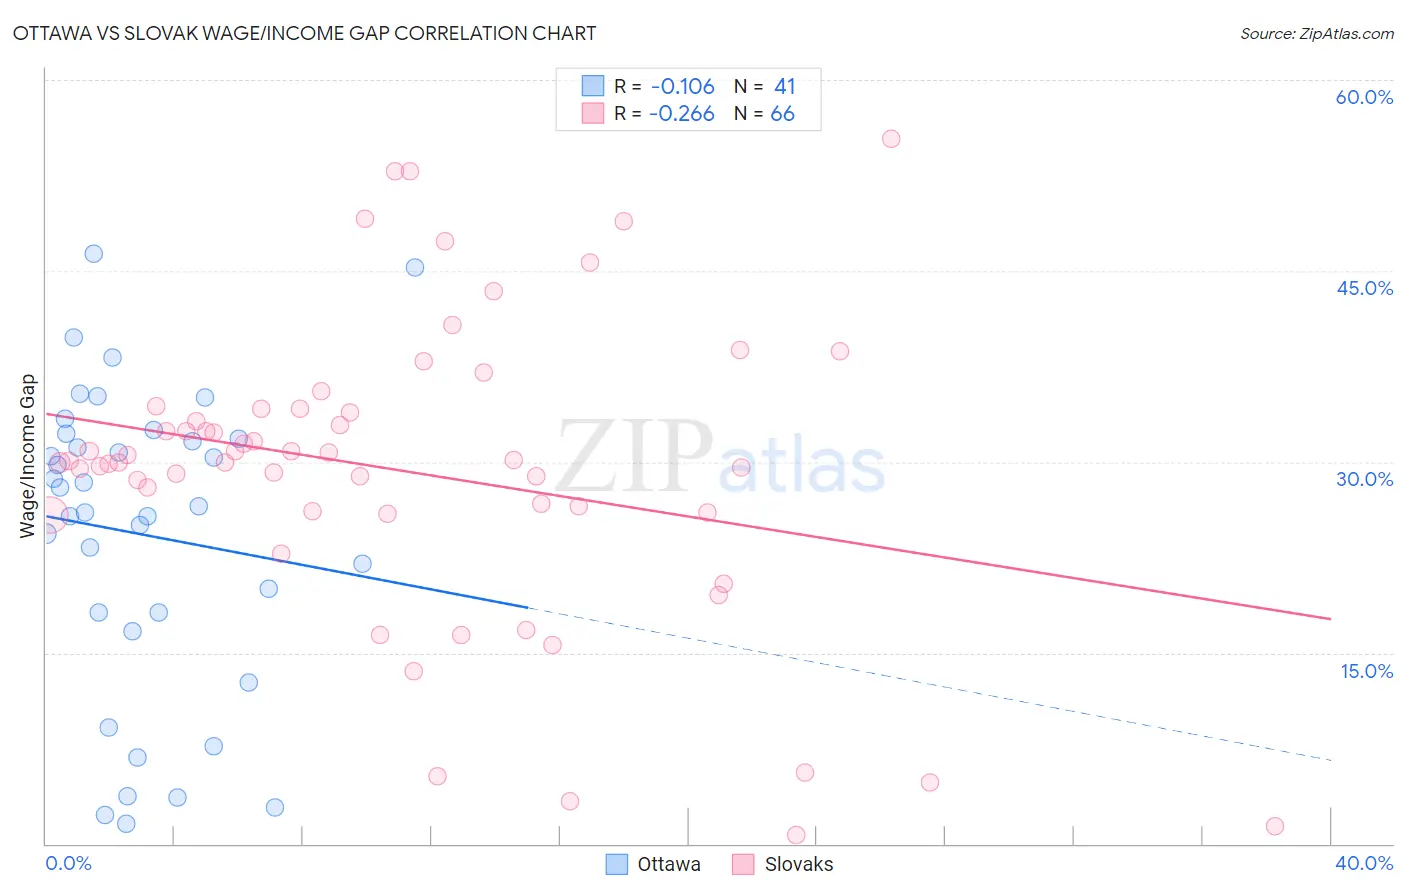
Ottawa vs Slovak Wage/Income Gap Correlation Chart
The statistical analysis conducted on geographies consisting of 49,945,393 people shows a poor negative correlation between the proportion of Ottawa and wage/income gap percentage in the United States with a correlation coefficient (R) of -0.106 and weighted average of 27.0%. Similarly, the statistical analysis conducted on geographies consisting of 397,444,585 people shows a weak negative correlation between the proportion of Slovaks and wage/income gap percentage in the United States with a correlation coefficient (R) of -0.266 and weighted average of 28.9%, a difference of 7.0%.
Wage/Income Gap Correlation Summary
| Measurement | Ottawa | Slovak |
| Minimum | 1.6% | 0.72% |
| Maximum | 46.4% | 55.3% |
| Range | 44.8% | 54.6% |
| Mean | 24.3% | 29.3% |
| Median | 26.5% | 30.0% |
| Interquartile 25% (IQ1) | 17.4% | 26.0% |
| Interquartile 75% (IQ3) | 32.0% | 34.2% |
| Interquartile Range (IQR) | 14.6% | 8.2% |
| Standard Deviation (Sample) | 12.0% | 11.9% |
| Standard Deviation (Population) | 11.8% | 11.8% |
Similar Demographics by Wage/Income Gap
Demographics Similar to Ottawa by Wage/Income Gap
In terms of wage/income gap, the demographic groups most similar to Ottawa are Bhutanese (27.0%, a difference of 0.030%), Immigrants from Asia (27.0%, a difference of 0.050%), Argentinean (27.0%, a difference of 0.050%), Immigrants from Turkey (27.0%, a difference of 0.080%), and Spaniard (27.0%, a difference of 0.090%).
| Demographics | Rating | Rank | Wage/Income Gap |
| Jordanians | 8.0 /100 | #223 | Tragic 26.8% |
| Immigrants | Argentina | 7.2 /100 | #224 | Tragic 26.8% |
| Immigrants | Ireland | 6.5 /100 | #225 | Tragic 26.9% |
| Asians | 5.9 /100 | #226 | Tragic 26.9% |
| Spaniards | 5.6 /100 | #227 | Tragic 27.0% |
| Immigrants | Turkey | 5.6 /100 | #228 | Tragic 27.0% |
| Immigrants | Asia | 5.5 /100 | #229 | Tragic 27.0% |
| Ottawa | 5.3 /100 | #230 | Tragic 27.0% |
| Bhutanese | 5.3 /100 | #231 | Tragic 27.0% |
| Argentineans | 5.2 /100 | #232 | Tragic 27.0% |
| Immigrants | Brazil | 5.0 /100 | #233 | Tragic 27.0% |
| Immigrants | Pakistan | 4.9 /100 | #234 | Tragic 27.0% |
| Immigrants | Hungary | 4.8 /100 | #235 | Tragic 27.0% |
| Immigrants | Romania | 4.8 /100 | #236 | Tragic 27.0% |
| Immigrants | Eastern Asia | 4.4 /100 | #237 | Tragic 27.1% |
Demographics Similar to Slovaks by Wage/Income Gap
In terms of wage/income gap, the demographic groups most similar to Slovaks are British (28.9%, a difference of 0.060%), Welsh (28.9%, a difference of 0.13%), Immigrants from Singapore (28.9%, a difference of 0.15%), Norwegian (29.0%, a difference of 0.25%), and Basque (28.8%, a difference of 0.31%).
| Demographics | Rating | Rank | Wage/Income Gap |
| Eastern Europeans | 0.1 /100 | #312 | Tragic 28.6% |
| French | 0.1 /100 | #313 | Tragic 28.7% |
| Immigrants | Scotland | 0.1 /100 | #314 | Tragic 28.7% |
| Maltese | 0.1 /100 | #315 | Tragic 28.7% |
| Lithuanians | 0.1 /100 | #316 | Tragic 28.7% |
| Belgians | 0.1 /100 | #317 | Tragic 28.8% |
| Basques | 0.1 /100 | #318 | Tragic 28.8% |
| Slovaks | 0.1 /100 | #319 | Tragic 28.9% |
| British | 0.1 /100 | #320 | Tragic 28.9% |
| Welsh | 0.1 /100 | #321 | Tragic 28.9% |
| Immigrants | Singapore | 0.1 /100 | #322 | Tragic 28.9% |
| Norwegians | 0.1 /100 | #323 | Tragic 29.0% |
| Croatians | 0.0 /100 | #324 | Tragic 29.0% |
| Hungarians | 0.0 /100 | #325 | Tragic 29.0% |
| Immigrants | Belgium | 0.0 /100 | #326 | Tragic 29.0% |