Nepalese vs Immigrants from Haiti Wage/Income Gap
COMPARE
Nepalese
Immigrants from Haiti
Wage/Income Gap
Wage/Income Gap Comparison
Nepalese
Immigrants from Haiti
22.2%
WAGE/INCOME GAP
100.0/ 100
METRIC RATING
54th/ 347
METRIC RANK
19.2%
WAGE/INCOME GAP
100.0/ 100
METRIC RATING
11th/ 347
METRIC RANK
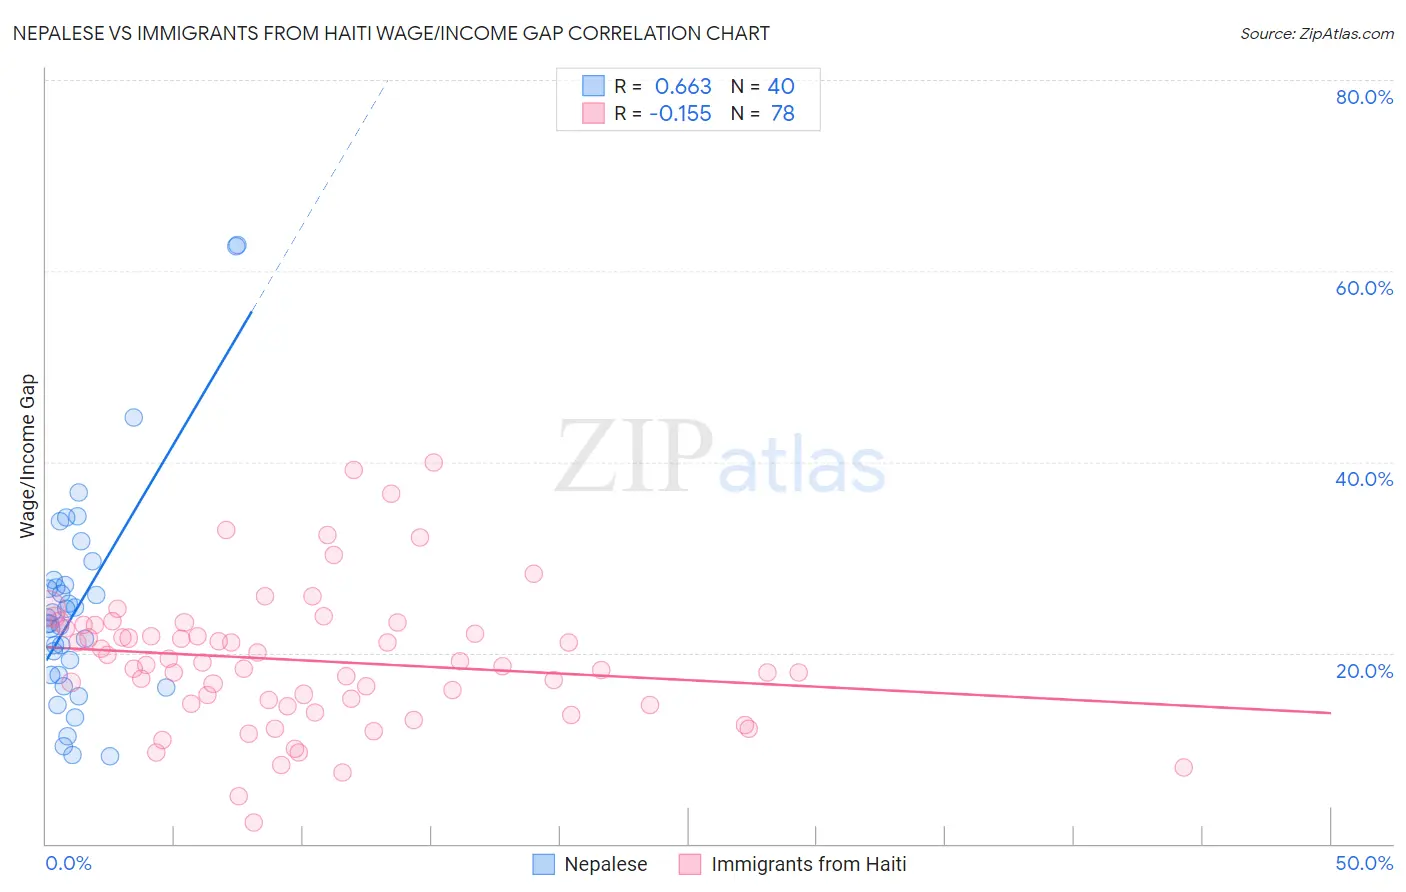
Nepalese vs Immigrants from Haiti Wage/Income Gap Correlation Chart
The statistical analysis conducted on geographies consisting of 24,519,153 people shows a significant positive correlation between the proportion of Nepalese and wage/income gap percentage in the United States with a correlation coefficient (R) of 0.663 and weighted average of 22.2%. Similarly, the statistical analysis conducted on geographies consisting of 225,210,716 people shows a poor negative correlation between the proportion of Immigrants from Haiti and wage/income gap percentage in the United States with a correlation coefficient (R) of -0.155 and weighted average of 19.2%, a difference of 15.7%.
Wage/Income Gap Correlation Summary
| Measurement | Nepalese | Immigrants from Haiti |
| Minimum | 9.1% | 2.2% |
| Maximum | 62.8% | 39.9% |
| Range | 53.7% | 37.7% |
| Mean | 25.0% | 19.2% |
| Median | 23.4% | 18.9% |
| Interquartile 25% (IQ1) | 17.7% | 14.6% |
| Interquartile 75% (IQ3) | 27.4% | 22.9% |
| Interquartile Range (IQR) | 9.7% | 8.3% |
| Standard Deviation (Sample) | 11.7% | 7.2% |
| Standard Deviation (Population) | 11.5% | 7.1% |
Similar Demographics by Wage/Income Gap
Demographics Similar to Nepalese by Wage/Income Gap
In terms of wage/income gap, the demographic groups most similar to Nepalese are Bangladeshi (22.2%, a difference of 0.23%), Immigrants from Cameroon (22.2%, a difference of 0.24%), Tohono O'odham (22.1%, a difference of 0.32%), Immigrants from Zaire (22.3%, a difference of 0.40%), and Immigrants from Ghana (22.3%, a difference of 0.43%).
| Demographics | Rating | Rank | Wage/Income Gap |
| Immigrants | Congo | 100.0 /100 | #47 | Exceptional 21.7% |
| Blacks/African Americans | 100.0 /100 | #48 | Exceptional 21.7% |
| Ethiopians | 100.0 /100 | #49 | Exceptional 21.8% |
| Immigrants | Western Africa | 100.0 /100 | #50 | Exceptional 22.0% |
| Tohono O'odham | 100.0 /100 | #51 | Exceptional 22.1% |
| Immigrants | Cameroon | 100.0 /100 | #52 | Exceptional 22.2% |
| Bangladeshis | 100.0 /100 | #53 | Exceptional 22.2% |
| Nepalese | 100.0 /100 | #54 | Exceptional 22.2% |
| Immigrants | Zaire | 100.0 /100 | #55 | Exceptional 22.3% |
| Immigrants | Ghana | 100.0 /100 | #56 | Exceptional 22.3% |
| Ghanaians | 100.0 /100 | #57 | Exceptional 22.3% |
| Immigrants | Cuba | 100.0 /100 | #58 | Exceptional 22.4% |
| Navajo | 100.0 /100 | #59 | Exceptional 22.4% |
| Immigrants | Middle Africa | 100.0 /100 | #60 | Exceptional 22.4% |
| Immigrants | Fiji | 100.0 /100 | #61 | Exceptional 22.4% |
Demographics Similar to Immigrants from Haiti by Wage/Income Gap
In terms of wage/income gap, the demographic groups most similar to Immigrants from Haiti are Immigrants from West Indies (19.2%, a difference of 0.11%), Trinidadian and Tobagonian (19.3%, a difference of 0.59%), Immigrants from Trinidad and Tobago (19.3%, a difference of 0.64%), Crow (19.1%, a difference of 0.79%), and Barbadian (19.0%, a difference of 1.3%).
| Demographics | Rating | Rank | Wage/Income Gap |
| British West Indians | 100.0 /100 | #4 | Exceptional 18.0% |
| Guyanese | 100.0 /100 | #5 | Exceptional 18.3% |
| Immigrants | Guyana | 100.0 /100 | #6 | Exceptional 18.4% |
| Puerto Ricans | 100.0 /100 | #7 | Exceptional 18.7% |
| Immigrants | Jamaica | 100.0 /100 | #8 | Exceptional 18.8% |
| Barbadians | 100.0 /100 | #9 | Exceptional 19.0% |
| Crow | 100.0 /100 | #10 | Exceptional 19.1% |
| Immigrants | Haiti | 100.0 /100 | #11 | Exceptional 19.2% |
| Immigrants | West Indies | 100.0 /100 | #12 | Exceptional 19.2% |
| Trinidadians and Tobagonians | 100.0 /100 | #13 | Exceptional 19.3% |
| Immigrants | Trinidad and Tobago | 100.0 /100 | #14 | Exceptional 19.3% |
| West Indians | 100.0 /100 | #15 | Exceptional 19.6% |
| Jamaicans | 100.0 /100 | #16 | Exceptional 19.6% |
| Haitians | 100.0 /100 | #17 | Exceptional 19.7% |
| Hopi | 100.0 /100 | #18 | Exceptional 20.0% |