Nepalese vs Vietnamese Wage/Income Gap
COMPARE
Nepalese
Vietnamese
Wage/Income Gap
Wage/Income Gap Comparison
Nepalese
Vietnamese
22.2%
WAGE/INCOME GAP
100.0/ 100
METRIC RATING
54th/ 347
METRIC RANK
21.0%
WAGE/INCOME GAP
100.0/ 100
METRIC RATING
31st/ 347
METRIC RANK
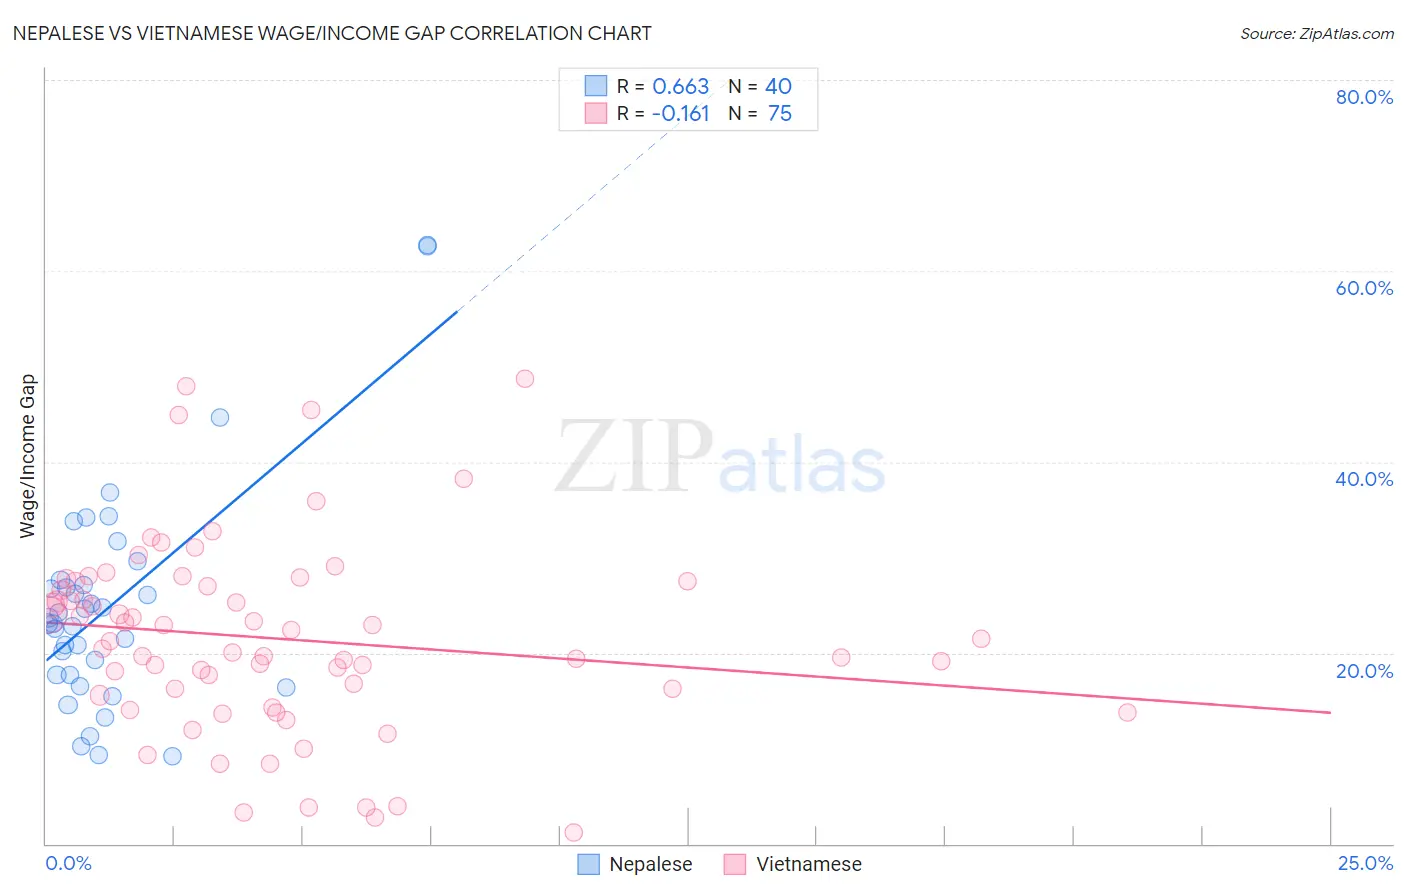
Nepalese vs Vietnamese Wage/Income Gap Correlation Chart
The statistical analysis conducted on geographies consisting of 24,519,153 people shows a significant positive correlation between the proportion of Nepalese and wage/income gap percentage in the United States with a correlation coefficient (R) of 0.663 and weighted average of 22.2%. Similarly, the statistical analysis conducted on geographies consisting of 170,722,757 people shows a poor negative correlation between the proportion of Vietnamese and wage/income gap percentage in the United States with a correlation coefficient (R) of -0.161 and weighted average of 21.0%, a difference of 5.8%.
Wage/Income Gap Correlation Summary
| Measurement | Nepalese | Vietnamese |
| Minimum | 9.1% | 1.1% |
| Maximum | 62.8% | 48.7% |
| Range | 53.7% | 47.5% |
| Mean | 25.0% | 21.5% |
| Median | 23.4% | 21.2% |
| Interquartile 25% (IQ1) | 17.7% | 15.6% |
| Interquartile 75% (IQ3) | 27.4% | 27.5% |
| Interquartile Range (IQR) | 9.7% | 11.9% |
| Standard Deviation (Sample) | 11.7% | 10.1% |
| Standard Deviation (Population) | 11.5% | 10.0% |
Similar Demographics by Wage/Income Gap
Demographics Similar to Nepalese by Wage/Income Gap
In terms of wage/income gap, the demographic groups most similar to Nepalese are Bangladeshi (22.2%, a difference of 0.23%), Immigrants from Cameroon (22.2%, a difference of 0.24%), Tohono O'odham (22.1%, a difference of 0.32%), Immigrants from Zaire (22.3%, a difference of 0.40%), and Immigrants from Ghana (22.3%, a difference of 0.43%).
| Demographics | Rating | Rank | Wage/Income Gap |
| Immigrants | Congo | 100.0 /100 | #47 | Exceptional 21.7% |
| Blacks/African Americans | 100.0 /100 | #48 | Exceptional 21.7% |
| Ethiopians | 100.0 /100 | #49 | Exceptional 21.8% |
| Immigrants | Western Africa | 100.0 /100 | #50 | Exceptional 22.0% |
| Tohono O'odham | 100.0 /100 | #51 | Exceptional 22.1% |
| Immigrants | Cameroon | 100.0 /100 | #52 | Exceptional 22.2% |
| Bangladeshis | 100.0 /100 | #53 | Exceptional 22.2% |
| Nepalese | 100.0 /100 | #54 | Exceptional 22.2% |
| Immigrants | Zaire | 100.0 /100 | #55 | Exceptional 22.3% |
| Immigrants | Ghana | 100.0 /100 | #56 | Exceptional 22.3% |
| Ghanaians | 100.0 /100 | #57 | Exceptional 22.3% |
| Immigrants | Cuba | 100.0 /100 | #58 | Exceptional 22.4% |
| Navajo | 100.0 /100 | #59 | Exceptional 22.4% |
| Immigrants | Middle Africa | 100.0 /100 | #60 | Exceptional 22.4% |
| Immigrants | Fiji | 100.0 /100 | #61 | Exceptional 22.4% |
Demographics Similar to Vietnamese by Wage/Income Gap
In terms of wage/income gap, the demographic groups most similar to Vietnamese are Immigrants from Yemen (21.1%, a difference of 0.23%), Immigrants from Bahamas (21.1%, a difference of 0.25%), Immigrants from Bangladesh (20.9%, a difference of 0.28%), Immigrants from Senegal (20.9%, a difference of 0.49%), and Pima (21.1%, a difference of 0.53%).
| Demographics | Rating | Rank | Wage/Income Gap |
| Dominicans | 100.0 /100 | #24 | Exceptional 20.6% |
| Senegalese | 100.0 /100 | #25 | Exceptional 20.7% |
| Pueblo | 100.0 /100 | #26 | Exceptional 20.7% |
| Immigrants | Armenia | 100.0 /100 | #27 | Exceptional 20.7% |
| Inupiat | 100.0 /100 | #28 | Exceptional 20.8% |
| Immigrants | Senegal | 100.0 /100 | #29 | Exceptional 20.9% |
| Immigrants | Bangladesh | 100.0 /100 | #30 | Exceptional 20.9% |
| Vietnamese | 100.0 /100 | #31 | Exceptional 21.0% |
| Immigrants | Yemen | 100.0 /100 | #32 | Exceptional 21.1% |
| Immigrants | Bahamas | 100.0 /100 | #33 | Exceptional 21.1% |
| Pima | 100.0 /100 | #34 | Exceptional 21.1% |
| Somalis | 100.0 /100 | #35 | Exceptional 21.2% |
| Belizeans | 100.0 /100 | #36 | Exceptional 21.2% |
| Immigrants | Somalia | 100.0 /100 | #37 | Exceptional 21.2% |
| Immigrants | Belize | 100.0 /100 | #38 | Exceptional 21.3% |