Laotian vs Immigrants from France Wage/Income Gap
COMPARE
Laotian
Immigrants from France
Wage/Income Gap
Wage/Income Gap Comparison
Laotians
Immigrants from France
26.4%
WAGE/INCOME GAP
19.2/ 100
METRIC RATING
202nd/ 347
METRIC RANK
27.4%
WAGE/INCOME GAP
2.1/ 100
METRIC RATING
255th/ 347
METRIC RANK
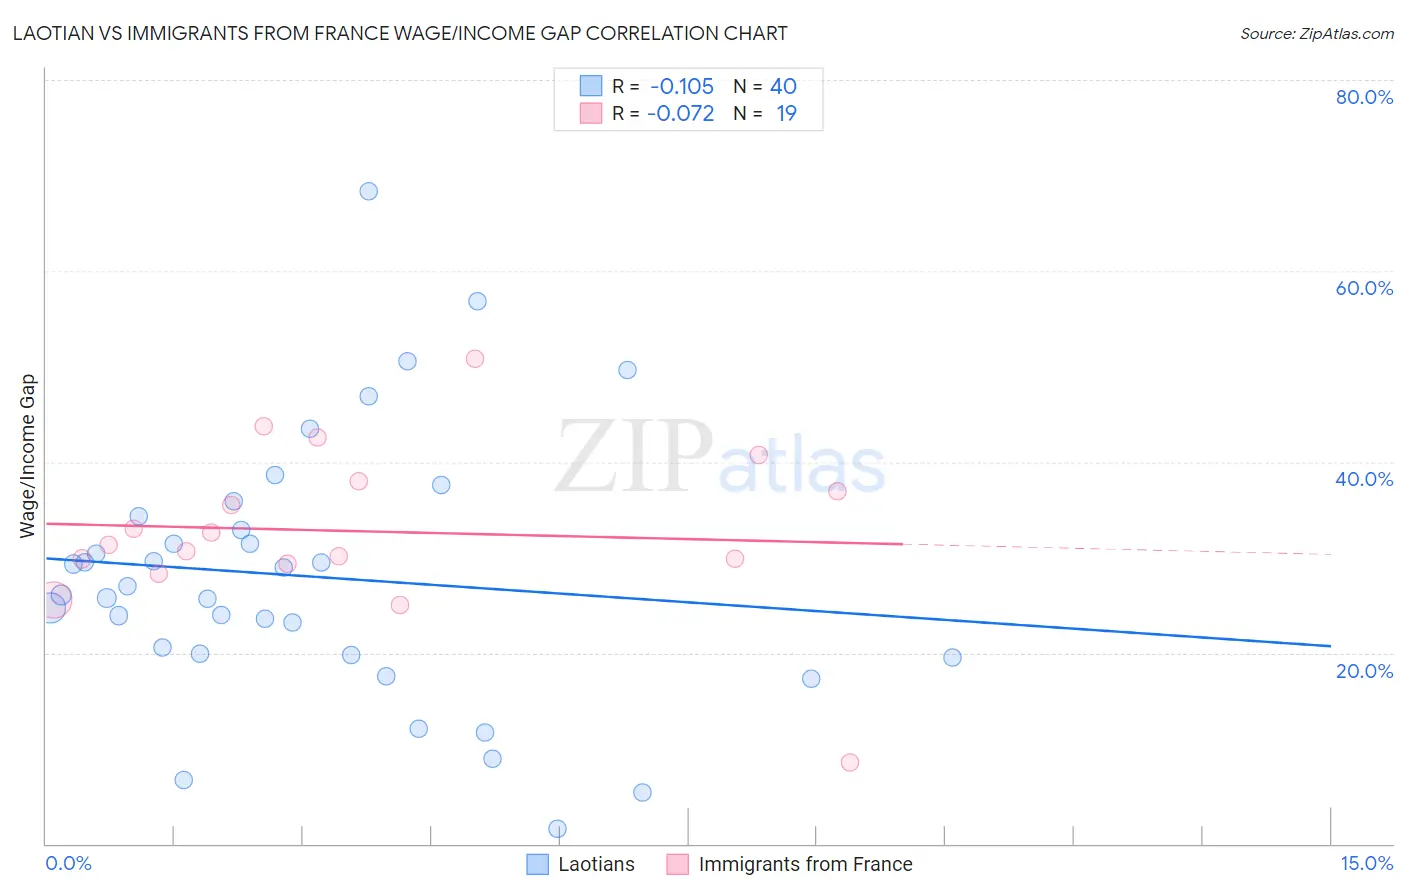
Laotian vs Immigrants from France Wage/Income Gap Correlation Chart
The statistical analysis conducted on geographies consisting of 224,802,355 people shows a poor negative correlation between the proportion of Laotians and wage/income gap percentage in the United States with a correlation coefficient (R) of -0.105 and weighted average of 26.4%. Similarly, the statistical analysis conducted on geographies consisting of 287,766,444 people shows a slight negative correlation between the proportion of Immigrants from France and wage/income gap percentage in the United States with a correlation coefficient (R) of -0.072 and weighted average of 27.4%, a difference of 3.8%.
Wage/Income Gap Correlation Summary
| Measurement | Laotian | Immigrants from France |
| Minimum | 1.6% | 8.5% |
| Maximum | 68.3% | 50.8% |
| Range | 66.8% | 42.2% |
| Mean | 28.0% | 32.7% |
| Median | 26.5% | 31.3% |
| Interquartile 25% (IQ1) | 19.9% | 29.3% |
| Interquartile 75% (IQ3) | 33.6% | 37.9% |
| Interquartile Range (IQR) | 13.7% | 8.6% |
| Standard Deviation (Sample) | 13.9% | 8.9% |
| Standard Deviation (Population) | 13.7% | 8.6% |
Similar Demographics by Wage/Income Gap
Demographics Similar to Laotians by Wage/Income Gap
In terms of wage/income gap, the demographic groups most similar to Laotians are Immigrants from Eastern Europe (26.4%, a difference of 0.0%), Immigrants from Syria (26.4%, a difference of 0.010%), Immigrants from Russia (26.4%, a difference of 0.020%), Delaware (26.3%, a difference of 0.17%), and Dutch West Indian (26.3%, a difference of 0.18%).
| Demographics | Rating | Rank | Wage/Income Gap |
| Immigrants | Malaysia | 22.2 /100 | #195 | Fair 26.3% |
| Immigrants | Western Asia | 21.7 /100 | #196 | Fair 26.3% |
| Zimbabweans | 21.6 /100 | #197 | Fair 26.3% |
| Venezuelans | 21.5 /100 | #198 | Fair 26.3% |
| Dutch West Indians | 21.0 /100 | #199 | Fair 26.3% |
| Delaware | 20.9 /100 | #200 | Fair 26.3% |
| Immigrants | Syria | 19.3 /100 | #201 | Poor 26.4% |
| Laotians | 19.2 /100 | #202 | Poor 26.4% |
| Immigrants | Eastern Europe | 19.2 /100 | #203 | Poor 26.4% |
| Immigrants | Russia | 19.0 /100 | #204 | Poor 26.4% |
| Immigrants | Southern Europe | 17.3 /100 | #205 | Poor 26.4% |
| Indians (Asian) | 16.5 /100 | #206 | Poor 26.4% |
| Immigrants | Italy | 15.8 /100 | #207 | Poor 26.5% |
| Egyptians | 12.7 /100 | #208 | Poor 26.6% |
| Immigrants | Kuwait | 12.6 /100 | #209 | Poor 26.6% |
Demographics Similar to Immigrants from France by Wage/Income Gap
In terms of wage/income gap, the demographic groups most similar to Immigrants from France are Israeli (27.4%, a difference of 0.010%), Portuguese (27.4%, a difference of 0.090%), Cherokee (27.4%, a difference of 0.10%), Luxembourger (27.4%, a difference of 0.15%), and Slavic (27.4%, a difference of 0.19%).
| Demographics | Rating | Rank | Wage/Income Gap |
| Cypriots | 2.8 /100 | #248 | Tragic 27.3% |
| Carpatho Rusyns | 2.7 /100 | #249 | Tragic 27.3% |
| Immigrants | Czechoslovakia | 2.7 /100 | #250 | Tragic 27.3% |
| Immigrants | Norway | 2.5 /100 | #251 | Tragic 27.3% |
| Ukrainians | 2.4 /100 | #252 | Tragic 27.3% |
| Portuguese | 2.2 /100 | #253 | Tragic 27.4% |
| Israelis | 2.1 /100 | #254 | Tragic 27.4% |
| Immigrants | France | 2.1 /100 | #255 | Tragic 27.4% |
| Cherokee | 1.9 /100 | #256 | Tragic 27.4% |
| Luxembourgers | 1.9 /100 | #257 | Tragic 27.4% |
| Slavs | 1.8 /100 | #258 | Tragic 27.4% |
| Icelanders | 1.8 /100 | #259 | Tragic 27.5% |
| Tongans | 1.7 /100 | #260 | Tragic 27.5% |
| Immigrants | Germany | 1.5 /100 | #261 | Tragic 27.5% |
| Immigrants | Lebanon | 1.5 /100 | #262 | Tragic 27.5% |