Laotian GED/Equivalency
COMPARE
Laotian
Select to Compare
GED/Equivalency
Laotian GED/Equivalency
86.5%
GED/EQUIVALENCY
83.2/ 100
METRIC RATING
141st/ 347
METRIC RANK
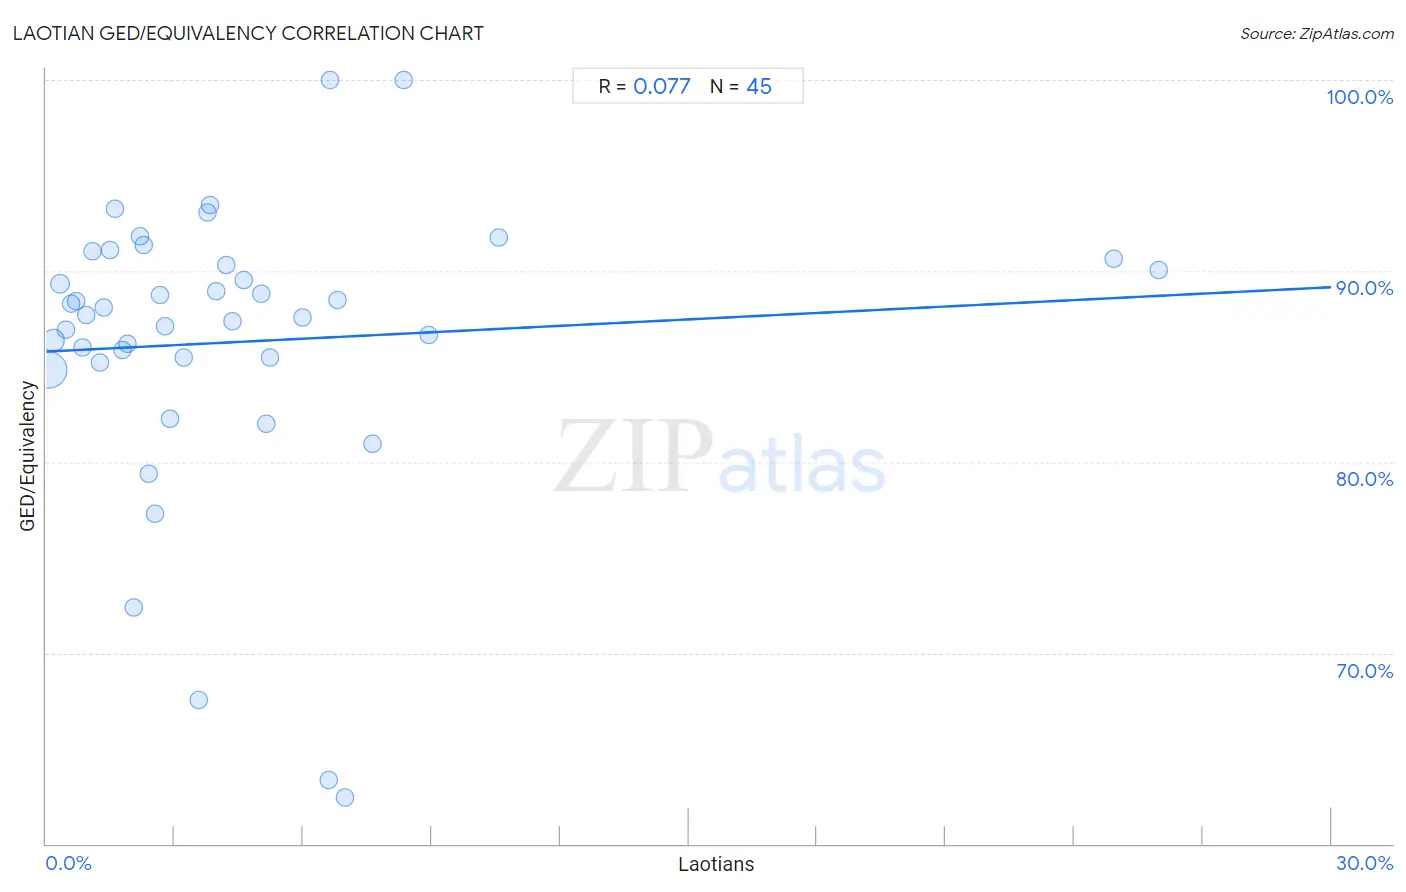
Laotian GED/Equivalency Correlation Chart
The statistical analysis conducted on geographies consisting of 224,856,886 people shows a slight positive correlation between the proportion of Laotians and percentage of population with at least ged/equivalency education in the United States with a correlation coefficient (R) of 0.077 and weighted average of 86.5%. On average, for every 1% (one percent) increase in Laotians within a typical geography, there is an increase of 0.11% in percentage of population with at least ged/equivalency education.
It is essential to understand that the correlation between the percentage of Laotians and percentage of population with at least ged/equivalency education does not imply a direct cause-and-effect relationship. It remains uncertain whether the presence of Laotians influences an upward or downward trend in the level of percentage of population with at least ged/equivalency education within an area, or if Laotians simply ended up residing in those areas with higher or lower levels of percentage of population with at least ged/equivalency education due to other factors.
Demographics Similar to Laotians by GED/Equivalency
In terms of ged/equivalency, the demographic groups most similar to Laotians are Paraguayan (86.5%, a difference of 0.030%), Immigrants from Indonesia (86.4%, a difference of 0.030%), Immigrants from Pakistan (86.4%, a difference of 0.030%), Bolivian (86.4%, a difference of 0.040%), and Immigrants from Malaysia (86.5%, a difference of 0.070%).
| Demographics | Rating | Rank | GED/Equivalency |
| Albanians | 87.7 /100 | #134 | Excellent 86.6% |
| Immigrants from Asia | 87.4 /100 | #135 | Excellent 86.6% |
| Chileans | 86.9 /100 | #136 | Excellent 86.6% |
| Arabs | 86.7 /100 | #137 | Excellent 86.6% |
| Immigrants from Argentina | 86.5 /100 | #138 | Excellent 86.6% |
| Immigrants from Malaysia | 85.0 /100 | #139 | Excellent 86.5% |
| Paraguayans | 84.1 /100 | #140 | Excellent 86.5% |
| Laotians | 83.2 /100 | #141 | Excellent 86.5% |
| Immigrants from Indonesia | 82.4 /100 | #142 | Excellent 86.4% |
| Immigrants from Pakistan | 82.4 /100 | #143 | Excellent 86.4% |
| Bolivians | 82.1 /100 | #144 | Excellent 86.4% |
| Pakistanis | 80.4 /100 | #145 | Excellent 86.4% |
| Basques | 79.5 /100 | #146 | Good 86.4% |
| Immigrants from Northern Africa | 79.3 /100 | #147 | Good 86.3% |
| Immigrants from Poland | 79.3 /100 | #148 | Good 86.3% |
Laotian GED/Equivalency Correlation Summary
| Measurement | Laotian Data | GED/Equivalency Data |
| Minimum | 0.051% | 62.4% |
| Maximum | 26.0% | 100.0% |
| Range | 25.9% | 37.6% |
| Mean | 4.5% | 86.3% |
| Median | 2.9% | 87.7% |
| Interquartile 25% (IQ1) | 1.4% | 85.3% |
| Interquartile 75% (IQ3) | 5.6% | 90.5% |
| Interquartile Range (IQR) | 4.2% | 5.1% |
| Standard Deviation (Sample) | 5.2% | 7.7% |
| Standard Deviation (Population) | 5.2% | 7.6% |
Correlation Details
| Laotian Percentile | Sample Size | GED/Equivalency |
[ 0.0% - 0.5% ] 0.051% | 165,559,674 | 84.8% |
[ 0.0% - 0.5% ] 0.18% | 36,398,394 | 86.4% |
[ 0.0% - 0.5% ] 0.31% | 10,267,565 | 89.3% |
[ 0.0% - 0.5% ] 0.45% | 5,496,227 | 86.9% |
[ 0.5% - 1.0% ] 0.59% | 2,241,235 | 88.3% |
[ 0.5% - 1.0% ] 0.71% | 2,038,854 | 88.4% |
[ 0.5% - 1.0% ] 0.85% | 813,243 | 86.0% |
[ 0.5% - 1.0% ] 0.94% | 622,376 | 87.7% |
[ 1.0% - 1.5% ] 1.08% | 177,320 | 91.1% |
[ 1.0% - 1.5% ] 1.26% | 217,786 | 85.2% |
[ 1.0% - 1.5% ] 1.36% | 166,402 | 88.1% |
[ 1.0% - 1.5% ] 1.49% | 158,717 | 91.1% |
[ 1.5% - 2.0% ] 1.61% | 18,184 | 93.2% |
[ 1.5% - 2.0% ] 1.79% | 235,830 | 85.9% |
[ 1.5% - 2.0% ] 1.89% | 45,933 | 86.2% |
[ 2.0% - 2.5% ] 2.05% | 112,979 | 72.4% |
[ 2.0% - 2.5% ] 2.19% | 59,281 | 91.8% |
[ 2.0% - 2.5% ] 2.27% | 44,033 | 91.3% |
[ 2.0% - 2.5% ] 2.38% | 19,498 | 79.3% |
[ 2.5% - 3.0% ] 2.55% | 9,634 | 77.3% |
[ 2.5% - 3.0% ] 2.67% | 12,809 | 88.8% |
[ 2.5% - 3.0% ] 2.77% | 51,720 | 87.1% |
[ 2.5% - 3.0% ] 2.89% | 1,246 | 82.3% |
[ 3.0% - 3.5% ] 3.20% | 2,466 | 85.5% |
[ 3.5% - 4.0% ] 3.56% | 12,478 | 67.5% |
[ 3.5% - 4.0% ] 3.76% | 1,304 | 93.1% |
[ 3.5% - 4.0% ] 3.82% | 890 | 93.5% |
[ 3.5% - 4.0% ] 3.98% | 4,150 | 88.9% |
[ 4.0% - 4.5% ] 4.19% | 2,123 | 90.3% |
[ 4.0% - 4.5% ] 4.35% | 26,556 | 87.4% |
[ 4.5% - 5.0% ] 4.61% | 1,692 | 89.5% |
[ 5.0% - 5.5% ] 5.03% | 1,392 | 88.8% |
[ 5.0% - 5.5% ] 5.12% | 722 | 82.0% |
[ 5.0% - 5.5% ] 5.21% | 2,052 | 85.5% |
[ 5.5% - 6.0% ] 5.98% | 23,842 | 87.6% |
[ 6.5% - 7.0% ] 6.58% | 319 | 63.3% |
[ 6.5% - 7.0% ] 6.62% | 302 | 100.0% |
[ 6.5% - 7.0% ] 6.79% | 619 | 88.5% |
[ 6.5% - 7.0% ] 6.97% | 2,756 | 62.4% |
[ 7.5% - 8.0% ] 7.63% | 236 | 81.0% |
[ 8.0% - 8.5% ] 8.33% | 84 | 100.0% |
[ 8.5% - 9.0% ] 8.94% | 1,634 | 86.7% |
[ 10.5% - 11.0% ] 10.57% | 1,220 | 91.7% |
[ 24.5% - 25.0% ] 24.91% | 566 | 90.6% |
[ 25.5% - 26.0% ] 25.97% | 543 | 90.0% |