Immigrants from Zaire vs Immigrants from St. Vincent and the Grenadines Wage/Income Gap
COMPARE
Immigrants from Zaire
Immigrants from St. Vincent and the Grenadines
Wage/Income Gap
Wage/Income Gap Comparison
Immigrants from Zaire
Immigrants from St. Vincent and the Grenadines
22.3%
WAGE/INCOME GAP
100.0/ 100
METRIC RATING
55th/ 347
METRIC RANK
16.4%
WAGE/INCOME GAP
100.0/ 100
METRIC RATING
2nd/ 347
METRIC RANK
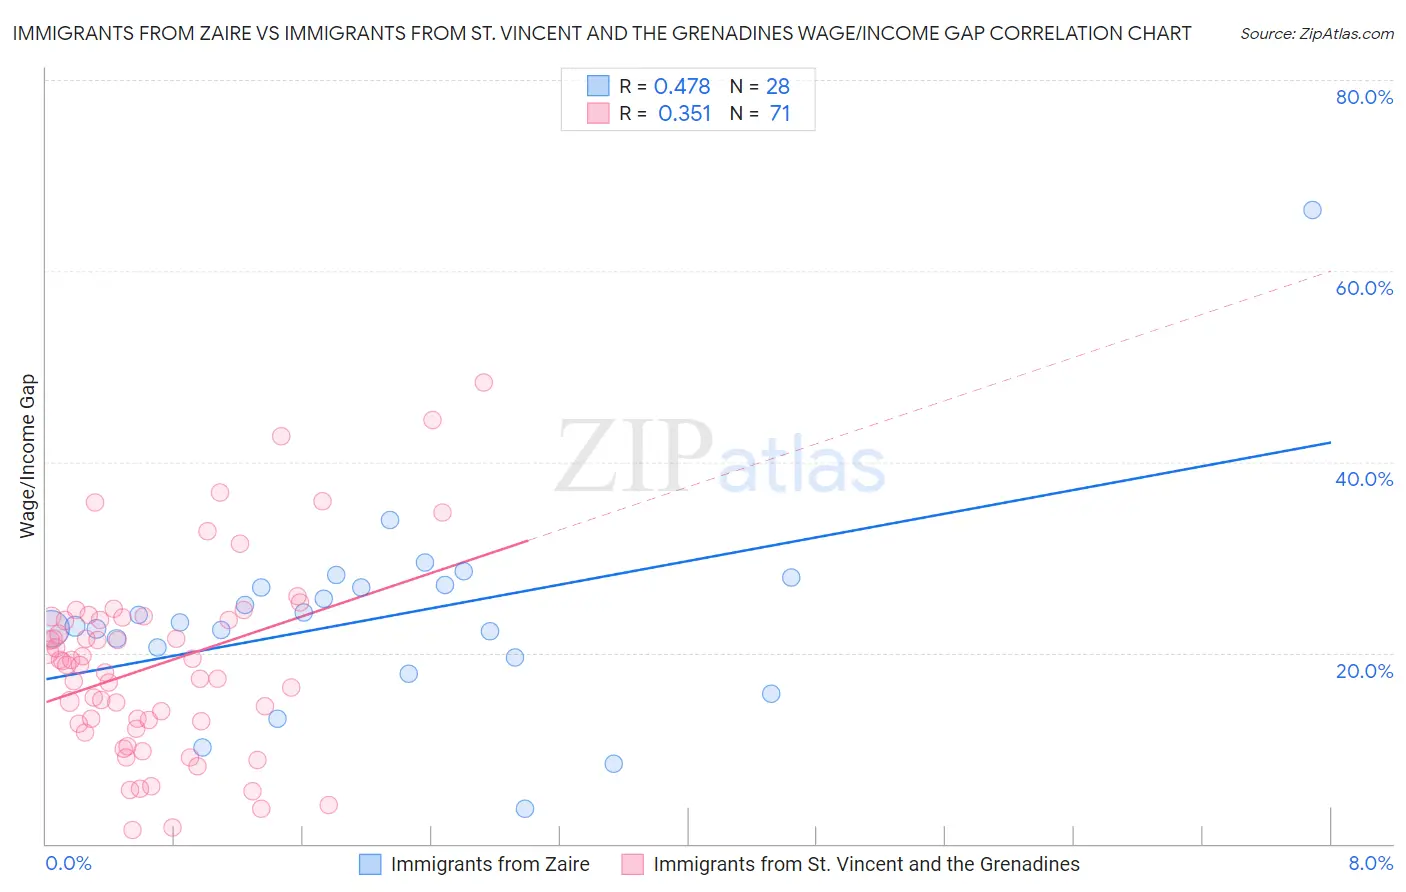
Immigrants from Zaire vs Immigrants from St. Vincent and the Grenadines Wage/Income Gap Correlation Chart
The statistical analysis conducted on geographies consisting of 107,239,731 people shows a moderate positive correlation between the proportion of Immigrants from Zaire and wage/income gap percentage in the United States with a correlation coefficient (R) of 0.478 and weighted average of 22.3%. Similarly, the statistical analysis conducted on geographies consisting of 56,186,231 people shows a mild positive correlation between the proportion of Immigrants from St. Vincent and the Grenadines and wage/income gap percentage in the United States with a correlation coefficient (R) of 0.351 and weighted average of 16.4%, a difference of 35.8%.
Wage/Income Gap Correlation Summary
| Measurement | Immigrants from Zaire | Immigrants from St. Vincent and the Grenadines |
| Minimum | 3.7% | 1.4% |
| Maximum | 66.4% | 48.3% |
| Range | 62.8% | 46.9% |
| Mean | 23.6% | 18.8% |
| Median | 23.0% | 18.8% |
| Interquartile 25% (IQ1) | 20.1% | 12.5% |
| Interquartile 75% (IQ3) | 27.0% | 23.7% |
| Interquartile Range (IQR) | 6.9% | 11.2% |
| Standard Deviation (Sample) | 10.8% | 9.8% |
| Standard Deviation (Population) | 10.6% | 9.8% |
Similar Demographics by Wage/Income Gap
Demographics Similar to Immigrants from Zaire by Wage/Income Gap
In terms of wage/income gap, the demographic groups most similar to Immigrants from Zaire are Immigrants from Ghana (22.3%, a difference of 0.030%), Ghanaian (22.3%, a difference of 0.13%), Immigrants from Cuba (22.4%, a difference of 0.22%), Navajo (22.4%, a difference of 0.25%), and Immigrants from Middle Africa (22.4%, a difference of 0.27%).
| Demographics | Rating | Rank | Wage/Income Gap |
| Blacks/African Americans | 100.0 /100 | #48 | Exceptional 21.7% |
| Ethiopians | 100.0 /100 | #49 | Exceptional 21.8% |
| Immigrants | Western Africa | 100.0 /100 | #50 | Exceptional 22.0% |
| Tohono O'odham | 100.0 /100 | #51 | Exceptional 22.1% |
| Immigrants | Cameroon | 100.0 /100 | #52 | Exceptional 22.2% |
| Bangladeshis | 100.0 /100 | #53 | Exceptional 22.2% |
| Nepalese | 100.0 /100 | #54 | Exceptional 22.2% |
| Immigrants | Zaire | 100.0 /100 | #55 | Exceptional 22.3% |
| Immigrants | Ghana | 100.0 /100 | #56 | Exceptional 22.3% |
| Ghanaians | 100.0 /100 | #57 | Exceptional 22.3% |
| Immigrants | Cuba | 100.0 /100 | #58 | Exceptional 22.4% |
| Navajo | 100.0 /100 | #59 | Exceptional 22.4% |
| Immigrants | Middle Africa | 100.0 /100 | #60 | Exceptional 22.4% |
| Immigrants | Fiji | 100.0 /100 | #61 | Exceptional 22.4% |
| Immigrants | Guatemala | 100.0 /100 | #62 | Exceptional 22.5% |
Demographics Similar to Immigrants from St. Vincent and the Grenadines by Wage/Income Gap
In terms of wage/income gap, the demographic groups most similar to Immigrants from St. Vincent and the Grenadines are Immigrants from Grenada (16.2%, a difference of 1.5%), Immigrants from Barbados (17.8%, a difference of 8.6%), British West Indian (18.0%, a difference of 9.7%), Guyanese (18.3%, a difference of 11.5%), and Immigrants from Guyana (18.4%, a difference of 11.8%).
| Demographics | Rating | Rank | Wage/Income Gap |
| Immigrants | Grenada | 100.0 /100 | #1 | Exceptional 16.2% |
| Immigrants | St. Vincent and the Grenadines | 100.0 /100 | #2 | Exceptional 16.4% |
| Immigrants | Barbados | 100.0 /100 | #3 | Exceptional 17.8% |
| British West Indians | 100.0 /100 | #4 | Exceptional 18.0% |
| Guyanese | 100.0 /100 | #5 | Exceptional 18.3% |
| Immigrants | Guyana | 100.0 /100 | #6 | Exceptional 18.4% |
| Puerto Ricans | 100.0 /100 | #7 | Exceptional 18.7% |
| Immigrants | Jamaica | 100.0 /100 | #8 | Exceptional 18.8% |
| Barbadians | 100.0 /100 | #9 | Exceptional 19.0% |
| Crow | 100.0 /100 | #10 | Exceptional 19.1% |
| Immigrants | Haiti | 100.0 /100 | #11 | Exceptional 19.2% |
| Immigrants | West Indies | 100.0 /100 | #12 | Exceptional 19.2% |
| Trinidadians and Tobagonians | 100.0 /100 | #13 | Exceptional 19.3% |
| Immigrants | Trinidad and Tobago | 100.0 /100 | #14 | Exceptional 19.3% |
| West Indians | 100.0 /100 | #15 | Exceptional 19.6% |