Immigrants from Zaire vs Guamanian/Chamorro Wage/Income Gap
COMPARE
Immigrants from Zaire
Guamanian/Chamorro
Wage/Income Gap
Wage/Income Gap Comparison
Immigrants from Zaire
Guamanians/Chamorros
22.3%
WAGE/INCOME GAP
100.0/ 100
METRIC RATING
55th/ 347
METRIC RANK
26.0%
WAGE/INCOME GAP
38.0/ 100
METRIC RATING
180th/ 347
METRIC RANK
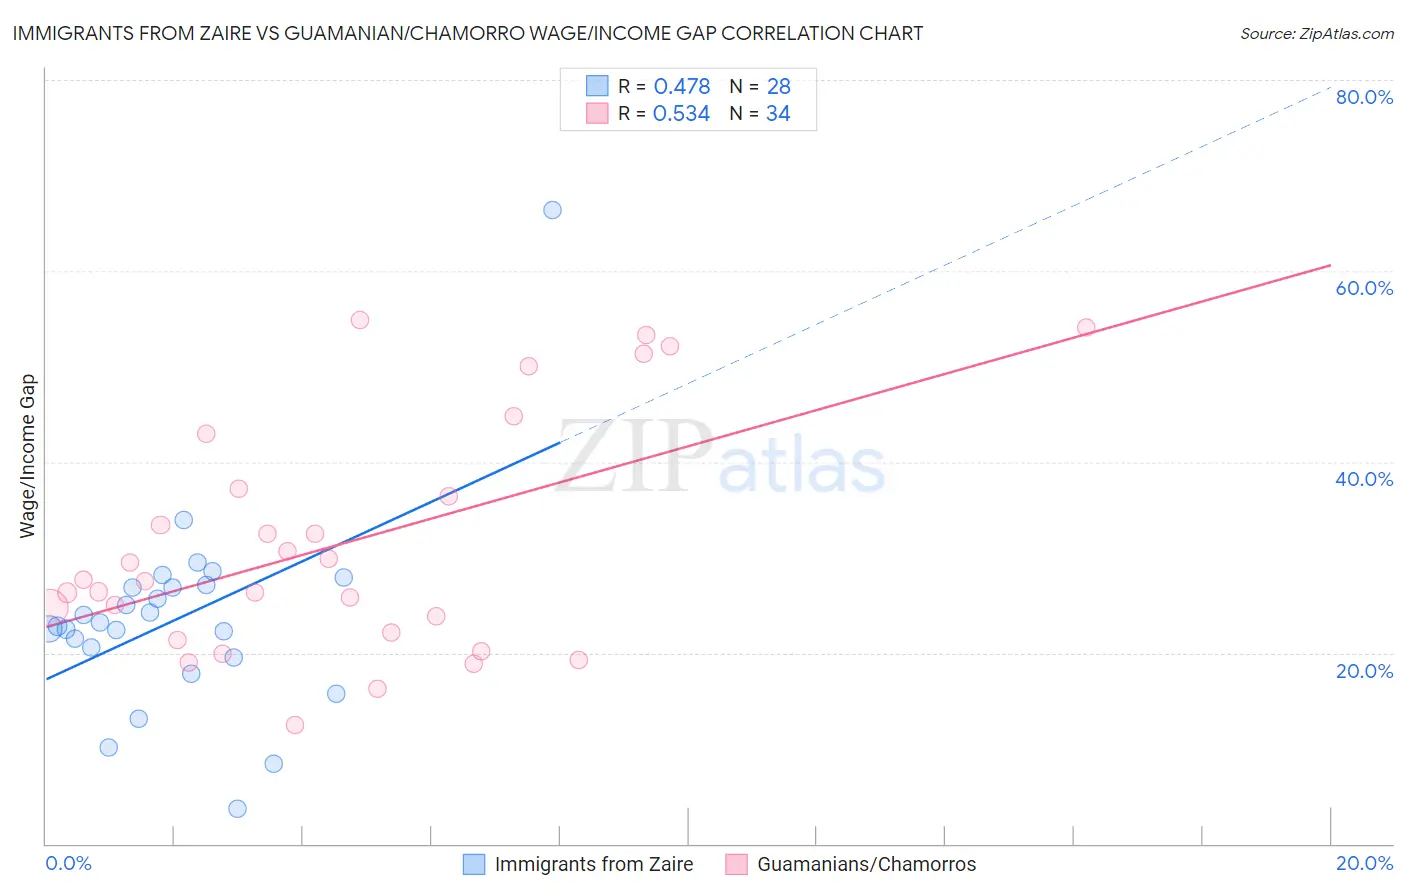
Immigrants from Zaire vs Guamanian/Chamorro Wage/Income Gap Correlation Chart
The statistical analysis conducted on geographies consisting of 107,239,731 people shows a moderate positive correlation between the proportion of Immigrants from Zaire and wage/income gap percentage in the United States with a correlation coefficient (R) of 0.478 and weighted average of 22.3%. Similarly, the statistical analysis conducted on geographies consisting of 221,896,137 people shows a substantial positive correlation between the proportion of Guamanians/Chamorros and wage/income gap percentage in the United States with a correlation coefficient (R) of 0.534 and weighted average of 26.0%, a difference of 16.5%.
Wage/Income Gap Correlation Summary
| Measurement | Immigrants from Zaire | Guamanian/Chamorro |
| Minimum | 3.7% | 12.5% |
| Maximum | 66.4% | 54.9% |
| Range | 62.8% | 42.4% |
| Mean | 23.6% | 31.4% |
| Median | 23.0% | 27.5% |
| Interquartile 25% (IQ1) | 20.1% | 22.2% |
| Interquartile 75% (IQ3) | 27.0% | 37.2% |
| Interquartile Range (IQR) | 6.9% | 15.1% |
| Standard Deviation (Sample) | 10.8% | 12.1% |
| Standard Deviation (Population) | 10.6% | 12.0% |
Similar Demographics by Wage/Income Gap
Demographics Similar to Immigrants from Zaire by Wage/Income Gap
In terms of wage/income gap, the demographic groups most similar to Immigrants from Zaire are Immigrants from Ghana (22.3%, a difference of 0.030%), Ghanaian (22.3%, a difference of 0.13%), Immigrants from Cuba (22.4%, a difference of 0.22%), Navajo (22.4%, a difference of 0.25%), and Immigrants from Middle Africa (22.4%, a difference of 0.27%).
| Demographics | Rating | Rank | Wage/Income Gap |
| Blacks/African Americans | 100.0 /100 | #48 | Exceptional 21.7% |
| Ethiopians | 100.0 /100 | #49 | Exceptional 21.8% |
| Immigrants | Western Africa | 100.0 /100 | #50 | Exceptional 22.0% |
| Tohono O'odham | 100.0 /100 | #51 | Exceptional 22.1% |
| Immigrants | Cameroon | 100.0 /100 | #52 | Exceptional 22.2% |
| Bangladeshis | 100.0 /100 | #53 | Exceptional 22.2% |
| Nepalese | 100.0 /100 | #54 | Exceptional 22.2% |
| Immigrants | Zaire | 100.0 /100 | #55 | Exceptional 22.3% |
| Immigrants | Ghana | 100.0 /100 | #56 | Exceptional 22.3% |
| Ghanaians | 100.0 /100 | #57 | Exceptional 22.3% |
| Immigrants | Cuba | 100.0 /100 | #58 | Exceptional 22.4% |
| Navajo | 100.0 /100 | #59 | Exceptional 22.4% |
| Immigrants | Middle Africa | 100.0 /100 | #60 | Exceptional 22.4% |
| Immigrants | Fiji | 100.0 /100 | #61 | Exceptional 22.4% |
| Immigrants | Guatemala | 100.0 /100 | #62 | Exceptional 22.5% |
Demographics Similar to Guamanians/Chamorros by Wage/Income Gap
In terms of wage/income gap, the demographic groups most similar to Guamanians/Chamorros are Samoan (26.0%, a difference of 0.040%), Immigrants from Bolivia (26.0%, a difference of 0.11%), Immigrants from Serbia (26.0%, a difference of 0.19%), Immigrants from Kazakhstan (26.0%, a difference of 0.20%), and Mexican (26.0%, a difference of 0.26%).
| Demographics | Rating | Rank | Wage/Income Gap |
| Immigrants | Belarus | 52.9 /100 | #173 | Average 25.7% |
| Alaskan Athabascans | 50.0 /100 | #174 | Average 25.8% |
| Sri Lankans | 47.0 /100 | #175 | Average 25.8% |
| Paraguayans | 46.7 /100 | #176 | Average 25.8% |
| Cambodians | 45.1 /100 | #177 | Average 25.8% |
| Chinese | 42.0 /100 | #178 | Average 25.9% |
| Samoans | 38.6 /100 | #179 | Fair 26.0% |
| Guamanians/Chamorros | 38.0 /100 | #180 | Fair 26.0% |
| Immigrants | Bolivia | 36.4 /100 | #181 | Fair 26.0% |
| Immigrants | Serbia | 35.4 /100 | #182 | Fair 26.0% |
| Immigrants | Kazakhstan | 35.2 /100 | #183 | Fair 26.0% |
| Mexicans | 34.4 /100 | #184 | Fair 26.0% |
| Pakistanis | 33.7 /100 | #185 | Fair 26.1% |
| Immigrants | Indonesia | 32.5 /100 | #186 | Fair 26.1% |
| Palestinians | 29.9 /100 | #187 | Fair 26.1% |