Immigrants from Fiji vs Immigrants from Germany Wage/Income Gap
COMPARE
Immigrants from Fiji
Immigrants from Germany
Wage/Income Gap
Wage/Income Gap Comparison
Immigrants from Fiji
Immigrants from Germany
22.4%
WAGE/INCOME GAP
100.0/ 100
METRIC RATING
61st/ 347
METRIC RANK
27.5%
WAGE/INCOME GAP
1.5/ 100
METRIC RATING
261st/ 347
METRIC RANK
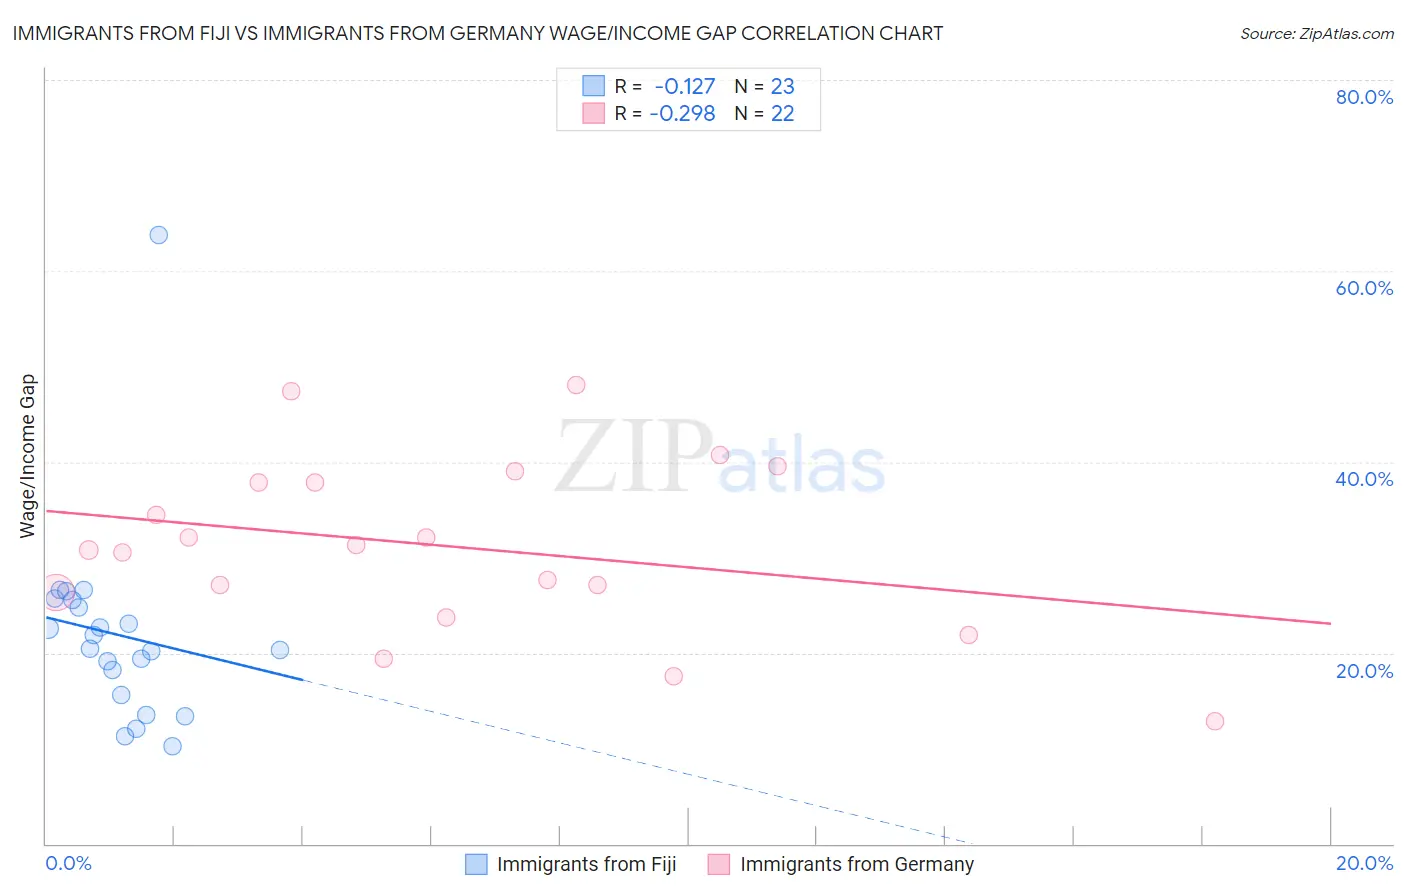
Immigrants from Fiji vs Immigrants from Germany Wage/Income Gap Correlation Chart
The statistical analysis conducted on geographies consisting of 93,739,625 people shows a poor negative correlation between the proportion of Immigrants from Fiji and wage/income gap percentage in the United States with a correlation coefficient (R) of -0.127 and weighted average of 22.4%. Similarly, the statistical analysis conducted on geographies consisting of 463,246,314 people shows a weak negative correlation between the proportion of Immigrants from Germany and wage/income gap percentage in the United States with a correlation coefficient (R) of -0.298 and weighted average of 27.5%, a difference of 22.9%.
Wage/Income Gap Correlation Summary
| Measurement | Immigrants from Fiji | Immigrants from Germany |
| Minimum | 10.2% | 12.9% |
| Maximum | 63.8% | 48.0% |
| Range | 53.5% | 35.1% |
| Mean | 21.9% | 31.1% |
| Median | 20.5% | 31.0% |
| Interquartile 25% (IQ1) | 15.6% | 26.3% |
| Interquartile 75% (IQ3) | 25.6% | 37.9% |
| Interquartile Range (IQR) | 10.0% | 11.6% |
| Standard Deviation (Sample) | 10.5% | 9.1% |
| Standard Deviation (Population) | 10.3% | 8.9% |
Similar Demographics by Wage/Income Gap
Demographics Similar to Immigrants from Fiji by Wage/Income Gap
In terms of wage/income gap, the demographic groups most similar to Immigrants from Fiji are Immigrants from Middle Africa (22.4%, a difference of 0.17%), Navajo (22.4%, a difference of 0.19%), Immigrants from Guatemala (22.5%, a difference of 0.21%), Immigrants from Cuba (22.4%, a difference of 0.23%), and Ghanaian (22.3%, a difference of 0.31%).
| Demographics | Rating | Rank | Wage/Income Gap |
| Nepalese | 100.0 /100 | #54 | Exceptional 22.2% |
| Immigrants | Zaire | 100.0 /100 | #55 | Exceptional 22.3% |
| Immigrants | Ghana | 100.0 /100 | #56 | Exceptional 22.3% |
| Ghanaians | 100.0 /100 | #57 | Exceptional 22.3% |
| Immigrants | Cuba | 100.0 /100 | #58 | Exceptional 22.4% |
| Navajo | 100.0 /100 | #59 | Exceptional 22.4% |
| Immigrants | Middle Africa | 100.0 /100 | #60 | Exceptional 22.4% |
| Immigrants | Fiji | 100.0 /100 | #61 | Exceptional 22.4% |
| Immigrants | Guatemala | 100.0 /100 | #62 | Exceptional 22.5% |
| Immigrants | Ecuador | 100.0 /100 | #63 | Exceptional 22.5% |
| Spanish American Indians | 100.0 /100 | #64 | Exceptional 22.5% |
| Guatemalans | 99.9 /100 | #65 | Exceptional 22.6% |
| Central American Indians | 99.9 /100 | #66 | Exceptional 22.7% |
| Menominee | 99.9 /100 | #67 | Exceptional 22.7% |
| Immigrants | Nigeria | 99.9 /100 | #68 | Exceptional 22.7% |
Demographics Similar to Immigrants from Germany by Wage/Income Gap
In terms of wage/income gap, the demographic groups most similar to Immigrants from Germany are Immigrants from Lebanon (27.5%, a difference of 0.010%), Syrian (27.6%, a difference of 0.10%), Tongan (27.5%, a difference of 0.26%), Icelander (27.5%, a difference of 0.28%), and Slavic (27.4%, a difference of 0.36%).
| Demographics | Rating | Rank | Wage/Income Gap |
| Israelis | 2.1 /100 | #254 | Tragic 27.4% |
| Immigrants | France | 2.1 /100 | #255 | Tragic 27.4% |
| Cherokee | 1.9 /100 | #256 | Tragic 27.4% |
| Luxembourgers | 1.9 /100 | #257 | Tragic 27.4% |
| Slavs | 1.8 /100 | #258 | Tragic 27.4% |
| Icelanders | 1.8 /100 | #259 | Tragic 27.5% |
| Tongans | 1.7 /100 | #260 | Tragic 27.5% |
| Immigrants | Germany | 1.5 /100 | #261 | Tragic 27.5% |
| Immigrants | Lebanon | 1.5 /100 | #262 | Tragic 27.5% |
| Syrians | 1.4 /100 | #263 | Tragic 27.6% |
| Immigrants | Switzerland | 1.0 /100 | #264 | Tragic 27.7% |
| Serbians | 1.0 /100 | #265 | Tragic 27.7% |
| Hmong | 1.0 /100 | #266 | Tragic 27.7% |
| Turks | 1.0 /100 | #267 | Tragic 27.7% |
| New Zealanders | 1.0 /100 | #268 | Tragic 27.7% |