Immigrants from Fiji vs Soviet Union Wage/Income Gap
COMPARE
Immigrants from Fiji
Soviet Union
Wage/Income Gap
Wage/Income Gap Comparison
Immigrants from Fiji
Soviet Union
22.4%
WAGE/INCOME GAP
100.0/ 100
METRIC RATING
61st/ 347
METRIC RANK
24.2%
WAGE/INCOME GAP
97.6/ 100
METRIC RATING
111th/ 347
METRIC RANK
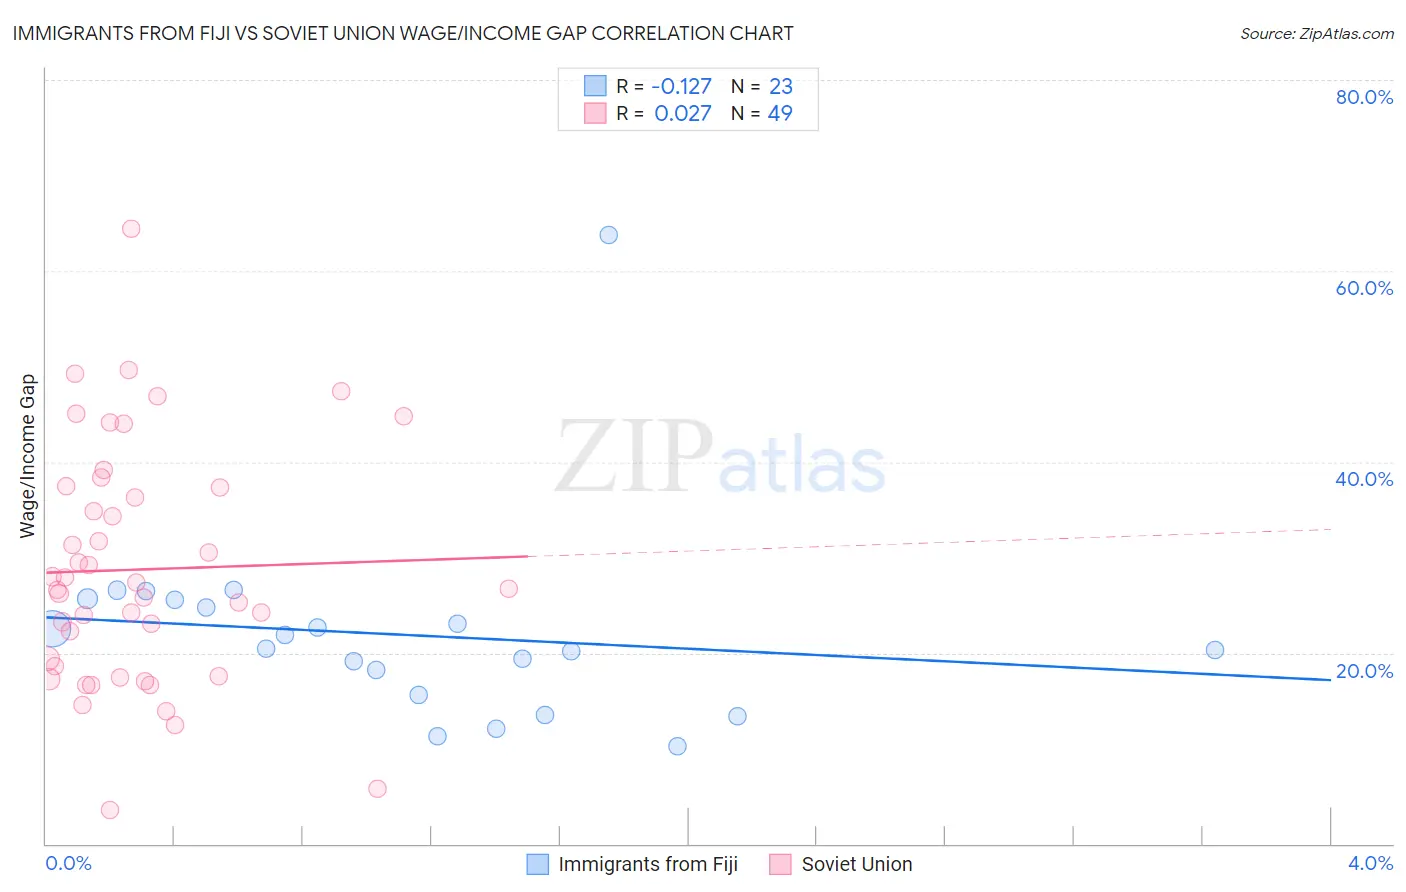
Immigrants from Fiji vs Soviet Union Wage/Income Gap Correlation Chart
The statistical analysis conducted on geographies consisting of 93,739,625 people shows a poor negative correlation between the proportion of Immigrants from Fiji and wage/income gap percentage in the United States with a correlation coefficient (R) of -0.127 and weighted average of 22.4%. Similarly, the statistical analysis conducted on geographies consisting of 43,506,320 people shows no correlation between the proportion of Soviet Union and wage/income gap percentage in the United States with a correlation coefficient (R) of 0.027 and weighted average of 24.2%, a difference of 8.1%.
Wage/Income Gap Correlation Summary
| Measurement | Immigrants from Fiji | Soviet Union |
| Minimum | 10.2% | 3.5% |
| Maximum | 63.8% | 64.4% |
| Range | 53.5% | 60.9% |
| Mean | 21.9% | 28.7% |
| Median | 20.5% | 26.8% |
| Interquartile 25% (IQ1) | 15.6% | 18.1% |
| Interquartile 75% (IQ3) | 25.6% | 37.4% |
| Interquartile Range (IQR) | 10.0% | 19.3% |
| Standard Deviation (Sample) | 10.5% | 12.5% |
| Standard Deviation (Population) | 10.3% | 12.4% |
Similar Demographics by Wage/Income Gap
Demographics Similar to Immigrants from Fiji by Wage/Income Gap
In terms of wage/income gap, the demographic groups most similar to Immigrants from Fiji are Immigrants from Middle Africa (22.4%, a difference of 0.17%), Navajo (22.4%, a difference of 0.19%), Immigrants from Guatemala (22.5%, a difference of 0.21%), Immigrants from Cuba (22.4%, a difference of 0.23%), and Ghanaian (22.3%, a difference of 0.31%).
| Demographics | Rating | Rank | Wage/Income Gap |
| Nepalese | 100.0 /100 | #54 | Exceptional 22.2% |
| Immigrants | Zaire | 100.0 /100 | #55 | Exceptional 22.3% |
| Immigrants | Ghana | 100.0 /100 | #56 | Exceptional 22.3% |
| Ghanaians | 100.0 /100 | #57 | Exceptional 22.3% |
| Immigrants | Cuba | 100.0 /100 | #58 | Exceptional 22.4% |
| Navajo | 100.0 /100 | #59 | Exceptional 22.4% |
| Immigrants | Middle Africa | 100.0 /100 | #60 | Exceptional 22.4% |
| Immigrants | Fiji | 100.0 /100 | #61 | Exceptional 22.4% |
| Immigrants | Guatemala | 100.0 /100 | #62 | Exceptional 22.5% |
| Immigrants | Ecuador | 100.0 /100 | #63 | Exceptional 22.5% |
| Spanish American Indians | 100.0 /100 | #64 | Exceptional 22.5% |
| Guatemalans | 99.9 /100 | #65 | Exceptional 22.6% |
| Central American Indians | 99.9 /100 | #66 | Exceptional 22.7% |
| Menominee | 99.9 /100 | #67 | Exceptional 22.7% |
| Immigrants | Nigeria | 99.9 /100 | #68 | Exceptional 22.7% |
Demographics Similar to Soviet Union by Wage/Income Gap
In terms of wage/income gap, the demographic groups most similar to Soviet Union are Immigrants from Colombia (24.3%, a difference of 0.40%), Immigrants from Morocco (24.1%, a difference of 0.44%), Sioux (24.3%, a difference of 0.45%), Panamanian (24.4%, a difference of 0.65%), and Ugandan (24.1%, a difference of 0.66%).
| Demographics | Rating | Rank | Wage/Income Gap |
| Tlingit-Haida | 98.7 /100 | #104 | Exceptional 24.0% |
| Moroccans | 98.6 /100 | #105 | Exceptional 24.0% |
| Sudanese | 98.6 /100 | #106 | Exceptional 24.0% |
| Yaqui | 98.4 /100 | #107 | Exceptional 24.0% |
| Immigrants | Albania | 98.4 /100 | #108 | Exceptional 24.0% |
| Ugandans | 98.3 /100 | #109 | Exceptional 24.1% |
| Immigrants | Morocco | 98.1 /100 | #110 | Exceptional 24.1% |
| Soviet Union | 97.6 /100 | #111 | Exceptional 24.2% |
| Immigrants | Colombia | 97.0 /100 | #112 | Exceptional 24.3% |
| Sioux | 96.9 /100 | #113 | Exceptional 24.3% |
| Panamanians | 96.5 /100 | #114 | Exceptional 24.4% |
| Immigrants | Kenya | 96.4 /100 | #115 | Exceptional 24.4% |
| Alaska Natives | 96.0 /100 | #116 | Exceptional 24.4% |
| Immigrants | Afghanistan | 95.9 /100 | #117 | Exceptional 24.4% |
| Immigrants | Micronesia | 95.8 /100 | #118 | Exceptional 24.4% |