Immigrants from Australia vs Immigrants from Taiwan Wage/Income Gap
COMPARE
Immigrants from Australia
Immigrants from Taiwan
Wage/Income Gap
Wage/Income Gap Comparison
Immigrants from Australia
Immigrants from Taiwan
28.2%
WAGE/INCOME GAP
0.3/ 100
METRIC RATING
292nd/ 347
METRIC RANK
29.5%
WAGE/INCOME GAP
0.0/ 100
METRIC RATING
335th/ 347
METRIC RANK
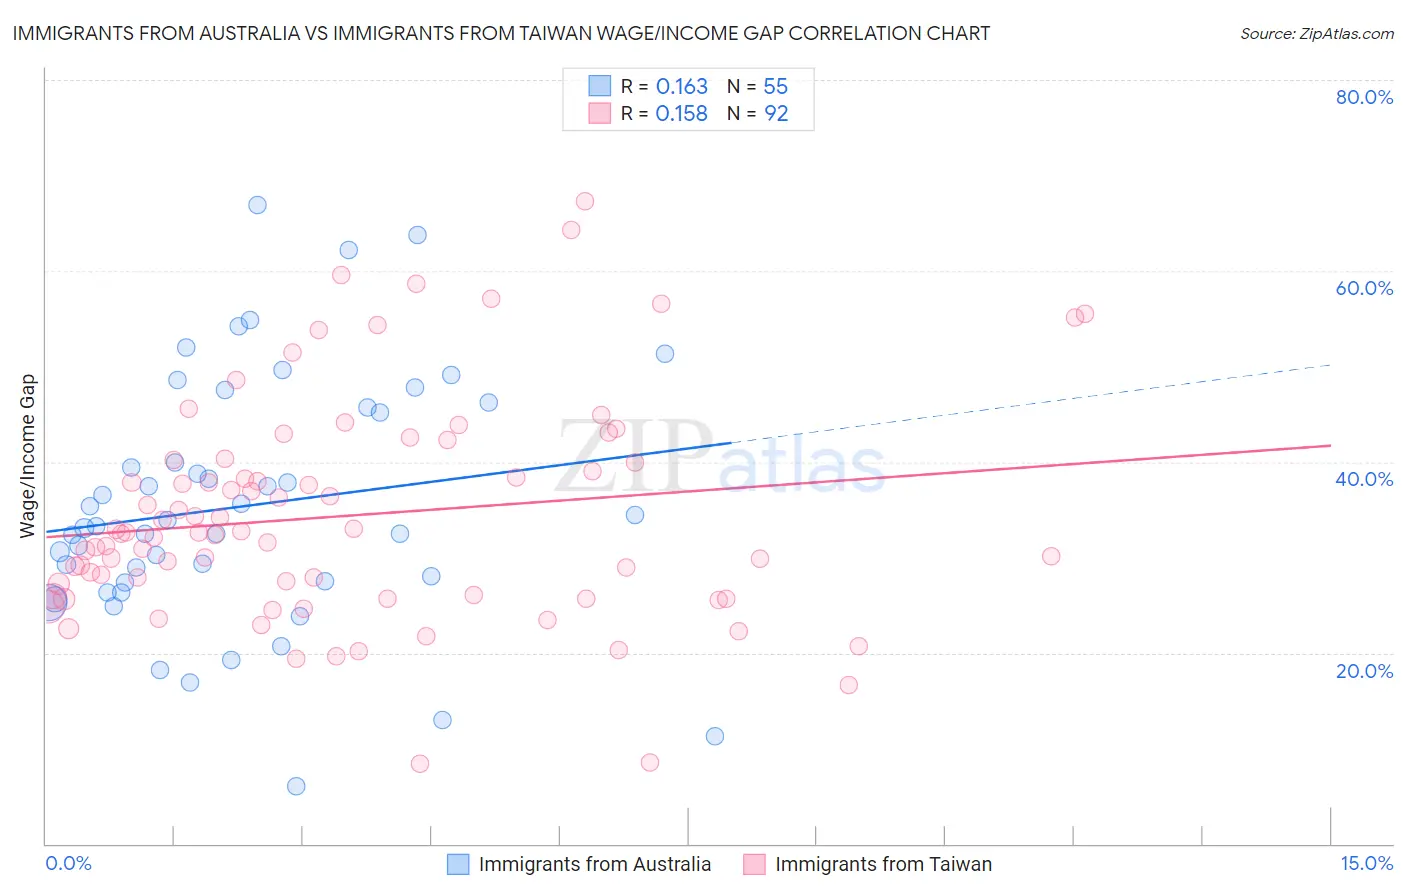
Immigrants from Australia vs Immigrants from Taiwan Wage/Income Gap Correlation Chart
The statistical analysis conducted on geographies consisting of 227,127,530 people shows a poor positive correlation between the proportion of Immigrants from Australia and wage/income gap percentage in the United States with a correlation coefficient (R) of 0.163 and weighted average of 28.2%. Similarly, the statistical analysis conducted on geographies consisting of 298,208,657 people shows a poor positive correlation between the proportion of Immigrants from Taiwan and wage/income gap percentage in the United States with a correlation coefficient (R) of 0.158 and weighted average of 29.5%, a difference of 4.4%.
Wage/Income Gap Correlation Summary
| Measurement | Immigrants from Australia | Immigrants from Taiwan |
| Minimum | 6.0% | 8.4% |
| Maximum | 66.9% | 67.2% |
| Range | 60.9% | 58.8% |
| Mean | 35.4% | 34.4% |
| Median | 33.2% | 32.5% |
| Interquartile 25% (IQ1) | 27.4% | 26.0% |
| Interquartile 75% (IQ3) | 45.7% | 40.1% |
| Interquartile Range (IQR) | 18.3% | 14.1% |
| Standard Deviation (Sample) | 13.0% | 11.6% |
| Standard Deviation (Population) | 12.9% | 11.5% |
Similar Demographics by Wage/Income Gap
Demographics Similar to Immigrants from Australia by Wage/Income Gap
In terms of wage/income gap, the demographic groups most similar to Immigrants from Australia are Czechoslovakian (28.2%, a difference of 0.060%), Immigrants from Israel (28.2%, a difference of 0.11%), Australian (28.2%, a difference of 0.12%), Greek (28.2%, a difference of 0.13%), and Canadian (28.1%, a difference of 0.22%).
| Demographics | Rating | Rank | Wage/Income Gap |
| Italians | 0.4 /100 | #285 | Tragic 28.1% |
| Immigrants | Austria | 0.4 /100 | #286 | Tragic 28.1% |
| Okinawans | 0.4 /100 | #287 | Tragic 28.1% |
| Choctaw | 0.4 /100 | #288 | Tragic 28.1% |
| Canadians | 0.3 /100 | #289 | Tragic 28.1% |
| Australians | 0.3 /100 | #290 | Tragic 28.2% |
| Czechoslovakians | 0.3 /100 | #291 | Tragic 28.2% |
| Immigrants | Australia | 0.3 /100 | #292 | Tragic 28.2% |
| Immigrants | Israel | 0.3 /100 | #293 | Tragic 28.2% |
| Greeks | 0.3 /100 | #294 | Tragic 28.2% |
| Slovenes | 0.3 /100 | #295 | Tragic 28.3% |
| Northern Europeans | 0.3 /100 | #296 | Tragic 28.3% |
| Immigrants | North America | 0.2 /100 | #297 | Tragic 28.4% |
| Austrians | 0.2 /100 | #298 | Tragic 28.4% |
| Immigrants | North Macedonia | 0.2 /100 | #299 | Tragic 28.4% |
Demographics Similar to Immigrants from Taiwan by Wage/Income Gap
In terms of wage/income gap, the demographic groups most similar to Immigrants from Taiwan are English (29.5%, a difference of 0.010%), Swedish (29.4%, a difference of 0.13%), European (29.4%, a difference of 0.27%), Immigrants from South Central Asia (29.3%, a difference of 0.46%), and Dutch (29.6%, a difference of 0.59%).
| Demographics | Rating | Rank | Wage/Income Gap |
| Scandinavians | 0.0 /100 | #328 | Tragic 29.1% |
| Scottish | 0.0 /100 | #329 | Tragic 29.1% |
| Germans | 0.0 /100 | #330 | Tragic 29.2% |
| Czechs | 0.0 /100 | #331 | Tragic 29.2% |
| Immigrants | South Central Asia | 0.0 /100 | #332 | Tragic 29.3% |
| Europeans | 0.0 /100 | #333 | Tragic 29.4% |
| Swedes | 0.0 /100 | #334 | Tragic 29.4% |
| Immigrants | Taiwan | 0.0 /100 | #335 | Tragic 29.5% |
| English | 0.0 /100 | #336 | Tragic 29.5% |
| Dutch | 0.0 /100 | #337 | Tragic 29.6% |
| Filipinos | 0.0 /100 | #338 | Tragic 29.7% |
| Iranians | 0.0 /100 | #339 | Tragic 29.7% |
| Swiss | 0.0 /100 | #340 | Tragic 30.0% |
| Thais | 0.0 /100 | #341 | Tragic 30.5% |
| Pennsylvania Germans | 0.0 /100 | #342 | Tragic 30.7% |