Chippewa vs Lumbee Wage/Income Gap
COMPARE
Chippewa
Lumbee
Wage/Income Gap
Wage/Income Gap Comparison
Chippewa
Lumbee
25.0%
WAGE/INCOME GAP
86.9/ 100
METRIC RATING
144th/ 347
METRIC RANK
21.3%
WAGE/INCOME GAP
100.0/ 100
METRIC RATING
40th/ 347
METRIC RANK
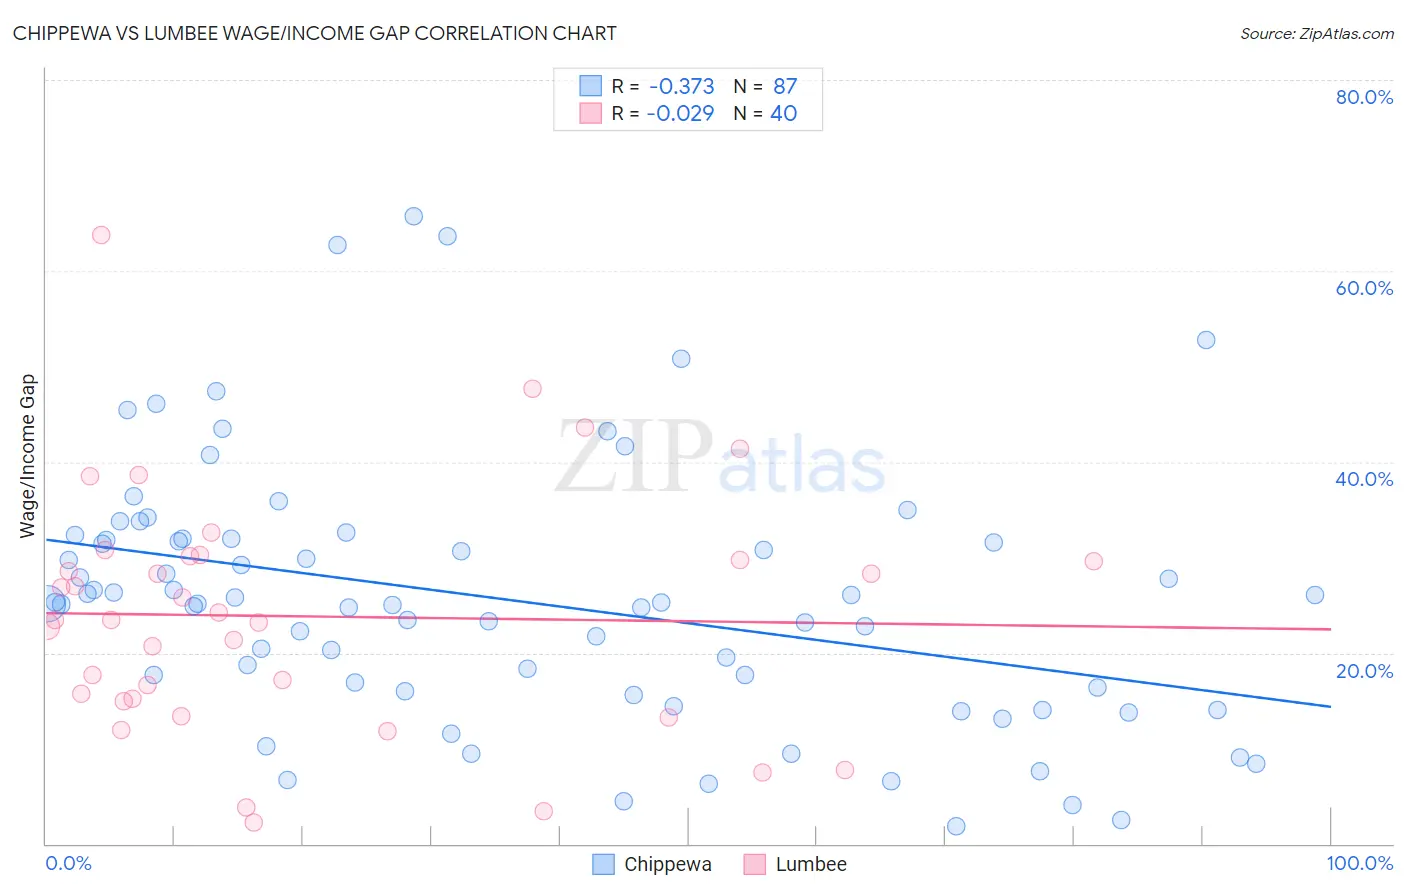
Chippewa vs Lumbee Wage/Income Gap Correlation Chart
The statistical analysis conducted on geographies consisting of 214,916,578 people shows a mild negative correlation between the proportion of Chippewa and wage/income gap percentage in the United States with a correlation coefficient (R) of -0.373 and weighted average of 25.0%. Similarly, the statistical analysis conducted on geographies consisting of 92,243,625 people shows no correlation between the proportion of Lumbee and wage/income gap percentage in the United States with a correlation coefficient (R) of -0.029 and weighted average of 21.3%, a difference of 17.1%.
Wage/Income Gap Correlation Summary
| Measurement | Chippewa | Lumbee |
| Minimum | 1.9% | 2.2% |
| Maximum | 65.8% | 63.8% |
| Range | 63.9% | 61.6% |
| Mean | 25.6% | 23.8% |
| Median | 25.2% | 23.4% |
| Interquartile 25% (IQ1) | 16.0% | 15.1% |
| Interquartile 75% (IQ3) | 31.9% | 29.9% |
| Interquartile Range (IQR) | 15.9% | 14.8% |
| Standard Deviation (Sample) | 13.5% | 12.8% |
| Standard Deviation (Population) | 13.4% | 12.6% |
Similar Demographics by Wage/Income Gap
Demographics Similar to Chippewa by Wage/Income Gap
In terms of wage/income gap, the demographic groups most similar to Chippewa are Immigrants from Uganda (24.9%, a difference of 0.18%), Afghan (24.9%, a difference of 0.19%), Comanche (25.0%, a difference of 0.24%), South American (25.0%, a difference of 0.24%), and Malaysian (25.0%, a difference of 0.27%).
| Demographics | Rating | Rank | Wage/Income Gap |
| Immigrants | South Eastern Asia | 90.9 /100 | #137 | Exceptional 24.8% |
| Immigrants | Bosnia and Herzegovina | 90.1 /100 | #138 | Exceptional 24.8% |
| Hispanics or Latinos | 89.5 /100 | #139 | Excellent 24.9% |
| Immigrants | Nepal | 89.3 /100 | #140 | Excellent 24.9% |
| Hawaiians | 89.3 /100 | #141 | Excellent 24.9% |
| Afghans | 88.1 /100 | #142 | Excellent 24.9% |
| Immigrants | Uganda | 88.0 /100 | #143 | Excellent 24.9% |
| Chippewa | 86.9 /100 | #144 | Excellent 25.0% |
| Comanche | 85.2 /100 | #145 | Excellent 25.0% |
| South Americans | 85.2 /100 | #146 | Excellent 25.0% |
| Malaysians | 84.9 /100 | #147 | Excellent 25.0% |
| Iroquois | 83.9 /100 | #148 | Excellent 25.1% |
| Immigrants | Peru | 82.6 /100 | #149 | Excellent 25.1% |
| Immigrants | Immigrants | 82.3 /100 | #150 | Excellent 25.1% |
| Taiwanese | 81.6 /100 | #151 | Excellent 25.1% |
Demographics Similar to Lumbee by Wage/Income Gap
In terms of wage/income gap, the demographic groups most similar to Lumbee are Colville (21.3%, a difference of 0.20%), Immigrants from Belize (21.3%, a difference of 0.31%), Immigrants from Somalia (21.2%, a difference of 0.36%), Belizean (21.2%, a difference of 0.43%), and Somali (21.2%, a difference of 0.45%).
| Demographics | Rating | Rank | Wage/Income Gap |
| Immigrants | Bahamas | 100.0 /100 | #33 | Exceptional 21.1% |
| Pima | 100.0 /100 | #34 | Exceptional 21.1% |
| Somalis | 100.0 /100 | #35 | Exceptional 21.2% |
| Belizeans | 100.0 /100 | #36 | Exceptional 21.2% |
| Immigrants | Somalia | 100.0 /100 | #37 | Exceptional 21.2% |
| Immigrants | Belize | 100.0 /100 | #38 | Exceptional 21.3% |
| Colville | 100.0 /100 | #39 | Exceptional 21.3% |
| Lumbee | 100.0 /100 | #40 | Exceptional 21.3% |
| Liberians | 100.0 /100 | #41 | Exceptional 21.4% |
| Immigrants | Sierra Leone | 100.0 /100 | #42 | Exceptional 21.4% |
| Sierra Leoneans | 100.0 /100 | #43 | Exceptional 21.4% |
| Immigrants | Eritrea | 100.0 /100 | #44 | Exceptional 21.4% |
| U.S. Virgin Islanders | 100.0 /100 | #45 | Exceptional 21.5% |
| Immigrants | Ethiopia | 100.0 /100 | #46 | Exceptional 21.6% |
| Immigrants | Congo | 100.0 /100 | #47 | Exceptional 21.7% |