Cheyenne 4 or more Vehicles in Household

COMPARE

Cheyenne
Race
Ancestry
AfghanAfricanAlaska NativeAlaskan AthabascanAlbanianAleutAlsatianAmericanApacheArabArapahoArgentineanArmenianAssyrian/Chaldean/SyriacAustralianAustrianBahamianBangladeshiBarbadianBasqueBelgianBelizeanBermudanBhutaneseBlackfeetBolivianBrazilianBritishBritish West IndianBulgarianBurmeseCajunCambodianCanadianCape VerdeanCarpatho RusynCelticCentral AmericanCentral American IndianCherokeeCheyenneChickasawChileanChineseChippewaChoctawColombianColvilleComancheCosta RicanCreeCreekCroatianCrowCubanCypriotCzechCzechoslovakianDanishDelawareDominicanDutchDutch West IndianEastern EuropeanEcuadorianEgyptianEnglishEstonianEthiopianEuropeanFijianFilipinoFinnishFrenchFrench American IndianFrench CanadianGermanGerman RussianGhanaianGreekGuamanian/ChamorroGuatemalanGuyaneseHaitianHmongHonduranHopiHoumaHungarianIcelanderIndian (Asian)IndonesianInupiatIranianIraqiIrishIroquoisIsraeliItalianJamaicanJapaneseJordanianKenyanKiowaKoreanLaotianLatvianLebaneseLiberianLithuanianLumbeeLuxembourgerMacedonianMalaysianMalteseMarshalleseMenomineeMexicanMexican American IndianMongolianMoroccanNative HawaiianNavajoNepaleseNew ZealanderNicaraguanNigerianNorthern EuropeanNorwegianOkinawanOsageOttawaPaiutePakistaniPalestinianPanamanianParaguayanPennsylvania GermanPeruvianPimaPolishPortuguesePotawatomiPuebloPuerto RicanPuget Sound SalishRomanianRussianSalvadoranSamoanScandinavianScotch-IrishScottishSeminoleSenegaleseSerbianShoshoneSierra LeoneanSiouxSlavicSlovakSloveneSomaliSouth AfricanSouth AmericanSouth American IndianSoviet UnionSpaniardSpanishSpanish AmericanSpanish American IndianSri LankanSubsaharan AfricanSudaneseSwedishSwissSyrianTaiwaneseThaiTlingit-HaidaTohono O'OdhamTonganTrinidadian and TobagonianTsimshianTurkishU.S. Virgin IslanderUgandanUkrainianUruguayanUteVenezuelanVietnameseWelshWest IndianYakamaYaquiYugoslavianYumanYup'ikZimbabwean
Immigration
NonimmigrantsImmigrantsAfghanistanAfricaAlbaniaArgentinaArmeniaAsiaAustraliaAustriaBahamasBangladeshBarbadosBelarusBelgiumBelizeBoliviaBosnia and HerzegovinaBrazilBulgariaBurma/MyanmarCabo VerdeCambodiaCameroonCanadaCaribbeanCentral AmericaChileChinaColombiaCongoCosta RicaCroatiaCubaCzechoslovakiaDenmarkDominicaDominican RepublicEastern AfricaEastern AsiaEastern EuropeEcuadorEgyptEl SalvadorEnglandEritreaEthiopiaEuropeFijiFranceGermanyGhanaGreeceGrenadaGuatemalaGuyanaHaitiHondurasHong KongHungaryIndiaIndonesiaIranIraqIrelandIsraelItalyJamaicaJapanJordanKazakhstanKenyaKoreaKuwaitLaosLatin AmericaLatviaLebanonLiberiaLithuaniaMalaysiaMexicoMicronesiaMiddle AfricaMoldovaMoroccoNepalNetherlandsNicaraguaNigeriaNorth AmericaNorth MacedoniaNorthern AfricaNorthern EuropeNorwayOceaniaPakistanPanamaPeruPhilippinesPolandPortugalRomaniaRussiaSaudi ArabiaScotlandSenegalSerbiaSierra LeoneSingaporeSomaliaSouth AfricaSouth AmericaSouth Central AsiaSouth Eastern AsiaSouthern EuropeSpainSri LankaSt. Vincent and the GrenadinesSudanSwedenSwitzerlandSyriaTaiwanThailandTrinidad and TobagoTurkeyUgandaUkraineUruguayUzbekistanVenezuelaVietnamWest IndiesWestern AfricaWestern AsiaWestern EuropeYemenZaireZimbabweAzores
Select to Compare
Race
Ancestry
AfghanAfricanAlaska NativeAlaskan AthabascanAlbanianAleutAlsatianAmericanApacheArabArapahoArgentineanArmenianAssyrian/Chaldean/SyriacAustralianAustrianBahamianBangladeshiBarbadianBasqueBelgianBelizeanBermudanBhutaneseBlackfeetBolivianBrazilianBritishBritish West IndianBulgarianBurmeseCajunCambodianCanadianCape VerdeanCarpatho RusynCelticCentral AmericanCentral American IndianCherokeeChickasawChileanChineseChippewaChoctawColombianColvilleComancheCosta RicanCreeCreekCroatianCrowCubanCypriotCzechCzechoslovakianDanishDelawareDominicanDutchDutch West IndianEastern EuropeanEcuadorianEgyptianEnglishEstonianEthiopianEuropeanFijianFilipinoFinnishFrenchFrench American IndianFrench CanadianGermanGerman RussianGhanaianGreekGuamanian/ChamorroGuatemalanGuyaneseHaitianHmongHonduranHopiHoumaHungarianIcelanderIndian (Asian)IndonesianInupiatIranianIraqiIrishIroquoisIsraeliItalianJamaicanJapaneseJordanianKenyanKiowaKoreanLaotianLatvianLebaneseLiberianLithuanianLumbeeLuxembourgerMacedonianMalaysianMalteseMarshalleseMenomineeMexicanMexican American IndianMongolianMoroccanNative HawaiianNavajoNepaleseNew ZealanderNicaraguanNigerianNorthern EuropeanNorwegianOkinawanOsageOttawaPaiutePakistaniPalestinianPanamanianParaguayanPennsylvania GermanPeruvianPimaPolishPortuguesePotawatomiPuebloPuerto RicanPuget Sound SalishRomanianRussianSalvadoranSamoanScandinavianScotch-IrishScottishSeminoleSenegaleseSerbianShoshoneSierra LeoneanSiouxSlavicSlovakSloveneSomaliSouth AfricanSouth AmericanSouth American IndianSoviet UnionSpaniardSpanishSpanish AmericanSpanish American IndianSri LankanSubsaharan AfricanSudaneseSwedishSwissSyrianTaiwaneseThaiTlingit-HaidaTohono O'OdhamTonganTrinidadian and TobagonianTsimshianTurkishU.S. Virgin IslanderUgandanUkrainianUruguayanUteVenezuelanVietnameseWelshWest IndianYakamaYaquiYugoslavianYumanYup'ikZimbabwean
Immigration
NonimmigrantsImmigrantsAfghanistanAfricaAlbaniaArgentinaArmeniaAsiaAustraliaAustriaBahamasBangladeshBarbadosBelarusBelgiumBelizeBoliviaBosnia and HerzegovinaBrazilBulgariaBurma/MyanmarCabo VerdeCambodiaCameroonCanadaCaribbeanCentral AmericaChileChinaColombiaCongoCosta RicaCroatiaCubaCzechoslovakiaDenmarkDominicaDominican RepublicEastern AfricaEastern AsiaEastern EuropeEcuadorEgyptEl SalvadorEnglandEritreaEthiopiaEuropeFijiFranceGermanyGhanaGreeceGrenadaGuatemalaGuyanaHaitiHondurasHong KongHungaryIndiaIndonesiaIranIraqIrelandIsraelItalyJamaicaJapanJordanKazakhstanKenyaKoreaKuwaitLaosLatin AmericaLatviaLebanonLiberiaLithuaniaMalaysiaMexicoMicronesiaMiddle AfricaMoldovaMoroccoNepalNetherlandsNicaraguaNigeriaNorth AmericaNorth MacedoniaNorthern AfricaNorthern EuropeNorwayOceaniaPakistanPanamaPeruPhilippinesPolandPortugalRomaniaRussiaSaudi ArabiaScotlandSenegalSerbiaSierra LeoneSingaporeSomaliaSouth AfricaSouth AmericaSouth Central AsiaSouth Eastern AsiaSouthern EuropeSpainSri LankaSt. Vincent and the GrenadinesSudanSwedenSwitzerlandSyriaTaiwanThailandTrinidad and TobagoTurkeyUgandaUkraineUruguayUzbekistanVenezuelaVietnamWest IndiesWestern AfricaWestern AsiaWestern EuropeYemenZaireZimbabweAzores
4 or more Vehicles in Household
Income
Poverty
Unemployment
Labor Participation
Family Structure
Vehicle Availability
Education Level
Disability

Cheyenne 4 or more Vehicles in Household
Exceptional

8.3%
4+ VEHICLES AVAILABLE
100.0/ 100
METRIC RATING
28th/ 347
METRIC RANK

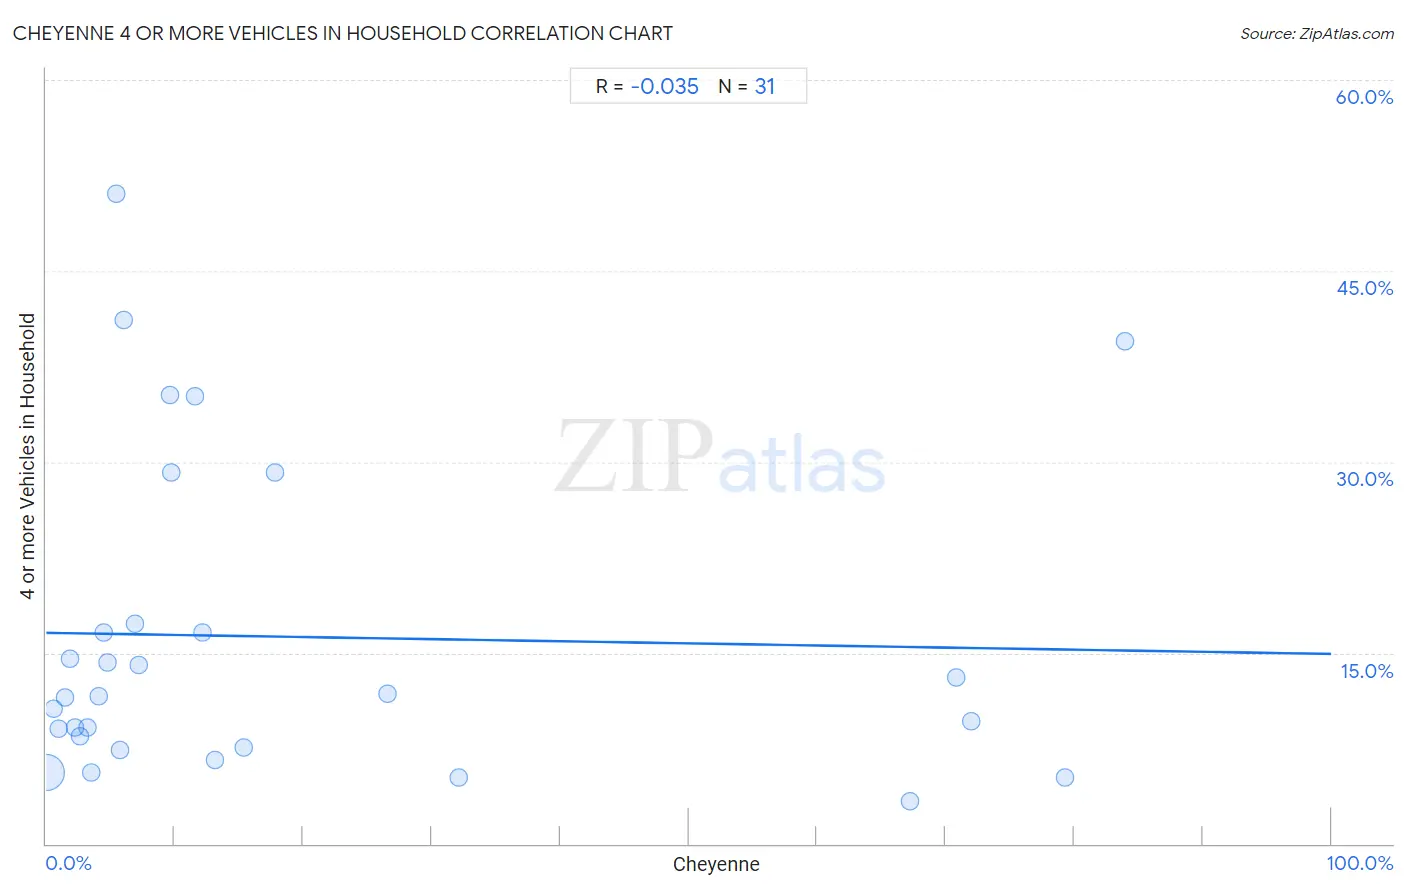
Cheyenne 4 or more Vehicles in Household Correlation Chart

The statistical analysis conducted on geographies consisting of 80,661,568 people shows no correlation between the proportion of Cheyenne and percentage of households with 4 or more vehicles available in the United States with a correlation coefficient (R) of -0.035 and weighted average of 8.3%. On average, for every 1% (one percent) increase in Cheyenne within a typical geography, there is a decrease of 0.017% in percentage of households with 4 or more vehicles available.
Cheyenne 4 or more Vehicles in Household
It is essential to understand that the correlation between the percentage of Cheyenne and percentage of households with 4 or more vehicles available does not imply a direct cause-and-effect relationship. It remains uncertain whether the presence of Cheyenne influences an upward or downward trend in the level of percentage of households with 4 or more vehicles available within an area, or if Cheyenne simply ended up residing in those areas with higher or lower levels of percentage of households with 4 or more vehicles available due to other factors.

Demographics Similar to Cheyenne by 4 or more Vehicles in Household

In terms of 4 or more vehicles in household, the demographic groups most similar to Cheyenne are Immigrants from South Eastern Asia (8.2%, a difference of 0.66%), Navajo (8.2%, a difference of 0.69%), Native/Alaskan (8.2%, a difference of 1.1%), Sri Lankan (8.4%, a difference of 1.4%), and Mexican American Indian (8.4%, a difference of 1.5%).
DemographicsRating | Rank4 or more Vehicles in Household
Danes
100.0
/100
|
#21
Exceptional
8.6%
Immigrants from Vietnam
100.0
/100
|
#22
Exceptional
8.6%
Immigrants from Philippines
100.0
/100
|
#23
Exceptional
8.5%
Immigrants from Central America
100.0
/100
|
#24
Exceptional
8.5%
Basques
100.0
/100
|
#25
Exceptional
8.4%
Mexican American Indians
100.0
/100
|
#26
Exceptional
8.4%
Sri Lankans
100.0
/100
|
#27
Exceptional
8.4%
Cheyenne
100.0
/100
|
#28
Exceptional
8.3%
Immigrants from South Eastern Asia
100.0
/100
|
#29
Exceptional
8.2%
Navajo
100.0
/100
|
#30
Exceptional
8.2%
Natives/Alaskans
100.0
/100
|
#31
Exceptional
8.2%
Marshallese
100.0
/100
|
#32
Exceptional
8.1%
Yaqui
100.0
/100
|
#33
Exceptional
8.1%
Alaskan Athabascans
100.0
/100
|
#34
Exceptional
8.1%
Guamanians/Chamorros
100.0
/100
|
#35
Exceptional
8.1%

Cheyenne 4 or more Vehicles in Household Correlation Summary

MeasurementCheyenne Data4 or more Vehicles in Household Data
Minimum0.026%3.3%
Maximum84.0%51.1%
Range83.9%47.8%
Mean18.8%16.3%
Median6.9%11.5%
Interquartile 25% (IQ1)3.2%7.5%
Interquartile 75% (IQ3)17.8%17.3%
Interquartile Range (IQR)14.7%9.8%
Standard Deviation (Sample)26.0%12.5%
Standard Deviation (Population)25.6%12.3%

Correlation Details

Cheyenne PercentileSample Size4 or more Vehicles in Household
[
0.0%
-
0.5%
]
0.026%
79,607,7395.6%
[
0.5%
-
1.0%
]
0.58%
515,87910.6%
[
1.0%
-
1.5%
]
1.00%
369,0529.0%
[
1.0%
-
1.5%
]
1.44%
50,62411.5%
[
1.5%
-
2.0%
]
1.87%
43,19414.5%
[
2.0%
-
2.5%
]
2.27%
15,5669.2%
[
2.5%
-
3.0%
]
2.63%
5,7808.4%
[
3.0%
-
3.5%
]
3.18%
10,2649.2%
[
3.5%
-
4.0%
]
3.52%
6,1125.6%
[
4.0%
-
4.5%
]
4.09%
8,70211.5%
[
4.0%
-
4.5%
]
4.44%
2,40916.6%
[
4.5%
-
5.0%
]
4.74%
2,57214.3%
[
5.0%
-
5.5%
]
5.45%
22051.1%
[
5.5%
-
6.0%
]
5.70%
2,6517.3%
[
6.0%
-
6.5%
]
6.06%
29741.1%
[
6.5%
-
7.0%
]
6.92%
1,60317.3%
[
7.0%
-
7.5%
]
7.21%
1,23514.0%
[
9.5%
-
10.0%
]
9.58%
4,65435.3%
[
9.5%
-
10.0%
]
9.72%
1,13229.2%
[
11.5%
-
12.0%
]
11.56%
17335.2%
[
12.0%
-
12.5%
]
12.12%
1,69216.6%
[
13.0%
-
13.5%
]
13.18%
3876.6%
[
15.0%
-
15.5%
]
15.35%
3917.5%
[
17.5%
-
18.0%
]
17.83%
12929.2%
[
26.5%
-
27.0%
]
26.58%
1,12511.8%
[
32.0%
-
32.5%
]
32.06%
7835.2%
[
67.0%
-
67.5%
]
67.20%
2,0643.3%
[
70.5%
-
71.0%
]
70.81%
96613.1%
[
71.5%
-
72.0%
]
71.99%
3,0389.6%
[
79.0%
-
79.5%
]
79.32%
4745.2%
[
83.5%
-
84.0%
]
83.96%
66139.5%