Cheyenne vs Puerto Rican Wage/Income Gap
COMPARE
Cheyenne
Puerto Rican
Wage/Income Gap
Wage/Income Gap Comparison
Cheyenne
Puerto Ricans
23.3%
WAGE/INCOME GAP
99.7/ 100
METRIC RATING
86th/ 347
METRIC RANK
18.7%
WAGE/INCOME GAP
100.0/ 100
METRIC RATING
7th/ 347
METRIC RANK
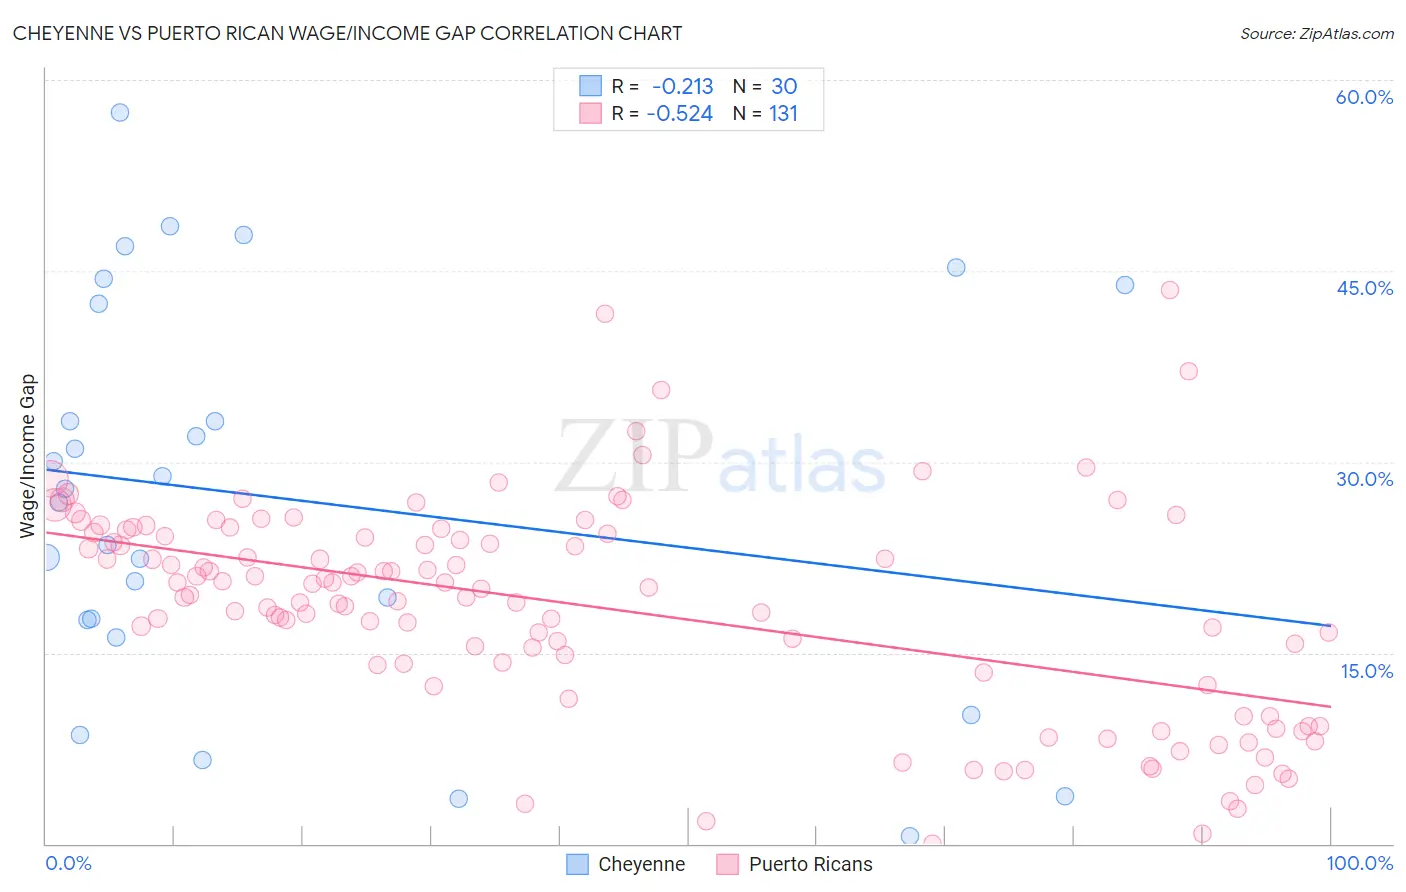
Cheyenne vs Puerto Rican Wage/Income Gap Correlation Chart
The statistical analysis conducted on geographies consisting of 80,669,985 people shows a weak negative correlation between the proportion of Cheyenne and wage/income gap percentage in the United States with a correlation coefficient (R) of -0.213 and weighted average of 23.3%. Similarly, the statistical analysis conducted on geographies consisting of 527,155,694 people shows a substantial negative correlation between the proportion of Puerto Ricans and wage/income gap percentage in the United States with a correlation coefficient (R) of -0.524 and weighted average of 18.7%, a difference of 24.6%.
Wage/Income Gap Correlation Summary
| Measurement | Cheyenne | Puerto Rican |
| Minimum | 0.62% | 0.0036% |
| Maximum | 57.5% | 43.5% |
| Range | 56.8% | 43.5% |
| Mean | 27.1% | 18.6% |
| Median | 27.3% | 20.0% |
| Interquartile 25% (IQ1) | 17.6% | 13.4% |
| Interquartile 75% (IQ3) | 42.4% | 24.3% |
| Interquartile Range (IQR) | 24.8% | 10.9% |
| Standard Deviation (Sample) | 15.3% | 8.4% |
| Standard Deviation (Population) | 15.0% | 8.3% |
Similar Demographics by Wage/Income Gap
Demographics Similar to Cheyenne by Wage/Income Gap
In terms of wage/income gap, the demographic groups most similar to Cheyenne are Yuman (23.3%, a difference of 0.050%), Immigrants from Cambodia (23.3%, a difference of 0.20%), Cuban (23.3%, a difference of 0.26%), Immigrants from Panama (23.4%, a difference of 0.37%), and Marshallese (23.4%, a difference of 0.46%).
| Demographics | Rating | Rank | Wage/Income Gap |
| Immigrants | Nicaragua | 99.9 /100 | #79 | Exceptional 23.0% |
| Salvadorans | 99.9 /100 | #80 | Exceptional 23.0% |
| Bermudans | 99.8 /100 | #81 | Exceptional 23.1% |
| Central Americans | 99.8 /100 | #82 | Exceptional 23.1% |
| Immigrants | Africa | 99.8 /100 | #83 | Exceptional 23.2% |
| Cubans | 99.7 /100 | #84 | Exceptional 23.3% |
| Immigrants | Cambodia | 99.7 /100 | #85 | Exceptional 23.3% |
| Cheyenne | 99.7 /100 | #86 | Exceptional 23.3% |
| Yuman | 99.7 /100 | #87 | Exceptional 23.3% |
| Immigrants | Panama | 99.6 /100 | #88 | Exceptional 23.4% |
| Marshallese | 99.6 /100 | #89 | Exceptional 23.4% |
| Nicaraguans | 99.6 /100 | #90 | Exceptional 23.4% |
| Arapaho | 99.6 /100 | #91 | Exceptional 23.5% |
| Immigrants | Honduras | 99.5 /100 | #92 | Exceptional 23.5% |
| Immigrants | Cabo Verde | 99.5 /100 | #93 | Exceptional 23.6% |
Demographics Similar to Puerto Ricans by Wage/Income Gap
In terms of wage/income gap, the demographic groups most similar to Puerto Ricans are Immigrants from Jamaica (18.8%, a difference of 0.63%), Barbadian (19.0%, a difference of 1.3%), Crow (19.1%, a difference of 1.8%), Immigrants from Guyana (18.4%, a difference of 2.0%), and Guyanese (18.3%, a difference of 2.3%).
| Demographics | Rating | Rank | Wage/Income Gap |
| Immigrants | Grenada | 100.0 /100 | #1 | Exceptional 16.2% |
| Immigrants | St. Vincent and the Grenadines | 100.0 /100 | #2 | Exceptional 16.4% |
| Immigrants | Barbados | 100.0 /100 | #3 | Exceptional 17.8% |
| British West Indians | 100.0 /100 | #4 | Exceptional 18.0% |
| Guyanese | 100.0 /100 | #5 | Exceptional 18.3% |
| Immigrants | Guyana | 100.0 /100 | #6 | Exceptional 18.4% |
| Puerto Ricans | 100.0 /100 | #7 | Exceptional 18.7% |
| Immigrants | Jamaica | 100.0 /100 | #8 | Exceptional 18.8% |
| Barbadians | 100.0 /100 | #9 | Exceptional 19.0% |
| Crow | 100.0 /100 | #10 | Exceptional 19.1% |
| Immigrants | Haiti | 100.0 /100 | #11 | Exceptional 19.2% |
| Immigrants | West Indies | 100.0 /100 | #12 | Exceptional 19.2% |
| Trinidadians and Tobagonians | 100.0 /100 | #13 | Exceptional 19.3% |
| Immigrants | Trinidad and Tobago | 100.0 /100 | #14 | Exceptional 19.3% |
| West Indians | 100.0 /100 | #15 | Exceptional 19.6% |