Cheyenne College, Under 1 year
COMPARE
Cheyenne
Select to Compare
College, Under 1 year
Cheyenne College, Under 1 year
60.6%
COLLEGE, UNDER 1 YEAR
0.1/ 100
METRIC RATING
270th/ 347
METRIC RANK
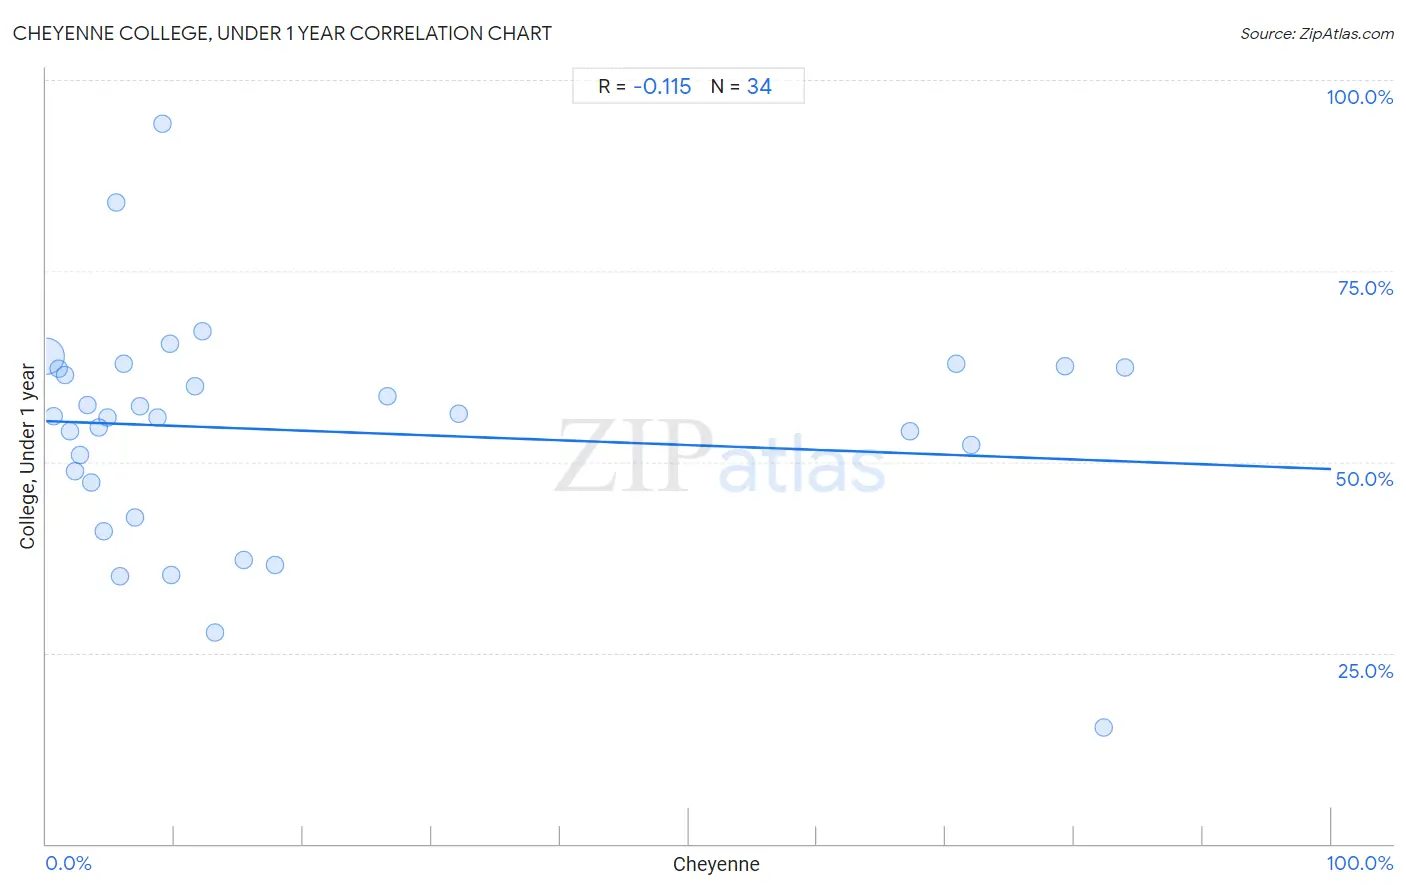
Cheyenne College, Under 1 year Correlation Chart
The statistical analysis conducted on geographies consisting of 80,719,411 people shows a poor negative correlation between the proportion of Cheyenne and percentage of population with at least college, under 1 year education in the United States with a correlation coefficient (R) of -0.115 and weighted average of 60.6%. On average, for every 1% (one percent) increase in Cheyenne within a typical geography, there is a decrease of 0.063% in percentage of population with at least college, under 1 year education.
It is essential to understand that the correlation between the percentage of Cheyenne and percentage of population with at least college, under 1 year education does not imply a direct cause-and-effect relationship. It remains uncertain whether the presence of Cheyenne influences an upward or downward trend in the level of percentage of population with at least college, under 1 year education within an area, or if Cheyenne simply ended up residing in those areas with higher or lower levels of percentage of population with at least college, under 1 year education due to other factors.
Demographics Similar to Cheyenne by College, Under 1 year
In terms of college, under 1 year, the demographic groups most similar to Cheyenne are U.S. Virgin Islander (60.6%, a difference of 0.020%), Immigrants from West Indies (60.6%, a difference of 0.11%), Jamaican (60.5%, a difference of 0.17%), Chickasaw (60.4%, a difference of 0.22%), and Alaska Native (60.4%, a difference of 0.22%).
| Demographics | Rating | Rank | College, Under 1 year |
| Shoshone | 0.2 /100 | #263 | Tragic 61.1% |
| Trinidadians and Tobagonians | 0.2 /100 | #264 | Tragic 61.1% |
| Immigrants from Bahamas | 0.2 /100 | #265 | Tragic 61.1% |
| Alaskan Athabascans | 0.2 /100 | #266 | Tragic 61.0% |
| Americans | 0.2 /100 | #267 | Tragic 61.0% |
| Immigrants from Trinidad and Tobago | 0.1 /100 | #268 | Tragic 60.7% |
| Immigrants from West Indies | 0.1 /100 | #269 | Tragic 60.6% |
| Cheyenne | 0.1 /100 | #270 | Tragic 60.6% |
| U.S. Virgin Islanders | 0.1 /100 | #271 | Tragic 60.6% |
| Jamaicans | 0.1 /100 | #272 | Tragic 60.5% |
| Chickasaw | 0.1 /100 | #273 | Tragic 60.4% |
| Alaska Natives | 0.1 /100 | #274 | Tragic 60.4% |
| Immigrants from Barbados | 0.1 /100 | #275 | Tragic 60.4% |
| Arapaho | 0.1 /100 | #276 | Tragic 60.3% |
| Bahamians | 0.1 /100 | #277 | Tragic 60.3% |
Cheyenne College, Under 1 year Correlation Summary
| Measurement | Cheyenne Data | College, Under 1 year Data |
| Minimum | 0.026% | 15.3% |
| Maximum | 84.0% | 94.3% |
| Range | 83.9% | 79.1% |
| Mean | 20.1% | 54.1% |
| Median | 8.0% | 55.9% |
| Interquartile 25% (IQ1) | 3.5% | 47.3% |
| Interquartile 75% (IQ3) | 17.8% | 62.4% |
| Interquartile Range (IQR) | 14.3% | 15.0% |
| Standard Deviation (Sample) | 27.3% | 14.9% |
| Standard Deviation (Population) | 26.8% | 14.7% |
Correlation Details
| Cheyenne Percentile | Sample Size | College, Under 1 year |
[ 0.0% - 0.5% ] 0.026% | 79,658,074 | 63.8% |
[ 0.5% - 1.0% ] 0.58% | 519,390 | 56.0% |
[ 1.0% - 1.5% ] 1.00% | 369,167 | 62.3% |
[ 1.0% - 1.5% ] 1.44% | 50,624 | 61.3% |
[ 1.5% - 2.0% ] 1.87% | 43,194 | 54.0% |
[ 2.0% - 2.5% ] 2.27% | 15,566 | 48.7% |
[ 2.5% - 3.0% ] 2.64% | 6,297 | 50.9% |
[ 3.0% - 3.5% ] 3.18% | 10,264 | 57.5% |
[ 3.5% - 4.0% ] 3.51% | 7,493 | 47.3% |
[ 4.0% - 4.5% ] 4.09% | 8,702 | 54.6% |
[ 4.0% - 4.5% ] 4.44% | 2,611 | 41.0% |
[ 4.5% - 5.0% ] 4.73% | 3,593 | 55.9% |
[ 5.0% - 5.5% ] 5.45% | 220 | 84.0% |
[ 5.5% - 6.0% ] 5.70% | 2,651 | 35.1% |
[ 6.0% - 6.5% ] 6.06% | 297 | 62.9% |
[ 6.5% - 7.0% ] 6.92% | 1,603 | 42.7% |
[ 7.0% - 7.5% ] 7.26% | 1,680 | 57.2% |
[ 8.5% - 9.0% ] 8.70% | 92 | 55.9% |
[ 9.0% - 9.5% ] 9.00% | 100 | 94.3% |
[ 9.5% - 10.0% ] 9.58% | 4,654 | 65.5% |
[ 9.5% - 10.0% ] 9.72% | 1,132 | 35.1% |
[ 11.5% - 12.0% ] 11.56% | 173 | 59.9% |
[ 12.0% - 12.5% ] 12.12% | 1,692 | 67.0% |
[ 13.0% - 13.5% ] 13.18% | 387 | 27.6% |
[ 15.0% - 15.5% ] 15.35% | 391 | 37.2% |
[ 17.5% - 18.0% ] 17.83% | 129 | 36.5% |
[ 26.5% - 27.0% ] 26.58% | 1,125 | 58.5% |
[ 32.0% - 32.5% ] 32.06% | 783 | 56.4% |
[ 67.0% - 67.5% ] 67.20% | 2,064 | 54.1% |
[ 70.5% - 71.0% ] 70.81% | 966 | 62.9% |
[ 71.5% - 72.0% ] 71.99% | 3,038 | 52.3% |
[ 79.0% - 79.5% ] 79.32% | 474 | 62.6% |
[ 82.0% - 82.5% ] 82.26% | 124 | 15.3% |
[ 83.5% - 84.0% ] 83.96% | 661 | 62.4% |