Central American 2 or more Vehicles in Household
COMPARE
Central American
Select to Compare
2 or more Vehicles in Household
Central American 2 or more Vehicles in Household
54.7%
2+ VEHICLES AVAILABLE
23.0/ 100
METRIC RATING
194th/ 347
METRIC RANK
Central American 2 or more Vehicles in Household Correlation Chart
The statistical analysis conducted on geographies consisting of 504,126,351 people shows no correlation between the proportion of Central Americans and percentage of households with 2 or more vehicles available in the United States with a correlation coefficient (R) of -0.001 and weighted average of 54.7%. On average, for every 1% (one percent) increase in Central Americans within a typical geography, there is a decrease of 0.00037% in percentage of households with 2 or more vehicles available.
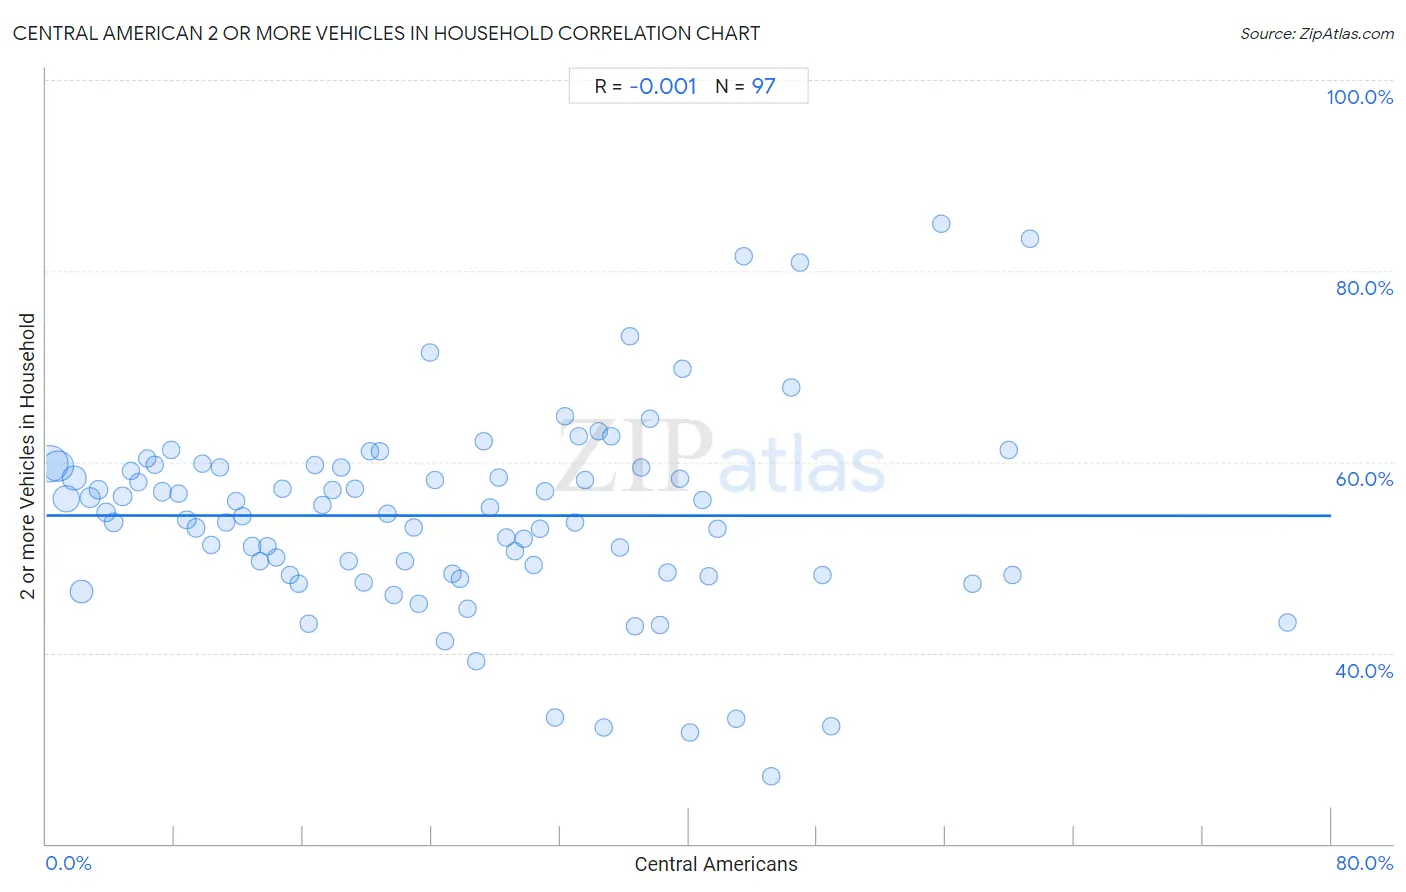
It is essential to understand that the correlation between the percentage of Central Americans and percentage of households with 2 or more vehicles available does not imply a direct cause-and-effect relationship. It remains uncertain whether the presence of Central Americans influences an upward or downward trend in the level of percentage of households with 2 or more vehicles available within an area, or if Central Americans simply ended up residing in those areas with higher or lower levels of percentage of households with 2 or more vehicles available due to other factors.
Demographics Similar to Central Americans by 2 or more Vehicles in Household
In terms of 2 or more vehicles in household, the demographic groups most similar to Central Americans are Immigrants from Japan (54.7%, a difference of 0.020%), Iroquois (54.7%, a difference of 0.030%), Immigrants from Romania (54.7%, a difference of 0.050%), Immigrants (54.7%, a difference of 0.11%), and Russian (54.8%, a difference of 0.18%).
| Demographics | Rating | Rank | 2 or more Vehicles in Household |
| Immigrants from Uganda | 33.4 /100 | #187 | Fair 55.0% |
| Marshallese | 30.5 /100 | #188 | Fair 54.9% |
| Eastern Europeans | 27.5 /100 | #189 | Fair 54.8% |
| Russians | 26.3 /100 | #190 | Fair 54.8% |
| Immigrants | 25.0 /100 | #191 | Fair 54.7% |
| Immigrants from Romania | 23.8 /100 | #192 | Fair 54.7% |
| Immigrants from Japan | 23.4 /100 | #193 | Fair 54.7% |
| Central Americans | 23.0 /100 | #194 | Fair 54.7% |
| Iroquois | 22.6 /100 | #195 | Fair 54.7% |
| Immigrants from Poland | 19.3 /100 | #196 | Poor 54.6% |
| Argentineans | 17.5 /100 | #197 | Poor 54.5% |
| Carpatho Rusyns | 16.2 /100 | #198 | Poor 54.4% |
| Immigrants from Norway | 15.9 /100 | #199 | Poor 54.4% |
| Houma | 15.8 /100 | #200 | Poor 54.4% |
| Immigrants from Italy | 15.5 /100 | #201 | Poor 54.4% |
Central American 2 or more Vehicles in Household Correlation Summary
| Measurement | Central American Data | 2 or more Vehicles in Household Data |
| Minimum | 0.24% | 27.0% |
| Maximum | 77.3% | 85.0% |
| Range | 77.1% | 58.0% |
| Mean | 25.3% | 54.4% |
| Median | 24.2% | 54.7% |
| Interquartile 25% (IQ1) | 12.0% | 48.2% |
| Interquartile 75% (IQ3) | 36.5% | 59.5% |
| Interquartile Range (IQR) | 24.5% | 11.3% |
| Standard Deviation (Sample) | 16.2% | 10.4% |
| Standard Deviation (Population) | 16.1% | 10.3% |
Correlation Details
| Central American Percentile | Sample Size | 2 or more Vehicles in Household |
[ 0.0% - 0.5% ] 0.24% | 145,557,209 | 59.9% |
[ 0.5% - 1.0% ] 0.73% | 100,044,164 | 59.6% |
[ 1.0% - 1.5% ] 1.24% | 67,746,808 | 56.1% |
[ 1.5% - 2.0% ] 1.74% | 40,965,436 | 58.3% |
[ 2.0% - 2.5% ] 2.21% | 34,530,862 | 46.4% |
[ 2.5% - 3.0% ] 2.75% | 18,037,954 | 56.3% |
[ 3.0% - 3.5% ] 3.25% | 13,500,386 | 57.1% |
[ 3.5% - 4.0% ] 3.74% | 10,909,206 | 54.7% |
[ 4.0% - 4.5% ] 4.20% | 11,925,702 | 53.7% |
[ 4.5% - 5.0% ] 4.77% | 7,848,057 | 56.4% |
[ 5.0% - 5.5% ] 5.26% | 5,379,251 | 59.0% |
[ 5.5% - 6.0% ] 5.74% | 5,809,982 | 57.9% |
[ 6.0% - 6.5% ] 6.27% | 3,669,243 | 60.3% |
[ 6.5% - 7.0% ] 6.76% | 3,879,662 | 59.7% |
[ 7.0% - 7.5% ] 7.25% | 2,755,665 | 56.9% |
[ 7.5% - 8.0% ] 7.76% | 1,922,237 | 61.2% |
[ 8.0% - 8.5% ] 8.21% | 2,111,857 | 56.7% |
[ 8.5% - 9.0% ] 8.74% | 1,802,501 | 54.0% |
[ 9.0% - 9.5% ] 9.33% | 3,986,733 | 53.1% |
[ 9.5% - 10.0% ] 9.73% | 1,158,609 | 59.8% |
[ 10.0% - 10.5% ] 10.29% | 945,476 | 51.3% |
[ 10.5% - 11.0% ] 10.78% | 1,217,849 | 59.4% |
[ 11.0% - 11.5% ] 11.23% | 805,328 | 53.6% |
[ 11.5% - 12.0% ] 11.80% | 1,080,881 | 55.9% |
[ 12.0% - 12.5% ] 12.25% | 646,731 | 54.3% |
[ 12.5% - 13.0% ] 12.84% | 4,756,321 | 51.1% |
[ 13.0% - 13.5% ] 13.27% | 806,284 | 49.5% |
[ 13.5% - 14.0% ] 13.79% | 826,697 | 51.1% |
[ 14.0% - 14.5% ] 14.31% | 889,846 | 49.9% |
[ 14.5% - 15.0% ] 14.73% | 447,173 | 57.2% |
[ 15.0% - 15.5% ] 15.17% | 402,899 | 48.2% |
[ 15.5% - 16.0% ] 15.73% | 447,291 | 47.3% |
[ 16.0% - 16.5% ] 16.33% | 836,848 | 43.1% |
[ 16.5% - 17.0% ] 16.74% | 538,043 | 59.7% |
[ 17.0% - 17.5% ] 17.16% | 387,140 | 55.5% |
[ 17.5% - 18.0% ] 17.84% | 298,102 | 57.0% |
[ 18.0% - 18.5% ] 18.37% | 53,977 | 59.5% |
[ 18.5% - 19.0% ] 18.84% | 669,010 | 49.6% |
[ 19.0% - 19.5% ] 19.23% | 110,663 | 57.2% |
[ 19.5% - 20.0% ] 19.76% | 248,266 | 47.4% |
[ 20.0% - 20.5% ] 20.14% | 208,675 | 61.1% |
[ 20.5% - 21.0% ] 20.76% | 171,165 | 61.1% |
[ 21.0% - 21.5% ] 21.28% | 255,562 | 54.6% |
[ 21.5% - 22.0% ] 21.63% | 107,458 | 46.1% |
[ 22.0% - 22.5% ] 22.31% | 75,746 | 49.6% |
[ 22.5% - 23.0% ] 22.87% | 187,299 | 53.1% |
[ 23.0% - 23.5% ] 23.19% | 142,767 | 45.1% |
[ 23.5% - 24.0% ] 23.85% | 13,092 | 71.5% |
[ 24.0% - 24.5% ] 24.18% | 183,890 | 58.1% |
[ 24.5% - 25.0% ] 24.80% | 180,568 | 41.2% |
[ 25.0% - 25.5% ] 25.27% | 121,053 | 48.2% |
[ 25.5% - 26.0% ] 25.77% | 250,986 | 47.8% |
[ 26.0% - 26.5% ] 26.24% | 222,979 | 44.7% |
[ 26.5% - 27.0% ] 26.79% | 258,344 | 39.1% |
[ 27.0% - 27.5% ] 27.26% | 18,330 | 62.1% |
[ 27.5% - 28.0% ] 27.62% | 152,945 | 55.2% |
[ 28.0% - 28.5% ] 28.21% | 47,338 | 58.3% |
[ 28.5% - 29.0% ] 28.67% | 57,519 | 52.1% |
[ 29.0% - 29.5% ] 29.17% | 107,395 | 50.7% |
[ 29.5% - 30.0% ] 29.76% | 115,067 | 52.0% |
[ 30.0% - 30.5% ] 30.32% | 124,191 | 49.2% |
[ 30.5% - 31.0% ] 30.77% | 207,899 | 53.0% |
[ 31.0% - 31.5% ] 31.04% | 98,190 | 56.9% |
[ 31.5% - 32.0% ] 31.64% | 62,846 | 33.3% |
[ 32.0% - 32.5% ] 32.32% | 138,223 | 64.8% |
[ 32.5% - 33.0% ] 32.90% | 24,660 | 53.7% |
[ 33.0% - 33.5% ] 33.17% | 77,314 | 62.7% |
[ 33.5% - 34.0% ] 33.56% | 33,122 | 58.1% |
[ 34.0% - 34.5% ] 34.38% | 10,639 | 63.2% |
[ 34.5% - 35.0% ] 34.73% | 59,607 | 32.1% |
[ 35.0% - 35.5% ] 35.20% | 9,444 | 62.7% |
[ 35.5% - 36.0% ] 35.69% | 33,018 | 51.0% |
[ 36.0% - 36.5% ] 36.32% | 1,473 | 73.1% |
[ 36.5% - 37.0% ] 36.65% | 96,220 | 42.7% |
[ 37.0% - 37.5% ] 37.05% | 19,289 | 59.4% |
[ 37.5% - 38.0% ] 37.61% | 10,563 | 64.6% |
[ 38.0% - 38.5% ] 38.18% | 2,664 | 42.9% |
[ 38.5% - 39.0% ] 38.65% | 39,220 | 48.4% |
[ 39.0% - 39.5% ] 39.46% | 25,324 | 58.2% |
[ 39.5% - 40.0% ] 39.65% | 7,945 | 69.8% |
[ 40.0% - 40.5% ] 40.10% | 17,564 | 31.6% |
[ 40.5% - 41.0% ] 40.86% | 15,109 | 56.0% |
[ 41.0% - 41.5% ] 41.21% | 18,695 | 48.0% |
[ 41.5% - 42.0% ] 41.78% | 2,025 | 52.9% |
[ 42.5% - 43.0% ] 42.92% | 212 | 33.1% |
[ 43.0% - 43.5% ] 43.43% | 175 | 81.6% |
[ 45.0% - 45.5% ] 45.12% | 79,765 | 27.0% |
[ 46.0% - 46.5% ] 46.36% | 2,118 | 67.8% |
[ 46.5% - 47.0% ] 46.92% | 211 | 80.9% |
[ 48.0% - 48.5% ] 48.35% | 182 | 48.1% |
[ 48.5% - 49.0% ] 48.89% | 180 | 32.4% |
[ 55.5% - 56.0% ] 55.70% | 149 | 85.0% |
[ 57.5% - 58.0% ] 57.69% | 182 | 47.2% |
[ 59.5% - 60.0% ] 59.89% | 1,112 | 61.2% |
[ 60.0% - 60.5% ] 60.18% | 50,387 | 48.2% |
[ 61.0% - 61.5% ] 61.24% | 129 | 83.3% |
[ 77.0% - 77.5% ] 77.31% | 21,778 | 43.2% |