Central American vs Immigrants from Somalia Wage/Income Gap
COMPARE
Central American
Immigrants from Somalia
Wage/Income Gap
Wage/Income Gap Comparison
Central Americans
Immigrants from Somalia
23.1%
WAGE/INCOME GAP
99.8/ 100
METRIC RATING
82nd/ 347
METRIC RANK
21.2%
WAGE/INCOME GAP
100.0/ 100
METRIC RATING
37th/ 347
METRIC RANK
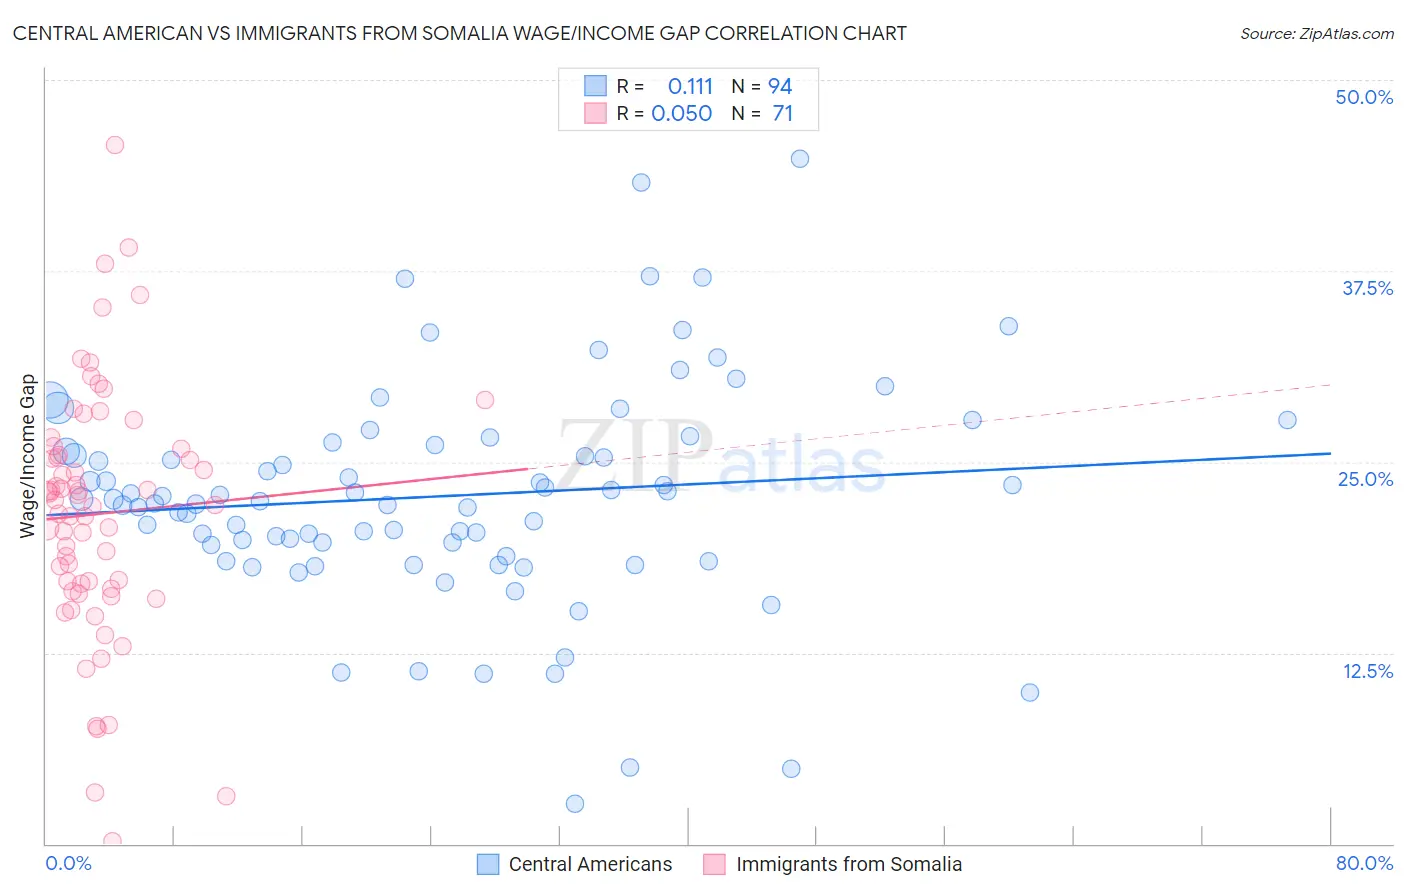
Central American vs Immigrants from Somalia Wage/Income Gap Correlation Chart
The statistical analysis conducted on geographies consisting of 503,863,449 people shows a poor positive correlation between the proportion of Central Americans and wage/income gap percentage in the United States with a correlation coefficient (R) of 0.111 and weighted average of 23.1%. Similarly, the statistical analysis conducted on geographies consisting of 92,095,099 people shows a slight positive correlation between the proportion of Immigrants from Somalia and wage/income gap percentage in the United States with a correlation coefficient (R) of 0.050 and weighted average of 21.2%, a difference of 8.7%.
Wage/Income Gap Correlation Summary
| Measurement | Central American | Immigrants from Somalia |
| Minimum | 2.7% | 0.17% |
| Maximum | 44.8% | 45.8% |
| Range | 42.2% | 45.6% |
| Mean | 22.7% | 21.6% |
| Median | 22.5% | 22.2% |
| Interquartile 25% (IQ1) | 19.5% | 16.7% |
| Interquartile 75% (IQ3) | 26.1% | 25.9% |
| Interquartile Range (IQR) | 6.6% | 9.2% |
| Standard Deviation (Sample) | 7.2% | 8.3% |
| Standard Deviation (Population) | 7.2% | 8.2% |
Similar Demographics by Wage/Income Gap
Demographics Similar to Central Americans by Wage/Income Gap
In terms of wage/income gap, the demographic groups most similar to Central Americans are Bermudan (23.1%, a difference of 0.0%), Immigrants from Africa (23.2%, a difference of 0.29%), Salvadoran (23.0%, a difference of 0.47%), Immigrants from Nicaragua (23.0%, a difference of 0.54%), and Nigerian (23.0%, a difference of 0.62%).
| Demographics | Rating | Rank | Wage/Income Gap |
| Fijians | 99.9 /100 | #75 | Exceptional 22.9% |
| Ecuadorians | 99.9 /100 | #76 | Exceptional 22.9% |
| Africans | 99.9 /100 | #77 | Exceptional 22.9% |
| Nigerians | 99.9 /100 | #78 | Exceptional 23.0% |
| Immigrants | Nicaragua | 99.9 /100 | #79 | Exceptional 23.0% |
| Salvadorans | 99.9 /100 | #80 | Exceptional 23.0% |
| Bermudans | 99.8 /100 | #81 | Exceptional 23.1% |
| Central Americans | 99.8 /100 | #82 | Exceptional 23.1% |
| Immigrants | Africa | 99.8 /100 | #83 | Exceptional 23.2% |
| Cubans | 99.7 /100 | #84 | Exceptional 23.3% |
| Immigrants | Cambodia | 99.7 /100 | #85 | Exceptional 23.3% |
| Cheyenne | 99.7 /100 | #86 | Exceptional 23.3% |
| Yuman | 99.7 /100 | #87 | Exceptional 23.3% |
| Immigrants | Panama | 99.6 /100 | #88 | Exceptional 23.4% |
| Marshallese | 99.6 /100 | #89 | Exceptional 23.4% |
Demographics Similar to Immigrants from Somalia by Wage/Income Gap
In terms of wage/income gap, the demographic groups most similar to Immigrants from Somalia are Immigrants from Belize (21.3%, a difference of 0.050%), Belizean (21.2%, a difference of 0.070%), Somali (21.2%, a difference of 0.090%), Colville (21.3%, a difference of 0.16%), and Lumbee (21.3%, a difference of 0.36%).
| Demographics | Rating | Rank | Wage/Income Gap |
| Immigrants | Bangladesh | 100.0 /100 | #30 | Exceptional 20.9% |
| Vietnamese | 100.0 /100 | #31 | Exceptional 21.0% |
| Immigrants | Yemen | 100.0 /100 | #32 | Exceptional 21.1% |
| Immigrants | Bahamas | 100.0 /100 | #33 | Exceptional 21.1% |
| Pima | 100.0 /100 | #34 | Exceptional 21.1% |
| Somalis | 100.0 /100 | #35 | Exceptional 21.2% |
| Belizeans | 100.0 /100 | #36 | Exceptional 21.2% |
| Immigrants | Somalia | 100.0 /100 | #37 | Exceptional 21.2% |
| Immigrants | Belize | 100.0 /100 | #38 | Exceptional 21.3% |
| Colville | 100.0 /100 | #39 | Exceptional 21.3% |
| Lumbee | 100.0 /100 | #40 | Exceptional 21.3% |
| Liberians | 100.0 /100 | #41 | Exceptional 21.4% |
| Immigrants | Sierra Leone | 100.0 /100 | #42 | Exceptional 21.4% |
| Sierra Leoneans | 100.0 /100 | #43 | Exceptional 21.4% |
| Immigrants | Eritrea | 100.0 /100 | #44 | Exceptional 21.4% |