Central American Self-Care Disability
COMPARE
Central American
Select to Compare
Self-Care Disability
Central American Self-Care Disability
2.5%
SELF-CARE DISABILITY
8.7/ 100
METRIC RATING
208th/ 347
METRIC RANK
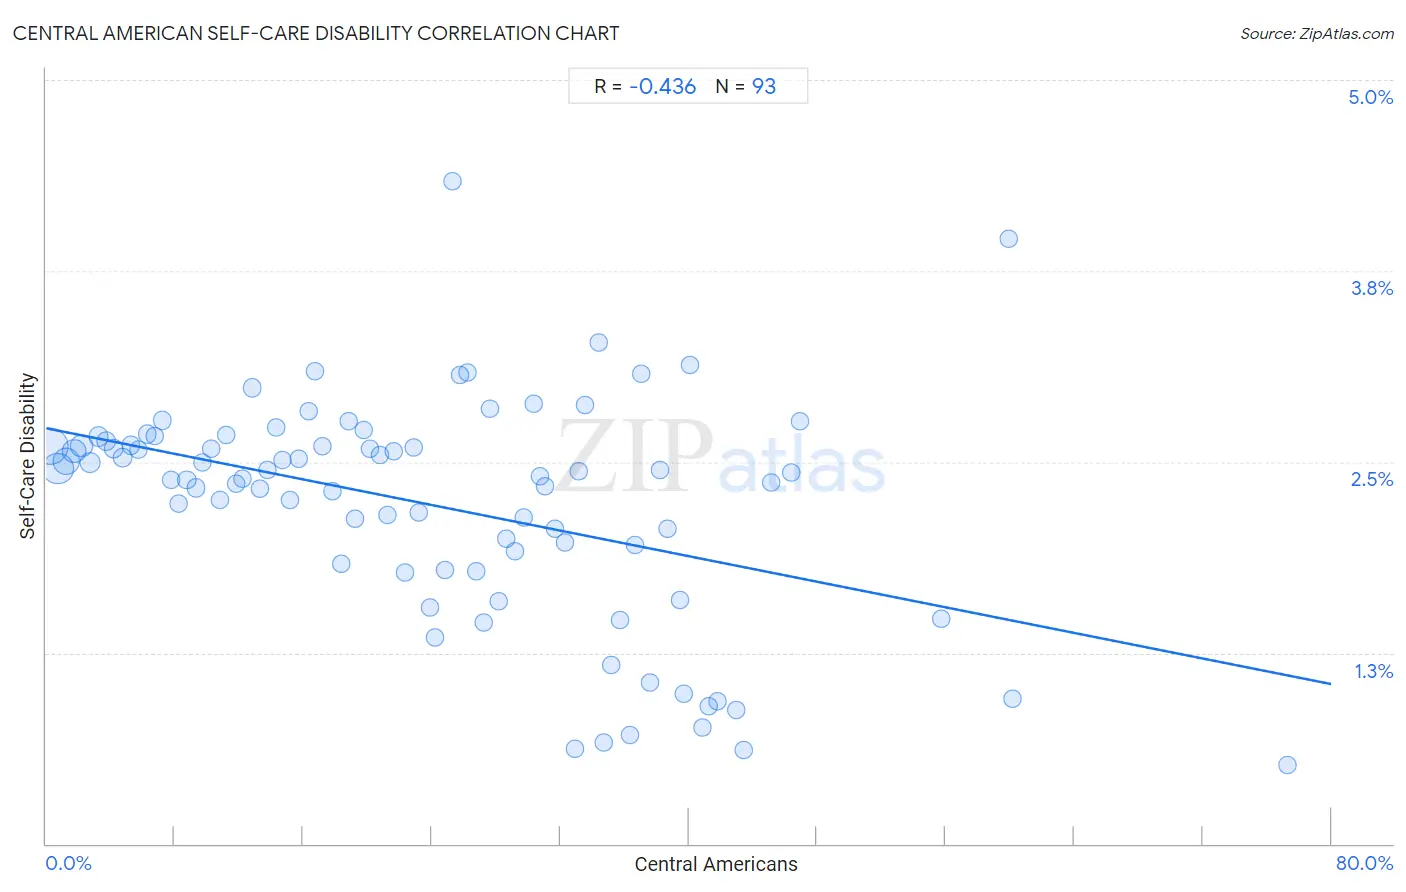
Central American Self-Care Disability Correlation Chart
The statistical analysis conducted on geographies consisting of 503,524,295 people shows a moderate negative correlation between the proportion of Central Americans and percentage of population with self-care disability in the United States with a correlation coefficient (R) of -0.436 and weighted average of 2.5%. On average, for every 1% (one percent) increase in Central Americans within a typical geography, there is a decrease of 0.021% in percentage of population with self-care disability.
It is essential to understand that the correlation between the percentage of Central Americans and percentage of population with self-care disability does not imply a direct cause-and-effect relationship. It remains uncertain whether the presence of Central Americans influences an upward or downward trend in the level of percentage of population with self-care disability within an area, or if Central Americans simply ended up residing in those areas with higher or lower levels of percentage of population with self-care disability due to other factors.
Demographics Similar to Central Americans by Self-Care Disability
In terms of self-care disability, the demographic groups most similar to Central Americans are Malaysian (2.5%, a difference of 0.15%), French (2.5%, a difference of 0.16%), Alaskan Athabascan (2.5%, a difference of 0.23%), Immigrants from Russia (2.5%, a difference of 0.31%), and Panamanian (2.5%, a difference of 0.38%).
| Demographics | Rating | Rank | Self-Care Disability |
| Immigrants from South Eastern Asia | 12.9 /100 | #201 | Poor 2.5% |
| Slovaks | 12.6 /100 | #202 | Poor 2.5% |
| Immigrants from Lebanon | 12.4 /100 | #203 | Poor 2.5% |
| Immigrants from Bahamas | 11.9 /100 | #204 | Poor 2.5% |
| Immigrants from Russia | 11.0 /100 | #205 | Poor 2.5% |
| Alaskan Athabascans | 10.4 /100 | #206 | Poor 2.5% |
| French | 9.9 /100 | #207 | Tragic 2.5% |
| Central Americans | 8.7 /100 | #208 | Tragic 2.5% |
| Malaysians | 7.7 /100 | #209 | Tragic 2.5% |
| Panamanians | 6.4 /100 | #210 | Tragic 2.5% |
| Native Hawaiians | 5.1 /100 | #211 | Tragic 2.6% |
| Samoans | 5.1 /100 | #212 | Tragic 2.6% |
| Ecuadorians | 4.7 /100 | #213 | Tragic 2.6% |
| Immigrants from Honduras | 4.7 /100 | #214 | Tragic 2.6% |
| Immigrants from Thailand | 4.5 /100 | #215 | Tragic 2.6% |
Central American Self-Care Disability Correlation Summary
| Measurement | Central American Data | Self-Care Disability Data |
| Minimum | 0.24% | 0.52% |
| Maximum | 77.3% | 4.3% |
| Range | 77.1% | 3.8% |
| Mean | 24.1% | 2.2% |
| Median | 23.2% | 2.4% |
| Interquartile 25% (IQ1) | 11.5% | 1.8% |
| Interquartile 75% (IQ3) | 35.0% | 2.6% |
| Interquartile Range (IQR) | 23.5% | 0.81% |
| Standard Deviation (Sample) | 15.4% | 0.74% |
| Standard Deviation (Population) | 15.3% | 0.73% |
Correlation Details
| Central American Percentile | Sample Size | Self-Care Disability |
[ 0.0% - 0.5% ] 0.24% | 145,399,601 | 2.6% |
[ 0.5% - 1.0% ] 0.73% | 99,968,930 | 2.5% |
[ 1.0% - 1.5% ] 1.24% | 67,663,317 | 2.5% |
[ 1.5% - 2.0% ] 1.74% | 40,924,262 | 2.6% |
[ 2.0% - 2.5% ] 2.21% | 34,482,055 | 2.6% |
[ 2.5% - 3.0% ] 2.75% | 18,005,494 | 2.5% |
[ 3.0% - 3.5% ] 3.25% | 13,494,032 | 2.7% |
[ 3.5% - 4.0% ] 3.74% | 10,902,944 | 2.6% |
[ 4.0% - 4.5% ] 4.20% | 11,917,801 | 2.6% |
[ 4.5% - 5.0% ] 4.77% | 7,832,914 | 2.5% |
[ 5.0% - 5.5% ] 5.26% | 5,367,871 | 2.6% |
[ 5.5% - 6.0% ] 5.74% | 5,786,021 | 2.6% |
[ 6.0% - 6.5% ] 6.27% | 3,663,065 | 2.7% |
[ 6.5% - 7.0% ] 6.76% | 3,871,378 | 2.7% |
[ 7.0% - 7.5% ] 7.25% | 2,752,303 | 2.8% |
[ 7.5% - 8.0% ] 7.76% | 1,919,773 | 2.4% |
[ 8.0% - 8.5% ] 8.21% | 2,102,602 | 2.2% |
[ 8.5% - 9.0% ] 8.74% | 1,796,473 | 2.4% |
[ 9.0% - 9.5% ] 9.33% | 3,983,988 | 2.3% |
[ 9.5% - 10.0% ] 9.73% | 1,152,429 | 2.5% |
[ 10.0% - 10.5% ] 10.28% | 942,560 | 2.6% |
[ 10.5% - 11.0% ] 10.78% | 1,216,599 | 2.2% |
[ 11.0% - 11.5% ] 11.22% | 795,511 | 2.7% |
[ 11.5% - 12.0% ] 11.80% | 1,079,831 | 2.4% |
[ 12.0% - 12.5% ] 12.25% | 646,731 | 2.4% |
[ 12.5% - 13.0% ] 12.84% | 4,755,839 | 3.0% |
[ 13.0% - 13.5% ] 13.27% | 803,955 | 2.3% |
[ 13.5% - 14.0% ] 13.79% | 823,640 | 2.4% |
[ 14.0% - 14.5% ] 14.31% | 889,742 | 2.7% |
[ 14.5% - 15.0% ] 14.73% | 444,566 | 2.5% |
[ 15.0% - 15.5% ] 15.17% | 402,404 | 2.3% |
[ 15.5% - 16.0% ] 15.73% | 447,099 | 2.5% |
[ 16.0% - 16.5% ] 16.33% | 835,668 | 2.8% |
[ 16.5% - 17.0% ] 16.74% | 538,043 | 3.1% |
[ 17.0% - 17.5% ] 17.16% | 386,141 | 2.6% |
[ 17.5% - 18.0% ] 17.84% | 296,850 | 2.3% |
[ 18.0% - 18.5% ] 18.37% | 53,802 | 1.8% |
[ 18.5% - 19.0% ] 18.84% | 669,010 | 2.8% |
[ 19.0% - 19.5% ] 19.23% | 109,288 | 2.1% |
[ 19.5% - 20.0% ] 19.76% | 247,343 | 2.7% |
[ 20.0% - 20.5% ] 20.14% | 206,432 | 2.6% |
[ 20.5% - 21.0% ] 20.76% | 170,564 | 2.5% |
[ 21.0% - 21.5% ] 21.28% | 255,562 | 2.2% |
[ 21.5% - 22.0% ] 21.63% | 106,899 | 2.6% |
[ 22.0% - 22.5% ] 22.31% | 75,746 | 1.8% |
[ 22.5% - 23.0% ] 22.87% | 185,685 | 2.6% |
[ 23.0% - 23.5% ] 23.19% | 141,865 | 2.2% |
[ 23.5% - 24.0% ] 23.86% | 12,949 | 1.5% |
[ 24.0% - 24.5% ] 24.18% | 183,807 | 1.4% |
[ 24.5% - 25.0% ] 24.80% | 179,201 | 1.8% |
[ 25.0% - 25.5% ] 25.27% | 120,749 | 4.3% |
[ 25.5% - 26.0% ] 25.77% | 250,936 | 3.1% |
[ 26.0% - 26.5% ] 26.24% | 222,979 | 3.1% |
[ 26.5% - 27.0% ] 26.79% | 258,344 | 1.8% |
[ 27.0% - 27.5% ] 27.26% | 15,691 | 1.5% |
[ 27.5% - 28.0% ] 27.62% | 152,945 | 2.8% |
[ 28.0% - 28.5% ] 28.21% | 47,274 | 1.6% |
[ 28.5% - 29.0% ] 28.67% | 57,519 | 2.0% |
[ 29.0% - 29.5% ] 29.17% | 107,395 | 1.9% |
[ 29.5% - 30.0% ] 29.76% | 115,067 | 2.1% |
[ 30.0% - 30.5% ] 30.32% | 123,795 | 2.9% |
[ 30.5% - 31.0% ] 30.77% | 207,269 | 2.4% |
[ 31.0% - 31.5% ] 31.04% | 97,556 | 2.3% |
[ 31.5% - 32.0% ] 31.64% | 62,846 | 2.1% |
[ 32.0% - 32.5% ] 32.32% | 138,223 | 2.0% |
[ 32.5% - 33.0% ] 32.90% | 22,966 | 0.62% |
[ 33.0% - 33.5% ] 33.17% | 77,314 | 2.4% |
[ 33.5% - 34.0% ] 33.56% | 33,122 | 2.9% |
[ 34.0% - 34.5% ] 34.38% | 10,639 | 3.3% |
[ 34.5% - 35.0% ] 34.73% | 59,607 | 0.67% |
[ 35.0% - 35.5% ] 35.20% | 9,444 | 1.2% |
[ 35.5% - 36.0% ] 35.69% | 33,018 | 1.5% |
[ 36.0% - 36.5% ] 36.32% | 1,473 | 0.71% |
[ 36.5% - 37.0% ] 36.65% | 95,589 | 2.0% |
[ 37.0% - 37.5% ] 37.05% | 19,289 | 3.1% |
[ 37.5% - 38.0% ] 37.61% | 10,563 | 1.1% |
[ 38.0% - 38.5% ] 38.18% | 2,664 | 2.5% |
[ 38.5% - 39.0% ] 38.65% | 39,220 | 2.1% |
[ 39.0% - 39.5% ] 39.46% | 25,324 | 1.6% |
[ 39.5% - 40.0% ] 39.65% | 5,949 | 0.98% |
[ 40.0% - 40.5% ] 40.10% | 17,564 | 3.1% |
[ 40.5% - 41.0% ] 40.86% | 15,109 | 0.76% |
[ 41.0% - 41.5% ] 41.21% | 18,695 | 0.90% |
[ 41.5% - 42.0% ] 41.78% | 1,764 | 0.93% |
[ 42.5% - 43.0% ] 42.98% | 114 | 0.88% |
[ 43.0% - 43.5% ] 43.43% | 175 | 0.62% |
[ 45.0% - 45.5% ] 45.12% | 79,765 | 2.4% |
[ 46.0% - 46.5% ] 46.36% | 2,118 | 2.4% |
[ 46.5% - 47.0% ] 46.92% | 211 | 2.8% |
[ 55.5% - 56.0% ] 55.70% | 149 | 1.5% |
[ 59.5% - 60.0% ] 59.89% | 1,112 | 4.0% |
[ 60.0% - 60.5% ] 60.18% | 50,387 | 0.95% |
[ 77.0% - 77.5% ] 77.31% | 21,778 | 0.52% |