Cape Verdean College, Under 1 year
COMPARE
Cape Verdean
Select to Compare
College, Under 1 year
Cape Verdean College, Under 1 year
56.0%
COLLEGE, UNDER 1 YEAR
0.0/ 100
METRIC RATING
328th/ 347
METRIC RANK
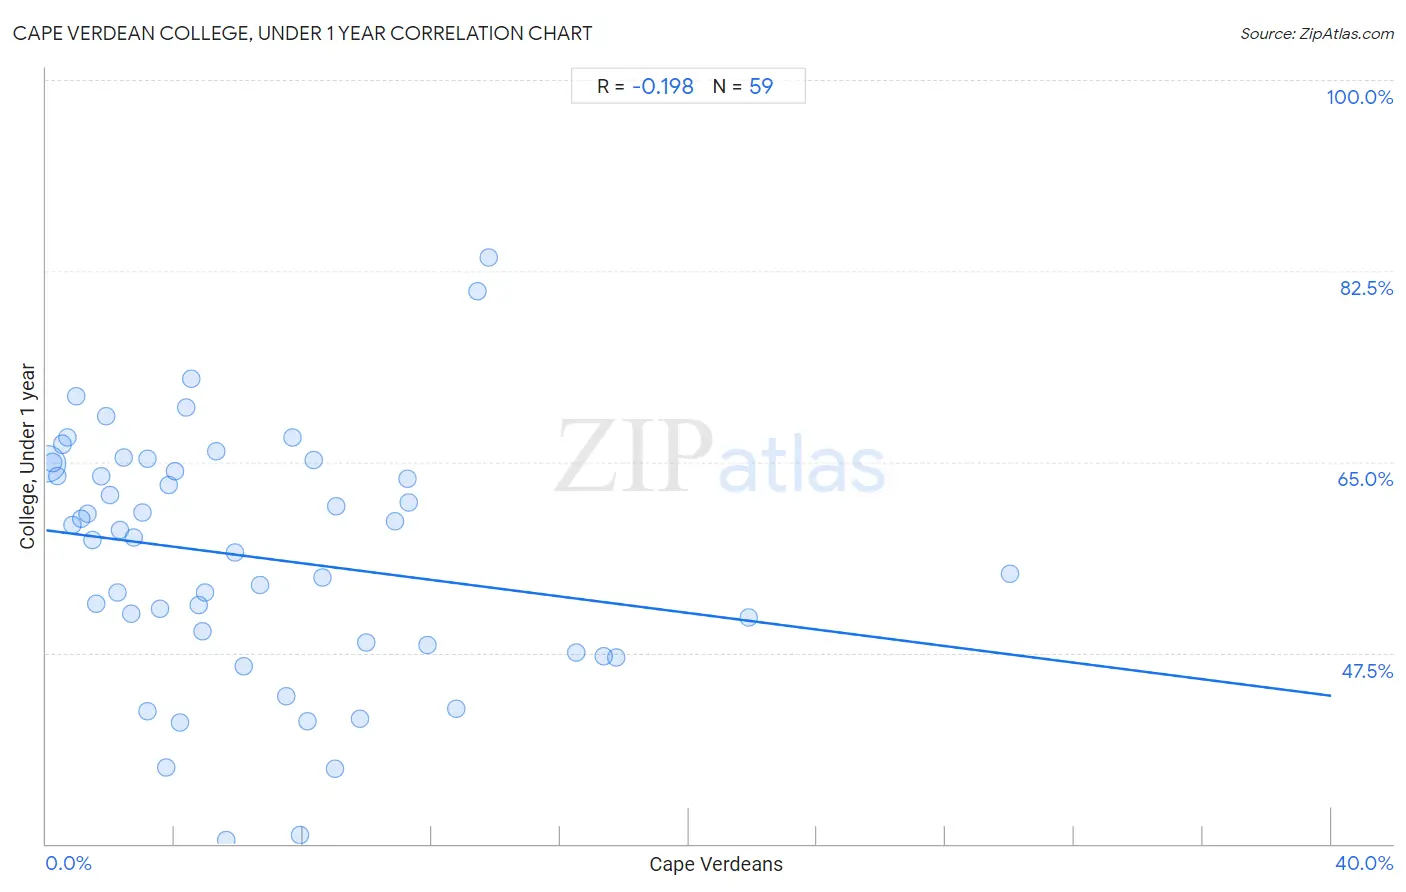
Cape Verdean College, Under 1 year Correlation Chart
The statistical analysis conducted on geographies consisting of 107,580,652 people shows a poor negative correlation between the proportion of Cape Verdeans and percentage of population with at least college, under 1 year education in the United States with a correlation coefficient (R) of -0.198 and weighted average of 56.0%. On average, for every 1% (one percent) increase in Cape Verdeans within a typical geography, there is a decrease of 0.38% in percentage of population with at least college, under 1 year education.
It is essential to understand that the correlation between the percentage of Cape Verdeans and percentage of population with at least college, under 1 year education does not imply a direct cause-and-effect relationship. It remains uncertain whether the presence of Cape Verdeans influences an upward or downward trend in the level of percentage of population with at least college, under 1 year education within an area, or if Cape Verdeans simply ended up residing in those areas with higher or lower levels of percentage of population with at least college, under 1 year education due to other factors.
Demographics Similar to Cape Verdeans by College, Under 1 year
In terms of college, under 1 year, the demographic groups most similar to Cape Verdeans are Immigrants from Guatemala (56.2%, a difference of 0.29%), Navajo (56.3%, a difference of 0.38%), Immigrants from Latin America (56.3%, a difference of 0.53%), Immigrants from Cuba (55.7%, a difference of 0.62%), and Immigrants from El Salvador (56.4%, a difference of 0.63%).
| Demographics | Rating | Rank | College, Under 1 year |
| Natives/Alaskans | 0.0 /100 | #321 | Tragic 56.6% |
| Immigrants from Caribbean | 0.0 /100 | #322 | Tragic 56.6% |
| Immigrants from Honduras | 0.0 /100 | #323 | Tragic 56.5% |
| Immigrants from El Salvador | 0.0 /100 | #324 | Tragic 56.4% |
| Immigrants from Latin America | 0.0 /100 | #325 | Tragic 56.3% |
| Navajo | 0.0 /100 | #326 | Tragic 56.3% |
| Immigrants from Guatemala | 0.0 /100 | #327 | Tragic 56.2% |
| Cape Verdeans | 0.0 /100 | #328 | Tragic 56.0% |
| Immigrants from Cuba | 0.0 /100 | #329 | Tragic 55.7% |
| Mexicans | 0.0 /100 | #330 | Tragic 55.6% |
| Dominicans | 0.0 /100 | #331 | Tragic 55.5% |
| Immigrants from Yemen | 0.0 /100 | #332 | Tragic 55.3% |
| Yuman | 0.0 /100 | #333 | Tragic 55.1% |
| Immigrants from the Azores | 0.0 /100 | #334 | Tragic 54.7% |
| Inupiat | 0.0 /100 | #335 | Tragic 54.6% |
Cape Verdean College, Under 1 year Correlation Summary
| Measurement | Cape Verdean Data | College, Under 1 year Data |
| Minimum | 0.026% | 30.4% |
| Maximum | 30.0% | 83.7% |
| Range | 30.0% | 53.4% |
| Mean | 6.5% | 56.3% |
| Median | 4.7% | 58.0% |
| Interquartile 25% (IQ1) | 2.2% | 48.2% |
| Interquartile 75% (IQ3) | 9.0% | 64.8% |
| Interquartile Range (IQR) | 6.8% | 16.6% |
| Standard Deviation (Sample) | 5.9% | 11.3% |
| Standard Deviation (Population) | 5.8% | 11.2% |
Correlation Details
| Cape Verdean Percentile | Sample Size | College, Under 1 year |
[ 0.0% - 0.5% ] 0.026% | 93,902,174 | 64.8% |
[ 0.0% - 0.5% ] 0.21% | 5,700,138 | 64.9% |
[ 0.0% - 0.5% ] 0.35% | 2,099,284 | 63.7% |
[ 0.5% - 1.0% ] 0.52% | 1,165,041 | 66.6% |
[ 0.5% - 1.0% ] 0.67% | 703,616 | 67.2% |
[ 0.5% - 1.0% ] 0.82% | 465,586 | 59.2% |
[ 0.5% - 1.0% ] 0.93% | 120,561 | 71.0% |
[ 1.0% - 1.5% ] 1.11% | 281,636 | 59.8% |
[ 1.0% - 1.5% ] 1.28% | 285,083 | 60.3% |
[ 1.0% - 1.5% ] 1.45% | 353,017 | 57.9% |
[ 1.5% - 2.0% ] 1.56% | 107,323 | 52.0% |
[ 1.5% - 2.0% ] 1.72% | 159,156 | 63.7% |
[ 1.5% - 2.0% ] 1.88% | 775,156 | 69.2% |
[ 1.5% - 2.0% ] 2.00% | 61,946 | 62.0% |
[ 2.0% - 2.5% ] 2.20% | 37,789 | 53.0% |
[ 2.0% - 2.5% ] 2.30% | 23,879 | 58.7% |
[ 2.0% - 2.5% ] 2.42% | 11,509 | 65.4% |
[ 2.5% - 3.0% ] 2.66% | 128,771 | 51.1% |
[ 2.5% - 3.0% ] 2.71% | 31,214 | 58.0% |
[ 2.5% - 3.0% ] 2.98% | 59,378 | 60.3% |
[ 3.0% - 3.5% ] 3.14% | 52,431 | 65.3% |
[ 3.0% - 3.5% ] 3.15% | 4,660 | 42.1% |
[ 3.5% - 4.0% ] 3.53% | 26,472 | 51.5% |
[ 3.5% - 4.0% ] 3.73% | 17,164 | 36.9% |
[ 3.5% - 4.0% ] 3.82% | 46,858 | 62.9% |
[ 4.0% - 4.5% ] 4.02% | 8,303 | 64.1% |
[ 4.0% - 4.5% ] 4.18% | 19,604 | 41.2% |
[ 4.0% - 4.5% ] 4.34% | 7,690 | 69.9% |
[ 4.5% - 5.0% ] 4.52% | 13,092 | 72.6% |
[ 4.5% - 5.0% ] 4.73% | 63,899 | 51.9% |
[ 4.5% - 5.0% ] 4.88% | 51,915 | 49.5% |
[ 4.5% - 5.0% ] 4.96% | 26,821 | 53.1% |
[ 5.0% - 5.5% ] 5.28% | 6,802 | 66.0% |
[ 5.5% - 6.0% ] 5.59% | 44,718 | 30.4% |
[ 5.5% - 6.0% ] 5.88% | 55,336 | 56.7% |
[ 6.0% - 6.5% ] 6.16% | 25,084 | 46.2% |
[ 6.5% - 7.0% ] 6.64% | 32,969 | 53.7% |
[ 7.0% - 7.5% ] 7.47% | 4,406 | 43.6% |
[ 7.5% - 8.0% ] 7.67% | 5,305 | 67.2% |
[ 7.5% - 8.0% ] 7.90% | 16,286 | 30.8% |
[ 8.0% - 8.5% ] 8.15% | 12,599 | 41.3% |
[ 8.0% - 8.5% ] 8.34% | 5,074 | 65.2% |
[ 8.5% - 9.0% ] 8.60% | 24,705 | 54.4% |
[ 8.5% - 9.0% ] 8.98% | 2,605 | 36.9% |
[ 9.0% - 9.5% ] 9.02% | 31,903 | 60.9% |
[ 9.5% - 10.0% ] 9.75% | 100,620 | 41.4% |
[ 9.5% - 10.0% ] 9.94% | 75,658 | 48.5% |
[ 10.5% - 11.0% ] 10.85% | 10,530 | 59.6% |
[ 11.0% - 11.5% ] 11.25% | 3,468 | 63.4% |
[ 11.0% - 11.5% ] 11.29% | 62 | 61.3% |
[ 11.5% - 12.0% ] 11.86% | 47,677 | 48.2% |
[ 12.5% - 13.0% ] 12.76% | 46,623 | 42.4% |
[ 13.0% - 13.5% ] 13.43% | 3,024 | 80.6% |
[ 13.5% - 14.0% ] 13.77% | 1,460 | 83.7% |
[ 16.5% - 17.0% ] 16.51% | 35,488 | 47.5% |
[ 17.0% - 17.5% ] 17.34% | 104,713 | 47.2% |
[ 17.5% - 18.0% ] 17.76% | 69,225 | 47.1% |
[ 21.5% - 22.0% ] 21.87% | 1,820 | 50.7% |
[ 30.0% - 30.5% ] 30.02% | 1,326 | 54.7% |