Cape Verdean vs Delaware Wage/Income Gap
COMPARE
Cape Verdean
Delaware
Wage/Income Gap
Wage/Income Gap Comparison
Cape Verdeans
Delaware
23.6%
WAGE/INCOME GAP
99.4/ 100
METRIC RATING
95th/ 347
METRIC RANK
26.3%
WAGE/INCOME GAP
20.9/ 100
METRIC RATING
200th/ 347
METRIC RANK
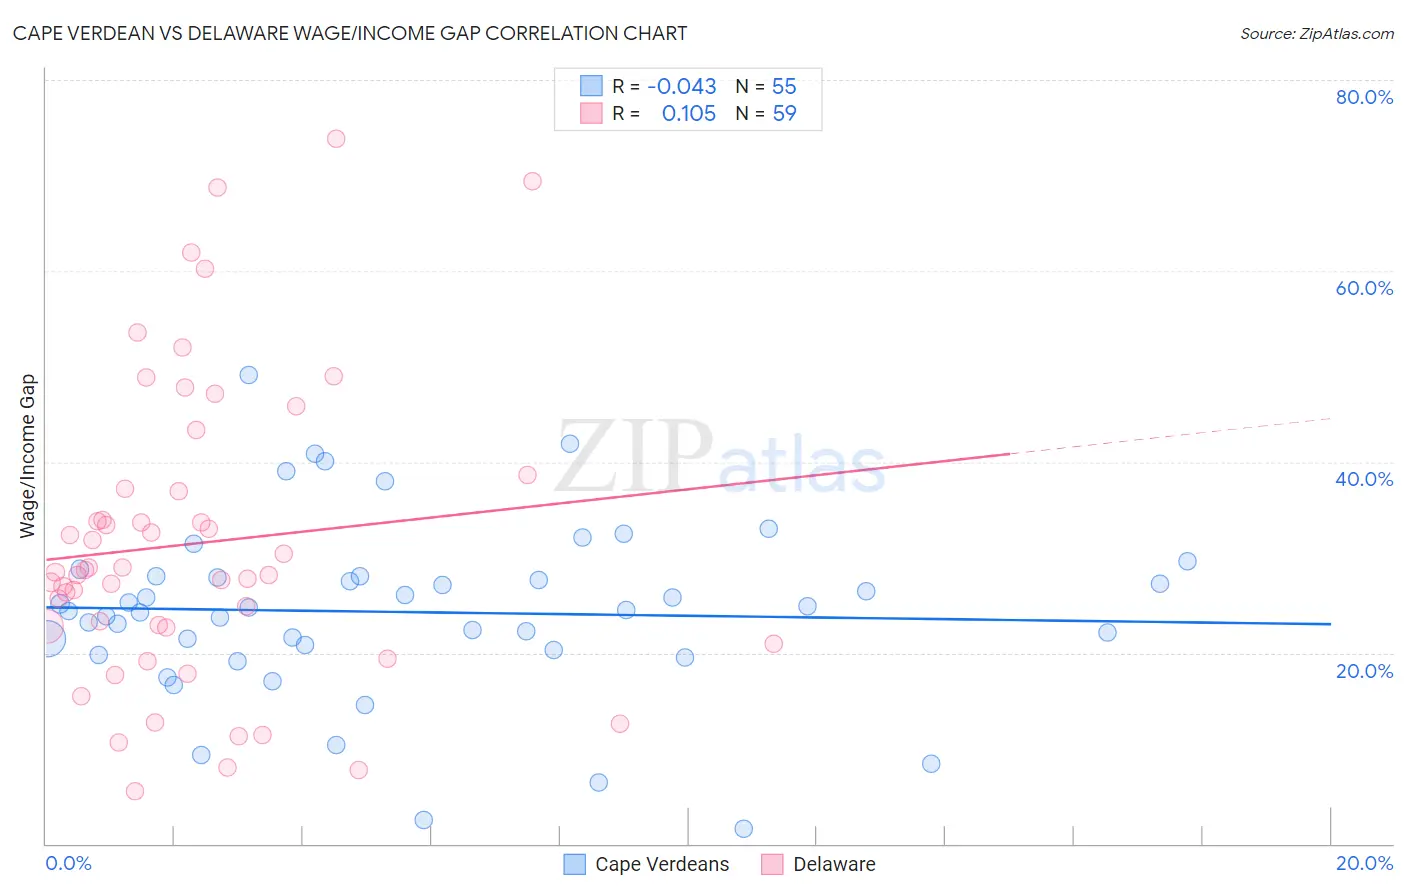
Cape Verdean vs Delaware Wage/Income Gap Correlation Chart
The statistical analysis conducted on geographies consisting of 107,547,548 people shows no correlation between the proportion of Cape Verdeans and wage/income gap percentage in the United States with a correlation coefficient (R) of -0.043 and weighted average of 23.6%. Similarly, the statistical analysis conducted on geographies consisting of 96,192,604 people shows a poor positive correlation between the proportion of Delaware and wage/income gap percentage in the United States with a correlation coefficient (R) of 0.105 and weighted average of 26.3%, a difference of 11.6%.
Wage/Income Gap Correlation Summary
| Measurement | Cape Verdean | Delaware |
| Minimum | 1.5% | 5.5% |
| Maximum | 49.0% | 73.9% |
| Range | 47.5% | 68.4% |
| Mean | 24.3% | 31.5% |
| Median | 24.5% | 28.4% |
| Interquartile 25% (IQ1) | 20.3% | 22.7% |
| Interquartile 75% (IQ3) | 28.0% | 37.2% |
| Interquartile Range (IQR) | 7.6% | 14.5% |
| Standard Deviation (Sample) | 9.2% | 15.7% |
| Standard Deviation (Population) | 9.2% | 15.5% |
Similar Demographics by Wage/Income Gap
Demographics Similar to Cape Verdeans by Wage/Income Gap
In terms of wage/income gap, the demographic groups most similar to Cape Verdeans are Honduran (23.6%, a difference of 0.030%), Immigrants from Cabo Verde (23.6%, a difference of 0.12%), Kiowa (23.6%, a difference of 0.12%), Immigrants from Sudan (23.6%, a difference of 0.21%), and Immigrants from Honduras (23.5%, a difference of 0.36%).
| Demographics | Rating | Rank | Wage/Income Gap |
| Immigrants | Panama | 99.6 /100 | #88 | Exceptional 23.4% |
| Marshallese | 99.6 /100 | #89 | Exceptional 23.4% |
| Nicaraguans | 99.6 /100 | #90 | Exceptional 23.4% |
| Arapaho | 99.6 /100 | #91 | Exceptional 23.5% |
| Immigrants | Honduras | 99.5 /100 | #92 | Exceptional 23.5% |
| Immigrants | Cabo Verde | 99.5 /100 | #93 | Exceptional 23.6% |
| Hondurans | 99.5 /100 | #94 | Exceptional 23.6% |
| Cape Verdeans | 99.4 /100 | #95 | Exceptional 23.6% |
| Kiowa | 99.4 /100 | #96 | Exceptional 23.6% |
| Immigrants | Sudan | 99.4 /100 | #97 | Exceptional 23.6% |
| Immigrants | Latin America | 99.2 /100 | #98 | Exceptional 23.7% |
| Aleuts | 99.2 /100 | #99 | Exceptional 23.7% |
| Yakama | 99.2 /100 | #100 | Exceptional 23.7% |
| Japanese | 99.1 /100 | #101 | Exceptional 23.8% |
| Immigrants | Laos | 99.0 /100 | #102 | Exceptional 23.8% |
Demographics Similar to Delaware by Wage/Income Gap
In terms of wage/income gap, the demographic groups most similar to Delaware are Dutch West Indian (26.3%, a difference of 0.010%), Venezuelan (26.3%, a difference of 0.050%), Zimbabwean (26.3%, a difference of 0.070%), Immigrants from Western Asia (26.3%, a difference of 0.080%), and Immigrants from Malaysia (26.3%, a difference of 0.12%).
| Demographics | Rating | Rank | Wage/Income Gap |
| Immigrants | Jordan | 22.4 /100 | #193 | Fair 26.3% |
| Chileans | 22.3 /100 | #194 | Fair 26.3% |
| Immigrants | Malaysia | 22.2 /100 | #195 | Fair 26.3% |
| Immigrants | Western Asia | 21.7 /100 | #196 | Fair 26.3% |
| Zimbabweans | 21.6 /100 | #197 | Fair 26.3% |
| Venezuelans | 21.5 /100 | #198 | Fair 26.3% |
| Dutch West Indians | 21.0 /100 | #199 | Fair 26.3% |
| Delaware | 20.9 /100 | #200 | Fair 26.3% |
| Immigrants | Syria | 19.3 /100 | #201 | Poor 26.4% |
| Laotians | 19.2 /100 | #202 | Poor 26.4% |
| Immigrants | Eastern Europe | 19.2 /100 | #203 | Poor 26.4% |
| Immigrants | Russia | 19.0 /100 | #204 | Poor 26.4% |
| Immigrants | Southern Europe | 17.3 /100 | #205 | Poor 26.4% |
| Indians (Asian) | 16.5 /100 | #206 | Poor 26.4% |
| Immigrants | Italy | 15.8 /100 | #207 | Poor 26.5% |