Cape Verdean Disability Age 5 to 17
COMPARE
Cape Verdean
Select to Compare
Disability Age 5 to 17
Cape Verdean Disability Age 5 to 17
7.0%
DISABILITY | AGE 5 TO 17
0.0/ 100
METRIC RATING
341st/ 347
METRIC RANK
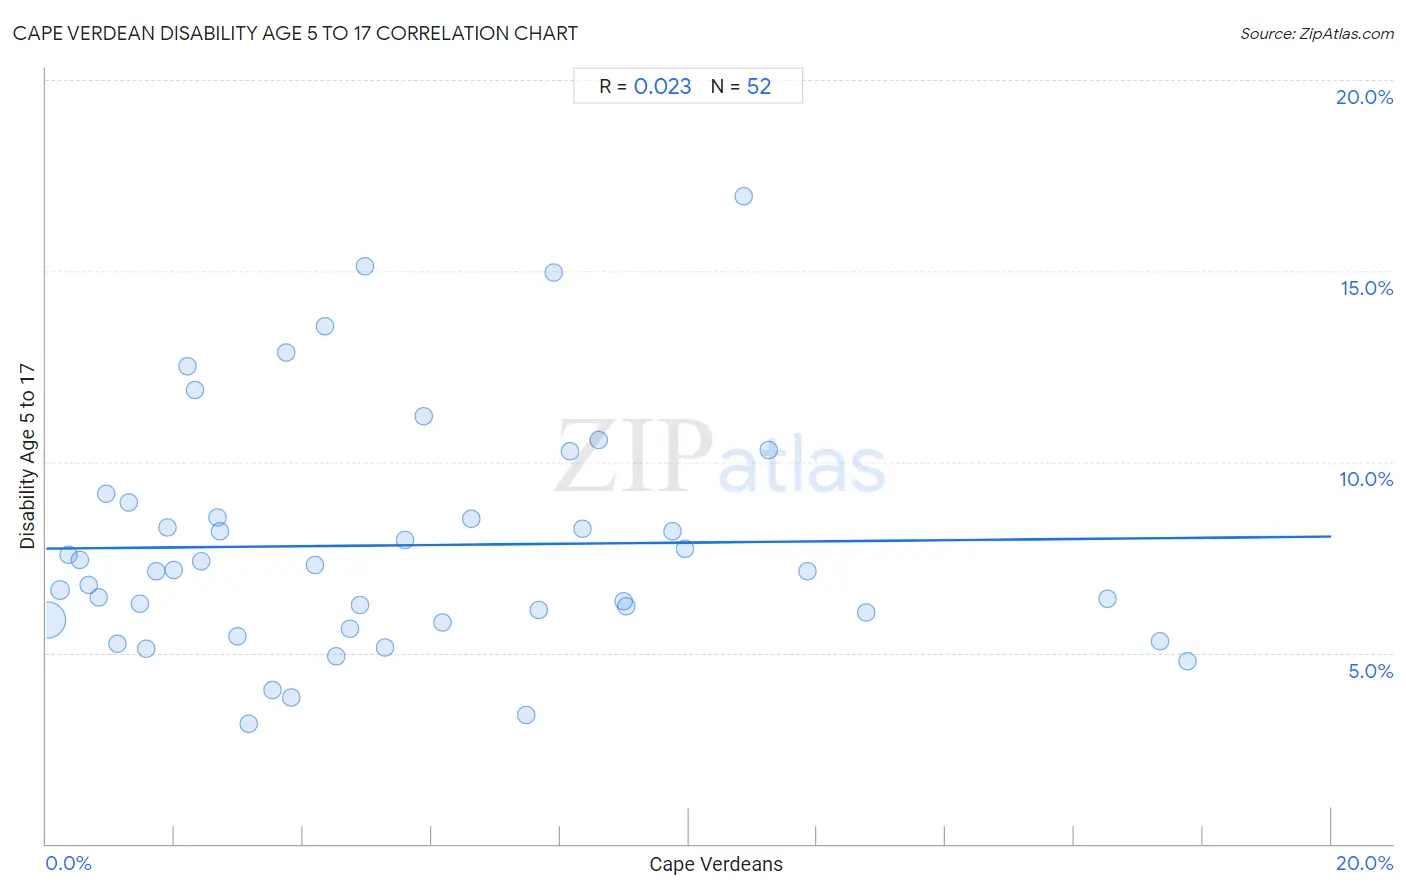
Cape Verdean Disability Age 5 to 17 Correlation Chart
The statistical analysis conducted on geographies consisting of 107,309,150 people shows no correlation between the proportion of Cape Verdeans and percentage of population with a disability between the ages 5 and 17 in the United States with a correlation coefficient (R) of 0.023 and weighted average of 7.0%. On average, for every 1% (one percent) increase in Cape Verdeans within a typical geography, there is an increase of 0.016% in percentage of population with a disability between the ages 5 and 17.
It is essential to understand that the correlation between the percentage of Cape Verdeans and percentage of population with a disability between the ages 5 and 17 does not imply a direct cause-and-effect relationship. It remains uncertain whether the presence of Cape Verdeans influences an upward or downward trend in the level of percentage of population with a disability between the ages 5 and 17 within an area, or if Cape Verdeans simply ended up residing in those areas with higher or lower levels of percentage of population with a disability between the ages 5 and 17 due to other factors.
Demographics Similar to Cape Verdeans by Disability Age 5 to 17
In terms of disability age 5 to 17, the demographic groups most similar to Cape Verdeans are Cherokee (6.9%, a difference of 0.54%), Choctaw (6.9%, a difference of 0.80%), Iroquois (6.9%, a difference of 1.1%), Creek (6.9%, a difference of 1.4%), and Chickasaw (6.8%, a difference of 1.8%).
| Demographics | Rating | Rank | Disability Age 5 to 17 |
| Blacks/African Americans | 0.0 /100 | #333 | Tragic 6.8% |
| Seminole | 0.0 /100 | #334 | Tragic 6.8% |
| Ottawa | 0.0 /100 | #335 | Tragic 6.8% |
| Chickasaw | 0.0 /100 | #336 | Tragic 6.8% |
| Creek | 0.0 /100 | #337 | Tragic 6.9% |
| Iroquois | 0.0 /100 | #338 | Tragic 6.9% |
| Choctaw | 0.0 /100 | #339 | Tragic 6.9% |
| Cherokee | 0.0 /100 | #340 | Tragic 6.9% |
| Cape Verdeans | 0.0 /100 | #341 | Tragic 7.0% |
| Chippewa | 0.0 /100 | #342 | Tragic 7.1% |
| Immigrants from Cabo Verde | 0.0 /100 | #343 | Tragic 7.1% |
| Cajuns | 0.0 /100 | #344 | Tragic 7.2% |
| Tsimshian | 0.0 /100 | #345 | Tragic 7.9% |
| Puerto Ricans | 0.0 /100 | #346 | Tragic 8.3% |
| Houma | 0.0 /100 | #347 | Tragic 9.1% |
Cape Verdean Disability Age 5 to 17 Correlation Summary
| Measurement | Cape Verdean Data | Disability Age 5 to 17 Data |
| Minimum | 0.026% | 3.1% |
| Maximum | 17.8% | 17.0% |
| Range | 17.7% | 13.8% |
| Mean | 5.5% | 7.8% |
| Median | 4.4% | 7.2% |
| Interquartile 25% (IQ1) | 1.9% | 5.8% |
| Interquartile 75% (IQ3) | 8.2% | 8.7% |
| Interquartile Range (IQR) | 6.3% | 2.9% |
| Standard Deviation (Sample) | 4.5% | 3.1% |
| Standard Deviation (Population) | 4.4% | 3.0% |
Correlation Details
| Cape Verdean Percentile | Sample Size | Disability Age 5 to 17 |
[ 0.0% - 0.5% ] 0.026% | 93,814,886 | 5.9% |
[ 0.0% - 0.5% ] 0.21% | 5,662,530 | 6.6% |
[ 0.0% - 0.5% ] 0.35% | 2,070,229 | 7.6% |
[ 0.5% - 1.0% ] 0.52% | 1,125,221 | 7.4% |
[ 0.5% - 1.0% ] 0.67% | 701,549 | 6.8% |
[ 0.5% - 1.0% ] 0.82% | 454,241 | 6.4% |
[ 0.5% - 1.0% ] 0.93% | 120,046 | 9.2% |
[ 1.0% - 1.5% ] 1.11% | 277,214 | 5.3% |
[ 1.0% - 1.5% ] 1.28% | 282,729 | 8.9% |
[ 1.0% - 1.5% ] 1.45% | 353,017 | 6.3% |
[ 1.5% - 2.0% ] 1.56% | 104,717 | 5.1% |
[ 1.5% - 2.0% ] 1.72% | 155,190 | 7.1% |
[ 1.5% - 2.0% ] 1.88% | 771,671 | 8.3% |
[ 1.5% - 2.0% ] 1.99% | 58,527 | 7.2% |
[ 2.0% - 2.5% ] 2.20% | 37,789 | 12.5% |
[ 2.0% - 2.5% ] 2.31% | 19,696 | 11.9% |
[ 2.0% - 2.5% ] 2.42% | 11,509 | 7.4% |
[ 2.5% - 3.0% ] 2.66% | 128,771 | 8.5% |
[ 2.5% - 3.0% ] 2.71% | 31,214 | 8.2% |
[ 2.5% - 3.0% ] 2.98% | 58,941 | 5.4% |
[ 3.0% - 3.5% ] 3.14% | 52,431 | 3.1% |
[ 3.5% - 4.0% ] 3.53% | 26,472 | 4.0% |
[ 3.5% - 4.0% ] 3.73% | 17,164 | 12.9% |
[ 3.5% - 4.0% ] 3.82% | 39,645 | 3.8% |
[ 4.0% - 4.5% ] 4.19% | 18,445 | 7.3% |
[ 4.0% - 4.5% ] 4.34% | 7,690 | 13.6% |
[ 4.5% - 5.0% ] 4.52% | 13,092 | 4.9% |
[ 4.5% - 5.0% ] 4.73% | 59,436 | 5.6% |
[ 4.5% - 5.0% ] 4.88% | 51,915 | 6.3% |
[ 4.5% - 5.0% ] 4.96% | 26,821 | 15.1% |
[ 5.0% - 5.5% ] 5.28% | 6,802 | 5.2% |
[ 5.5% - 6.0% ] 5.59% | 44,718 | 8.0% |
[ 5.5% - 6.0% ] 5.88% | 55,336 | 11.2% |
[ 6.0% - 6.5% ] 6.16% | 25,084 | 5.8% |
[ 6.5% - 7.0% ] 6.62% | 27,527 | 8.5% |
[ 7.0% - 7.5% ] 7.47% | 4,406 | 3.4% |
[ 7.5% - 8.0% ] 7.67% | 5,305 | 6.1% |
[ 7.5% - 8.0% ] 7.90% | 16,286 | 15.0% |
[ 8.0% - 8.5% ] 8.15% | 12,599 | 10.3% |
[ 8.0% - 8.5% ] 8.34% | 5,074 | 8.2% |
[ 8.5% - 9.0% ] 8.60% | 24,705 | 10.6% |
[ 8.5% - 9.0% ] 8.98% | 2,605 | 6.3% |
[ 9.0% - 9.5% ] 9.02% | 31,903 | 6.2% |
[ 9.5% - 10.0% ] 9.75% | 100,620 | 8.2% |
[ 9.5% - 10.0% ] 9.94% | 75,658 | 7.7% |
[ 10.5% - 11.0% ] 10.85% | 10,530 | 17.0% |
[ 11.0% - 11.5% ] 11.25% | 3,468 | 10.3% |
[ 11.5% - 12.0% ] 11.86% | 47,677 | 7.1% |
[ 12.5% - 13.0% ] 12.76% | 46,623 | 6.1% |
[ 16.5% - 17.0% ] 16.51% | 35,488 | 6.4% |
[ 17.0% - 17.5% ] 17.34% | 104,713 | 5.3% |
[ 17.5% - 18.0% ] 17.76% | 69,225 | 4.8% |