Zip Codes with the Highest Percentage of Population with a Degree in Science and Engineering in Georgia
RELATED REPORTS & OPTIONS
Science and Engineering
Georgia
Compare Zip Codes
Map of Zip Codes with the Highest Percentage of Population with a Degree in Science and Engineering in Georgia
10.0%
80.0%
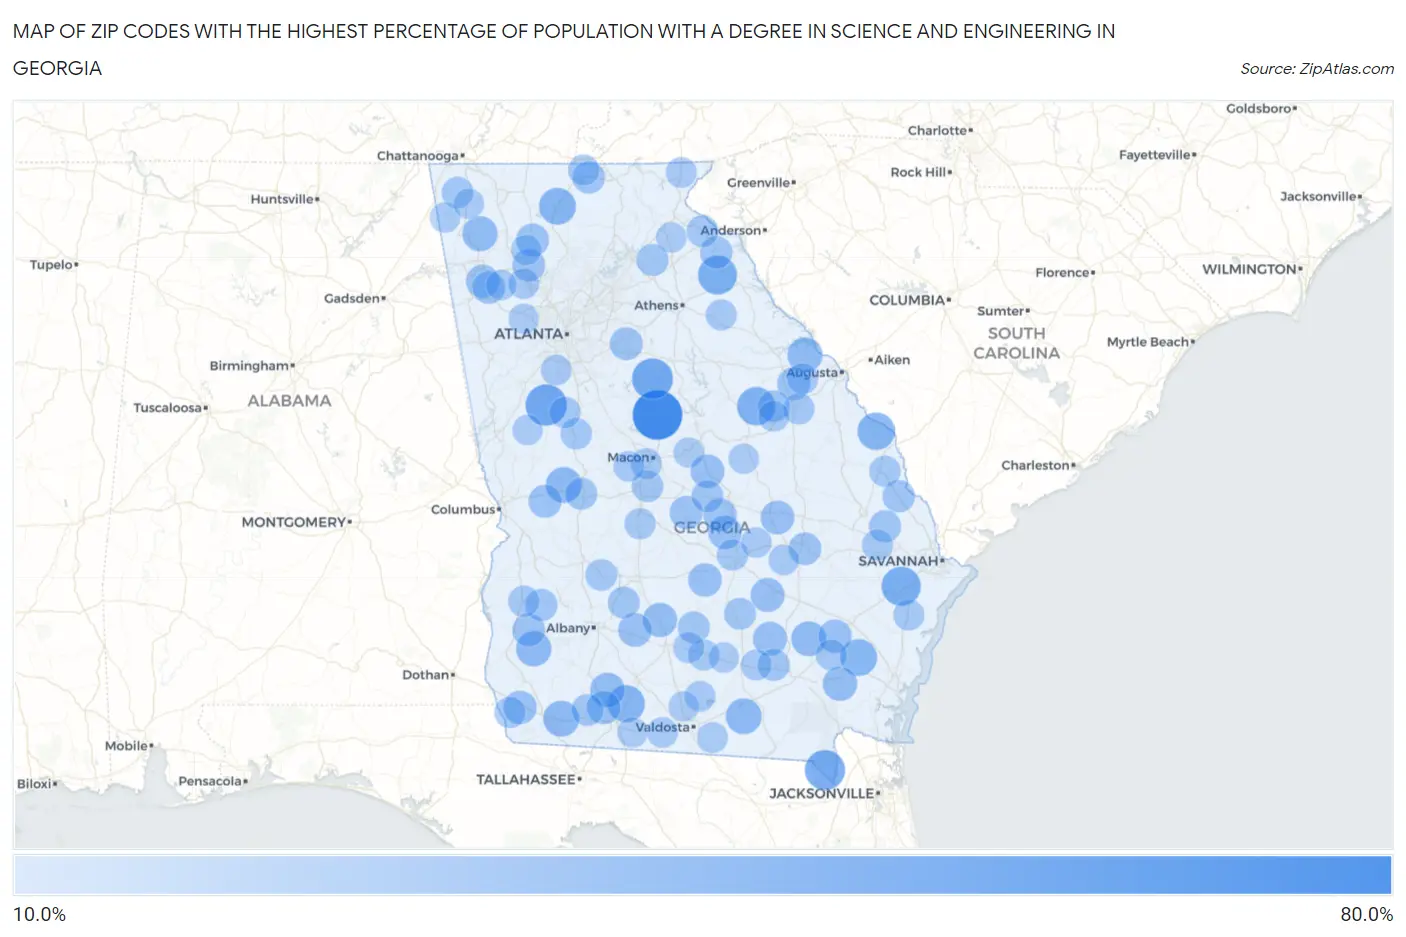
Zip Codes with the Highest Percentage of Population with a Degree in Science and Engineering in Georgia
| Zip Code | % Graduates | vs State | vs National | |
| 1. | 31038 | 75.4% | 9.5% (+65.9)#1 | 9.8% (+65.6)#150 |
| 2. | 30229 | 50.0% | 9.5% (+40.5)#2 | 9.8% (+40.2)#420 |
| 3. | 31085 | 48.4% | 9.5% (+38.9)#3 | 9.8% (+38.7)#447 |
| 4. | 31562 | 46.2% | 9.5% (+36.7)#4 | 9.8% (+36.5)#485 |
| 5. | 31309 | 43.4% | 9.5% (+33.9)#5 | 9.8% (+33.6)#563 |
| 6. | 30624 | 42.5% | 9.5% (+33.0)#6 | 9.8% (+32.7)#590 |
| 7. | 30820 | 40.4% | 9.5% (+30.9)#7 | 9.8% (+30.6)#655 |
| 8. | 30426 | 37.9% | 9.5% (+28.4)#8 | 9.8% (+28.1)#760 |
| 9. | 31738 | 37.2% | 9.5% (+27.7)#9 | 9.8% (+27.4)#804 |
| 10. | 30539 | 36.4% | 9.5% (+26.9)#10 | 9.8% (+26.6)#855 |
| 11. | 31543 | 36.2% | 9.5% (+26.7)#11 | 9.8% (+26.5)#861 |
| 12. | 39834 | 33.6% | 9.5% (+24.1)#12 | 9.8% (+23.8)#1,022 |
| 13. | 31812 | 33.3% | 9.5% (+23.8)#13 | 9.8% (+23.6)#1,032 |
| 14. | 31630 | 33.3% | 9.5% (+23.8)#14 | 9.8% (+23.6)#1,035 |
| 15. | 39813 | 31.9% | 9.5% (+22.4)#15 | 9.8% (+22.1)#1,144 |
| 16. | 30105 | 31.5% | 9.5% (+22.0)#16 | 9.8% (+21.7)#1,181 |
| 17. | 30802 | 31.3% | 9.5% (+21.8)#17 | 9.8% (+21.5)#1,197 |
| 18. | 31551 | 30.5% | 9.5% (+21.0)#18 | 9.8% (+20.7)#1,269 |
| 19. | 31765 | 29.5% | 9.5% (+20.0)#19 | 9.8% (+19.7)#1,357 |
| 20. | 31553 | 28.8% | 9.5% (+19.3)#20 | 9.8% (+19.1)#1,427 |
| 21. | 31790 | 28.6% | 9.5% (+19.1)#21 | 9.8% (+18.8)#1,454 |
| 22. | 31554 | 28.0% | 9.5% (+18.5)#22 | 9.8% (+18.3)#1,524 |
| 23. | 31539 | 27.7% | 9.5% (+18.2)#23 | 9.8% (+18.0)#1,555 |
| 24. | 31042 | 27.1% | 9.5% (+17.6)#24 | 9.8% (+17.3)#1,652 |
| 25. | 30457 | 27.0% | 9.5% (+17.5)#25 | 9.8% (+17.2)#1,661 |
| 26. | 31781 | 26.7% | 9.5% (+17.2)#26 | 9.8% (+16.9)#1,691 |
| 27. | 31077 | 26.6% | 9.5% (+17.1)#27 | 9.8% (+16.8)#1,711 |
| 28. | 31560 | 26.2% | 9.5% (+16.7)#28 | 9.8% (+16.5)#1,756 |
| 29. | 39859 | 26.1% | 9.5% (+16.6)#29 | 9.8% (+16.3)#1,775 |
| 30. | 31773 | 26.1% | 9.5% (+16.6)#30 | 9.8% (+16.3)#1,782 |
| 31. | 31009 | 26.0% | 9.5% (+16.5)#31 | 9.8% (+16.2)#1,795 |
| 32. | 30173 | 25.7% | 9.5% (+16.2)#32 | 9.8% (+15.9)#1,833 |
| 33. | 31019 | 25.6% | 9.5% (+16.1)#33 | 9.8% (+15.9)#1,839 |
| 34. | 31014 | 25.4% | 9.5% (+15.8)#34 | 9.8% (+15.6)#1,888 |
| 35. | 30808 | 25.0% | 9.5% (+15.5)#35 | 9.8% (+15.2)#1,931 |
| 36. | 31801 | 25.0% | 9.5% (+15.5)#36 | 9.8% (+15.2)#1,932 |
| 37. | 30139 | 24.8% | 9.5% (+15.3)#37 | 9.8% (+15.0)#2,014 |
| 38. | 30054 | 24.5% | 9.5% (+15.0)#38 | 9.8% (+14.7)#2,065 |
| 39. | 39846 | 24.5% | 9.5% (+15.0)#39 | 9.8% (+14.7)#2,068 |
| 40. | 30104 | 24.1% | 9.5% (+14.6)#40 | 9.8% (+14.4)#2,120 |
| 41. | 30184 | 24.1% | 9.5% (+14.6)#41 | 9.8% (+14.3)#2,142 |
| 42. | 30436 | 23.7% | 9.5% (+14.2)#42 | 9.8% (+13.9)#2,223 |
| 43. | 30446 | 23.1% | 9.5% (+13.6)#43 | 9.8% (+13.3)#2,358 |
| 44. | 30560 | 23.0% | 9.5% (+13.5)#44 | 9.8% (+13.2)#2,388 |
| 45. | 30520 | 23.0% | 9.5% (+13.5)#45 | 9.8% (+13.2)#2,392 |
| 46. | 39886 | 22.8% | 9.5% (+13.3)#46 | 9.8% (+13.0)#2,420 |
| 47. | 30415 | 22.3% | 9.5% (+12.8)#47 | 9.8% (+12.5)#2,563 |
| 48. | 39827 | 22.0% | 9.5% (+12.5)#48 | 9.8% (+12.2)#2,651 |
| 49. | 30543 | 21.9% | 9.5% (+12.4)#49 | 9.8% (+12.1)#2,672 |
| 50. | 31006 | 21.8% | 9.5% (+12.3)#50 | 9.8% (+12.1)#2,684 |
| 51. | 31065 | 21.6% | 9.5% (+12.1)#51 | 9.8% (+11.8)#2,755 |
| 52. | 31774 | 21.6% | 9.5% (+12.1)#52 | 9.8% (+11.8)#2,758 |
| 53. | 31028 | 21.5% | 9.5% (+11.9)#53 | 9.8% (+11.7)#2,793 |
| 54. | 31552 | 21.4% | 9.5% (+11.9)#54 | 9.8% (+11.6)#2,798 |
| 55. | 31519 | 21.3% | 9.5% (+11.8)#55 | 9.8% (+11.5)#2,861 |
| 56. | 30810 | 21.3% | 9.5% (+11.8)#56 | 9.8% (+11.5)#2,863 |
| 57. | 31796 | 21.2% | 9.5% (+11.7)#57 | 9.8% (+11.4)#2,877 |
| 58. | 30557 | 21.1% | 9.5% (+11.6)#58 | 9.8% (+11.3)#2,912 |
| 59. | 31764 | 21.0% | 9.5% (+11.5)#59 | 9.8% (+11.2)#2,958 |
| 60. | 30707 | 20.4% | 9.5% (+10.9)#60 | 9.8% (+10.6)#3,185 |
| 61. | 30833 | 20.3% | 9.5% (+10.8)#61 | 9.8% (+10.5)#3,234 |
| 62. | 30256 | 20.2% | 9.5% (+10.7)#62 | 9.8% (+10.4)#3,267 |
| 63. | 31037 | 20.0% | 9.5% (+10.5)#63 | 9.8% (+10.2)#3,324 |
| 64. | 30292 | 19.8% | 9.5% (+10.3)#64 | 9.8% (+9.97)#3,460 |
| 65. | 39845 | 19.6% | 9.5% (+10.1)#65 | 9.8% (+9.86)#3,490 |
| 66. | 39840 | 19.6% | 9.5% (+10.1)#66 | 9.8% (+9.79)#3,526 |
| 67. | 30467 | 19.5% | 9.5% (+10.0)#67 | 9.8% (+9.76)#3,550 |
| 68. | 30559 | 19.3% | 9.5% (+9.77)#68 | 9.8% (+9.49)#3,662 |
| 69. | 31206 | 19.3% | 9.5% (+9.77)#69 | 9.8% (+9.49)#3,663 |
| 70. | 31323 | 19.2% | 9.5% (+9.69)#70 | 9.8% (+9.41)#3,713 |
| 71. | 31025 | 19.2% | 9.5% (+9.68)#71 | 9.8% (+9.41)#3,716 |
| 72. | 31321 | 19.2% | 9.5% (+9.66)#72 | 9.8% (+9.39)#3,725 |
| 73. | 31622 | 19.2% | 9.5% (+9.66)#73 | 9.8% (+9.38)#3,727 |
| 74. | 30814 | 19.1% | 9.5% (+9.63)#74 | 9.8% (+9.36)#3,738 |
| 75. | 30648 | 19.1% | 9.5% (+9.63)#75 | 9.8% (+9.35)#3,740 |
| 76. | 31557 | 19.1% | 9.5% (+9.59)#76 | 9.8% (+9.31)#3,754 |
| 77. | 31749 | 18.8% | 9.5% (+9.28)#77 | 9.8% (+9.01)#3,891 |
| 78. | 31624 | 18.8% | 9.5% (+9.28)#78 | 9.8% (+9.00)#3,894 |
| 79. | 31645 | 18.6% | 9.5% (+9.07)#79 | 9.8% (+8.79)#4,008 |
| 80. | 31643 | 18.6% | 9.5% (+9.05)#80 | 9.8% (+8.78)#4,015 |
| 81. | 30803 | 18.5% | 9.5% (+9.01)#81 | 9.8% (+8.74)#4,029 |
| 82. | 31636 | 18.4% | 9.5% (+8.85)#82 | 9.8% (+8.58)#4,113 |
| 83. | 30562 | 18.3% | 9.5% (+8.81)#83 | 9.8% (+8.53)#4,133 |
| 84. | 30214 | 18.1% | 9.5% (+8.56)#84 | 9.8% (+8.29)#4,277 |
| 85. | 30137 | 18.0% | 9.5% (+8.51)#85 | 9.8% (+8.23)#4,311 |
| 86. | 30428 | 18.0% | 9.5% (+8.48)#86 | 9.8% (+8.20)#4,332 |
| 87. | 31052 | 17.9% | 9.5% (+8.38)#87 | 9.8% (+8.10)#4,380 |
| 88. | 30412 | 17.6% | 9.5% (+8.14)#88 | 9.8% (+7.87)#4,525 |
| 89. | 30178 | 17.6% | 9.5% (+8.12)#89 | 9.8% (+7.84)#4,538 |
| 90. | 30511 | 17.6% | 9.5% (+8.07)#90 | 9.8% (+7.79)#4,568 |
| 91. | 30731 | 17.5% | 9.5% (+8.01)#91 | 9.8% (+7.73)#4,612 |
| 92. | 31031 | 17.5% | 9.5% (+7.95)#92 | 9.8% (+7.68)#4,657 |
| 93. | 31650 | 17.3% | 9.5% (+7.80)#93 | 9.8% (+7.52)#4,738 |
| 94. | 30222 | 17.1% | 9.5% (+7.62)#94 | 9.8% (+7.35)#4,842 |
| 95. | 31632 | 17.1% | 9.5% (+7.60)#95 | 9.8% (+7.32)#4,869 |
| 96. | 31089 | 17.1% | 9.5% (+7.59)#96 | 9.8% (+7.31)#4,870 |
| 97. | 31626 | 17.1% | 9.5% (+7.59)#97 | 9.8% (+7.31)#4,877 |
| 98. | 30728 | 17.1% | 9.5% (+7.55)#98 | 9.8% (+7.28)#4,900 |
| 99. | 30171 | 17.0% | 9.5% (+7.55)#99 | 9.8% (+7.27)#4,909 |
| 100. | 30141 | 17.0% | 9.5% (+7.55)#100 | 9.8% (+7.27)#4,910 |
Common Questions
What are the Top 10 Zip Codes with the Highest Percentage of Population with a Degree in Science and Engineering in Georgia?
Top 10 Zip Codes with the Highest Percentage of Population with a Degree in Science and Engineering in Georgia are:
What zip code has the Highest Percentage of Population with a Degree in Science and Engineering in Georgia?
31038 has the Highest Percentage of Population with a Degree in Science and Engineering in Georgia with 75.4%.
What is the Percentage of Population with a Degree in Science and Engineering in the State of Georgia?
Percentage of Population with a Degree in Science and Engineering in Georgia is 9.5%.
What is the Percentage of Population with a Degree in Science and Engineering in the United States?
Percentage of Population with a Degree in Science and Engineering in the United States is 9.8%.