Zip Codes with the Highest Percentage of Population with a Degree in Science and Engineering in Snellville, GA
RELATED REPORTS & OPTIONS
Science and Engineering
Snellville
Compare Zip Codes
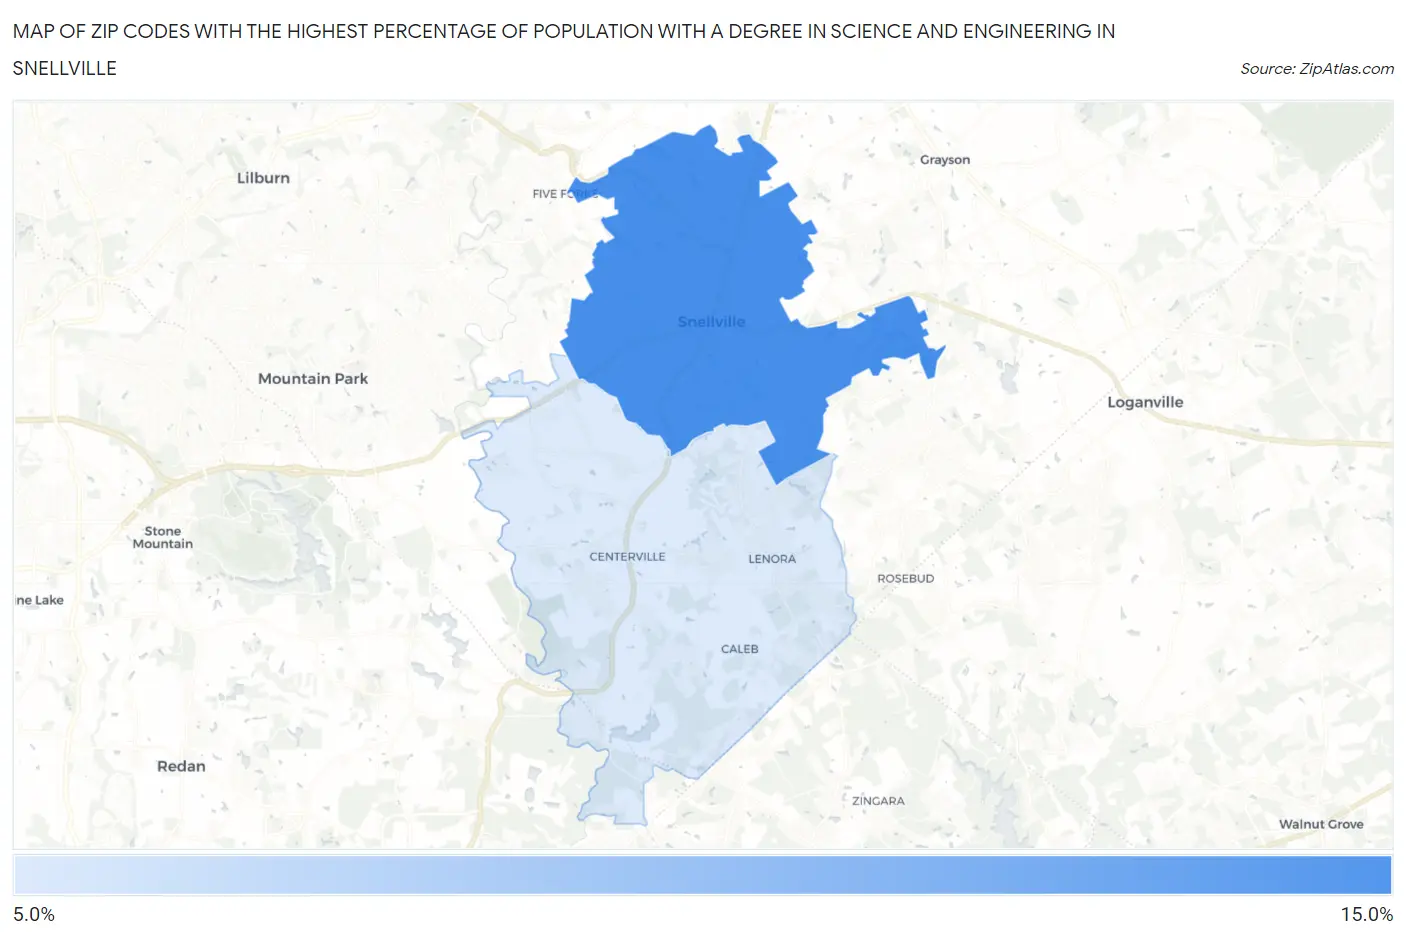
Map of Zip Codes with the Highest Percentage of Population with a Degree in Science and Engineering in Snellville
12.7%
13.4%
Zip Codes with the Highest Percentage of Population with a Degree in Science and Engineering in Snellville, GA
| Zip Code | % Graduates | vs State | vs National | |
| 1. | 30078 | 13.4% | 9.5%(+3.86)#184 | 9.8%(+3.58)#8,681 |
| 2. | 30039 | 12.7% | 9.5%(+3.22)#209 | 9.8%(+2.94)#9,671 |
1
Common Questions
What are the Top Zip Codes with the Highest Percentage of Population with a Degree in Science and Engineering in Snellville, GA?
Top Zip Codes with the Highest Percentage of Population with a Degree in Science and Engineering in Snellville, GA are:
What zip code has the Highest Percentage of Population with a Degree in Science and Engineering in Snellville, GA?
30078 has the Highest Percentage of Population with a Degree in Science and Engineering in Snellville, GA with 13.4%.
What is the Percentage of Population with a Degree in Science and Engineering in Snellville, GA?
Percentage of Population with a Degree in Science and Engineering in Snellville is 15.3%.
What is the Percentage of Population with a Degree in Science and Engineering in Georgia?
Percentage of Population with a Degree in Science and Engineering in Georgia is 9.5%.
What is the Percentage of Population with a Degree in Science and Engineering in the United States?
Percentage of Population with a Degree in Science and Engineering in the United States is 9.8%.