Portland, CO Map & Demographics
Portland Map
Portland Overview
$28,986
PER CAPITA INCOME
60.8%
WAGE / INCOME GAP [ % ]
39.2¢/ $1
WAGE / INCOME GAP [ $ ]
0.32
INEQUALITY / GINI INDEX
118
TOTAL POPULATION
49
MALE POPULATION
69
FEMALE POPULATION
71.01
MALES / 100 FEMALES
140.82
FEMALES / 100 MALES
55.7
MEDIAN AGE
2.5
AVG FAMILY SIZE
2.5
AVG HOUSEHOLD SIZE
51
LABOR FORCE [ PEOPLE ]
48.6%
PERCENT IN LABOR FORCE
Income in Portland
Income Overview in Portland
| Characteristic | Number | Measure |
| Per Capita Income | 118 | $28,986 |
| Median Family Income | 45 | $0 |
| Mean Family Income | 45 | $71,602 |
| Median Household Income | 47 | $0 |
| Mean Household Income | 47 | $74,334 |
| Income Deficit | 45 | $0 |
| Wage / Income Gap (%) | 118 | 60.83% |
| Wage / Income Gap ($) | 118 | 39.17¢ per $1 |
| Gini / Inequality Index | 118 | 0.32 |
Earnings by Sex in Portland
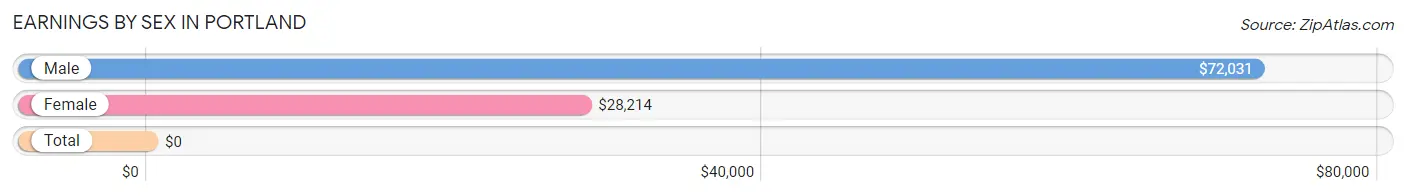
| Sex | Number | Average Earnings |
| Male | 25 (49.0%) | $72,031 |
| Female | 26 (51.0%) | $28,214 |
| Total | 51 (100.0%) | $0 |
Earnings by Sex by Income Bracket in Portland
The most common earnings brackets in Portland are $65,000 to $74,999 for men (11 | 44.0%) and $25,000 to $29,999 for women (7 | 26.9%).
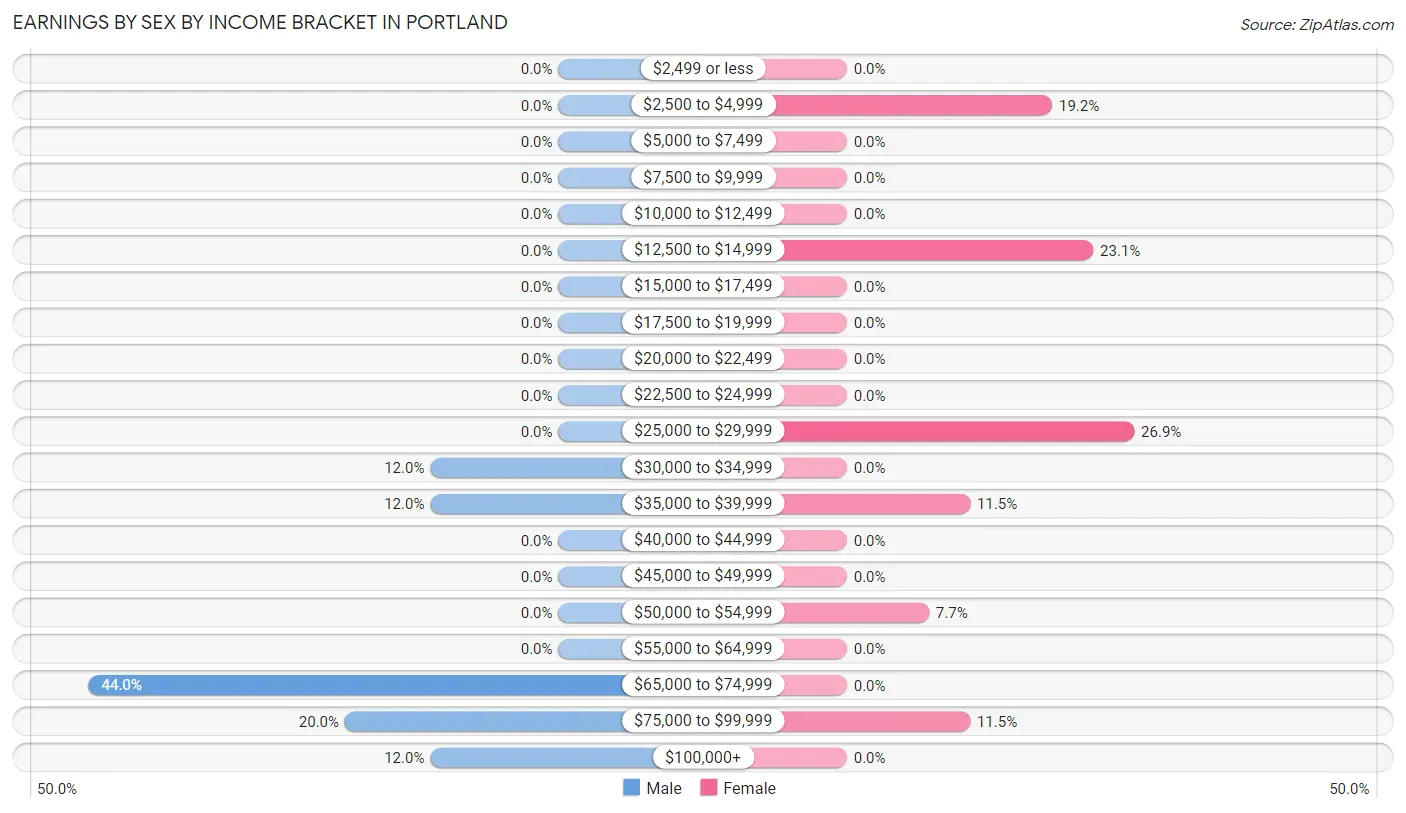
| Income | Male | Female |
| $2,499 or less | 0 (0.0%) | 0 (0.0%) |
| $2,500 to $4,999 | 0 (0.0%) | 5 (19.2%) |
| $5,000 to $7,499 | 0 (0.0%) | 0 (0.0%) |
| $7,500 to $9,999 | 0 (0.0%) | 0 (0.0%) |
| $10,000 to $12,499 | 0 (0.0%) | 0 (0.0%) |
| $12,500 to $14,999 | 0 (0.0%) | 6 (23.1%) |
| $15,000 to $17,499 | 0 (0.0%) | 0 (0.0%) |
| $17,500 to $19,999 | 0 (0.0%) | 0 (0.0%) |
| $20,000 to $22,499 | 0 (0.0%) | 0 (0.0%) |
| $22,500 to $24,999 | 0 (0.0%) | 0 (0.0%) |
| $25,000 to $29,999 | 0 (0.0%) | 7 (26.9%) |
| $30,000 to $34,999 | 3 (12.0%) | 0 (0.0%) |
| $35,000 to $39,999 | 3 (12.0%) | 3 (11.5%) |
| $40,000 to $44,999 | 0 (0.0%) | 0 (0.0%) |
| $45,000 to $49,999 | 0 (0.0%) | 0 (0.0%) |
| $50,000 to $54,999 | 0 (0.0%) | 2 (7.7%) |
| $55,000 to $64,999 | 0 (0.0%) | 0 (0.0%) |
| $65,000 to $74,999 | 11 (44.0%) | 0 (0.0%) |
| $75,000 to $99,999 | 5 (20.0%) | 3 (11.5%) |
| $100,000+ | 3 (12.0%) | 0 (0.0%) |
| Total | 25 (100.0%) | 26 (100.0%) |
Earnings by Sex by Educational Attainment in Portland
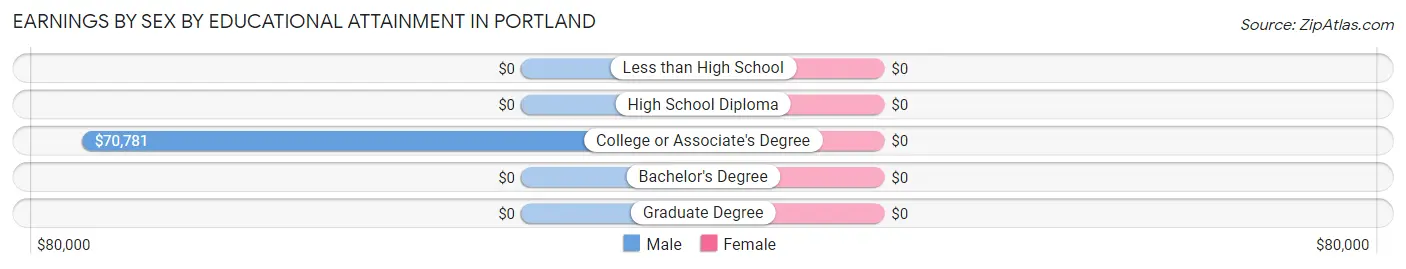
| Educational Attainment | Male Income | Female Income |
| Less than High School | - | - |
| High School Diploma | - | - |
| College or Associate's Degree | $70,781 | $0 |
| Bachelor's Degree | - | - |
| Graduate Degree | - | - |
| Total | $72,031 | $28,214 |
Family Income in Portland
Family Income Brackets in Portland
According to the Portland family income data, there are 20 families falling into the $35,000 to $49,999 income range, which is the most common income bracket and makes up 44.4% of all families.
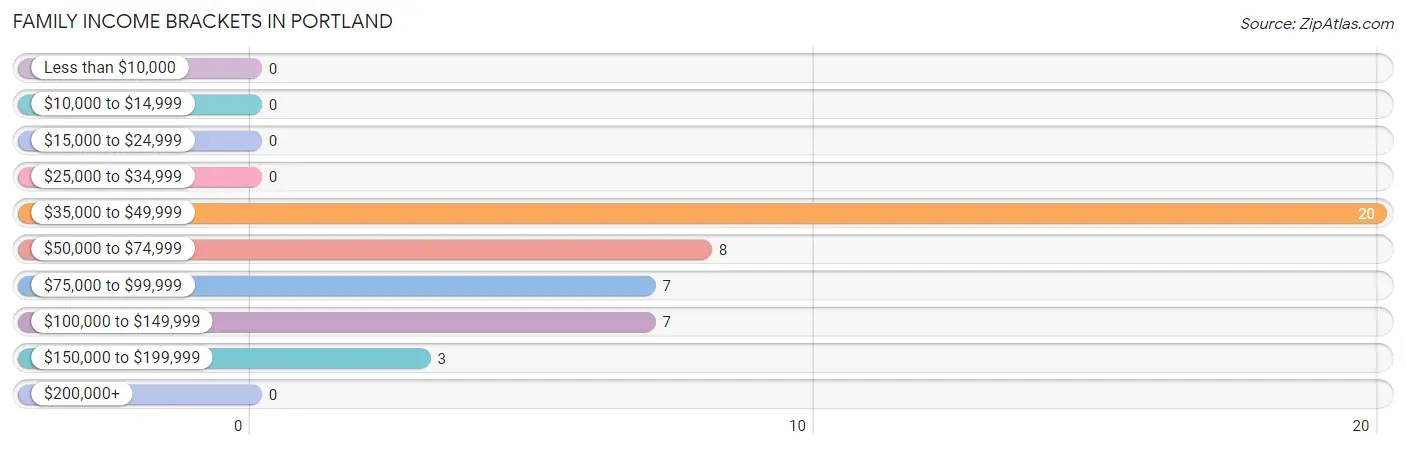
| Income Bracket | # Families | % Families |
| Less than $10,000 | 0 | 0.0% |
| $10,000 to $14,999 | 0 | 0.0% |
| $15,000 to $24,999 | 0 | 0.0% |
| $25,000 to $34,999 | 0 | 0.0% |
| $35,000 to $49,999 | 20 | 44.4% |
| $50,000 to $74,999 | 8 | 17.8% |
| $75,000 to $99,999 | 7 | 15.6% |
| $100,000 to $149,999 | 7 | 15.6% |
| $150,000 to $199,999 | 3 | 6.7% |
| $200,000+ | 0 | 0.0% |
Family Income by Famaliy Size in Portland
| Income Bracket | # Families | Median Income |
| 2-Person Families | 33 (73.3%) | $0 |
| 3-Person Families | 5 (11.1%) | $0 |
| 4-Person Families | 7 (15.6%) | $0 |
| 5-Person Families | 0 (0.0%) | $0 |
| 6-Person Families | 0 (0.0%) | $0 |
| 7+ Person Families | 0 (0.0%) | $0 |
| Total | 45 (100.0%) | $0 |
Family Income by Number of Earners in Portland
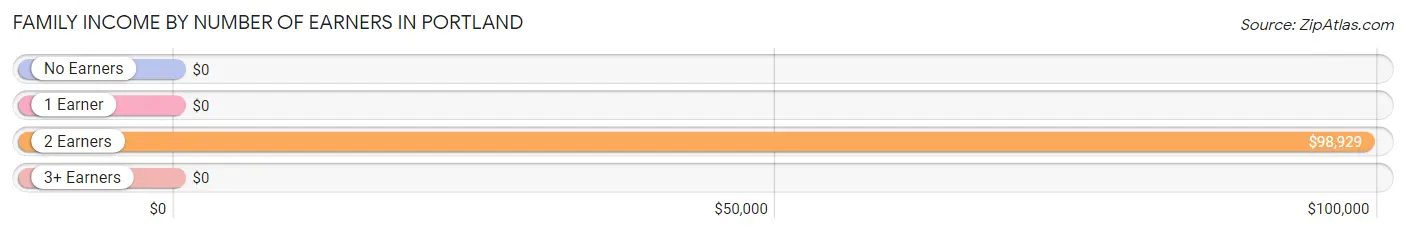
| Number of Earners | # Families | Median Income |
| No Earners | 17 (37.8%) | $0 |
| 1 Earner | 10 (22.2%) | $0 |
| 2 Earners | 18 (40.0%) | $98,929 |
| 3+ Earners | 0 (0.0%) | $0 |
| Total | 45 (100.0%) | $0 |
Household Income in Portland
Household Income Brackets in Portland
With 20 households falling in the category, the $35,000 to $49,999 income range is the most frequent in Portland, accounting for 42.5% of all households.
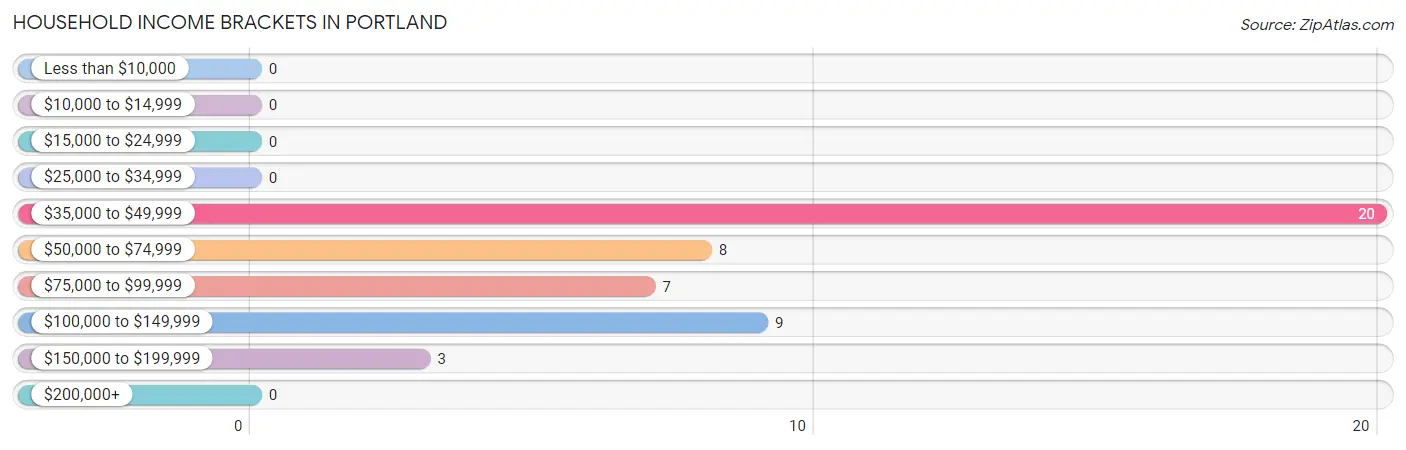
| Income Bracket | # Households | % Households |
| Less than $10,000 | 0 | 0.0% |
| $10,000 to $14,999 | 0 | 0.0% |
| $15,000 to $24,999 | 0 | 0.0% |
| $25,000 to $34,999 | 0 | 0.0% |
| $35,000 to $49,999 | 20 | 42.6% |
| $50,000 to $74,999 | 8 | 17.0% |
| $75,000 to $99,999 | 7 | 14.9% |
| $100,000 to $149,999 | 9 | 19.1% |
| $150,000 to $199,999 | 3 | 6.4% |
| $200,000+ | 0 | 0.0% |
Household Income by Householder Age in Portland
The median household income in Portland is $0, with the highest median household income of $110,833 found in the 45 to 64 years age bracket for the primary householder. A total of 22 households (46.8%) fall into this category.
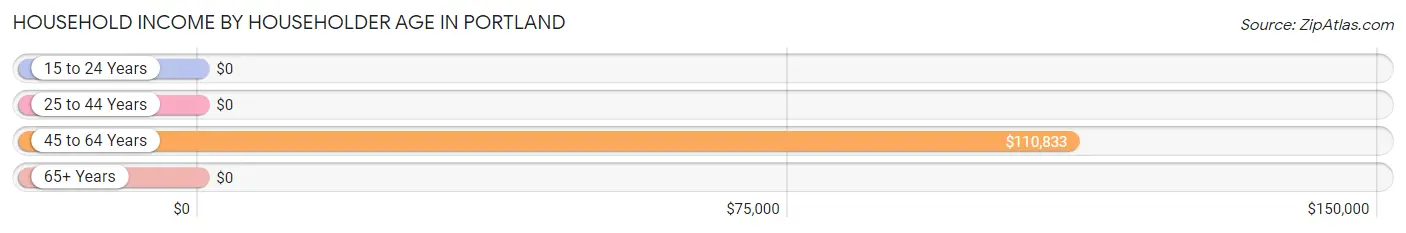
| Income Bracket | # Households | Median Income |
| 15 to 24 Years | 0 (0.0%) | $0 |
| 25 to 44 Years | 3 (6.4%) | $0 |
| 45 to 64 Years | 22 (46.8%) | $110,833 |
| 65+ Years | 22 (46.8%) | $0 |
| Total | 47 (100.0%) | $0 |
Poverty in Portland
Income Below Poverty by Sex and Age in Portland
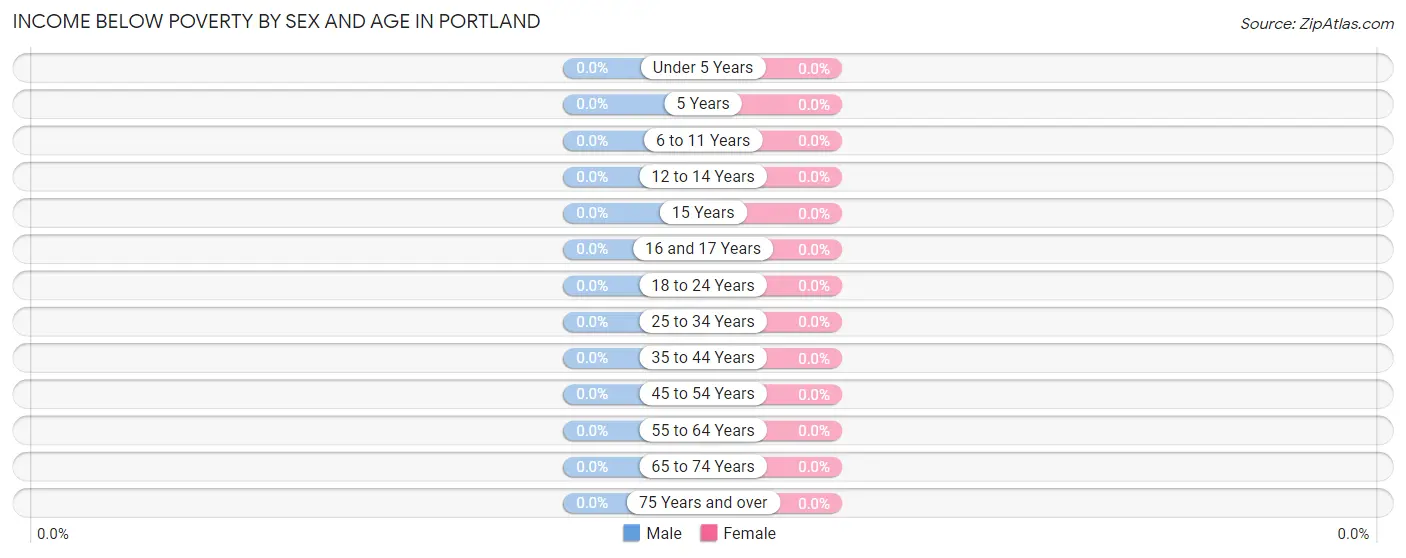
| Age Bracket | Male | Female |
| Under 5 Years | 0 (0.0%) | 0 (0.0%) |
| 5 Years | 0 (0.0%) | 0 (0.0%) |
| 6 to 11 Years | 0 (0.0%) | 0 (0.0%) |
| 12 to 14 Years | 0 (0.0%) | 0 (0.0%) |
| 15 Years | 0 (0.0%) | 0 (0.0%) |
| 16 and 17 Years | 0 (0.0%) | 0 (0.0%) |
| 18 to 24 Years | 0 (0.0%) | 0 (0.0%) |
| 25 to 34 Years | 0 (0.0%) | 0 (0.0%) |
| 35 to 44 Years | 0 (0.0%) | 0 (0.0%) |
| 45 to 54 Years | 0 (0.0%) | 0 (0.0%) |
| 55 to 64 Years | 0 (0.0%) | 0 (0.0%) |
| 65 to 74 Years | 0 (0.0%) | 0 (0.0%) |
| 75 Years and over | 0 (0.0%) | 0 (0.0%) |
| Total | 0 (0.0%) | 0 (0.0%) |
Income Above Poverty by Sex and Age in Portland
According to the poverty statistics in Portland, males aged 5 years and females aged 6 to 11 years are the age groups that are most secure financially, with 100.0% of males and 100.0% of females in these age groups living above the poverty line.
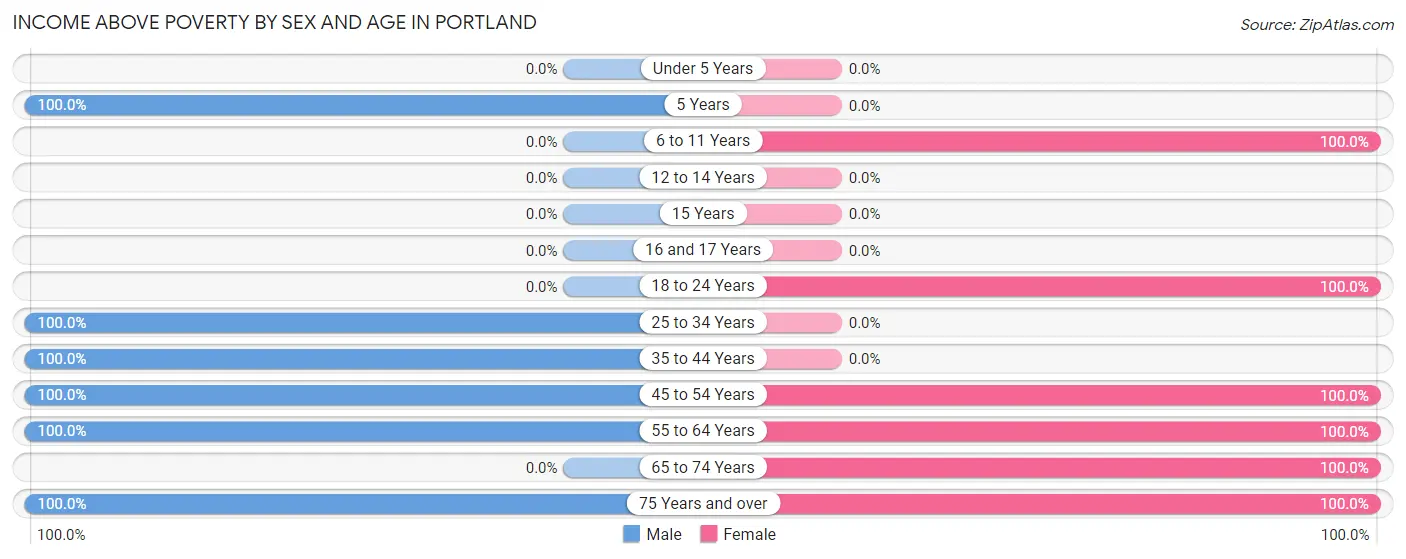
| Age Bracket | Male | Female |
| Under 5 Years | 0 (0.0%) | 0 (0.0%) |
| 5 Years | 7 (100.0%) | 0 (0.0%) |
| 6 to 11 Years | 0 (0.0%) | 6 (100.0%) |
| 12 to 14 Years | 0 (0.0%) | 0 (0.0%) |
| 15 Years | 0 (0.0%) | 0 (0.0%) |
| 16 and 17 Years | 0 (0.0%) | 0 (0.0%) |
| 18 to 24 Years | 0 (0.0%) | 14 (100.0%) |
| 25 to 34 Years | 8 (100.0%) | 0 (0.0%) |
| 35 to 44 Years | 3 (100.0%) | 0 (0.0%) |
| 45 to 54 Years | 3 (100.0%) | 16 (100.0%) |
| 55 to 64 Years | 11 (100.0%) | 9 (100.0%) |
| 65 to 74 Years | 0 (0.0%) | 9 (100.0%) |
| 75 Years and over | 17 (100.0%) | 15 (100.0%) |
| Total | 49 (100.0%) | 69 (100.0%) |
Income Below Poverty Among Married-Couple Families in Portland
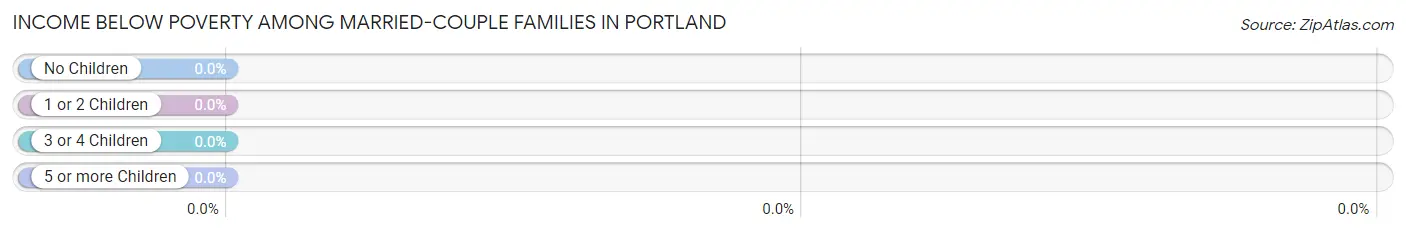
| Children | Above Poverty | Below Poverty |
| No Children | 30 (100.0%) | 0 (0.0%) |
| 1 or 2 Children | 7 (100.0%) | 0 (0.0%) |
| 3 or 4 Children | 0 (0.0%) | 0 (0.0%) |
| 5 or more Children | 0 (0.0%) | 0 (0.0%) |
| Total | 37 (100.0%) | 0 (0.0%) |
Income Below Poverty Among Single-Parent Households in Portland
| Children | Single Father | Single Mother |
| No Children | 0 (0.0%) | 0 (0.0%) |
| 1 or 2 Children | 0 (0.0%) | 0 (0.0%) |
| 3 or 4 Children | 0 (0.0%) | 0 (0.0%) |
| 5 or more Children | 0 (0.0%) | 0 (0.0%) |
| Total | 0 (0.0%) | 0 (0.0%) |
Income Below Poverty Among Married-Couple vs Single-Parent Households in Portland
| Children | Married-Couple Families | Single-Parent Households |
| No Children | 0 (0.0%) | 0 (0.0%) |
| 1 or 2 Children | 0 (0.0%) | 0 (0.0%) |
| 3 or 4 Children | 0 (0.0%) | 0 (0.0%) |
| 5 or more Children | 0 (0.0%) | 0 (0.0%) |
| Total | 0 (0.0%) | 0 (0.0%) |
Race in Portland
The most populous races in Portland are , and White / Caucasian (118 | 100.0%).
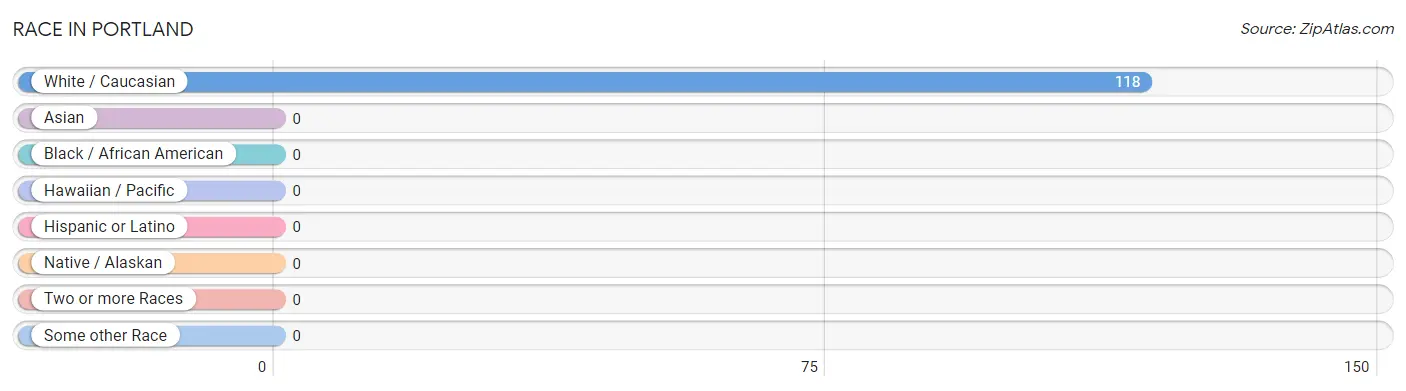
| Race | # Population | % Population |
| Asian | 0 | 0.0% |
| Black / African American | 0 | 0.0% |
| Hawaiian / Pacific | 0 | 0.0% |
| Hispanic or Latino | 0 | 0.0% |
| Native / Alaskan | 0 | 0.0% |
| White / Caucasian | 118 | 100.0% |
| Two or more Races | 0 | 0.0% |
| Some other Race | 0 | 0.0% |
| Total | 118 | 100.0% |
Ancestry in Portland
The most populous ancestries reported in Portland are Italian (32 | 27.1%), Irish (30 | 25.4%), French (20 | 17.0%), Polish (20 | 17.0%), and English (11 | 9.3%), together accounting for 95.8% of all Portland residents.
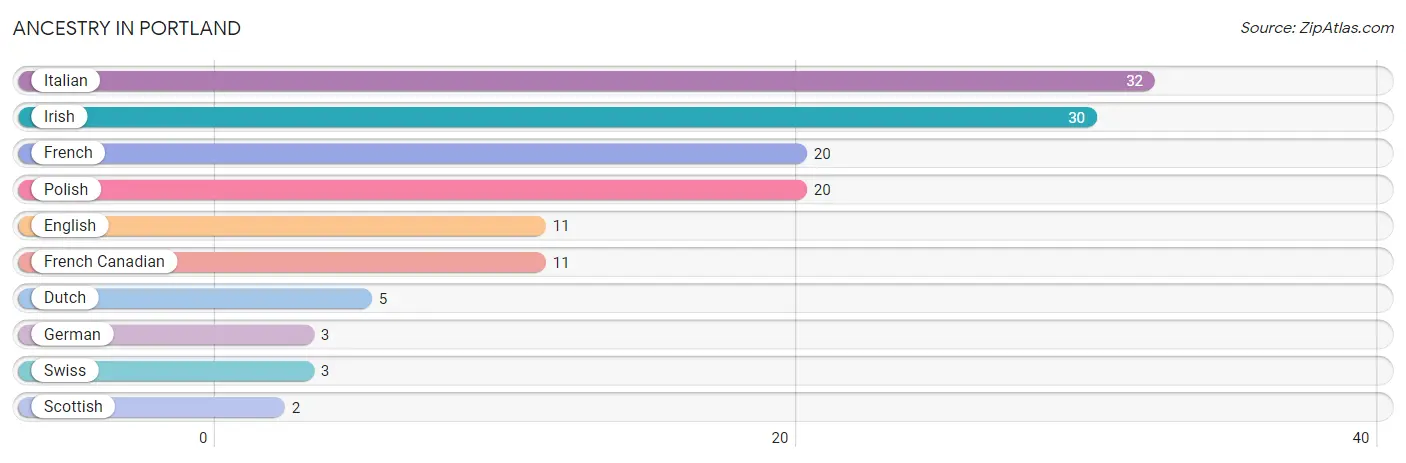
| Ancestry | # Population | % Population |
| Dutch | 5 | 4.2% |
| English | 11 | 9.3% |
| French | 20 | 17.0% |
| French Canadian | 11 | 9.3% |
| German | 3 | 2.5% |
| Irish | 30 | 25.4% |
| Italian | 32 | 27.1% |
| Polish | 20 | 17.0% |
| Scottish | 2 | 1.7% |
| Swiss | 3 | 2.5% | View All 10 Rows |
Immigrants in Portland

| Immigration Origin | # Population | % Population | View All 0 Rows |
Sex and Age in Portland
Sex and Age in Portland
The most populous age groups in Portland are 80 to 84 Years (17 | 34.7%) for men and 75 to 79 Years (15 | 21.7%) for women.
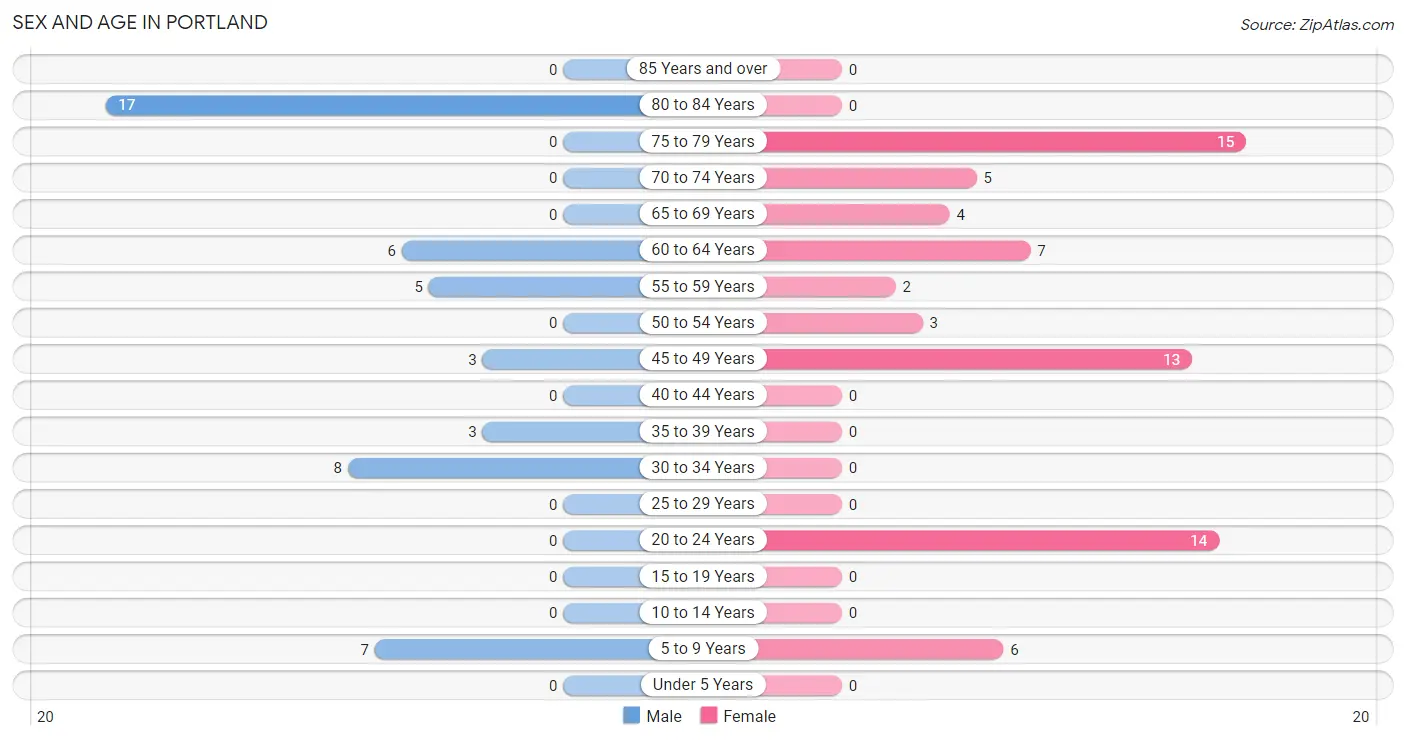
| Age Bracket | Male | Female |
| Under 5 Years | 0 (0.0%) | 0 (0.0%) |
| 5 to 9 Years | 7 (14.3%) | 6 (8.7%) |
| 10 to 14 Years | 0 (0.0%) | 0 (0.0%) |
| 15 to 19 Years | 0 (0.0%) | 0 (0.0%) |
| 20 to 24 Years | 0 (0.0%) | 14 (20.3%) |
| 25 to 29 Years | 0 (0.0%) | 0 (0.0%) |
| 30 to 34 Years | 8 (16.3%) | 0 (0.0%) |
| 35 to 39 Years | 3 (6.1%) | 0 (0.0%) |
| 40 to 44 Years | 0 (0.0%) | 0 (0.0%) |
| 45 to 49 Years | 3 (6.1%) | 13 (18.8%) |
| 50 to 54 Years | 0 (0.0%) | 3 (4.3%) |
| 55 to 59 Years | 5 (10.2%) | 2 (2.9%) |
| 60 to 64 Years | 6 (12.2%) | 7 (10.1%) |
| 65 to 69 Years | 0 (0.0%) | 4 (5.8%) |
| 70 to 74 Years | 0 (0.0%) | 5 (7.2%) |
| 75 to 79 Years | 0 (0.0%) | 15 (21.7%) |
| 80 to 84 Years | 17 (34.7%) | 0 (0.0%) |
| 85 Years and over | 0 (0.0%) | 0 (0.0%) |
| Total | 49 (100.0%) | 69 (100.0%) |
Families and Households in Portland
Median Family Size in Portland
The median family size in Portland is 2.53 persons per family, with single female/mother families (5 | 11.1%) accounting for the largest median family size of 5 persons per family. On the other hand, single male/father families (3 | 6.7%) represent the smallest median family size with 1.33 persons per family.
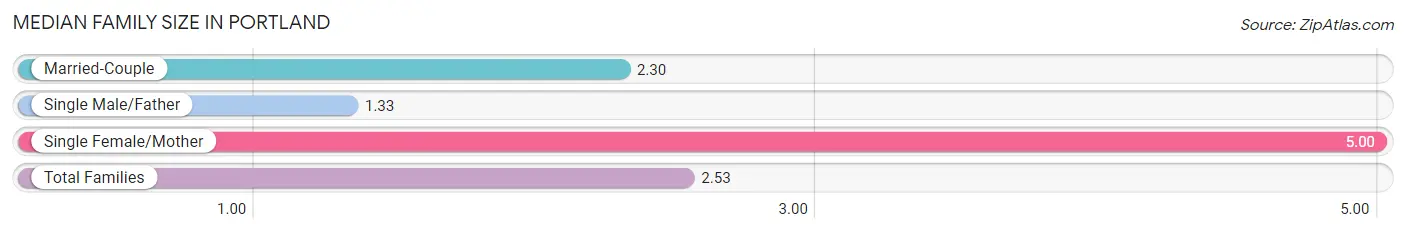
| Family Type | # Families | Family Size |
| Married-Couple | 37 (82.2%) | 2.30 |
| Single Male/Father | 3 (6.7%) | 1.33 |
| Single Female/Mother | 5 (11.1%) | 5.00 |
| Total Families | 45 (100.0%) | 2.53 |
Median Household Size in Portland
The median household size in Portland is 2.51 persons per household, with single female/mother households (5 | 10.6%) accounting for the largest median household size of 5 persons per household. single male/father households (3 | 6.4%) represent the smallest median household size with 1.33 persons per household.
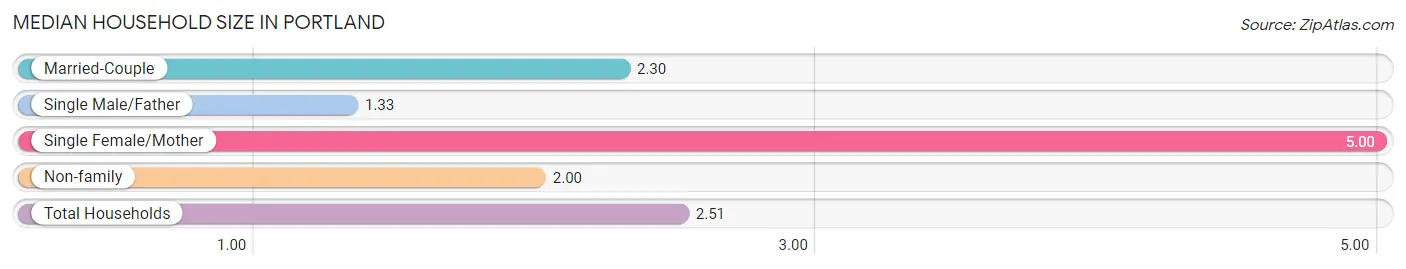
| Household Type | # Households | Household Size |
| Married-Couple | 37 (78.7%) | 2.30 |
| Single Male/Father | 3 (6.4%) | 1.33 |
| Single Female/Mother | 5 (10.6%) | 5.00 |
| Non-family | 2 (4.3%) | 2.00 |
| Total Households | 47 (100.0%) | 2.51 |
Household Size by Marriage Status in Portland
Out of a total of 47 households in Portland, 45 (95.7%) are family households, while 2 (4.3%) are nonfamily households. The most numerous type of family households are 2-person households, comprising 33, and the most common type of nonfamily households are 2-person households, comprising 2.
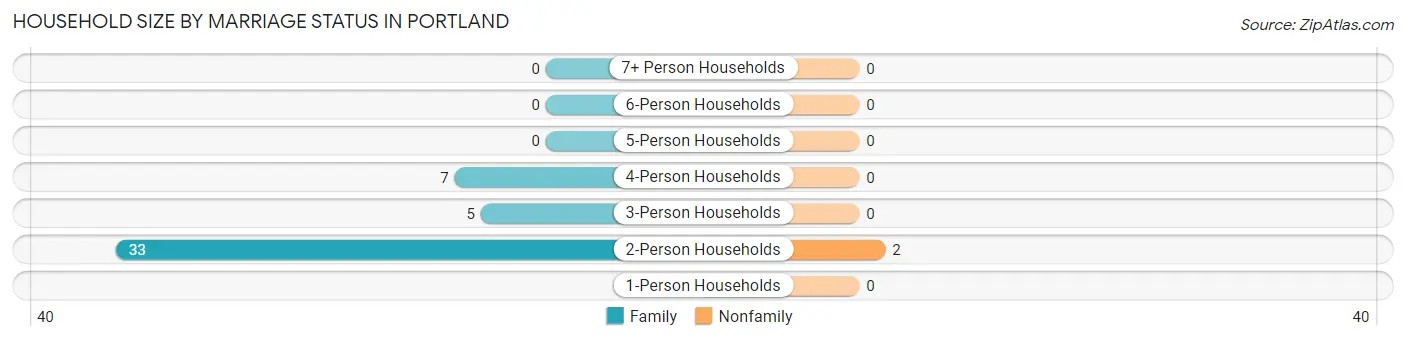
| Household Size | Family Households | Nonfamily Households |
| 1-Person Households | - | 0 (0.0%) |
| 2-Person Households | 33 (70.2%) | 2 (4.3%) |
| 3-Person Households | 5 (10.6%) | 0 (0.0%) |
| 4-Person Households | 7 (14.9%) | 0 (0.0%) |
| 5-Person Households | 0 (0.0%) | 0 (0.0%) |
| 6-Person Households | 0 (0.0%) | 0 (0.0%) |
| 7+ Person Households | 0 (0.0%) | 0 (0.0%) |
| Total | 45 (95.7%) | 2 (4.3%) |
Female Fertility in Portland
Fertility by Age in Portland
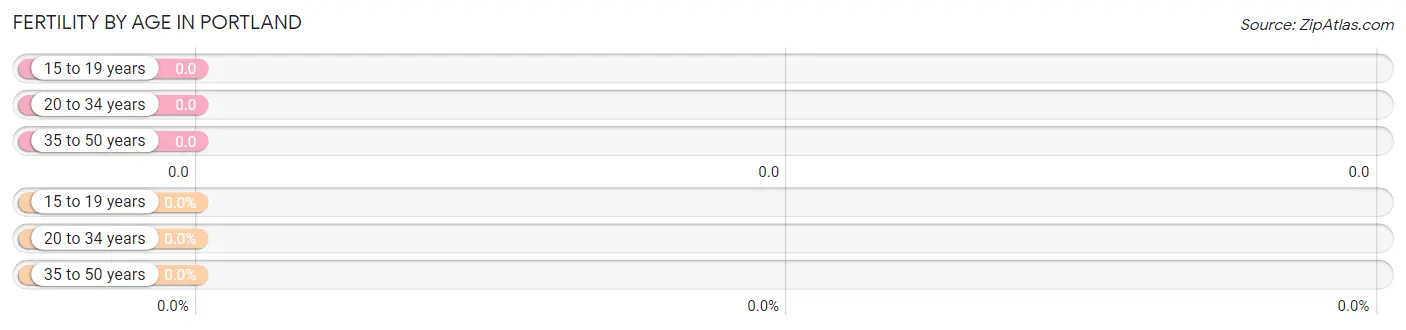
| Age Bracket | Women with Births | Births / 1,000 Women |
| 15 to 19 years | 0 (0.0%) | 0.0 |
| 20 to 34 years | 0 (0.0%) | 0.0 |
| 35 to 50 years | 0 (0.0%) | 0.0 |
| Total | 0 (0.0%) | 0.0 |
Fertility by Age by Marriage Status in Portland
| Age Bracket | Married | Unmarried |
| 15 to 19 years | 0 (0.0%) | 0 (0.0%) |
| 20 to 34 years | 0 (0.0%) | 0 (0.0%) |
| 35 to 50 years | 0 (0.0%) | 0 (0.0%) |
| Total | 0 (0.0%) | 0 (0.0%) |
Fertility by Education in Portland
| Educational Attainment | Women with Births | Births / 1,000 Women |
| Less than High School | 0 (0.0%) | 0.0 |
| High School Diploma | 0 (0.0%) | 0.0 |
| College or Associate's Degree | 0 (0.0%) | 0.0 |
| Bachelor's Degree | 0 (0.0%) | 0.0 |
| Graduate Degree | 0 (0.0%) | 0.0 |
| Total | 0 (0.0%) | 0.0 |
Fertility by Education by Marriage Status in Portland
| Educational Attainment | Married | Unmarried |
| Less than High School | 0 (0.0%) | 0 (0.0%) |
| High School Diploma | 0 (0.0%) | 0 (0.0%) |
| College or Associate's Degree | 0 (0.0%) | 0 (0.0%) |
| Bachelor's Degree | 0 (0.0%) | 0 (0.0%) |
| Graduate Degree | 0 (0.0%) | 0 (0.0%) |
| Total | 0 (0.0%) | 0 (0.0%) |
Employment Characteristics in Portland
Employment by Class of Employer in Portland
Among the 48 employed individuals in Portland, private company employees (16 | 33.3%), federal government employees (9 | 18.8%), and self-employed (incorporated) (8 | 16.7%) make up the most common classes of employment.
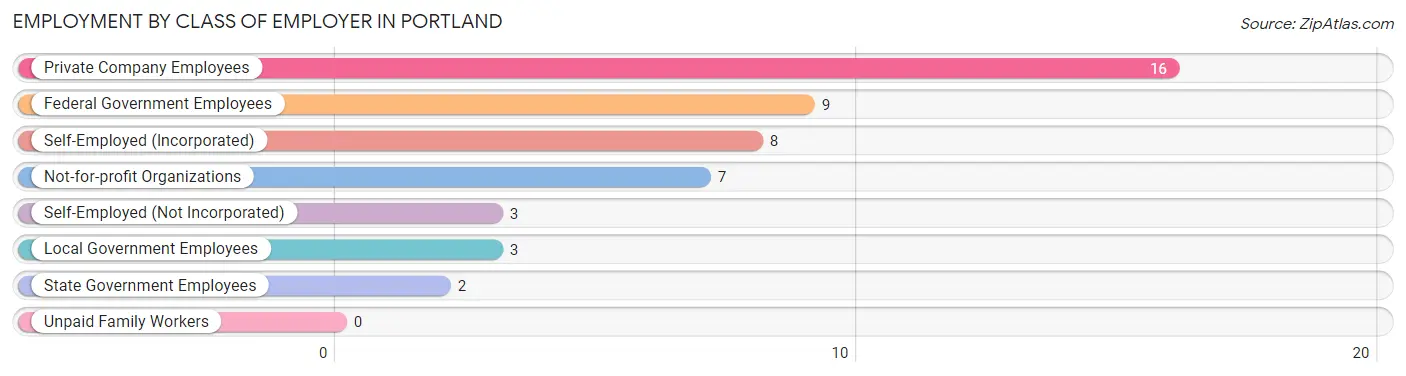
| Employer Class | # Employees | % Employees |
| Private Company Employees | 16 | 33.3% |
| Self-Employed (Incorporated) | 8 | 16.7% |
| Self-Employed (Not Incorporated) | 3 | 6.2% |
| Not-for-profit Organizations | 7 | 14.6% |
| Local Government Employees | 3 | 6.2% |
| State Government Employees | 2 | 4.2% |
| Federal Government Employees | 9 | 18.8% |
| Unpaid Family Workers | 0 | 0.0% |
| Total | 48 | 100.0% |
Employment Status by Age in Portland
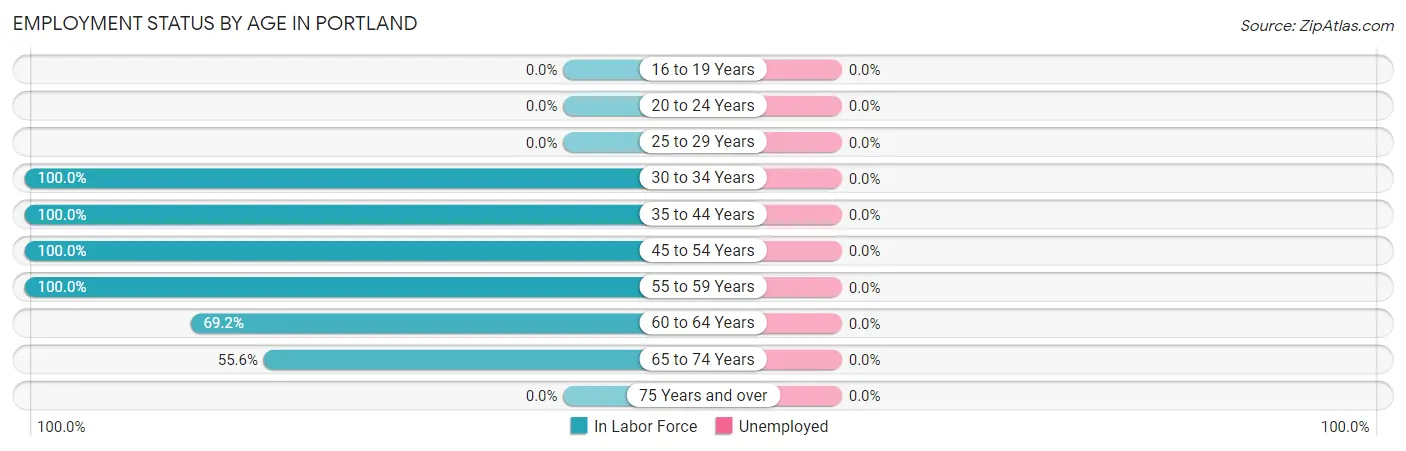
| Age Bracket | In Labor Force | Unemployed |
| 16 to 19 Years | 0 (0.0%) | 0 (0.0%) |
| 20 to 24 Years | 0 (0.0%) | 0 (0.0%) |
| 25 to 29 Years | 0 (0.0%) | 0 (0.0%) |
| 30 to 34 Years | 8 (100.0%) | 0 (0.0%) |
| 35 to 44 Years | 3 (100.0%) | 0 (0.0%) |
| 45 to 54 Years | 19 (100.0%) | 0 (0.0%) |
| 55 to 59 Years | 7 (100.0%) | 0 (0.0%) |
| 60 to 64 Years | 9 (69.2%) | 0 (0.0%) |
| 65 to 74 Years | 5 (55.6%) | 0 (0.0%) |
| 75 Years and over | 0 (0.0%) | 0 (0.0%) |
| Total | 51 (48.6%) | 0 (0.0%) |
Employment Status by Educational Attainment in Portland
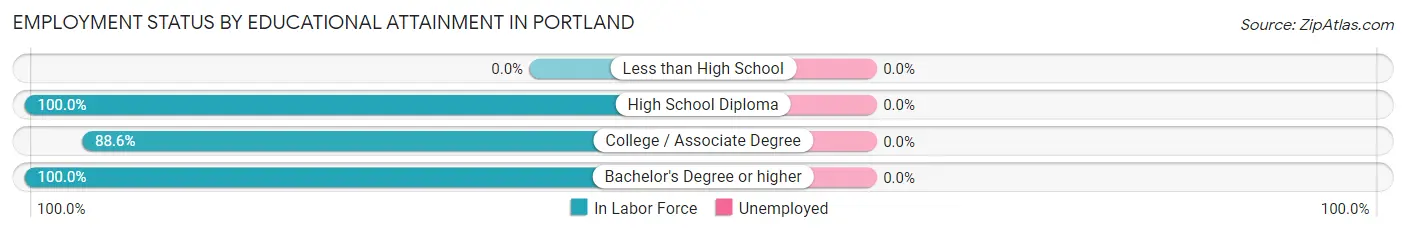
| Educational Attainment | In Labor Force | Unemployed |
| Less than High School | 0 (0.0%) | 0 (0.0%) |
| High School Diploma | 6 (100.0%) | 0 (0.0%) |
| College / Associate Degree | 31 (88.6%) | 0 (0.0%) |
| Bachelor's Degree or higher | 9 (100.0%) | 0 (0.0%) |
| Total | 46 (92.0%) | 0 (0.0%) |
Employment Occupations by Sex in Portland
Management, Business, Science and Arts Occupations
The most common Management, Business, Science and Arts occupations in Portland are Community & Social Service (7 | 13.7%), Education, Arts & Media (7 | 13.7%), and Management (6 | 11.8%).
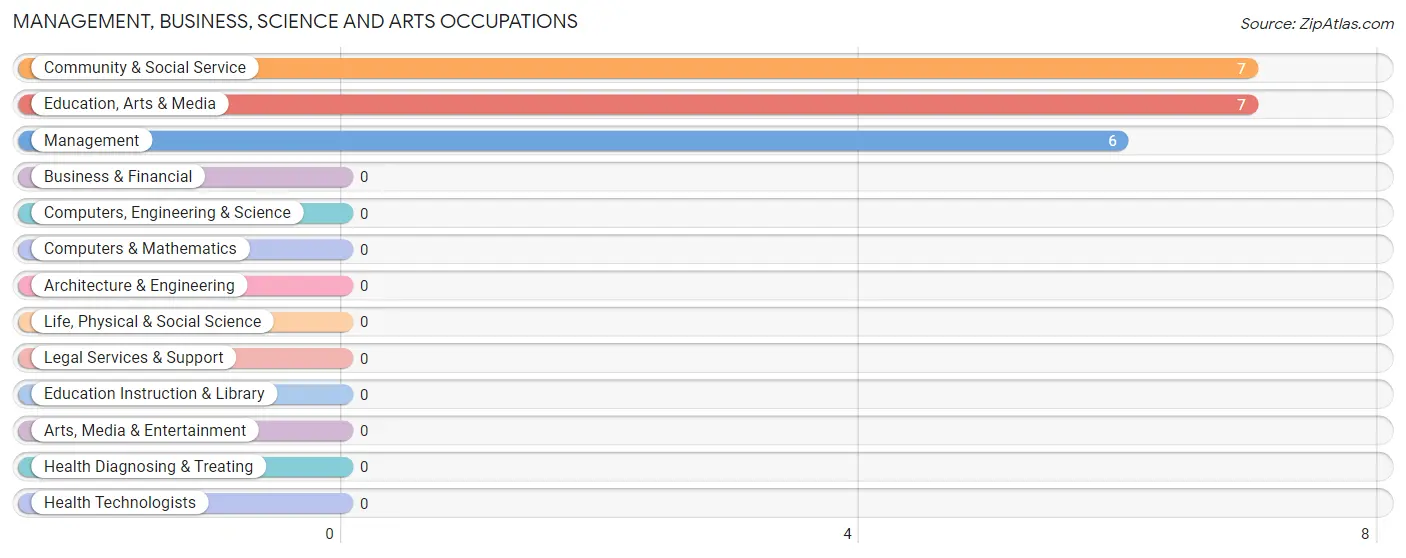
Management, Business, Science and Arts Occupations by Sex
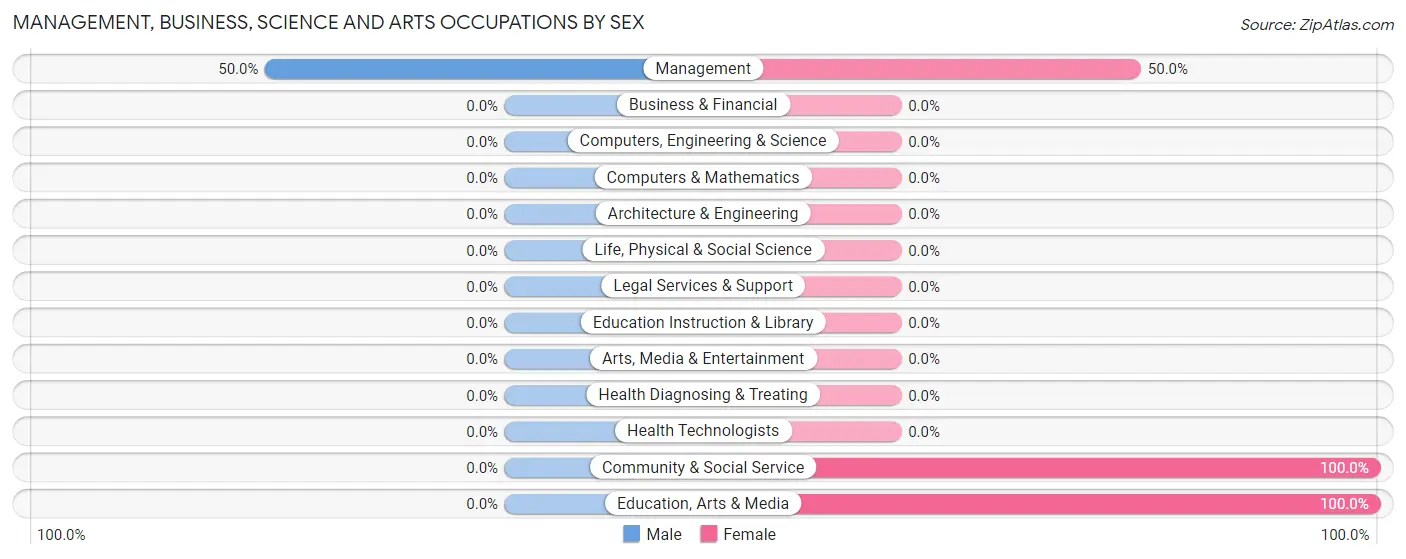
| Occupation | Male | Female |
| Management | 3 (50.0%) | 3 (50.0%) |
| Business & Financial | 0 (0.0%) | 0 (0.0%) |
| Computers, Engineering & Science | 0 (0.0%) | 0 (0.0%) |
| Computers & Mathematics | 0 (0.0%) | 0 (0.0%) |
| Architecture & Engineering | 0 (0.0%) | 0 (0.0%) |
| Life, Physical & Social Science | 0 (0.0%) | 0 (0.0%) |
| Community & Social Service | 0 (0.0%) | 7 (100.0%) |
| Education, Arts & Media | 0 (0.0%) | 7 (100.0%) |
| Legal Services & Support | 0 (0.0%) | 0 (0.0%) |
| Education Instruction & Library | 0 (0.0%) | 0 (0.0%) |
| Arts, Media & Entertainment | 0 (0.0%) | 0 (0.0%) |
| Health Diagnosing & Treating | 0 (0.0%) | 0 (0.0%) |
| Health Technologists | 0 (0.0%) | 0 (0.0%) |
| Total (Category) | 3 (23.1%) | 10 (76.9%) |
| Total (Overall) | 25 (49.0%) | 26 (51.0%) |
Services Occupations
The most common Services occupations in Portland are Cleaning & Maintenance (6 | 11.8%), and Personal Care & Service (2 | 3.9%).
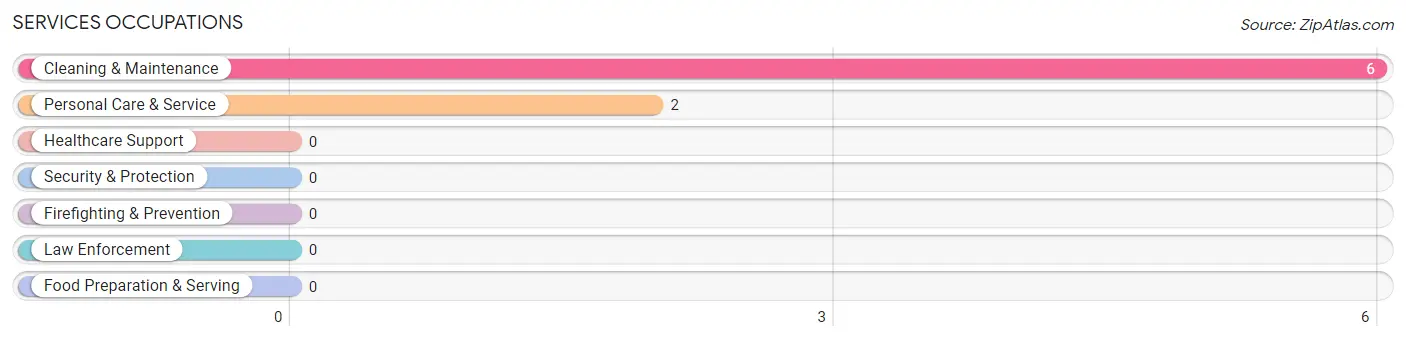
Services Occupations by Sex
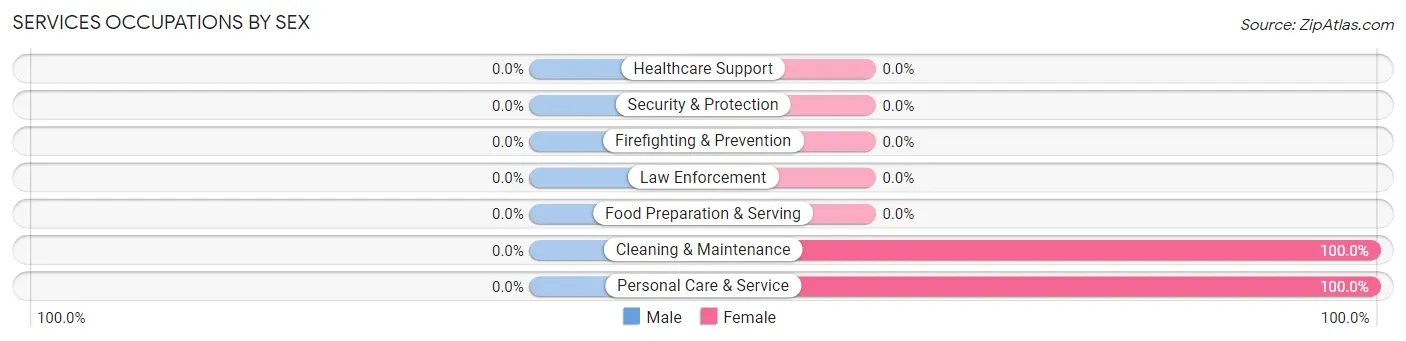
| Occupation | Male | Female |
| Healthcare Support | 0 (0.0%) | 0 (0.0%) |
| Security & Protection | 0 (0.0%) | 0 (0.0%) |
| Firefighting & Prevention | 0 (0.0%) | 0 (0.0%) |
| Law Enforcement | 0 (0.0%) | 0 (0.0%) |
| Food Preparation & Serving | 0 (0.0%) | 0 (0.0%) |
| Cleaning & Maintenance | 0 (0.0%) | 6 (100.0%) |
| Personal Care & Service | 0 (0.0%) | 2 (100.0%) |
| Total (Category) | 0 (0.0%) | 8 (100.0%) |
| Total (Overall) | 25 (49.0%) | 26 (51.0%) |
Sales and Office Occupations
The most common Sales and Office occupations in Portland are Office & Administration (8 | 15.7%), and Sales & Related (5 | 9.8%).
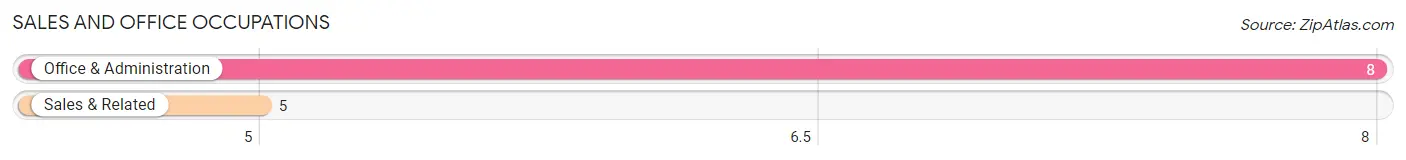
Sales and Office Occupations by Sex
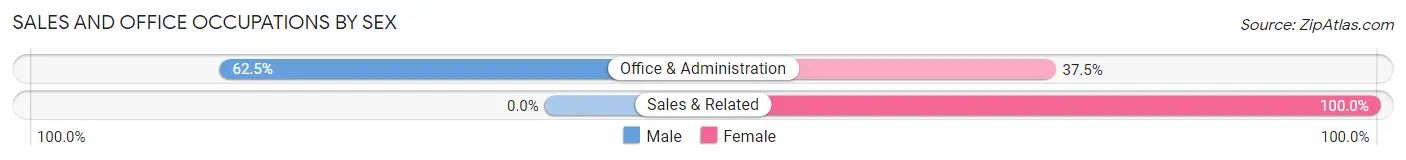
| Occupation | Male | Female |
| Sales & Related | 0 (0.0%) | 5 (100.0%) |
| Office & Administration | 5 (62.5%) | 3 (37.5%) |
| Total (Category) | 5 (38.5%) | 8 (61.5%) |
| Total (Overall) | 25 (49.0%) | 26 (51.0%) |
Natural Resources, Construction and Maintenance Occupations
Natural Resources, Construction and Maintenance Occupations by Sex
| Occupation | Male | Female |
| Farming, Fishing & Forestry | 0 (0.0%) | 0 (0.0%) |
| Construction & Extraction | 0 (0.0%) | 0 (0.0%) |
| Installation, Maintenance & Repair | 0 (0.0%) | 0 (0.0%) |
| Total (Category) | 0 (0.0%) | 0 (0.0%) |
| Total (Overall) | 25 (49.0%) | 26 (51.0%) |
Production, Transportation and Moving Occupations
The most common Production, Transportation and Moving occupations in Portland are Material Moving (8 | 15.7%), Production (6 | 11.8%), and Transportation (3 | 5.9%).
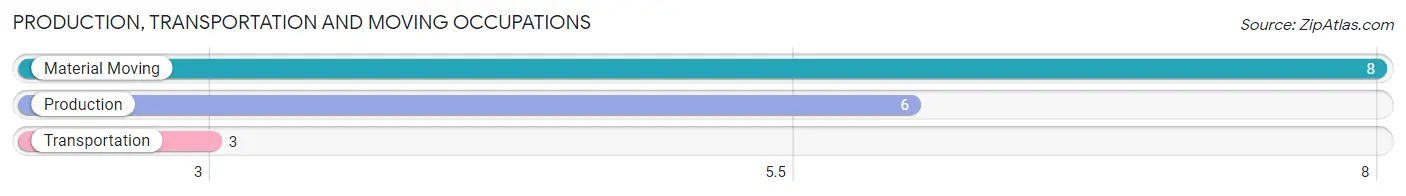
Production, Transportation and Moving Occupations by Sex
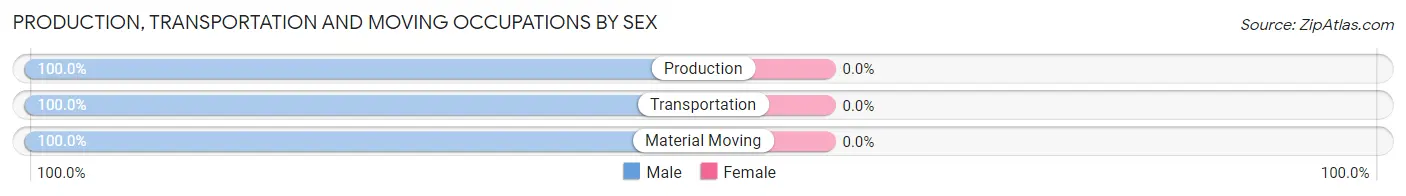
| Occupation | Male | Female |
| Production | 6 (100.0%) | 0 (0.0%) |
| Transportation | 3 (100.0%) | 0 (0.0%) |
| Material Moving | 8 (100.0%) | 0 (0.0%) |
| Total (Category) | 17 (100.0%) | 0 (0.0%) |
| Total (Overall) | 25 (49.0%) | 26 (51.0%) |
Employment Industries by Sex in Portland
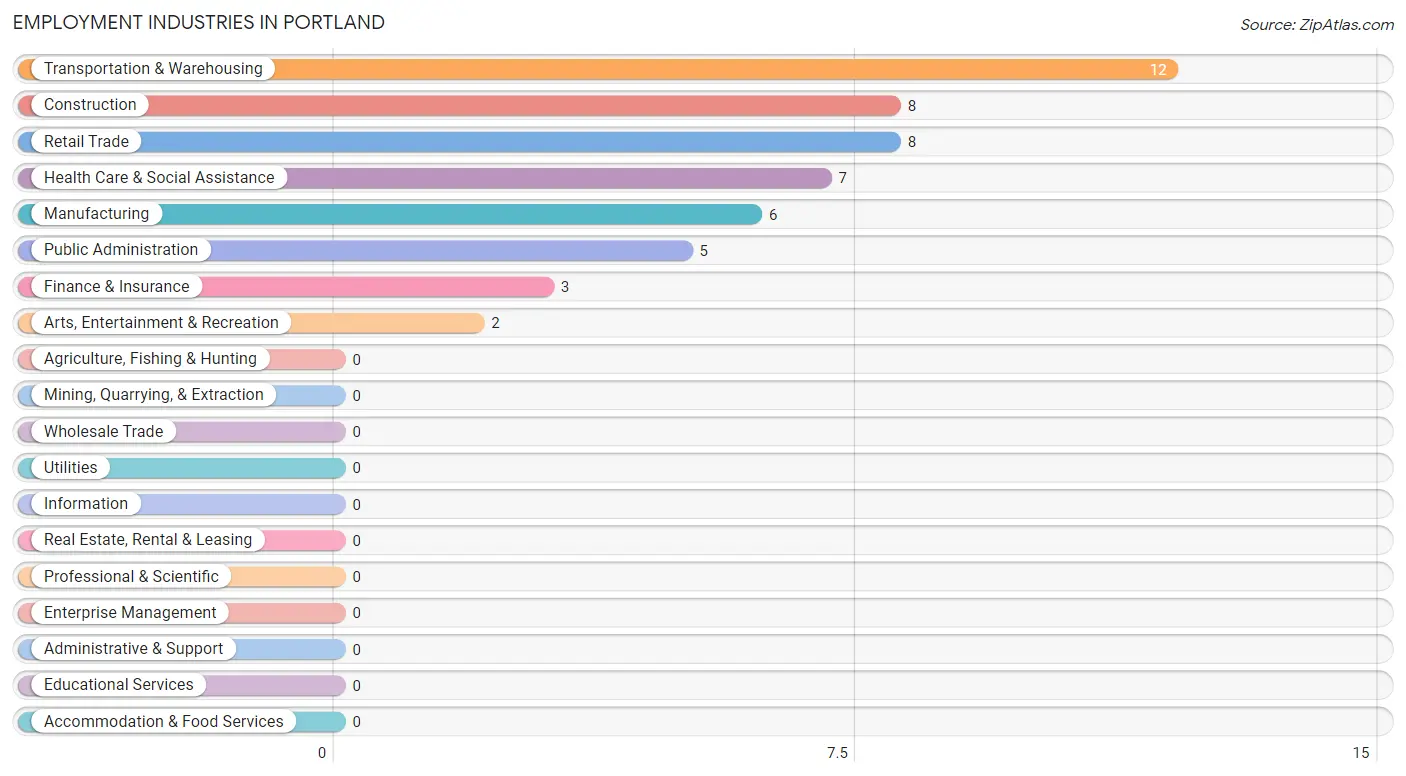
Employment Industries in Portland
The major employment industries in Portland include Transportation & Warehousing (12 | 23.5%), Construction (8 | 15.7%), Retail Trade (8 | 15.7%), Health Care & Social Assistance (7 | 13.7%), and Manufacturing (6 | 11.8%).
Employment Industries by Sex in Portland
The Portland industries that see more men than women are Construction (100.0%), Manufacturing (100.0%), and Public Administration (100.0%), whereas the industries that tend to have a higher number of women are Retail Trade (100.0%), Finance & Insurance (100.0%), and Health Care & Social Assistance (100.0%).
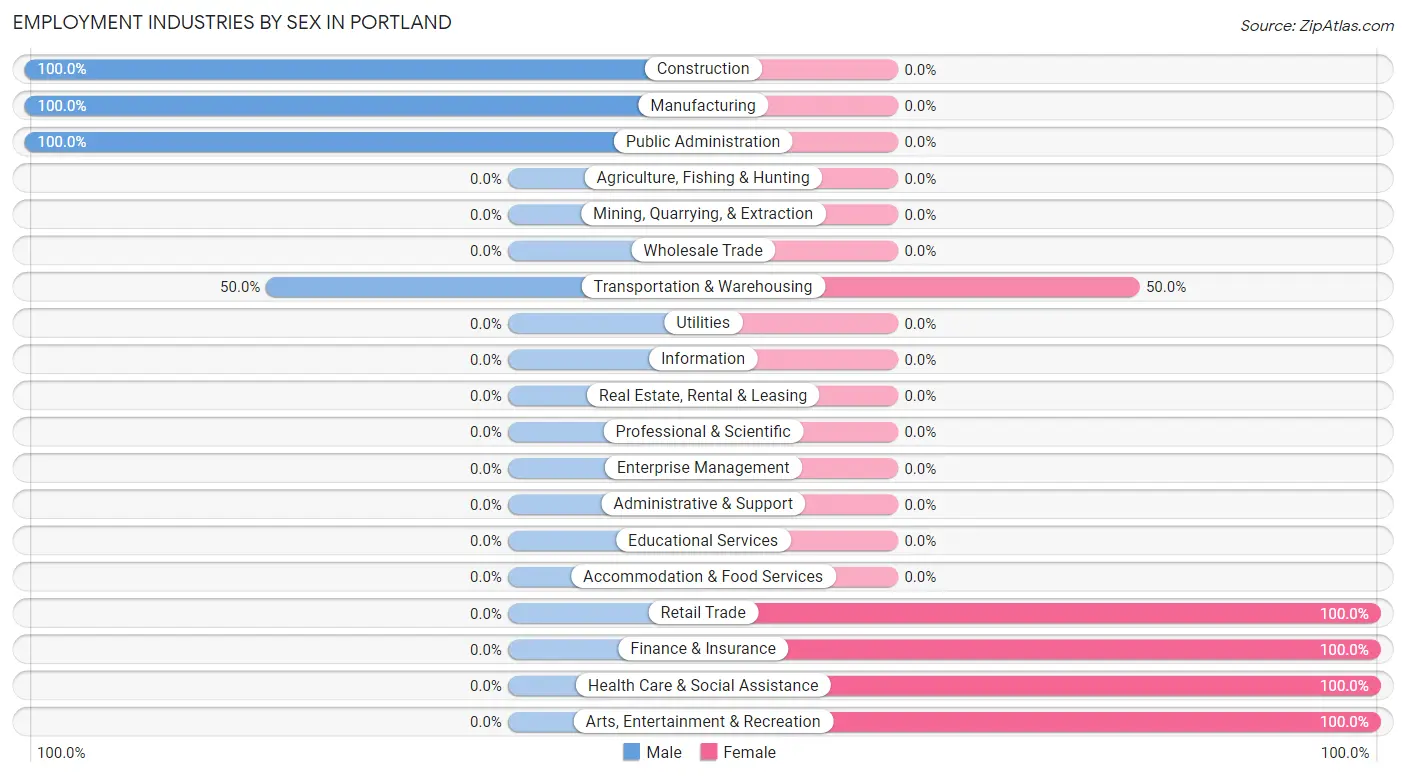
| Industry | Male | Female |
| Agriculture, Fishing & Hunting | 0 (0.0%) | 0 (0.0%) |
| Mining, Quarrying, & Extraction | 0 (0.0%) | 0 (0.0%) |
| Construction | 8 (100.0%) | 0 (0.0%) |
| Manufacturing | 6 (100.0%) | 0 (0.0%) |
| Wholesale Trade | 0 (0.0%) | 0 (0.0%) |
| Retail Trade | 0 (0.0%) | 8 (100.0%) |
| Transportation & Warehousing | 6 (50.0%) | 6 (50.0%) |
| Utilities | 0 (0.0%) | 0 (0.0%) |
| Information | 0 (0.0%) | 0 (0.0%) |
| Finance & Insurance | 0 (0.0%) | 3 (100.0%) |
| Real Estate, Rental & Leasing | 0 (0.0%) | 0 (0.0%) |
| Professional & Scientific | 0 (0.0%) | 0 (0.0%) |
| Enterprise Management | 0 (0.0%) | 0 (0.0%) |
| Administrative & Support | 0 (0.0%) | 0 (0.0%) |
| Educational Services | 0 (0.0%) | 0 (0.0%) |
| Health Care & Social Assistance | 0 (0.0%) | 7 (100.0%) |
| Arts, Entertainment & Recreation | 0 (0.0%) | 2 (100.0%) |
| Accommodation & Food Services | 0 (0.0%) | 0 (0.0%) |
| Public Administration | 5 (100.0%) | 0 (0.0%) |
| Total | 25 (49.0%) | 26 (51.0%) |
Education in Portland
School Enrollment in Portland
The most common levels of schooling among the 27 students in Portland are college / undergraduate (14 | 51.8%), kindergarten (7 | 25.9%), and elementary school (6 | 22.2%).
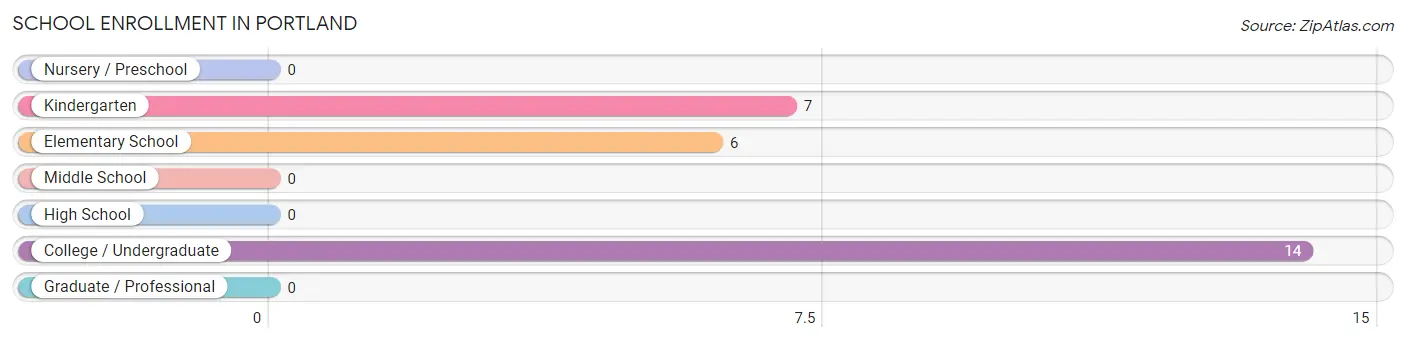
| School Level | # Students | % Students |
| Nursery / Preschool | 0 | 0.0% |
| Kindergarten | 7 | 25.9% |
| Elementary School | 6 | 22.2% |
| Middle School | 0 | 0.0% |
| High School | 0 | 0.0% |
| College / Undergraduate | 14 | 51.8% |
| Graduate / Professional | 0 | 0.0% |
| Total | 27 | 100.0% |
School Enrollment by Age by Funding Source in Portland
Out of a total of 27 students who are enrolled in schools in Portland, 14 (51.9%) attend a private institution, while the remaining 13 (48.1%) are enrolled in public schools. The age group of 20 to 24 year olds has the highest likelihood of being enrolled in private schools, with 14 (100.0% in the age bracket) enrolled. Conversely, the age group of 5 to 9 year old has the lowest likelihood of being enrolled in a private school, with 13 (100.0% in the age bracket) attending a public institution.
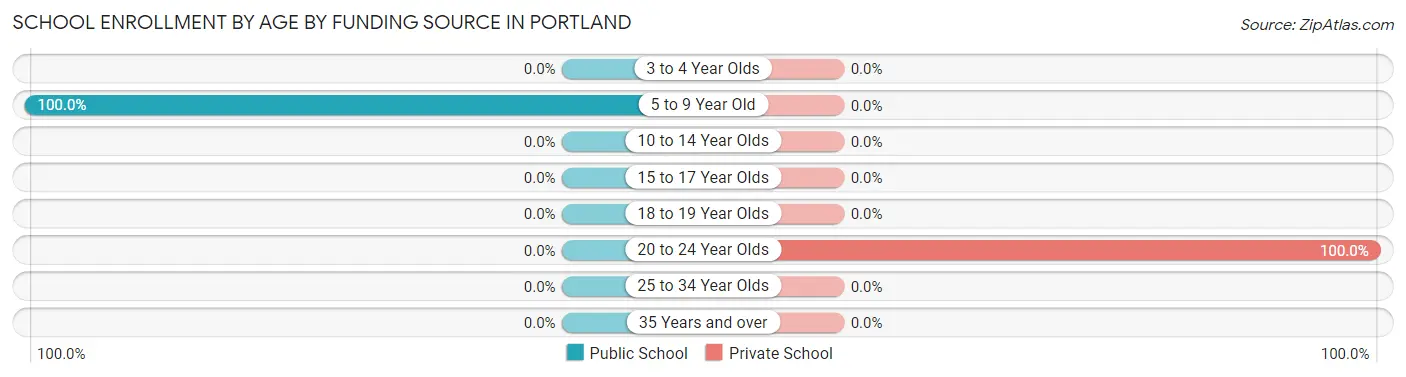
| Age Bracket | Public School | Private School |
| 3 to 4 Year Olds | 0 (0.0%) | 0 (0.0%) |
| 5 to 9 Year Old | 13 (100.0%) | 0 (0.0%) |
| 10 to 14 Year Olds | 0 (0.0%) | 0 (0.0%) |
| 15 to 17 Year Olds | 0 (0.0%) | 0 (0.0%) |
| 18 to 19 Year Olds | 0 (0.0%) | 0 (0.0%) |
| 20 to 24 Year Olds | 0 (0.0%) | 14 (100.0%) |
| 25 to 34 Year Olds | 0 (0.0%) | 0 (0.0%) |
| 35 Years and over | 0 (0.0%) | 0 (0.0%) |
| Total | 13 (48.1%) | 14 (51.9%) |
Educational Attainment by Field of Study in Portland
Psychology (7 | 50.0%), and arts & humanities (7 | 50.0%) are the most common fields of study among 14 individuals in Portland who have obtained a bachelor's degree or higher.
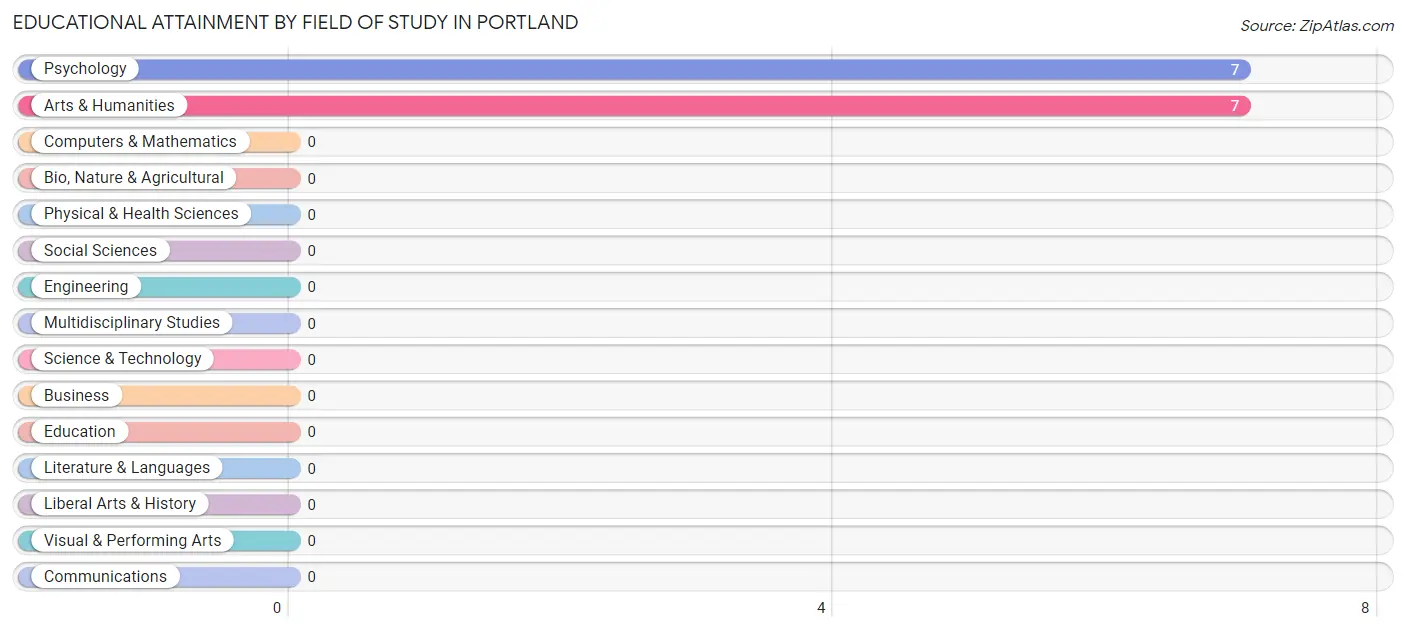
| Field of Study | # Graduates | % Graduates |
| Computers & Mathematics | 0 | 0.0% |
| Bio, Nature & Agricultural | 0 | 0.0% |
| Physical & Health Sciences | 0 | 0.0% |
| Psychology | 7 | 50.0% |
| Social Sciences | 0 | 0.0% |
| Engineering | 0 | 0.0% |
| Multidisciplinary Studies | 0 | 0.0% |
| Science & Technology | 0 | 0.0% |
| Business | 0 | 0.0% |
| Education | 0 | 0.0% |
| Literature & Languages | 0 | 0.0% |
| Liberal Arts & History | 0 | 0.0% |
| Visual & Performing Arts | 0 | 0.0% |
| Communications | 0 | 0.0% |
| Arts & Humanities | 7 | 50.0% |
| Total | 14 | 100.0% |
Transportation & Commute in Portland
Vehicle Availability by Sex in Portland
The most prevalent vehicle ownership categories in Portland are males with 3 vehicles (9, accounting for 40.9%) and females with 3 vehicles (17, making up 34.6%).
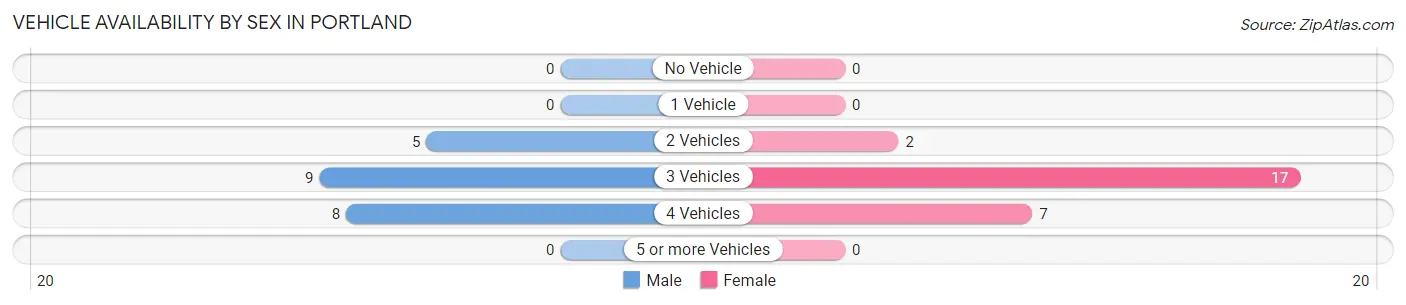
| Vehicles Available | Male | Female |
| No Vehicle | 0 (0.0%) | 0 (0.0%) |
| 1 Vehicle | 0 (0.0%) | 0 (0.0%) |
| 2 Vehicles | 5 (22.7%) | 2 (7.7%) |
| 3 Vehicles | 9 (40.9%) | 17 (65.4%) |
| 4 Vehicles | 8 (36.4%) | 7 (26.9%) |
| 5 or more Vehicles | 0 (0.0%) | 0 (0.0%) |
| Total | 22 (100.0%) | 26 (100.0%) |
Commute Time in Portland
The most frequently occuring commute durations in Portland are 10 to 14 minutes (13 commuters, 28.9%), 20 to 24 minutes (8 commuters, 17.8%), and 15 to 19 minutes (7 commuters, 15.6%).
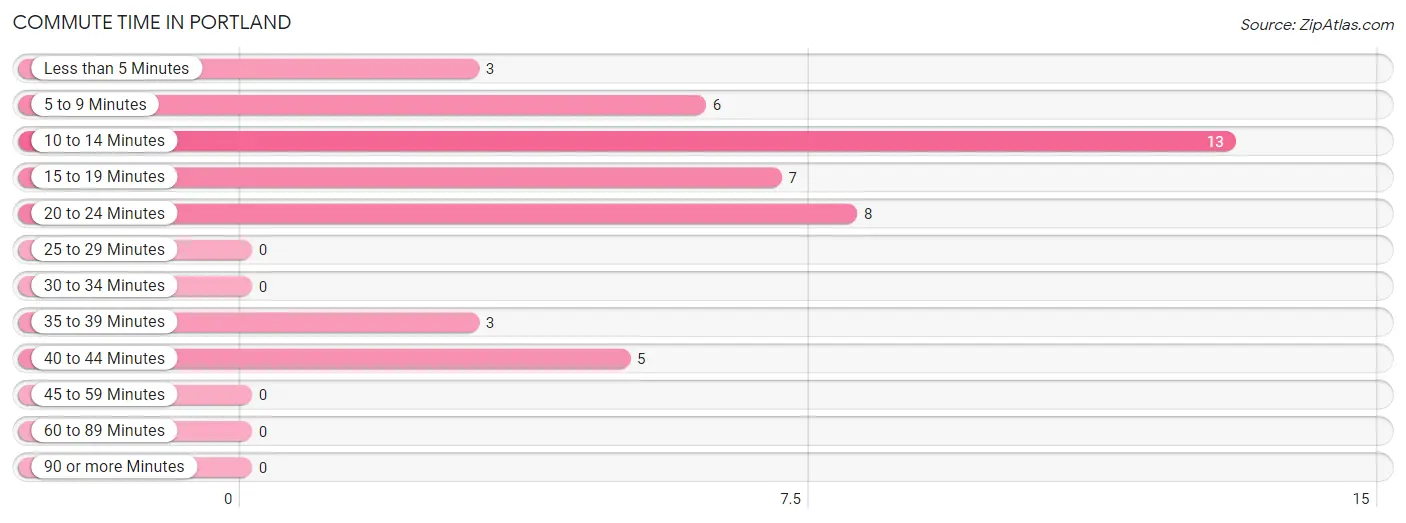
| Commute Time | # Commuters | % Commuters |
| Less than 5 Minutes | 3 | 6.7% |
| 5 to 9 Minutes | 6 | 13.3% |
| 10 to 14 Minutes | 13 | 28.9% |
| 15 to 19 Minutes | 7 | 15.6% |
| 20 to 24 Minutes | 8 | 17.8% |
| 25 to 29 Minutes | 0 | 0.0% |
| 30 to 34 Minutes | 0 | 0.0% |
| 35 to 39 Minutes | 3 | 6.7% |
| 40 to 44 Minutes | 5 | 11.1% |
| 45 to 59 Minutes | 0 | 0.0% |
| 60 to 89 Minutes | 0 | 0.0% |
| 90 or more Minutes | 0 | 0.0% |
Commute Time by Sex in Portland
The most common commute times in Portland are 20 to 24 minutes (8 commuters, 36.4%) for males and 10 to 14 minutes (13 commuters, 56.5%) for females.
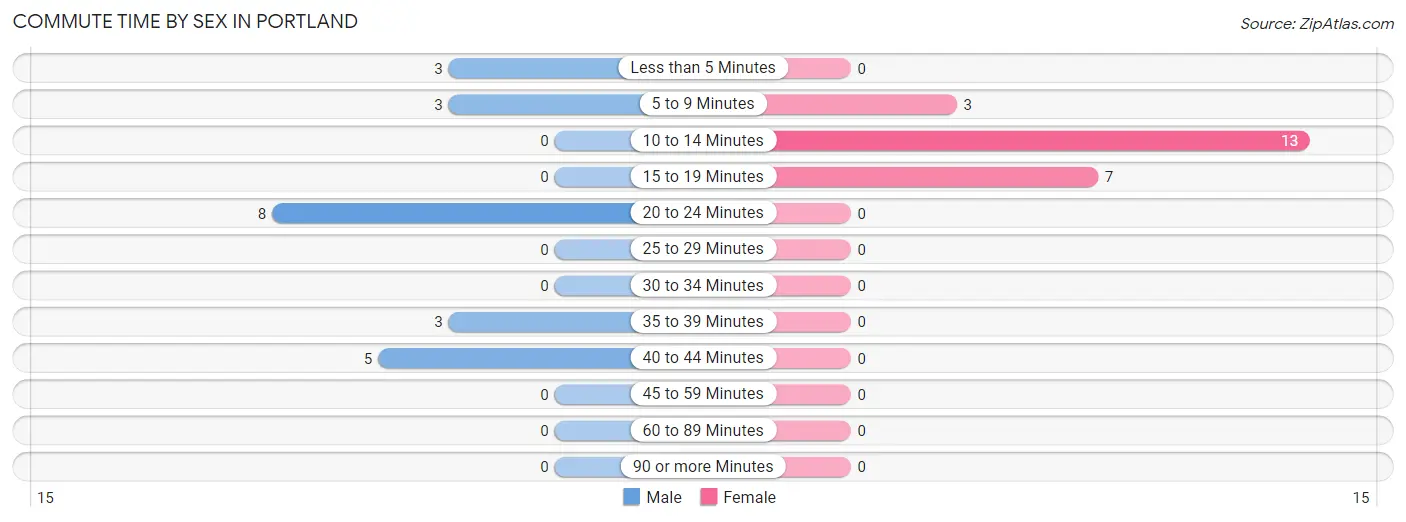
| Commute Time | Male | Female |
| Less than 5 Minutes | 3 (13.6%) | 0 (0.0%) |
| 5 to 9 Minutes | 3 (13.6%) | 3 (13.0%) |
| 10 to 14 Minutes | 0 (0.0%) | 13 (56.5%) |
| 15 to 19 Minutes | 0 (0.0%) | 7 (30.4%) |
| 20 to 24 Minutes | 8 (36.4%) | 0 (0.0%) |
| 25 to 29 Minutes | 0 (0.0%) | 0 (0.0%) |
| 30 to 34 Minutes | 0 (0.0%) | 0 (0.0%) |
| 35 to 39 Minutes | 3 (13.6%) | 0 (0.0%) |
| 40 to 44 Minutes | 5 (22.7%) | 0 (0.0%) |
| 45 to 59 Minutes | 0 (0.0%) | 0 (0.0%) |
| 60 to 89 Minutes | 0 (0.0%) | 0 (0.0%) |
| 90 or more Minutes | 0 (0.0%) | 0 (0.0%) |
Time of Departure to Work by Sex in Portland
The most frequent times of departure to work in Portland are 12:00 AM to 4:59 AM (8, 36.4%) for males and 7:30 AM to 7:59 AM (9, 39.1%) for females.
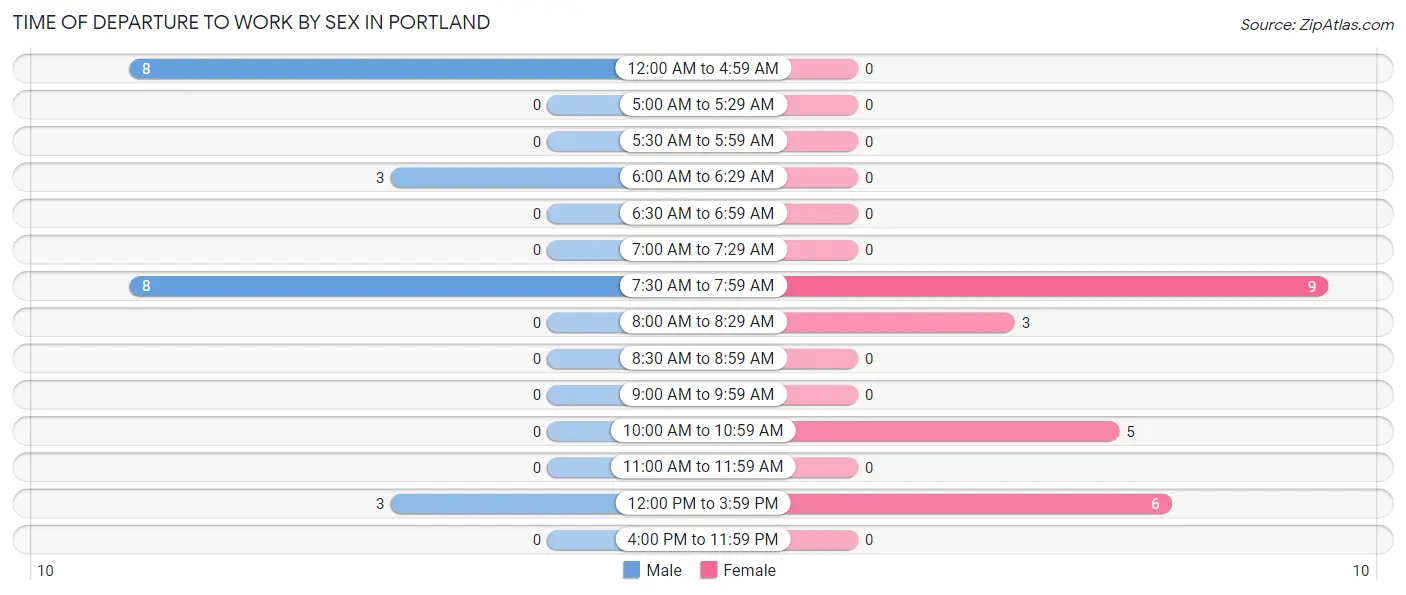
| Time of Departure | Male | Female |
| 12:00 AM to 4:59 AM | 8 (36.4%) | 0 (0.0%) |
| 5:00 AM to 5:29 AM | 0 (0.0%) | 0 (0.0%) |
| 5:30 AM to 5:59 AM | 0 (0.0%) | 0 (0.0%) |
| 6:00 AM to 6:29 AM | 3 (13.6%) | 0 (0.0%) |
| 6:30 AM to 6:59 AM | 0 (0.0%) | 0 (0.0%) |
| 7:00 AM to 7:29 AM | 0 (0.0%) | 0 (0.0%) |
| 7:30 AM to 7:59 AM | 8 (36.4%) | 9 (39.1%) |
| 8:00 AM to 8:29 AM | 0 (0.0%) | 3 (13.0%) |
| 8:30 AM to 8:59 AM | 0 (0.0%) | 0 (0.0%) |
| 9:00 AM to 9:59 AM | 0 (0.0%) | 0 (0.0%) |
| 10:00 AM to 10:59 AM | 0 (0.0%) | 5 (21.7%) |
| 11:00 AM to 11:59 AM | 0 (0.0%) | 0 (0.0%) |
| 12:00 PM to 3:59 PM | 3 (13.6%) | 6 (26.1%) |
| 4:00 PM to 11:59 PM | 0 (0.0%) | 0 (0.0%) |
| Total | 22 (100.0%) | 23 (100.0%) |
Housing Occupancy in Portland
Occupancy by Ownership in Portland
Of the total 47 dwellings in Portland, owner-occupied units account for 47 (100.0%), while renter-occupied units make up 0 (0.0%).
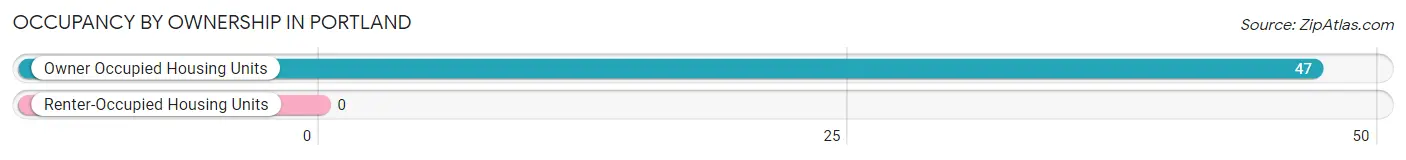
| Occupancy | # Housing Units | % Housing Units |
| Owner Occupied Housing Units | 47 | 100.0% |
| Renter-Occupied Housing Units | 0 | 0.0% |
| Total Occupied Housing Units | 47 | 100.0% |
Occupancy by Household Size in Portland
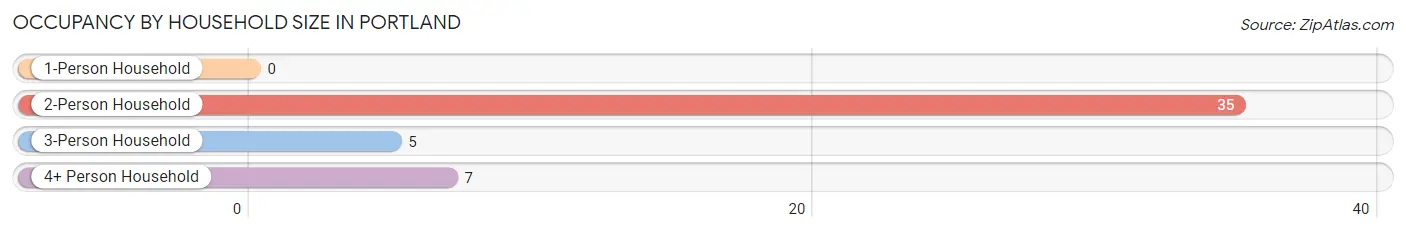
| Household Size | # Housing Units | % Housing Units |
| 1-Person Household | 0 | 0.0% |
| 2-Person Household | 35 | 74.5% |
| 3-Person Household | 5 | 10.6% |
| 4+ Person Household | 7 | 14.9% |
| Total Housing Units | 47 | 100.0% |
Occupancy by Ownership by Household Size in Portland
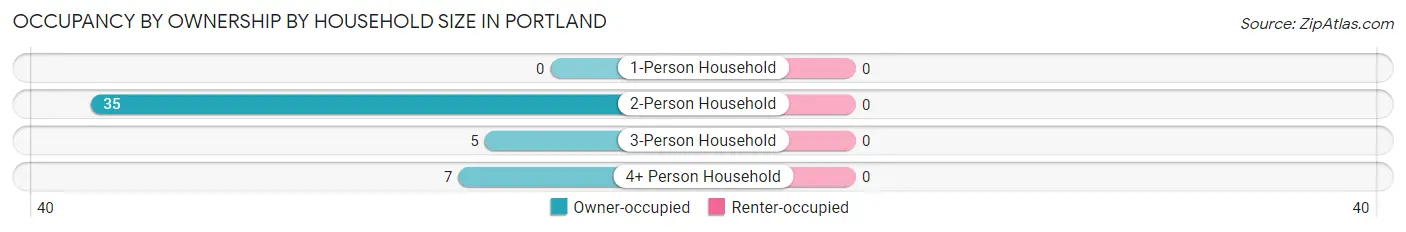
| Household Size | Owner-occupied | Renter-occupied |
| 1-Person Household | 0 (0.0%) | 0 (0.0%) |
| 2-Person Household | 35 (100.0%) | 0 (0.0%) |
| 3-Person Household | 5 (100.0%) | 0 (0.0%) |
| 4+ Person Household | 7 (100.0%) | 0 (0.0%) |
| Total Housing Units | 47 (100.0%) | 0 (0.0%) |
Occupancy by Educational Attainment in Portland
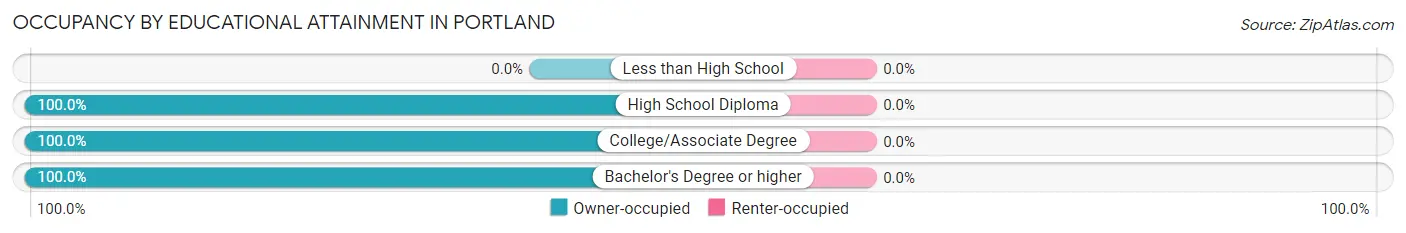
| Household Size | Owner-occupied | Renter-occupied |
| Less than High School | 0 (0.0%) | 0 (0.0%) |
| High School Diploma | 20 (100.0%) | 0 (0.0%) |
| College/Associate Degree | 13 (100.0%) | 0 (0.0%) |
| Bachelor's Degree or higher | 14 (100.0%) | 0 (0.0%) |
Occupancy by Age of Householder in Portland
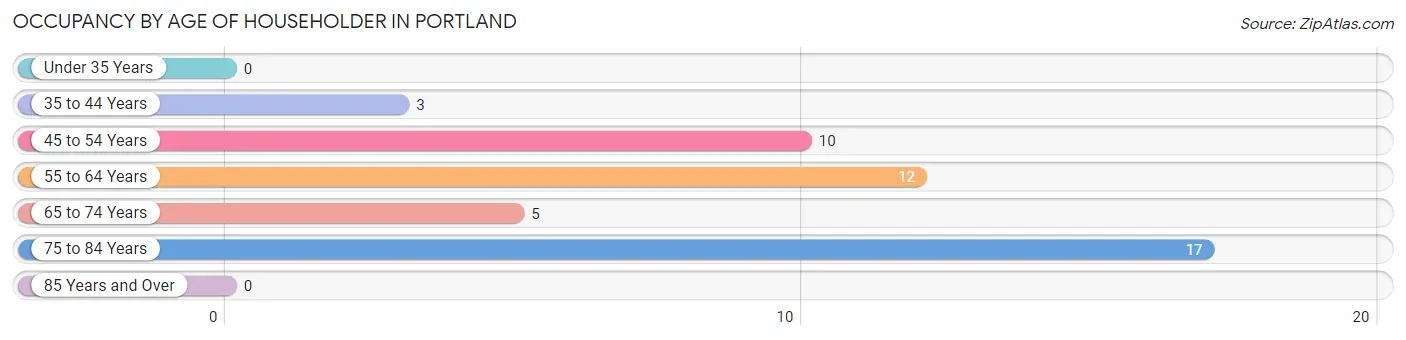
| Age Bracket | # Households | % Households |
| Under 35 Years | 0 | 0.0% |
| 35 to 44 Years | 3 | 6.4% |
| 45 to 54 Years | 10 | 21.3% |
| 55 to 64 Years | 12 | 25.5% |
| 65 to 74 Years | 5 | 10.6% |
| 75 to 84 Years | 17 | 36.2% |
| 85 Years and Over | 0 | 0.0% |
| Total | 47 | 100.0% |
Housing Finances in Portland
Median Income by Occupancy in Portland
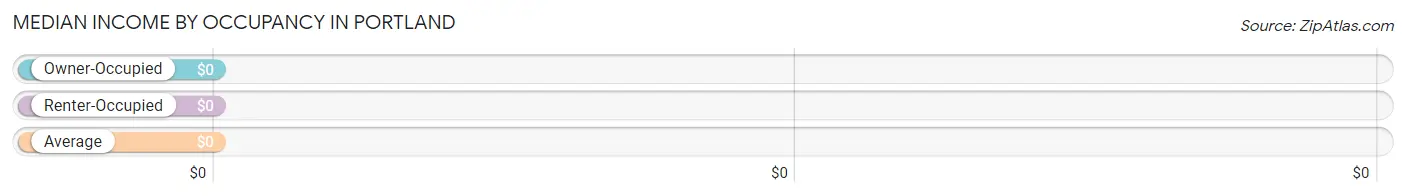
| Occupancy Type | # Households | Median Income |
| Owner-Occupied | 47 (100.0%) | $0 |
| Renter-Occupied | 0 (0.0%) | $0 |
| Average | 47 (100.0%) | $0 |
Occupancy by Householder Income Bracket in Portland
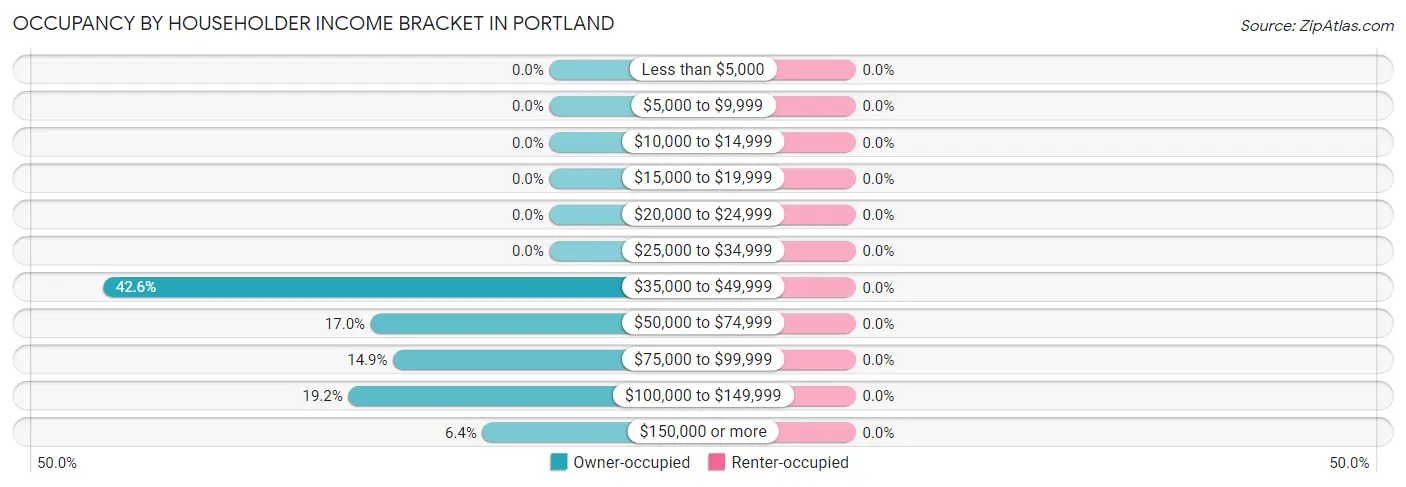
| Income Bracket | Owner-occupied | Renter-occupied |
| Less than $5,000 | 0 (0.0%) | 0 (0.0%) |
| $5,000 to $9,999 | 0 (0.0%) | 0 (0.0%) |
| $10,000 to $14,999 | 0 (0.0%) | 0 (0.0%) |
| $15,000 to $19,999 | 0 (0.0%) | 0 (0.0%) |
| $20,000 to $24,999 | 0 (0.0%) | 0 (0.0%) |
| $25,000 to $34,999 | 0 (0.0%) | 0 (0.0%) |
| $35,000 to $49,999 | 20 (42.5%) | 0 (0.0%) |
| $50,000 to $74,999 | 8 (17.0%) | 0 (0.0%) |
| $75,000 to $99,999 | 7 (14.9%) | 0 (0.0%) |
| $100,000 to $149,999 | 9 (19.2%) | 0 (0.0%) |
| $150,000 or more | 3 (6.4%) | 0 (0.0%) |
| Total | 47 (100.0%) | 0 (0.0%) |
Monthly Housing Cost Tiers in Portland
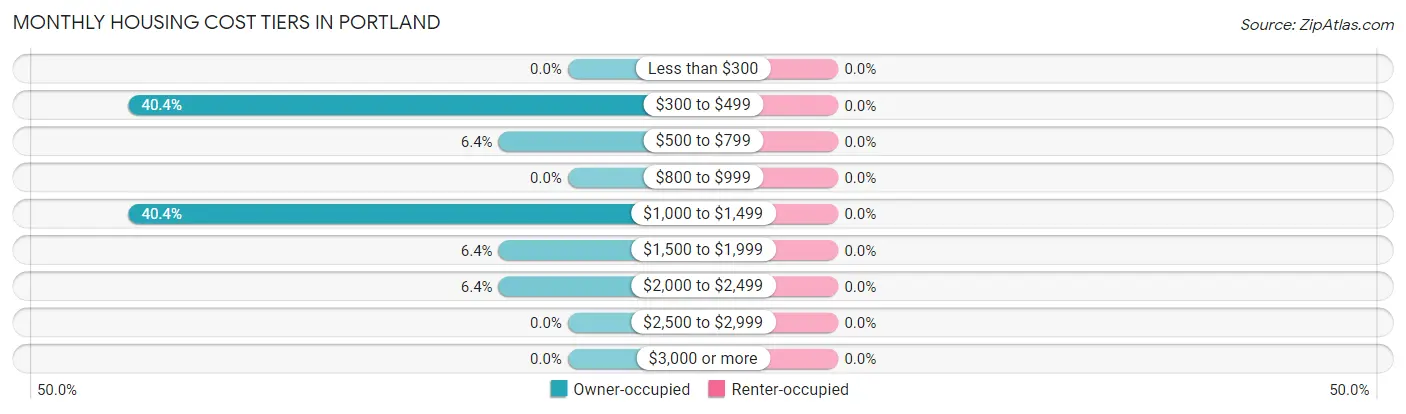
| Monthly Cost | Owner-occupied | Renter-occupied |
| Less than $300 | 0 (0.0%) | 0 (0.0%) |
| $300 to $499 | 19 (40.4%) | 0 (0.0%) |
| $500 to $799 | 3 (6.4%) | 0 (0.0%) |
| $800 to $999 | 0 (0.0%) | 0 (0.0%) |
| $1,000 to $1,499 | 19 (40.4%) | 0 (0.0%) |
| $1,500 to $1,999 | 3 (6.4%) | 0 (0.0%) |
| $2,000 to $2,499 | 3 (6.4%) | 0 (0.0%) |
| $2,500 to $2,999 | 0 (0.0%) | 0 (0.0%) |
| $3,000 or more | 0 (0.0%) | 0 (0.0%) |
| Total | 47 (100.0%) | 0 (0.0%) |
Physical Housing Characteristics in Portland
Housing Structures in Portland
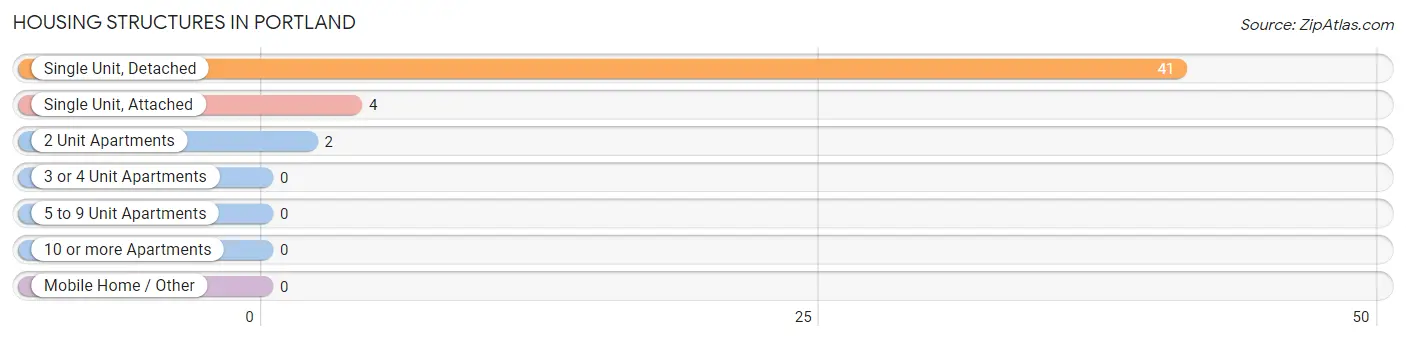
| Structure Type | # Housing Units | % Housing Units |
| Single Unit, Detached | 41 | 87.2% |
| Single Unit, Attached | 4 | 8.5% |
| 2 Unit Apartments | 2 | 4.3% |
| 3 or 4 Unit Apartments | 0 | 0.0% |
| 5 to 9 Unit Apartments | 0 | 0.0% |
| 10 or more Apartments | 0 | 0.0% |
| Mobile Home / Other | 0 | 0.0% |
| Total | 47 | 100.0% |
Housing Structures by Occupancy in Portland
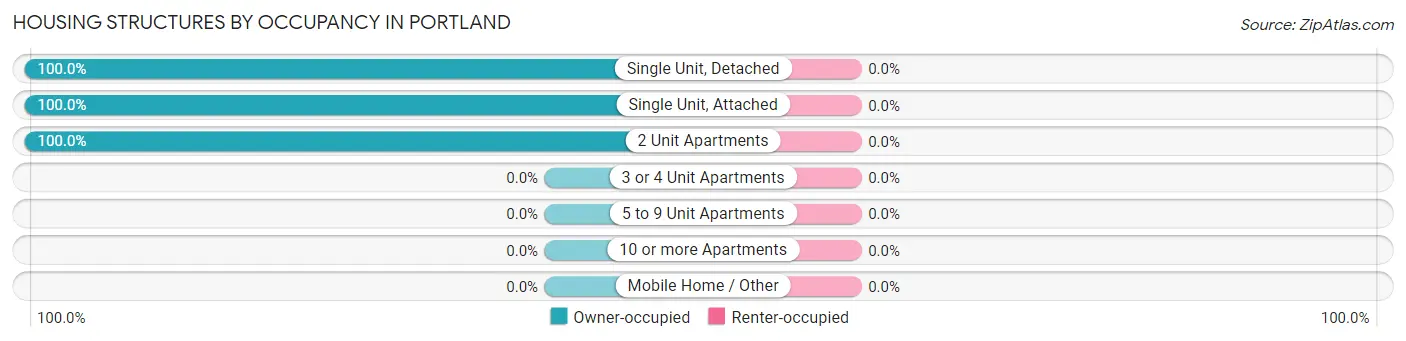
| Structure Type | Owner-occupied | Renter-occupied |
| Single Unit, Detached | 41 (100.0%) | 0 (0.0%) |
| Single Unit, Attached | 4 (100.0%) | 0 (0.0%) |
| 2 Unit Apartments | 2 (100.0%) | 0 (0.0%) |
| 3 or 4 Unit Apartments | 0 (0.0%) | 0 (0.0%) |
| 5 to 9 Unit Apartments | 0 (0.0%) | 0 (0.0%) |
| 10 or more Apartments | 0 (0.0%) | 0 (0.0%) |
| Mobile Home / Other | 0 (0.0%) | 0 (0.0%) |
| Total | 47 (100.0%) | 0 (0.0%) |
Housing Structures by Number of Rooms in Portland
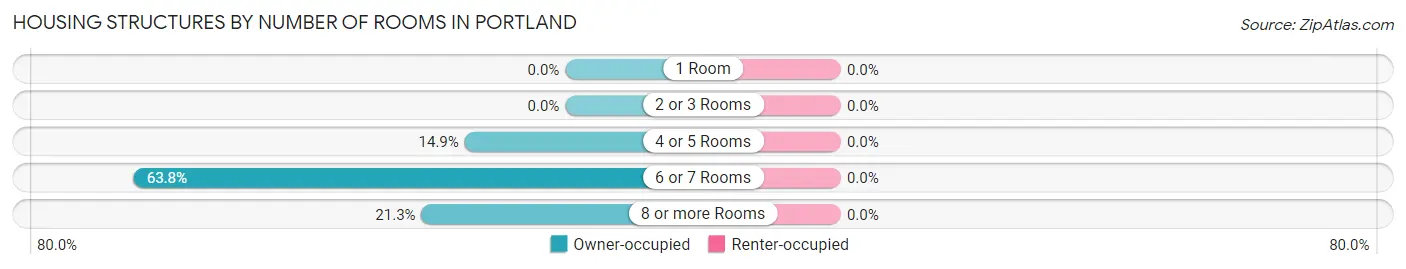
| Number of Rooms | Owner-occupied | Renter-occupied |
| 1 Room | 0 (0.0%) | 0 (0.0%) |
| 2 or 3 Rooms | 0 (0.0%) | 0 (0.0%) |
| 4 or 5 Rooms | 7 (14.9%) | 0 (0.0%) |
| 6 or 7 Rooms | 30 (63.8%) | 0 (0.0%) |
| 8 or more Rooms | 10 (21.3%) | 0 (0.0%) |
| Total | 47 (100.0%) | 0 (0.0%) |
Housing Structure by Heating Type in Portland
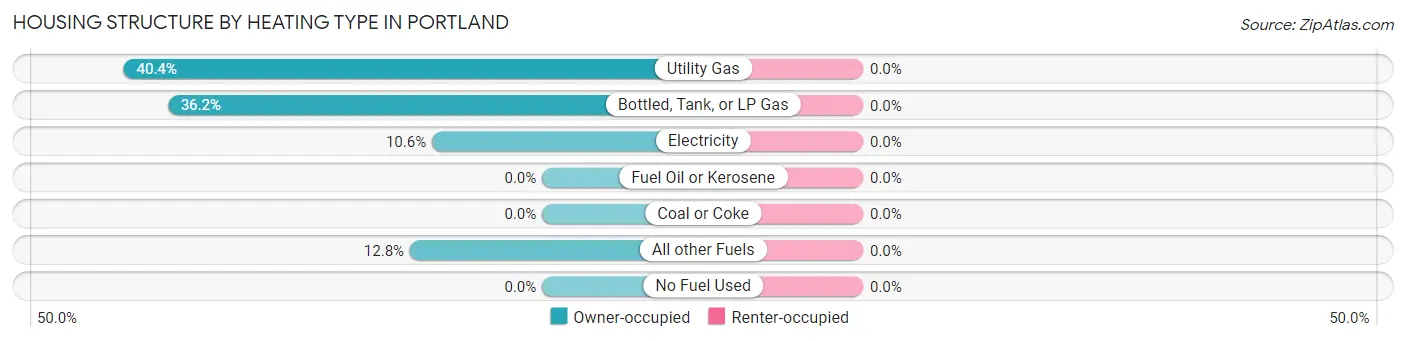
| Heating Type | Owner-occupied | Renter-occupied |
| Utility Gas | 19 (40.4%) | 0 (0.0%) |
| Bottled, Tank, or LP Gas | 17 (36.2%) | 0 (0.0%) |
| Electricity | 5 (10.6%) | 0 (0.0%) |
| Fuel Oil or Kerosene | 0 (0.0%) | 0 (0.0%) |
| Coal or Coke | 0 (0.0%) | 0 (0.0%) |
| All other Fuels | 6 (12.8%) | 0 (0.0%) |
| No Fuel Used | 0 (0.0%) | 0 (0.0%) |
| Total | 47 (100.0%) | 0 (0.0%) |
Household Vehicle Usage in Portland
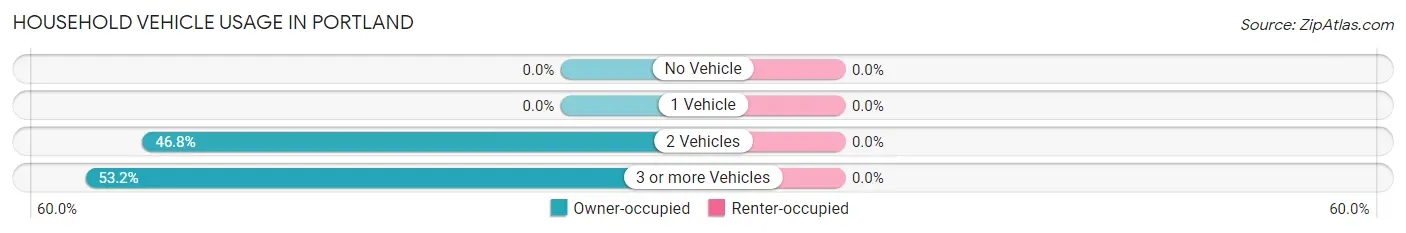
| Vehicles per Household | Owner-occupied | Renter-occupied |
| No Vehicle | 0 (0.0%) | 0 (0.0%) |
| 1 Vehicle | 0 (0.0%) | 0 (0.0%) |
| 2 Vehicles | 22 (46.8%) | 0 (0.0%) |
| 3 or more Vehicles | 25 (53.2%) | 0 (0.0%) |
| Total | 47 (100.0%) | 0 (0.0%) |
Real Estate & Mortgages in Portland
Real Estate and Mortgage Overview in Portland
| Characteristic | Without Mortgage | With Mortgage |
| Housing Units | 22 | 25 |
| Median Property Value | $1,088,200 | $598,200 |
| Median Household Income | $36,618 | $3 |
| Monthly Housing Costs | $453 | $0 |
| Real Estate Taxes | - | - |
Property Value by Mortgage Status in Portland
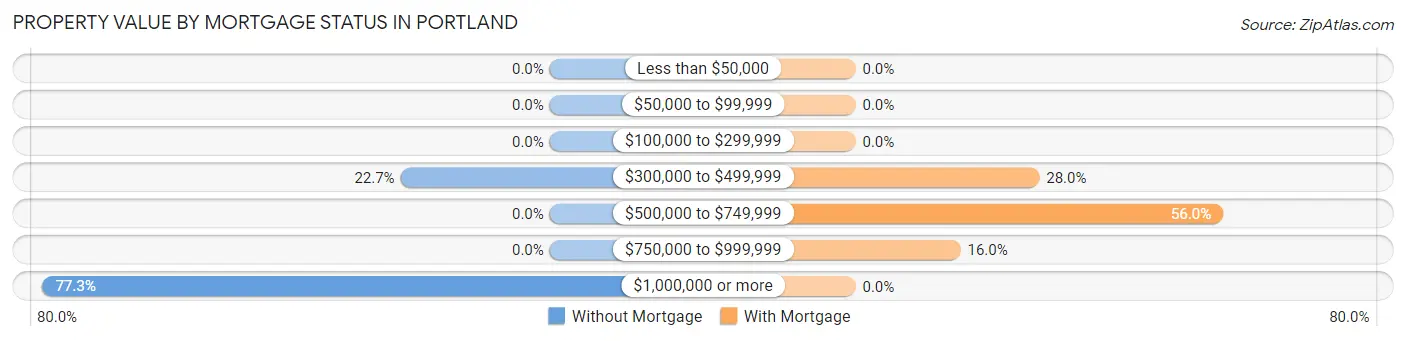
| Property Value | Without Mortgage | With Mortgage |
| Less than $50,000 | 0 (0.0%) | 0 (0.0%) |
| $50,000 to $99,999 | 0 (0.0%) | 0 (0.0%) |
| $100,000 to $299,999 | 0 (0.0%) | 0 (0.0%) |
| $300,000 to $499,999 | 5 (22.7%) | 7 (28.0%) |
| $500,000 to $749,999 | 0 (0.0%) | 14 (56.0%) |
| $750,000 to $999,999 | 0 (0.0%) | 4 (16.0%) |
| $1,000,000 or more | 17 (77.3%) | 0 (0.0%) |
| Total | 22 (100.0%) | 25 (100.0%) |
Household Income by Mortgage Status in Portland
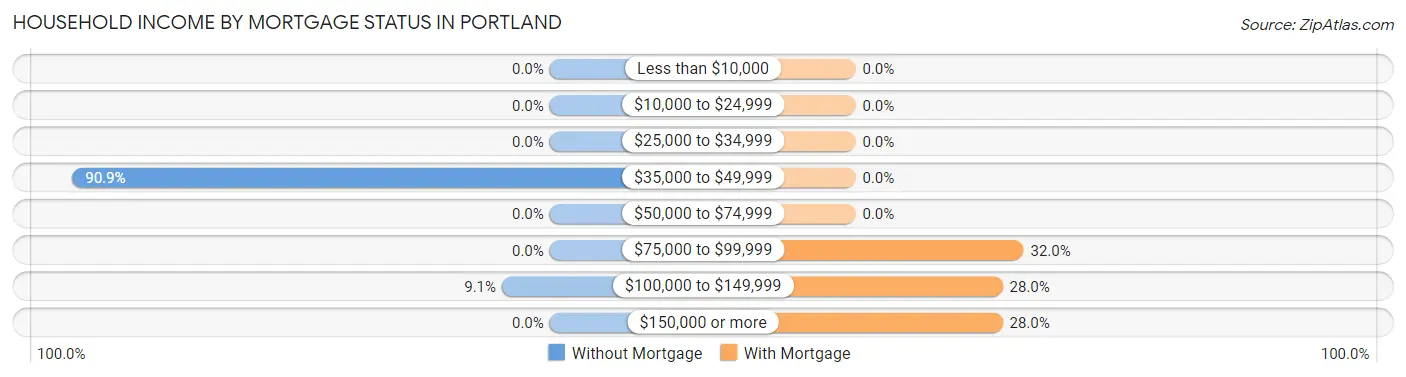
| Household Income | Without Mortgage | With Mortgage |
| Less than $10,000 | 0 (0.0%) | 0 (0.0%) |
| $10,000 to $24,999 | 0 (0.0%) | 0 (0.0%) |
| $25,000 to $34,999 | 0 (0.0%) | 0 (0.0%) |
| $35,000 to $49,999 | 20 (90.9%) | 0 (0.0%) |
| $50,000 to $74,999 | 0 (0.0%) | 0 (0.0%) |
| $75,000 to $99,999 | 0 (0.0%) | 8 (32.0%) |
| $100,000 to $149,999 | 2 (9.1%) | 7 (28.0%) |
| $150,000 or more | 0 (0.0%) | 7 (28.0%) |
| Total | 22 (100.0%) | 25 (100.0%) |
Property Value to Household Income Ratio in Portland
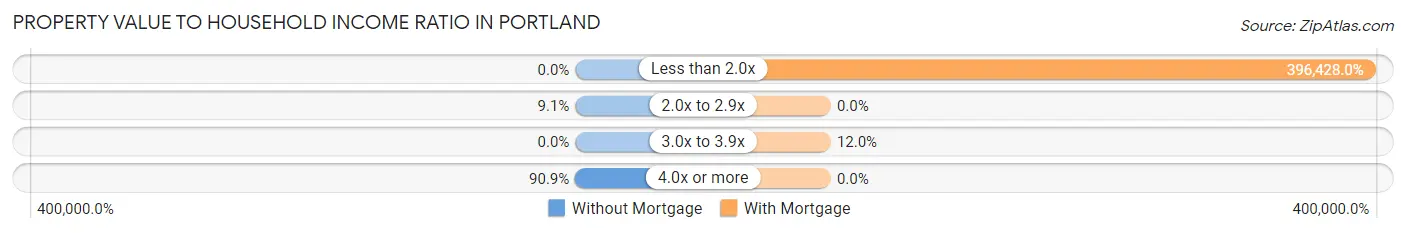
| Value-to-Income Ratio | Without Mortgage | With Mortgage |
| Less than 2.0x | 0 (0.0%) | 99,107 (396,428.0%) |
| 2.0x to 2.9x | 2 (9.1%) | 0 (0.0%) |
| 3.0x to 3.9x | 0 (0.0%) | 3 (12.0%) |
| 4.0x or more | 20 (90.9%) | 0 (0.0%) |
| Total | 22 (100.0%) | 25 (100.0%) |
Real Estate Taxes by Mortgage Status in Portland
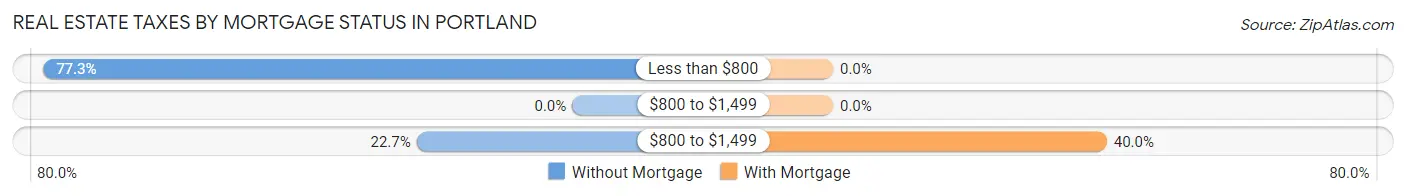
| Property Taxes | Without Mortgage | With Mortgage |
| Less than $800 | 17 (77.3%) | 0 (0.0%) |
| $800 to $1,499 | 0 (0.0%) | 0 (0.0%) |
| $800 to $1,499 | 5 (22.7%) | 10 (40.0%) |
| Total | 22 (100.0%) | 25 (100.0%) |
Health & Disability in Portland
Health Insurance Coverage by Age in Portland
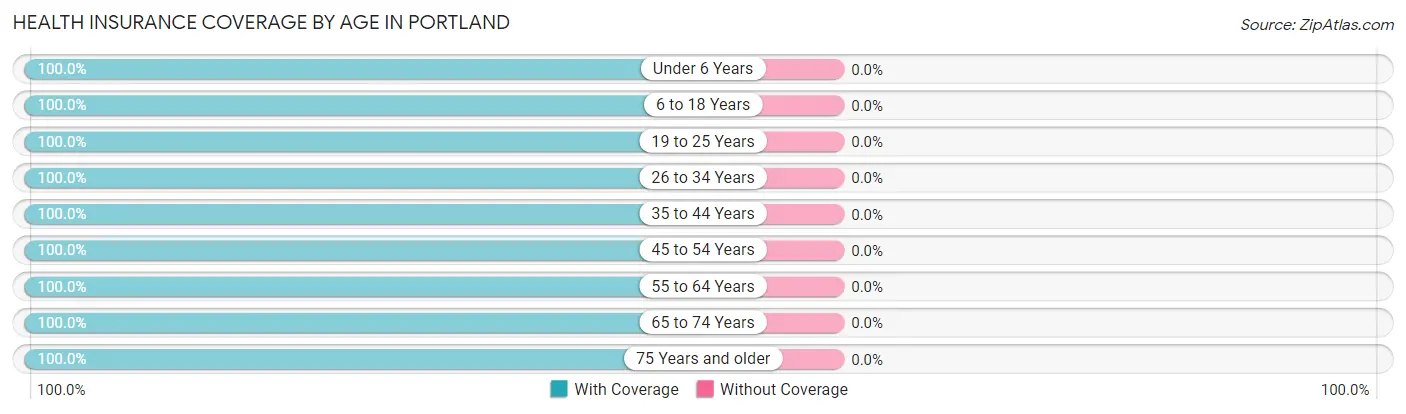
| Age Bracket | With Coverage | Without Coverage |
| Under 6 Years | 7 (100.0%) | 0 (0.0%) |
| 6 to 18 Years | 6 (100.0%) | 0 (0.0%) |
| 19 to 25 Years | 14 (100.0%) | 0 (0.0%) |
| 26 to 34 Years | 8 (100.0%) | 0 (0.0%) |
| 35 to 44 Years | 3 (100.0%) | 0 (0.0%) |
| 45 to 54 Years | 19 (100.0%) | 0 (0.0%) |
| 55 to 64 Years | 20 (100.0%) | 0 (0.0%) |
| 65 to 74 Years | 9 (100.0%) | 0 (0.0%) |
| 75 Years and older | 32 (100.0%) | 0 (0.0%) |
| Total | 118 (100.0%) | 0 (0.0%) |
Health Insurance Coverage by Citizenship Status in Portland
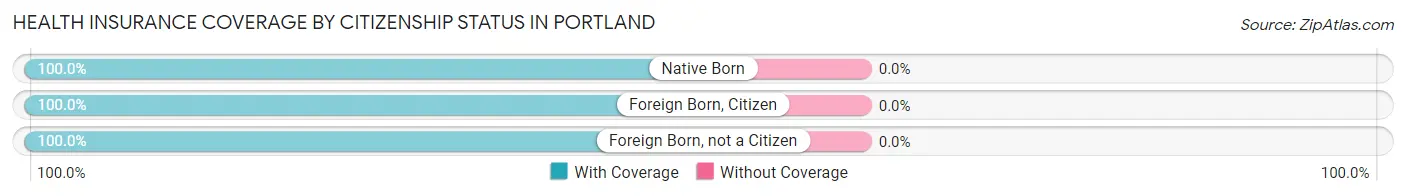
| Citizenship Status | With Coverage | Without Coverage |
| Native Born | 7 (100.0%) | 0 (0.0%) |
| Foreign Born, Citizen | 6 (100.0%) | 0 (0.0%) |
| Foreign Born, not a Citizen | 14 (100.0%) | 0 (0.0%) |
Health Insurance Coverage by Household Income in Portland
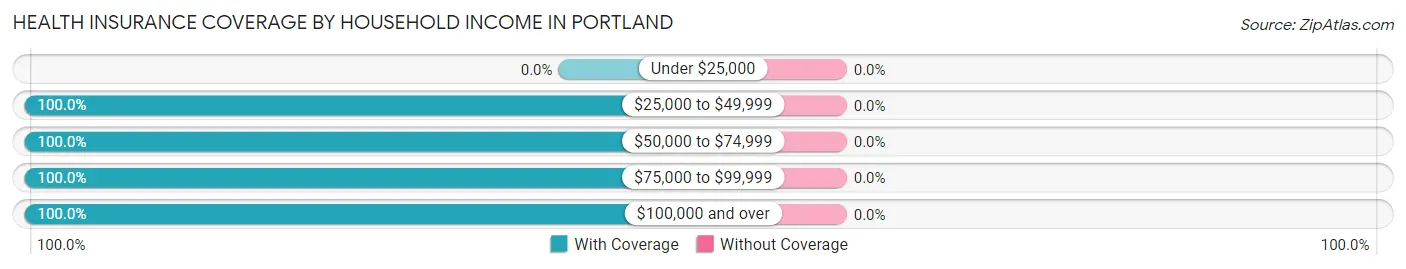
| Household Income | With Coverage | Without Coverage |
| Under $25,000 | 0 (0.0%) | 0 (0.0%) |
| $25,000 to $49,999 | 38 (100.0%) | 0 (0.0%) |
| $50,000 to $74,999 | 29 (100.0%) | 0 (0.0%) |
| $75,000 to $99,999 | 28 (100.0%) | 0 (0.0%) |
| $100,000 and over | 23 (100.0%) | 0 (0.0%) |
Public vs Private Health Insurance Coverage by Age in Portland
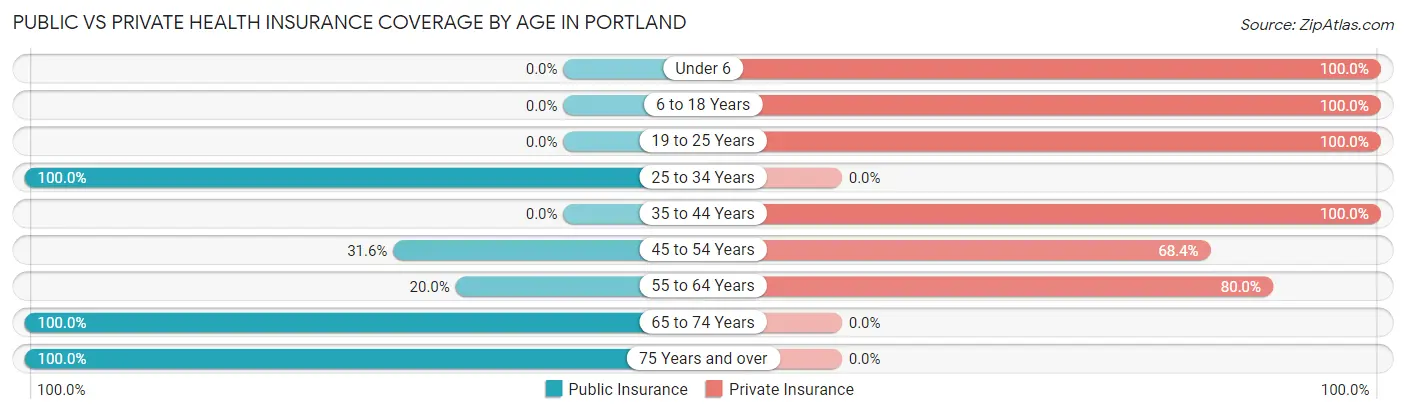
| Age Bracket | Public Insurance | Private Insurance |
| Under 6 | 0 (0.0%) | 7 (100.0%) |
| 6 to 18 Years | 0 (0.0%) | 6 (100.0%) |
| 19 to 25 Years | 0 (0.0%) | 14 (100.0%) |
| 25 to 34 Years | 8 (100.0%) | 0 (0.0%) |
| 35 to 44 Years | 0 (0.0%) | 3 (100.0%) |
| 45 to 54 Years | 6 (31.6%) | 13 (68.4%) |
| 55 to 64 Years | 4 (20.0%) | 16 (80.0%) |
| 65 to 74 Years | 9 (100.0%) | 0 (0.0%) |
| 75 Years and over | 32 (100.0%) | 0 (0.0%) |
| Total | 59 (50.0%) | 59 (50.0%) |
Disability Status by Sex by Age in Portland
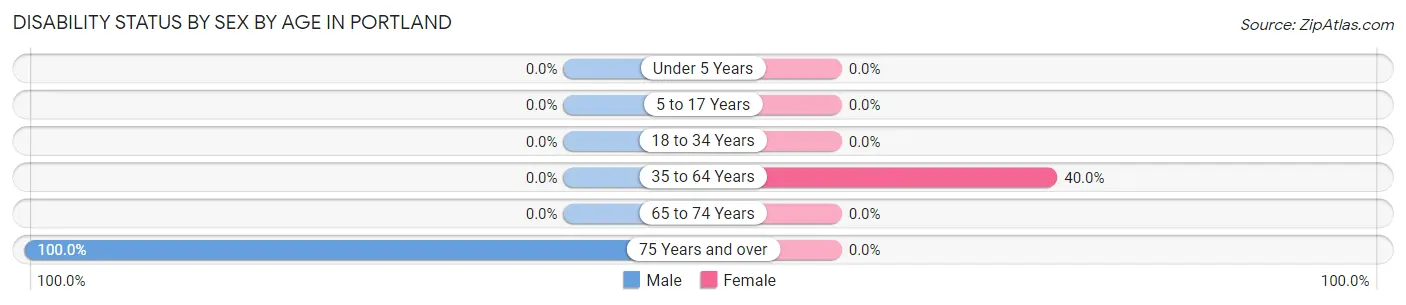
| Age Bracket | Male | Female |
| Under 5 Years | 0 (0.0%) | 0 (0.0%) |
| 5 to 17 Years | 0 (0.0%) | 0 (0.0%) |
| 18 to 34 Years | 0 (0.0%) | 0 (0.0%) |
| 35 to 64 Years | 0 (0.0%) | 10 (40.0%) |
| 65 to 74 Years | 0 (0.0%) | 0 (0.0%) |
| 75 Years and over | 17 (100.0%) | 0 (0.0%) |
Disability Class by Sex by Age in Portland
Disability Class: Hearing Difficulty
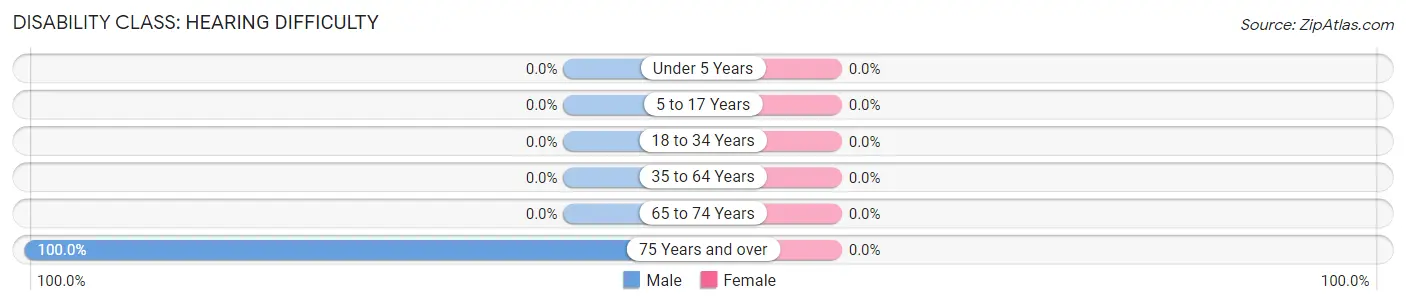
| Age Bracket | Male | Female |
| Under 5 Years | 0 (0.0%) | 0 (0.0%) |
| 5 to 17 Years | 0 (0.0%) | 0 (0.0%) |
| 18 to 34 Years | 0 (0.0%) | 0 (0.0%) |
| 35 to 64 Years | 0 (0.0%) | 0 (0.0%) |
| 65 to 74 Years | 0 (0.0%) | 0 (0.0%) |
| 75 Years and over | 17 (100.0%) | 0 (0.0%) |
Disability Class: Vision Difficulty
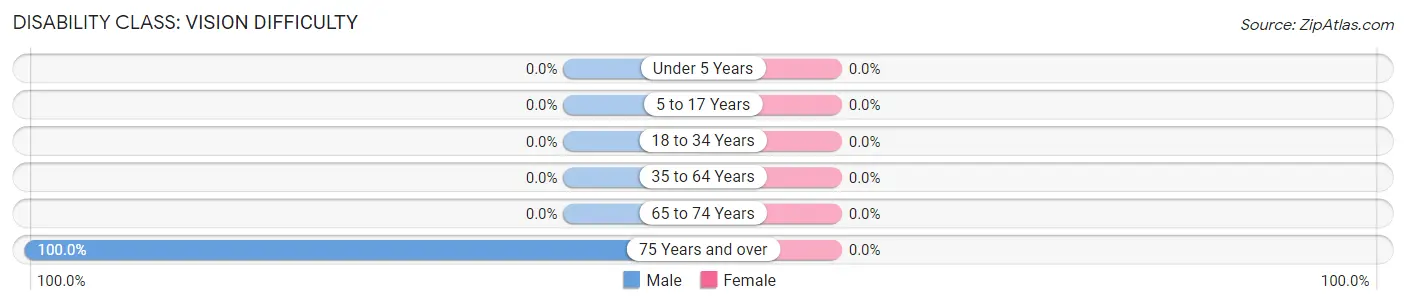
| Age Bracket | Male | Female |
| Under 5 Years | 0 (0.0%) | 0 (0.0%) |
| 5 to 17 Years | 0 (0.0%) | 0 (0.0%) |
| 18 to 34 Years | 0 (0.0%) | 0 (0.0%) |
| 35 to 64 Years | 0 (0.0%) | 0 (0.0%) |
| 65 to 74 Years | 0 (0.0%) | 0 (0.0%) |
| 75 Years and over | 17 (100.0%) | 0 (0.0%) |
Disability Class: Cognitive Difficulty
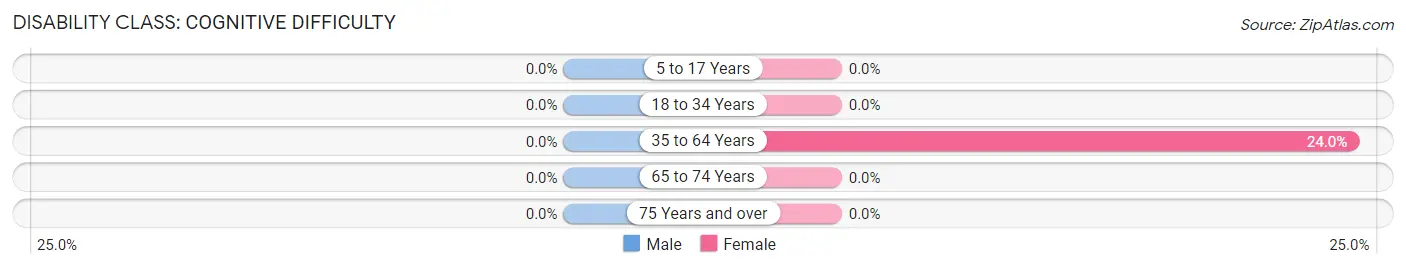
| Age Bracket | Male | Female |
| 5 to 17 Years | 0 (0.0%) | 0 (0.0%) |
| 18 to 34 Years | 0 (0.0%) | 0 (0.0%) |
| 35 to 64 Years | 0 (0.0%) | 6 (24.0%) |
| 65 to 74 Years | 0 (0.0%) | 0 (0.0%) |
| 75 Years and over | 0 (0.0%) | 0 (0.0%) |
Disability Class: Ambulatory Difficulty
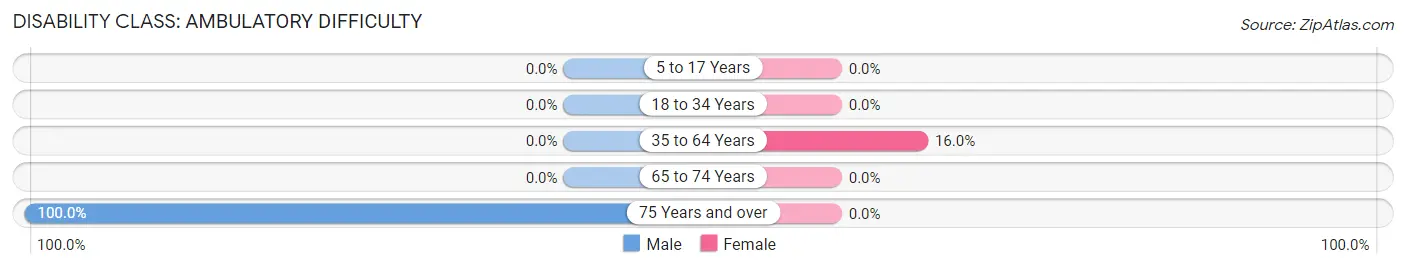
| Age Bracket | Male | Female |
| 5 to 17 Years | 0 (0.0%) | 0 (0.0%) |
| 18 to 34 Years | 0 (0.0%) | 0 (0.0%) |
| 35 to 64 Years | 0 (0.0%) | 4 (16.0%) |
| 65 to 74 Years | 0 (0.0%) | 0 (0.0%) |
| 75 Years and over | 17 (100.0%) | 0 (0.0%) |
Disability Class: Self-Care Difficulty
| Age Bracket | Male | Female |
| 5 to 17 Years | 0 (0.0%) | 0 (0.0%) |
| 18 to 34 Years | 0 (0.0%) | 0 (0.0%) |
| 35 to 64 Years | 0 (0.0%) | 0 (0.0%) |
| 65 to 74 Years | 0 (0.0%) | 0 (0.0%) |
| 75 Years and over | 0 (0.0%) | 0 (0.0%) |
Technology Access in Portland
Computing Device Access in Portland
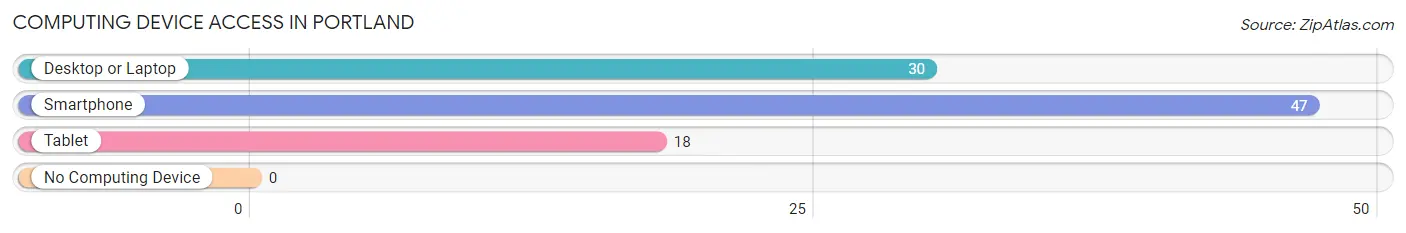
| Device Type | # Households | % Households |
| Desktop or Laptop | 30 | 63.8% |
| Smartphone | 47 | 100.0% |
| Tablet | 18 | 38.3% |
| No Computing Device | 0 | 0.0% |
| Total | 47 | 100.0% |
Internet Access in Portland
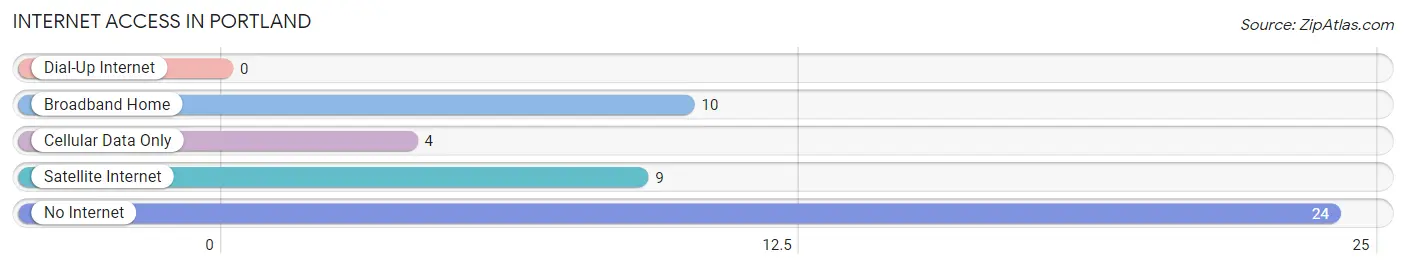
| Internet Type | # Households | % Households |
| Dial-Up Internet | 0 | 0.0% |
| Broadband Home | 10 | 21.3% |
| Cellular Data Only | 4 | 8.5% |
| Satellite Internet | 9 | 19.2% |
| No Internet | 24 | 51.1% |
| Total | 47 | 100.0% |
Portland Summary
Portland, Oregon is a city located in the Pacific Northwest region of the United States. It is the largest city in the state of Oregon and the second-largest city in the Pacific Northwest region, after Seattle, Washington. Portland is known for its vibrant culture, diverse population, and unique natural beauty.
Geography
Portland is located in the Willamette Valley, a region of the Pacific Northwest that is known for its lush green landscapes and mild climate. The city is situated on the banks of the Willamette River, which flows through the city and is a major source of drinking water for the region. The city is surrounded by the Cascade Mountains to the east and the Coast Range to the west. The city is also home to several parks and nature preserves, including Forest Park, the largest urban park in the United States.
Climate
Portland has a mild climate, with warm summers and cool, wet winters. The city receives an average of 37 inches of rain per year, making it one of the rainiest cities in the United States. The city also experiences a wide range of temperatures, with average highs in the summer reaching into the mid-80s and lows in the winter dipping into the mid-30s.
Economy
Portland is a major economic center in the Pacific Northwest region. The city is home to several major corporations, including Nike, Intel, and Adidas. The city is also a major hub for the technology industry, with many tech companies based in the city. Additionally, Portland is home to a thriving creative economy, with many independent businesses and entrepreneurs.
Demographics
As of the 2020 census, Portland had a population of 654,741. The city is racially and ethnically diverse, with the largest racial groups being White (63.2%), Hispanic or Latino (14.2%), and Black or African American (7.7%). The city is also home to a large immigrant population, with over 20% of the population being foreign-born.
The median household income in Portland is $63,837, and the median home value is $420,000. The city has a high cost of living, with the average rent for a one-bedroom apartment being $1,400.
Conclusion
Portland, Oregon is a vibrant city with a unique culture, diverse population, and beautiful natural surroundings. The city is a major economic center in the Pacific Northwest, with a thriving technology and creative economy. The city is also racially and ethnically diverse, with a large immigrant population. Portland is an attractive destination for people looking for a place to live, work, and play.
Common Questions
What is Per Capita Income in Portland?
Per Capita income in Portland is $28,986.
What is Income or Wage Gap in Portland?
Income or Wage Gap in Portland is 60.8%.
Women in Portland earn 39.2 cents for every dollar earned by a man.
What is Inequality or Gini Index in Portland?
Inequality or Gini Index in Portland is 0.32.
What is the Total Population of Portland?
Total Population of Portland is 118.
What is the Total Male Population of Portland?
Total Male Population of Portland is 49.
What is the Total Female Population of Portland?
Total Female Population of Portland is 69.
What is the Ratio of Males per 100 Females in Portland?
There are 71.01 Males per 100 Females in Portland.
What is the Ratio of Females per 100 Males in Portland?
There are 140.82 Females per 100 Males in Portland.
What is the Median Population Age in Portland?
Median Population Age in Portland is 55.7 Years.
What is the Average Family Size in Portland
Average Family Size in Portland is 2.5 People.
What is the Average Household Size in Portland
Average Household Size in Portland is 2.5 People.
How Large is the Labor Force in Portland?
There are 51 People in the Labor Forcein in Portland.
What is the Percentage of People in the Labor Force in Portland?
48.6% of People are in the Labor Force in Portland.