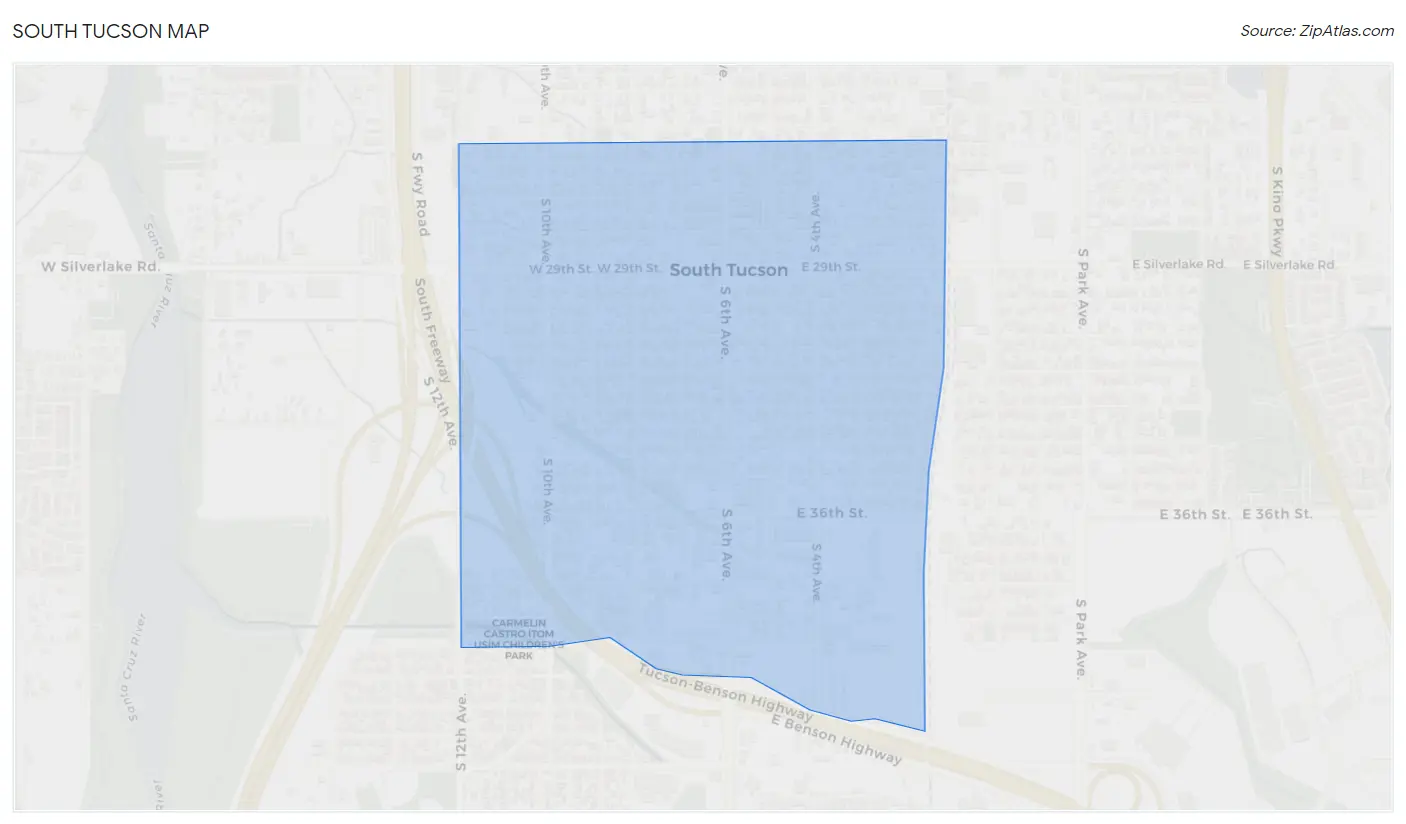
South Tucson, AZ Map & Demographics
South Tucson Map
South Tucson Overview
$16,508
PER CAPITA INCOME
$39,868
AVG FAMILY INCOME
$34,014
AVG HOUSEHOLD INCOME
23.4%
WAGE / INCOME GAP [ % ]
76.6¢/ $1
WAGE / INCOME GAP [ $ ]
$13,743
FAMILY INCOME DEFICIT
0.50
INEQUALITY / GINI INDEX
4,642
TOTAL POPULATION
2,425
MALE POPULATION
2,217
FEMALE POPULATION
109.38
MALES / 100 FEMALES
91.42
FEMALES / 100 MALES
35.6
MEDIAN AGE
3.5
AVG FAMILY SIZE
3.0
AVG HOUSEHOLD SIZE
1,737
LABOR FORCE [ PEOPLE ]
48.6%
PERCENT IN LABOR FORCE
14.2%
UNEMPLOYMENT RATE
Income in South Tucson
Income Overview in South Tucson
Per Capita Income in South Tucson is $16,508, while median incomes of families and households are $39,868 and $34,014 respectively.
| Characteristic | Number | Measure |
| Per Capita Income | 4,642 | $16,508 |
| Median Family Income | 1,012 | $39,868 |
| Mean Family Income | 1,012 | $52,763 |
| Median Household Income | 1,480 | $34,014 |
| Mean Household Income | 1,480 | $47,163 |
| Income Deficit | 1,012 | $13,743 |
| Wage / Income Gap (%) | 4,642 | 23.40% |
| Wage / Income Gap ($) | 4,642 | 76.60¢ per $1 |
| Gini / Inequality Index | 4,642 | 0.50 |
Earnings by Sex in South Tucson
Average Earnings in South Tucson are $24,040, $26,863 for men and $20,576 for women, a difference of 23.4%.
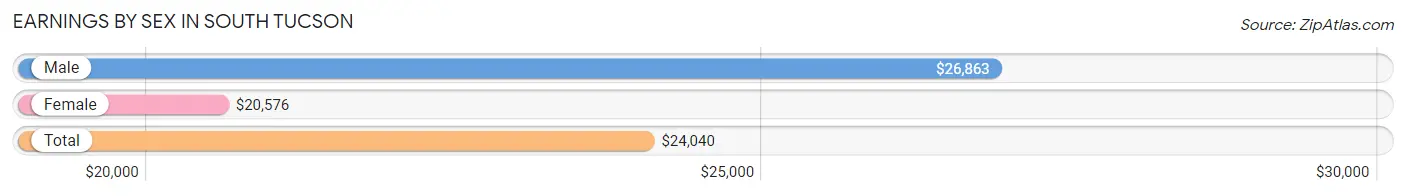
| Sex | Number | Average Earnings |
| Male | 1,053 (56.0%) | $26,863 |
| Female | 827 (44.0%) | $20,576 |
| Total | 1,880 (100.0%) | $24,040 |
Earnings by Sex by Income Bracket in South Tucson
The most common earnings brackets in South Tucson are $25,000 to $29,999 for men (129 | 12.2%) and $25,000 to $29,999 for women (95 | 11.5%).

| Income | Male | Female |
| $2,499 or less | 76 (7.2%) | 62 (7.5%) |
| $2,500 to $4,999 | 21 (2.0%) | 51 (6.2%) |
| $5,000 to $7,499 | 78 (7.4%) | 38 (4.6%) |
| $7,500 to $9,999 | 10 (0.9%) | 20 (2.4%) |
| $10,000 to $12,499 | 83 (7.9%) | 62 (7.5%) |
| $12,500 to $14,999 | 20 (1.9%) | 50 (6.0%) |
| $15,000 to $17,499 | 28 (2.7%) | 67 (8.1%) |
| $17,500 to $19,999 | 0 (0.0%) | 46 (5.6%) |
| $20,000 to $22,499 | 75 (7.1%) | 76 (9.2%) |
| $22,500 to $24,999 | 96 (9.1%) | 29 (3.5%) |
| $25,000 to $29,999 | 129 (12.2%) | 95 (11.5%) |
| $30,000 to $34,999 | 100 (9.5%) | 28 (3.4%) |
| $35,000 to $39,999 | 89 (8.5%) | 48 (5.8%) |
| $40,000 to $44,999 | 36 (3.4%) | 37 (4.5%) |
| $45,000 to $49,999 | 18 (1.7%) | 60 (7.3%) |
| $50,000 to $54,999 | 65 (6.2%) | 0 (0.0%) |
| $55,000 to $64,999 | 78 (7.4%) | 8 (1.0%) |
| $65,000 to $74,999 | 22 (2.1%) | 0 (0.0%) |
| $75,000 to $99,999 | 7 (0.7%) | 23 (2.8%) |
| $100,000+ | 22 (2.1%) | 27 (3.3%) |
| Total | 1,053 (100.0%) | 827 (100.0%) |
Earnings by Sex by Educational Attainment in South Tucson
Average earnings in South Tucson are $28,520 for men and $20,740 for women, a difference of 27.3%. Men with an educational attainment of college or associate's degree enjoy the highest average annual earnings of $48,750, while those with less than high school education earn the least with $25,121. Women with an educational attainment of high school diploma earn the most with the average annual earnings of $35,742, while those with less than high school education have the smallest earnings of $16,500.
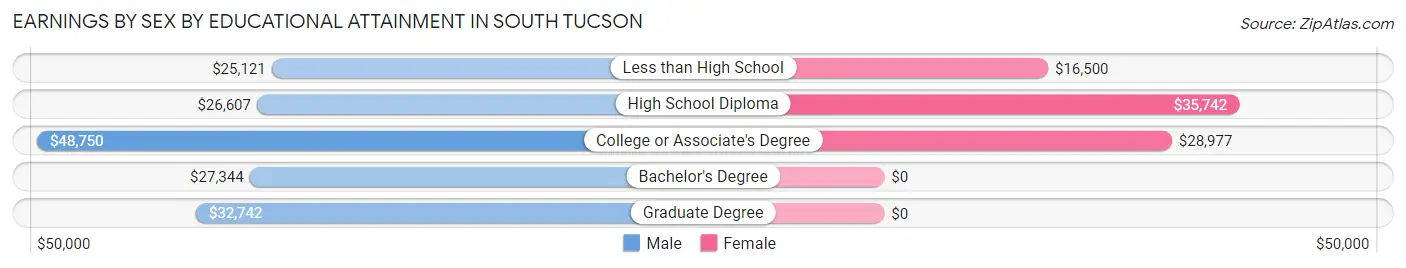
| Educational Attainment | Male Income | Female Income |
| Less than High School | $25,121 | $16,500 |
| High School Diploma | $26,607 | $35,742 |
| College or Associate's Degree | $48,750 | $28,977 |
| Bachelor's Degree | $27,344 | $0 |
| Graduate Degree | $32,742 | $0 |
| Total | $28,520 | $20,740 |
Family Income in South Tucson
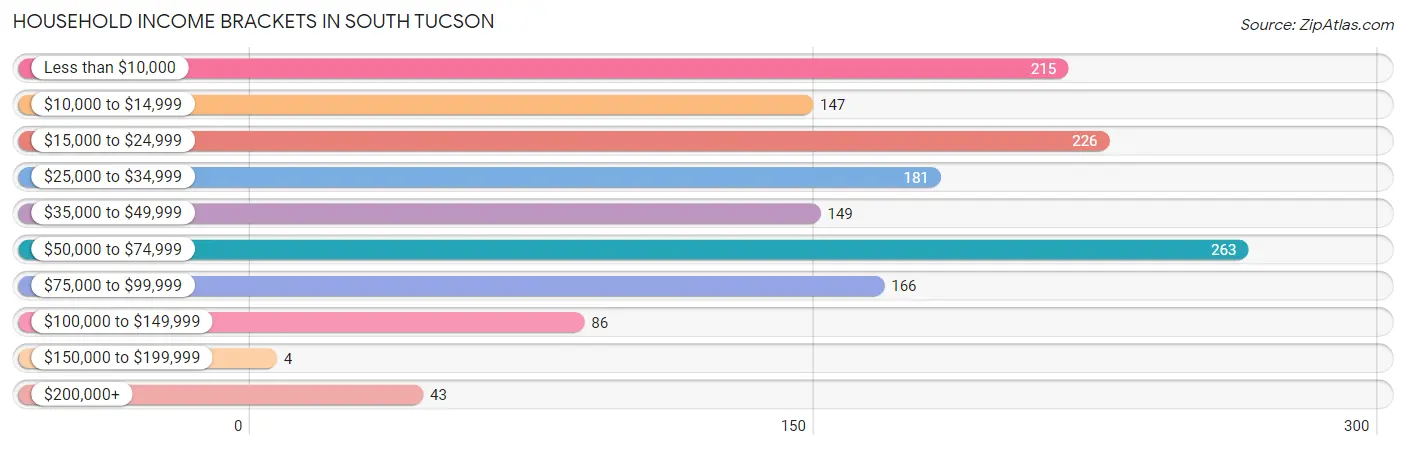
Family Income Brackets in South Tucson
According to the South Tucson family income data, there are 234 families falling into the $50,000 to $74,999 income range, which is the most common income bracket and makes up 23.1% of all families. Conversely, the $150,000 to $199,999 income bracket is the least frequent group with only 21 families (2.1%) belonging to this category.
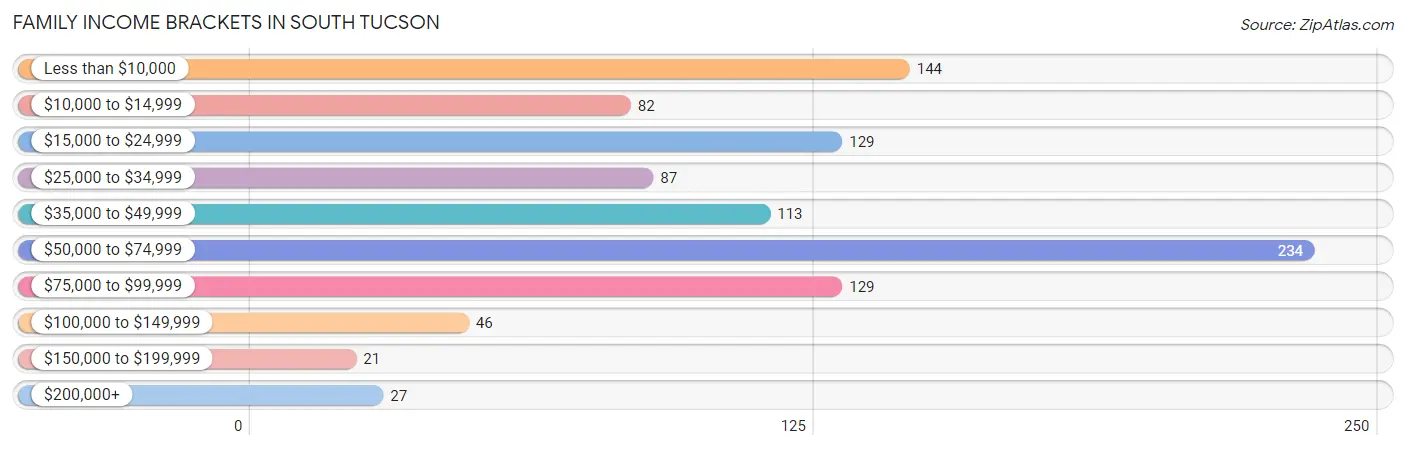
| Income Bracket | # Families | % Families |
| Less than $10,000 | 144 | 14.2% |
| $10,000 to $14,999 | 82 | 8.1% |
| $15,000 to $24,999 | 129 | 12.7% |
| $25,000 to $34,999 | 87 | 8.6% |
| $35,000 to $49,999 | 113 | 11.2% |
| $50,000 to $74,999 | 234 | 23.1% |
| $75,000 to $99,999 | 129 | 12.7% |
| $100,000 to $149,999 | 46 | 4.5% |
| $150,000 to $199,999 | 21 | 2.1% |
| $200,000+ | 27 | 2.7% |
Family Income by Famaliy Size in South Tucson
6-person families (54 | 5.3%) account for the highest median family income in South Tucson with $71,800 per family, while 4-person families (214 | 21.1%) have the highest median income of $16,591 per family member.
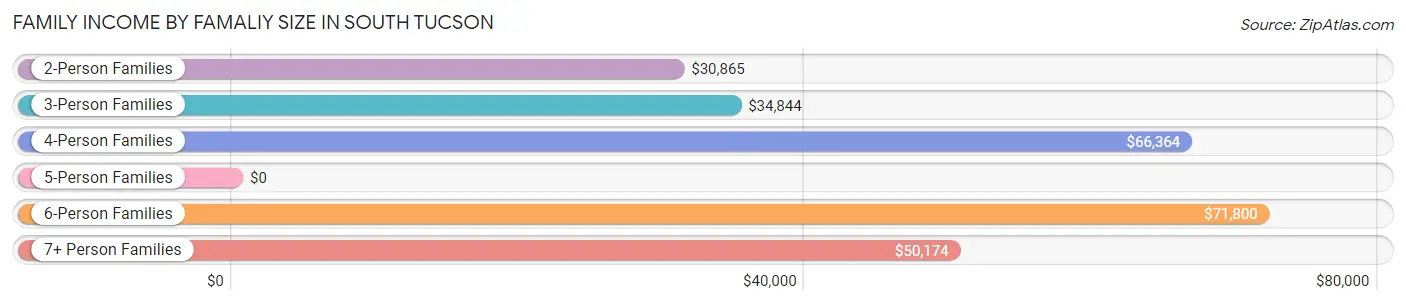
| Income Bracket | # Families | Median Income |
| 2-Person Families | 429 (42.4%) | $30,865 |
| 3-Person Families | 172 (17.0%) | $34,844 |
| 4-Person Families | 214 (21.1%) | $66,364 |
| 5-Person Families | 40 (4.0%) | $0 |
| 6-Person Families | 54 (5.3%) | $71,800 |
| 7+ Person Families | 103 (10.2%) | $50,174 |
| Total | 1,012 (100.0%) | $39,868 |
Family Income by Number of Earners in South Tucson
The median family income in South Tucson is $39,868, with families comprising 3+ earners (91) having the highest median family income of $80,039, while families with no earners (227) have the lowest median family income of $15,139, accounting for 9.0% and 22.4% of families, respectively.
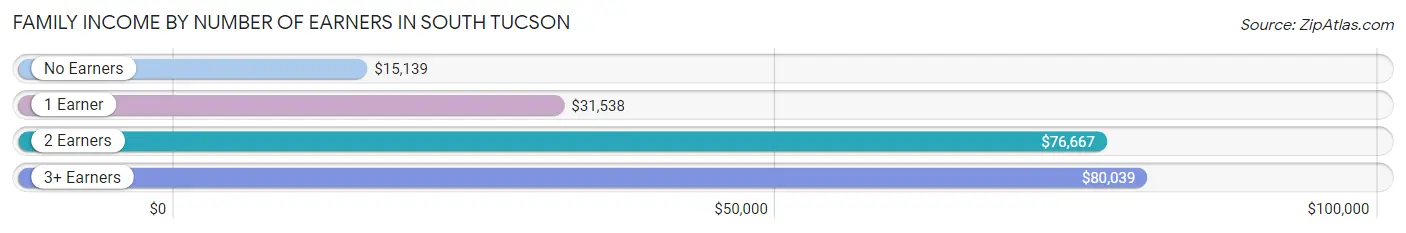
| Number of Earners | # Families | Median Income |
| No Earners | 227 (22.4%) | $15,139 |
| 1 Earner | 428 (42.3%) | $31,538 |
| 2 Earners | 266 (26.3%) | $76,667 |
| 3+ Earners | 91 (9.0%) | $80,039 |
| Total | 1,012 (100.0%) | $39,868 |
Household Income in South Tucson
Household Income Brackets in South Tucson
With 263 households falling in the category, the $50,000 to $74,999 income range is the most frequent in South Tucson, accounting for 17.8% of all households. In contrast, only 4 households (0.3%) fall into the $150,000 to $199,999 income bracket, making it the least populous group.
| Income Bracket | # Households | % Households |
| Less than $10,000 | 215 | 14.5% |
| $10,000 to $14,999 | 147 | 9.9% |
| $15,000 to $24,999 | 226 | 15.3% |
| $25,000 to $34,999 | 181 | 12.2% |
| $35,000 to $49,999 | 149 | 10.1% |
| $50,000 to $74,999 | 263 | 17.8% |
| $75,000 to $99,999 | 166 | 11.2% |
| $100,000 to $149,999 | 86 | 5.8% |
| $150,000 to $199,999 | 4 | 0.3% |
| $200,000+ | 43 | 2.9% |
Household Income by Householder Age in South Tucson
The median household income in South Tucson is $34,014, with the highest median household income of $37,824 found in the 65+ years age bracket for the primary householder. A total of 389 households (26.3%) fall into this category. Meanwhile, the 15 to 24 years age bracket for the primary householder has the lowest median household income of $0, with 45 households (3.0%) in this group.
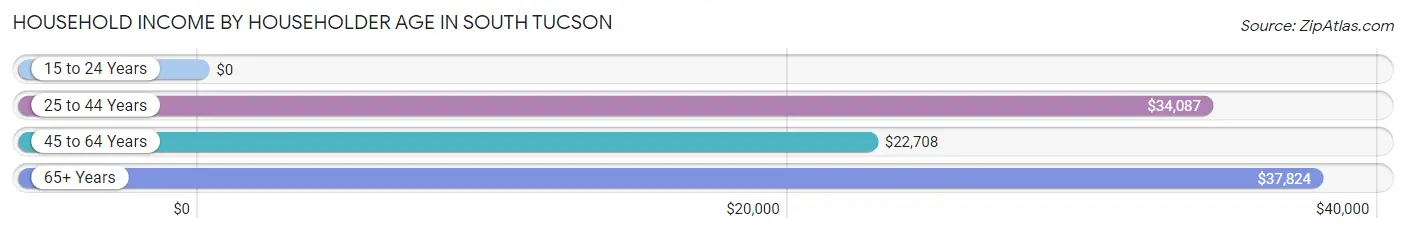
| Income Bracket | # Households | Median Income |
| 15 to 24 Years | 45 (3.0%) | $0 |
| 25 to 44 Years | 475 (32.1%) | $34,087 |
| 45 to 64 Years | 571 (38.6%) | $22,708 |
| 65+ Years | 389 (26.3%) | $37,824 |
| Total | 1,480 (100.0%) | $34,014 |
Poverty in South Tucson
Income Below Poverty by Sex and Age in South Tucson
With 35.2% poverty level for males and 35.9% for females among the residents of South Tucson, 5 year old males and under 5 year old females are the most vulnerable to poverty, with 14 males (100.0%) and 63 females (80.8%) in their respective age groups living below the poverty level.
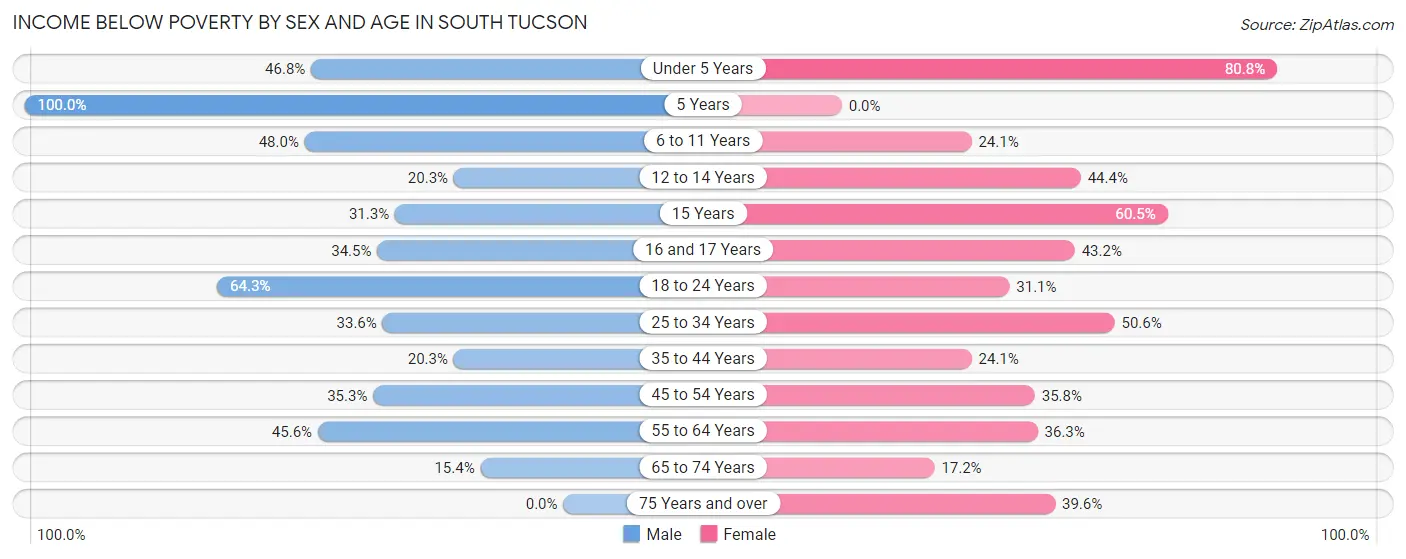
| Age Bracket | Male | Female |
| Under 5 Years | 22 (46.8%) | 63 (80.8%) |
| 5 Years | 14 (100.0%) | 0 (0.0%) |
| 6 to 11 Years | 144 (48.0%) | 52 (24.1%) |
| 12 to 14 Years | 26 (20.3%) | 55 (44.4%) |
| 15 Years | 10 (31.2%) | 26 (60.5%) |
| 16 and 17 Years | 48 (34.5%) | 16 (43.2%) |
| 18 to 24 Years | 142 (64.2%) | 88 (31.1%) |
| 25 to 34 Years | 102 (33.6%) | 120 (50.6%) |
| 35 to 44 Years | 75 (20.3%) | 60 (24.1%) |
| 45 to 54 Years | 66 (35.3%) | 86 (35.8%) |
| 55 to 64 Years | 159 (45.6%) | 113 (36.3%) |
| 65 to 74 Years | 32 (15.4%) | 27 (17.2%) |
| 75 Years and over | 0 (0.0%) | 76 (39.6%) |
| Total | 840 (35.2%) | 782 (35.9%) |
Income Above Poverty by Sex and Age in South Tucson
According to the poverty statistics in South Tucson, males aged 75 years and over and females aged 5 years are the age groups that are most secure financially, with 100.0% of males and 100.0% of females in these age groups living above the poverty line.
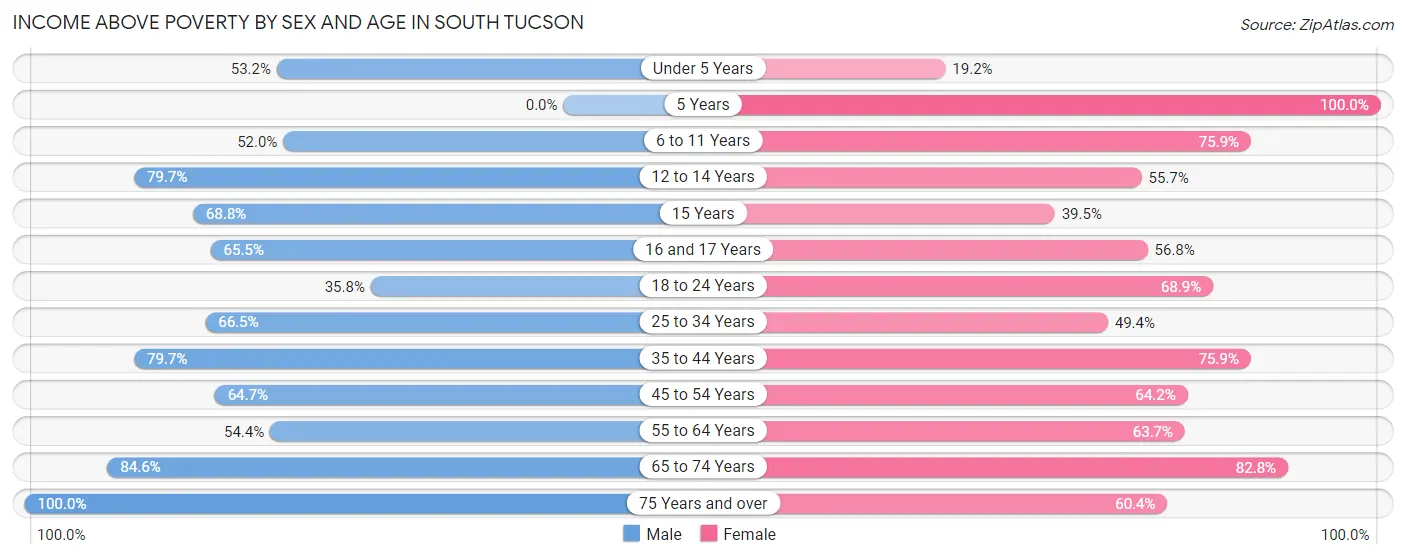
| Age Bracket | Male | Female |
| Under 5 Years | 25 (53.2%) | 15 (19.2%) |
| 5 Years | 0 (0.0%) | 14 (100.0%) |
| 6 to 11 Years | 156 (52.0%) | 164 (75.9%) |
| 12 to 14 Years | 102 (79.7%) | 69 (55.6%) |
| 15 Years | 22 (68.8%) | 17 (39.5%) |
| 16 and 17 Years | 91 (65.5%) | 21 (56.8%) |
| 18 to 24 Years | 79 (35.7%) | 195 (68.9%) |
| 25 to 34 Years | 202 (66.4%) | 117 (49.4%) |
| 35 to 44 Years | 294 (79.7%) | 189 (75.9%) |
| 45 to 54 Years | 121 (64.7%) | 154 (64.2%) |
| 55 to 64 Years | 190 (54.4%) | 198 (63.7%) |
| 65 to 74 Years | 176 (84.6%) | 130 (82.8%) |
| 75 Years and over | 90 (100.0%) | 116 (60.4%) |
| Total | 1,548 (64.8%) | 1,399 (64.1%) |
Income Below Poverty Among Married-Couple Families in South Tucson
The poverty statistics for married-couple families in South Tucson show that 21.3% or 90 of the total 422 families live below the poverty line. Families with 3 or 4 children have the highest poverty rate of 50.0%, comprising of 18 families. On the other hand, families with 5 or more children have the lowest poverty rate of 0.0%, which includes 0 families.
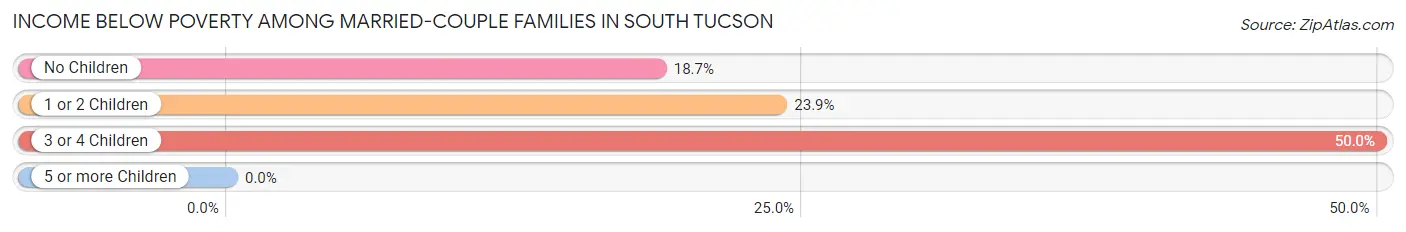
| Children | Above Poverty | Below Poverty |
| No Children | 218 (81.3%) | 50 (18.7%) |
| 1 or 2 Children | 70 (76.1%) | 22 (23.9%) |
| 3 or 4 Children | 18 (50.0%) | 18 (50.0%) |
| 5 or more Children | 26 (100.0%) | 0 (0.0%) |
| Total | 332 (78.7%) | 90 (21.3%) |
Income Below Poverty Among Single-Parent Households in South Tucson
According to the poverty data in South Tucson, 65.0% or 65 single-father households and 36.7% or 180 single-mother households are living below the poverty line. Among single-father households, those with 5 or more children have the highest poverty rate, with 31 households (100.0%) experiencing poverty. Likewise, among single-mother households, those with no children have the highest poverty rate, with 76 households (40.9%) falling below the poverty line.
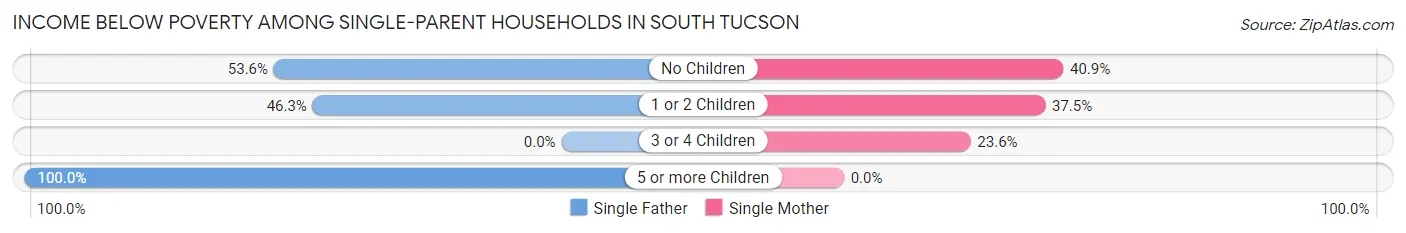
| Children | Single Father | Single Mother |
| No Children | 15 (53.6%) | 76 (40.9%) |
| 1 or 2 Children | 19 (46.3%) | 87 (37.5%) |
| 3 or 4 Children | 0 (0.0%) | 17 (23.6%) |
| 5 or more Children | 31 (100.0%) | 0 (0.0%) |
| Total | 65 (65.0%) | 180 (36.7%) |
Income Below Poverty Among Married-Couple vs Single-Parent Households in South Tucson
The poverty data for South Tucson shows that 90 of the married-couple family households (21.3%) and 245 of the single-parent households (41.5%) are living below the poverty level. Within the married-couple family households, those with 3 or 4 children have the highest poverty rate, with 18 households (50.0%) falling below the poverty line. Among the single-parent households, those with 5 or more children have the highest poverty rate, with 31 household (100.0%) living below poverty.
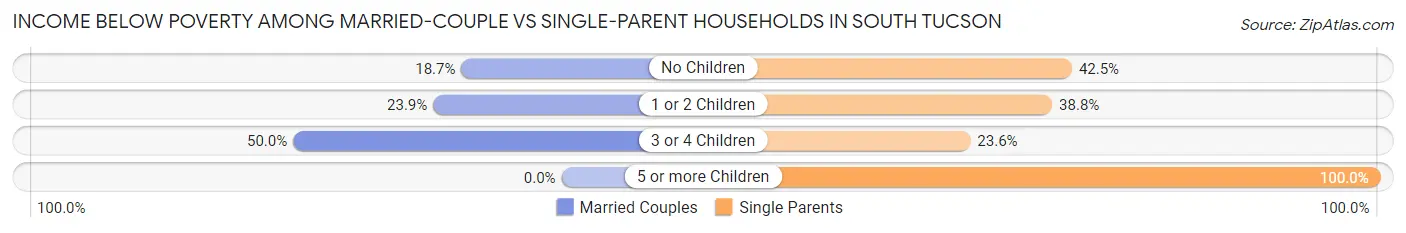
| Children | Married-Couple Families | Single-Parent Households |
| No Children | 50 (18.7%) | 91 (42.5%) |
| 1 or 2 Children | 22 (23.9%) | 106 (38.8%) |
| 3 or 4 Children | 18 (50.0%) | 17 (23.6%) |
| 5 or more Children | 0 (0.0%) | 31 (100.0%) |
| Total | 90 (21.3%) | 245 (41.5%) |
Race in South Tucson
The most populous races in South Tucson are Hispanic or Latino (3,336 | 71.9%), White / Caucasian (2,130 | 45.9%), and Native / Alaskan (900 | 19.4%).
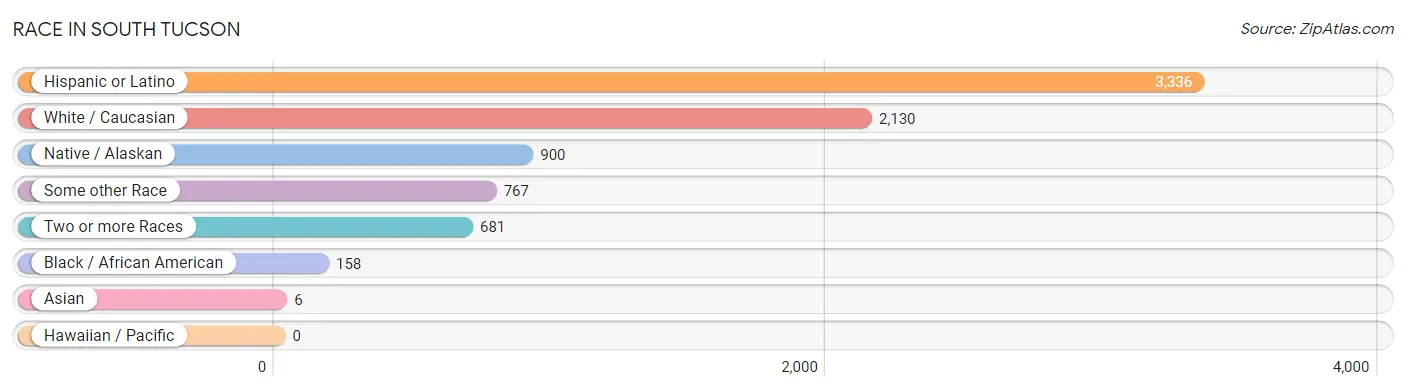
| Race | # Population | % Population |
| Asian | 6 | 0.1% |
| Black / African American | 158 | 3.4% |
| Hawaiian / Pacific | 0 | 0.0% |
| Hispanic or Latino | 3,336 | 71.9% |
| Native / Alaskan | 900 | 19.4% |
| White / Caucasian | 2,130 | 45.9% |
| Two or more Races | 681 | 14.7% |
| Some other Race | 767 | 16.5% |
| Total | 4,642 | 100.0% |
Ancestry in South Tucson
The most populous ancestries reported in South Tucson are Mexican (3,257 | 70.2%), Tohono O'Odham (307 | 6.6%), Yaqui (200 | 4.3%), European (115 | 2.5%), and Irish (102 | 2.2%), together accounting for 85.8% of all South Tucson residents.
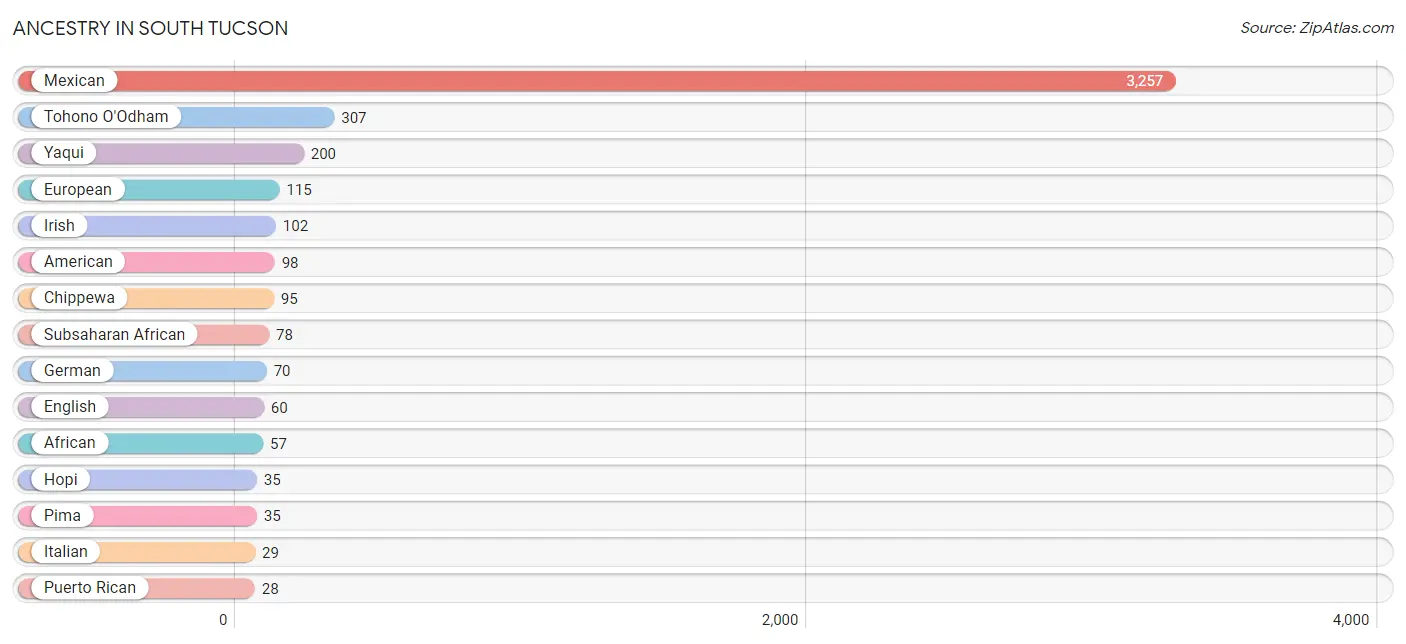
| Ancestry | # Population | % Population |
| African | 57 | 1.2% |
| American | 98 | 2.1% |
| Apache | 5 | 0.1% |
| Cherokee | 5 | 0.1% |
| Chippewa | 95 | 2.1% |
| Dutch | 24 | 0.5% |
| English | 60 | 1.3% |
| European | 115 | 2.5% |
| French | 26 | 0.6% |
| German | 70 | 1.5% |
| Greek | 15 | 0.3% |
| Hopi | 35 | 0.7% |
| Hungarian | 3 | 0.1% |
| Irish | 102 | 2.2% |
| Italian | 29 | 0.6% |
| Lithuanian | 5 | 0.1% |
| Mexican | 3,257 | 70.2% |
| Mexican American Indian | 15 | 0.3% |
| Navajo | 21 | 0.4% |
| Norwegian | 23 | 0.5% |
| Pakistani | 12 | 0.3% |
| Pima | 35 | 0.7% |
| Polish | 9 | 0.2% |
| Puerto Rican | 28 | 0.6% |
| Romanian | 13 | 0.3% |
| Russian | 5 | 0.1% |
| Scottish | 28 | 0.6% |
| Sierra Leonean | 4 | 0.1% |
| Spanish | 17 | 0.4% |
| Subsaharan African | 78 | 1.7% |
| Sudanese | 12 | 0.3% |
| Tohono O'Odham | 307 | 6.6% |
| Ugandan | 5 | 0.1% |
| Ukrainian | 4 | 0.1% |
| Yaqui | 200 | 4.3% | View All 35 Rows |
Immigrants in South Tucson
The most numerous immigrant groups reported in South Tucson came from Central America (671 | 14.4%), Latin America (671 | 14.4%), Mexico (671 | 14.4%), Africa (73 | 1.6%), and Eastern Africa (56 | 1.2%), together accounting for 46.1% of all South Tucson residents.
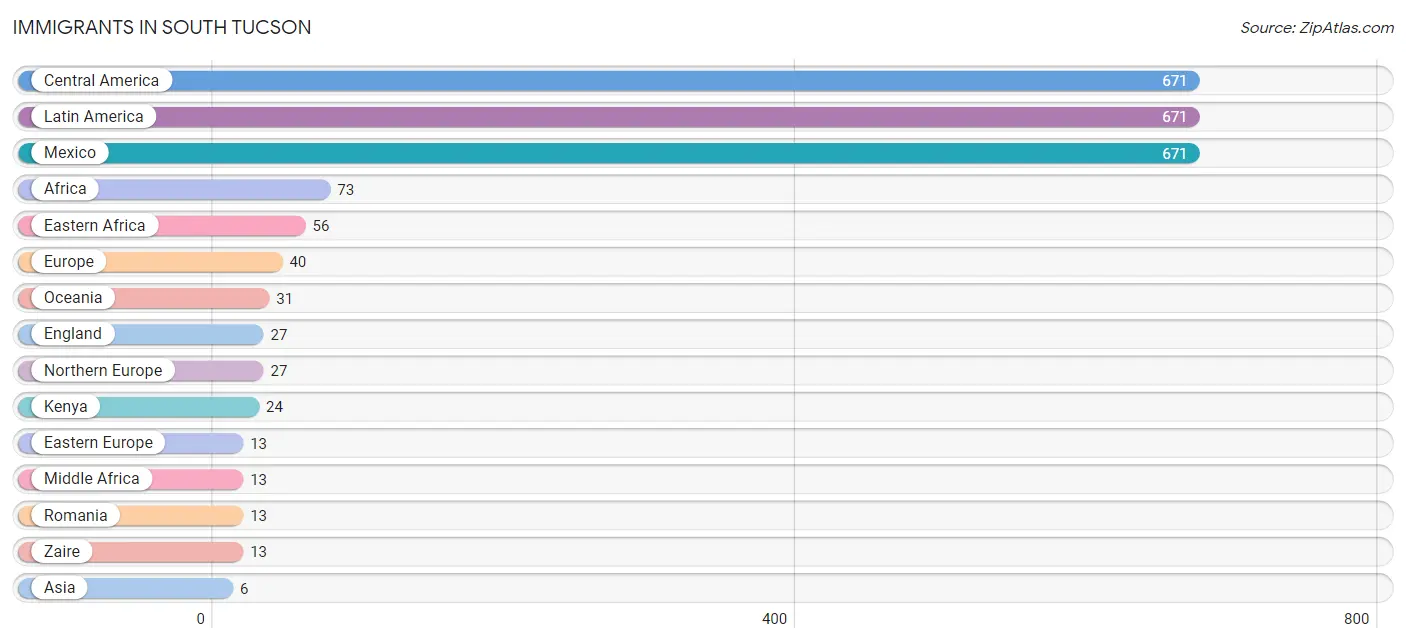
| Immigration Origin | # Population | % Population |
| Africa | 73 | 1.6% |
| Asia | 6 | 0.1% |
| Central America | 671 | 14.4% |
| Eastern Africa | 56 | 1.2% |
| Eastern Europe | 13 | 0.3% |
| England | 27 | 0.6% |
| Europe | 40 | 0.9% |
| Kenya | 24 | 0.5% |
| Latin America | 671 | 14.4% |
| Mexico | 671 | 14.4% |
| Middle Africa | 13 | 0.3% |
| Northern Europe | 27 | 0.6% |
| Oceania | 31 | 0.7% |
| Romania | 13 | 0.3% |
| Sierra Leone | 4 | 0.1% |
| South Eastern Asia | 6 | 0.1% |
| Thailand | 6 | 0.1% |
| Uganda | 5 | 0.1% |
| Western Africa | 4 | 0.1% |
| Zaire | 13 | 0.3% | View All 20 Rows |
Sex and Age in South Tucson
Sex and Age in South Tucson
The most populous age groups in South Tucson are 15 to 19 Years (243 | 10.0%) for men and 10 to 14 Years (232 | 10.5%) for women.
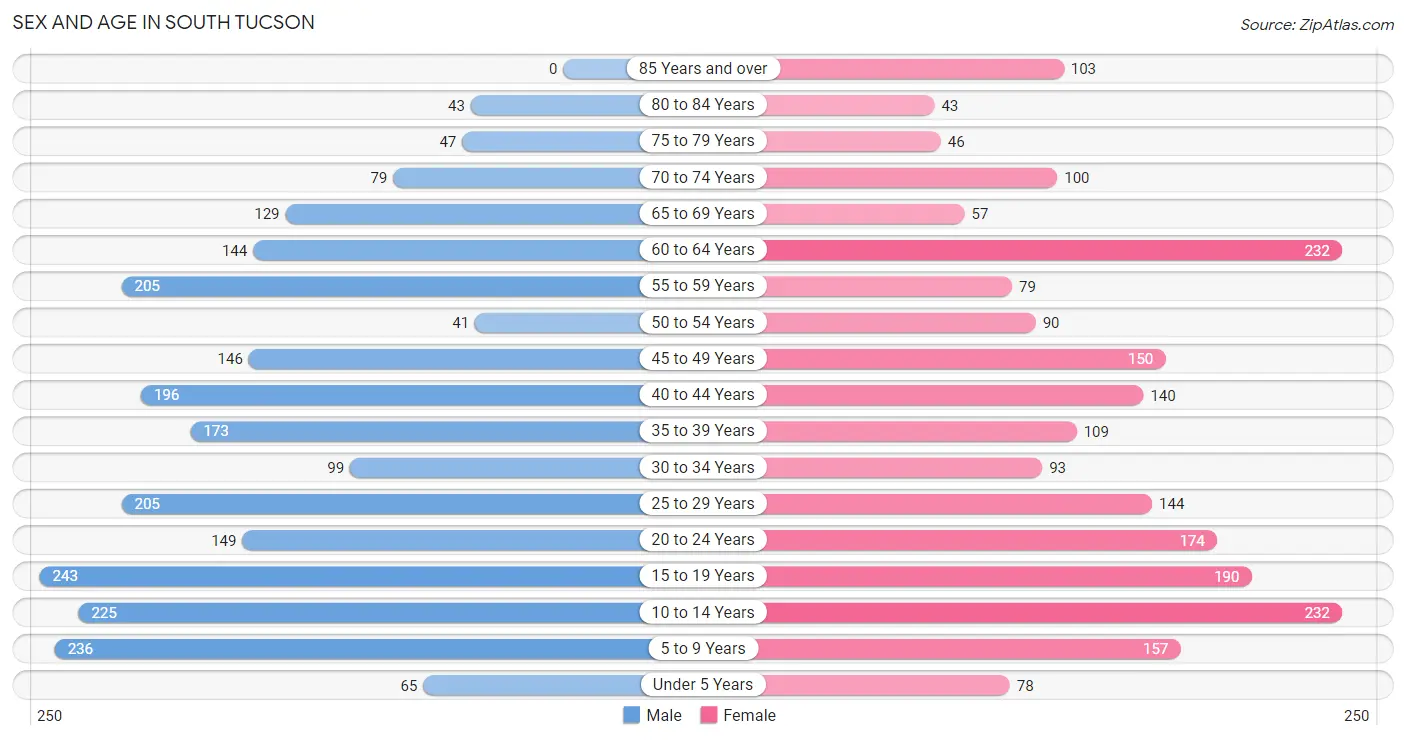
| Age Bracket | Male | Female |
| Under 5 Years | 65 (2.7%) | 78 (3.5%) |
| 5 to 9 Years | 236 (9.7%) | 157 (7.1%) |
| 10 to 14 Years | 225 (9.3%) | 232 (10.5%) |
| 15 to 19 Years | 243 (10.0%) | 190 (8.6%) |
| 20 to 24 Years | 149 (6.1%) | 174 (7.9%) |
| 25 to 29 Years | 205 (8.5%) | 144 (6.5%) |
| 30 to 34 Years | 99 (4.1%) | 93 (4.2%) |
| 35 to 39 Years | 173 (7.1%) | 109 (4.9%) |
| 40 to 44 Years | 196 (8.1%) | 140 (6.3%) |
| 45 to 49 Years | 146 (6.0%) | 150 (6.8%) |
| 50 to 54 Years | 41 (1.7%) | 90 (4.1%) |
| 55 to 59 Years | 205 (8.5%) | 79 (3.6%) |
| 60 to 64 Years | 144 (5.9%) | 232 (10.5%) |
| 65 to 69 Years | 129 (5.3%) | 57 (2.6%) |
| 70 to 74 Years | 79 (3.3%) | 100 (4.5%) |
| 75 to 79 Years | 47 (1.9%) | 46 (2.1%) |
| 80 to 84 Years | 43 (1.8%) | 43 (1.9%) |
| 85 Years and over | 0 (0.0%) | 103 (4.6%) |
| Total | 2,425 (100.0%) | 2,217 (100.0%) |
Families and Households in South Tucson
Median Family Size in South Tucson
The median family size in South Tucson is 3.48 persons per family, with single male/father families (100 | 9.9%) accounting for the largest median family size of 3.77 persons per family. On the other hand, single female/mother families (490 | 48.4%) represent the smallest median family size with 3.29 persons per family.
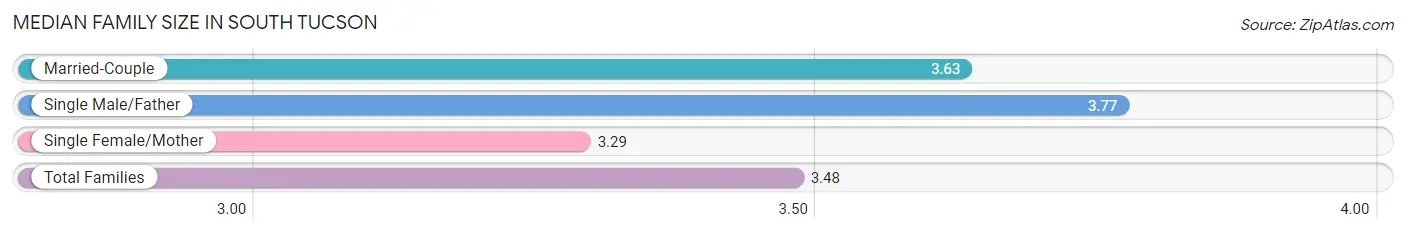
| Family Type | # Families | Family Size |
| Married-Couple | 422 (41.7%) | 3.63 |
| Single Male/Father | 100 (9.9%) | 3.77 |
| Single Female/Mother | 490 (48.4%) | 3.29 |
| Total Families | 1,012 (100.0%) | 3.48 |
Median Household Size in South Tucson
The median household size in South Tucson is 2.98 persons per household, with single male/father households (100 | 6.8%) accounting for the largest median household size of 4.54 persons per household. non-family households (468 | 31.6%) represent the smallest median household size with 1.15 persons per household.
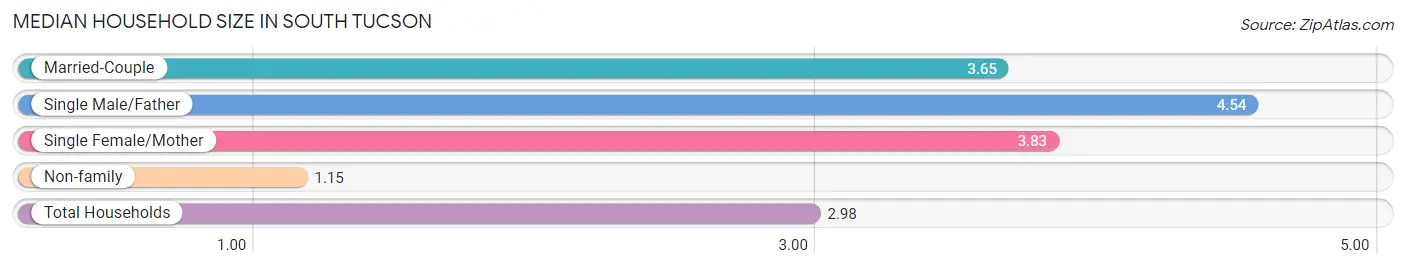
| Household Type | # Households | Household Size |
| Married-Couple | 422 (28.5%) | 3.65 |
| Single Male/Father | 100 (6.8%) | 4.54 |
| Single Female/Mother | 490 (33.1%) | 3.83 |
| Non-family | 468 (31.6%) | 1.15 |
| Total Households | 1,480 (100.0%) | 2.98 |
Household Size by Marriage Status in South Tucson
Out of a total of 1,480 households in South Tucson, 1,012 (68.4%) are family households, while 468 (31.6%) are nonfamily households. The most numerous type of family households are 2-person households, comprising 296, and the most common type of nonfamily households are 1-person households, comprising 397.
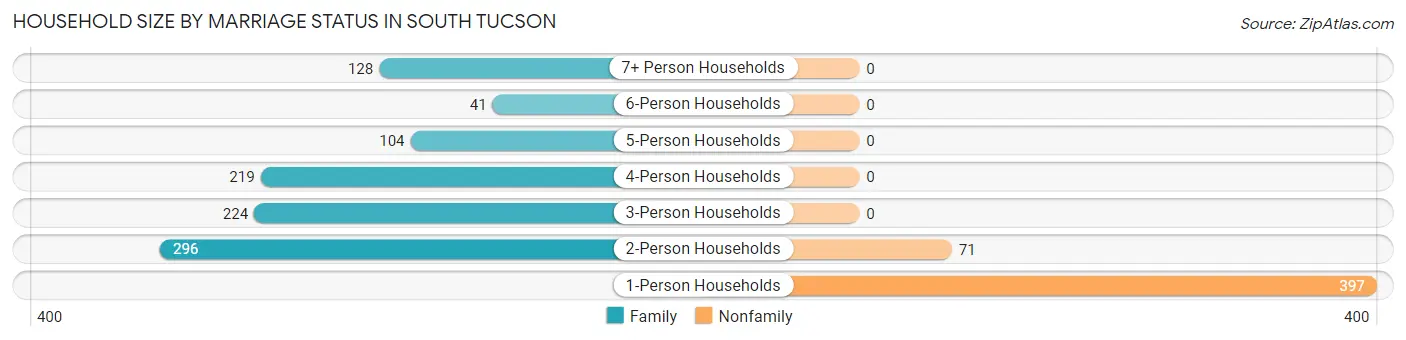
| Household Size | Family Households | Nonfamily Households |
| 1-Person Households | - | 397 (26.8%) |
| 2-Person Households | 296 (20.0%) | 71 (4.8%) |
| 3-Person Households | 224 (15.1%) | 0 (0.0%) |
| 4-Person Households | 219 (14.8%) | 0 (0.0%) |
| 5-Person Households | 104 (7.0%) | 0 (0.0%) |
| 6-Person Households | 41 (2.8%) | 0 (0.0%) |
| 7+ Person Households | 128 (8.6%) | 0 (0.0%) |
| Total | 1,012 (68.4%) | 468 (31.6%) |
Female Fertility in South Tucson
Fertility by Age in South Tucson
Average fertility rate in South Tucson is 76.0 births per 1,000 women. Women in the age bracket of 20 to 34 years have the highest fertility rate with 129.0 births per 1,000 women. Women in the age bracket of 20 to 34 years acount for 68.8% of all women with births.
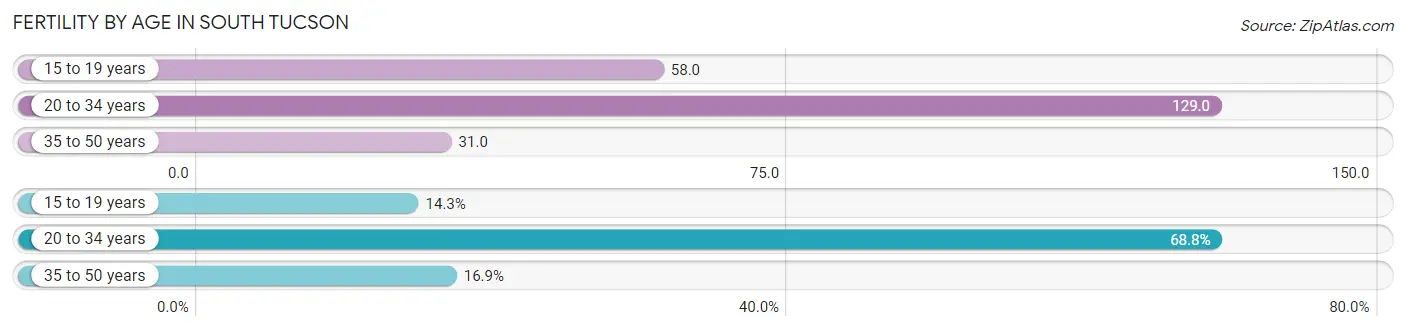
| Age Bracket | Women with Births | Births / 1,000 Women |
| 15 to 19 years | 11 (14.3%) | 58.0 |
| 20 to 34 years | 53 (68.8%) | 129.0 |
| 35 to 50 years | 13 (16.9%) | 31.0 |
| Total | 77 (100.0%) | 76.0 |
Fertility by Age by Marriage Status in South Tucson
40.3% of women with births (77) in South Tucson are married. The highest percentage of unmarried women with births falls into 15 to 19 years age bracket with 100.0% of them unmarried at the time of birth, while the lowest percentage of unmarried women with births belong to 35 to 50 years age bracket with 0.0% of them unmarried.
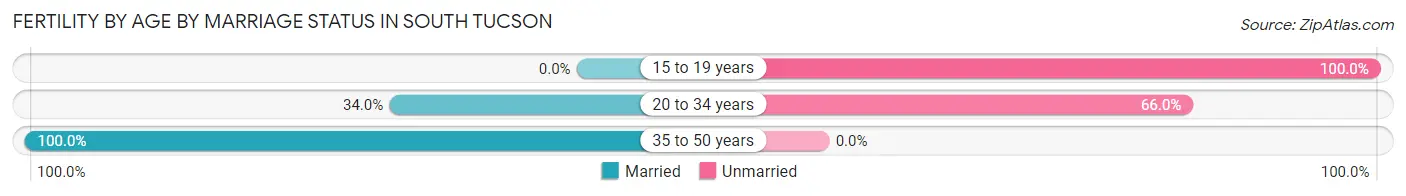
| Age Bracket | Married | Unmarried |
| 15 to 19 years | 0 (0.0%) | 11 (100.0%) |
| 20 to 34 years | 18 (34.0%) | 35 (66.0%) |
| 35 to 50 years | 13 (100.0%) | 0 (0.0%) |
| Total | 31 (40.3%) | 46 (59.7%) |
Fertility by Education in South Tucson
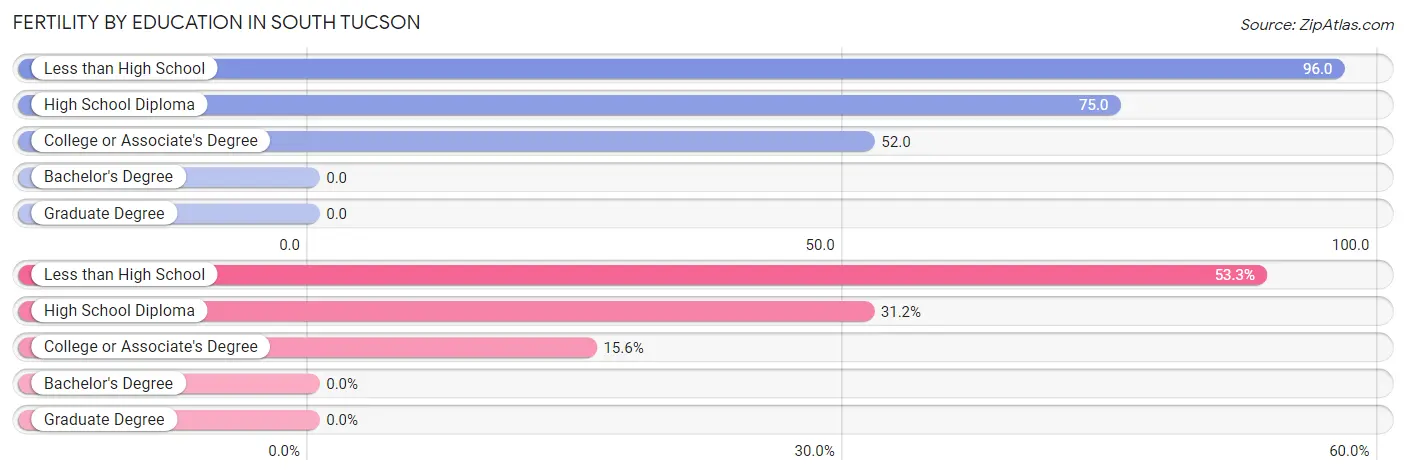
| Educational Attainment | Women with Births | Births / 1,000 Women |
| Less than High School | 41 (53.2%) | 96.0 |
| High School Diploma | 24 (31.2%) | 75.0 |
| College or Associate's Degree | 12 (15.6%) | 52.0 |
| Bachelor's Degree | 0 (0.0%) | 0.0 |
| Graduate Degree | 0 (0.0%) | 0.0 |
| Total | 77 (100.0%) | 76.0 |
Fertility by Education by Marriage Status in South Tucson
59.7% of women with births in South Tucson are unmarried. Women with the educational attainment of high school diploma are most likely to be married with 54.2% of them married at childbirth, while women with the educational attainment of college or associate's degree are least likely to be married with 100.0% of them unmarried at childbirth.
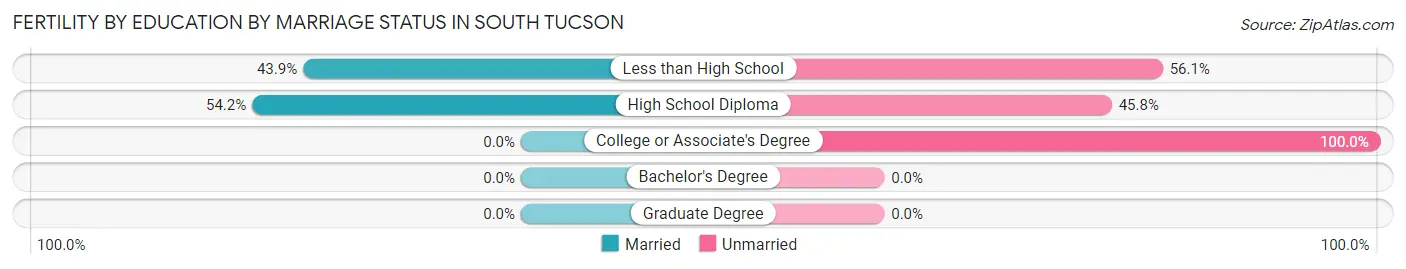
| Educational Attainment | Married | Unmarried |
| Less than High School | 18 (43.9%) | 23 (56.1%) |
| High School Diploma | 13 (54.2%) | 11 (45.8%) |
| College or Associate's Degree | 0 (0.0%) | 12 (100.0%) |
| Bachelor's Degree | 0 (0.0%) | 0 (0.0%) |
| Graduate Degree | 0 (0.0%) | 0 (0.0%) |
| Total | 31 (40.3%) | 46 (59.7%) |
Employment Characteristics in South Tucson
Employment by Class of Employer in South Tucson
Among the 1,464 employed individuals in South Tucson, private company employees (966 | 66.0%), not-for-profit organizations (130 | 8.9%), and local government employees (120 | 8.2%) make up the most common classes of employment.
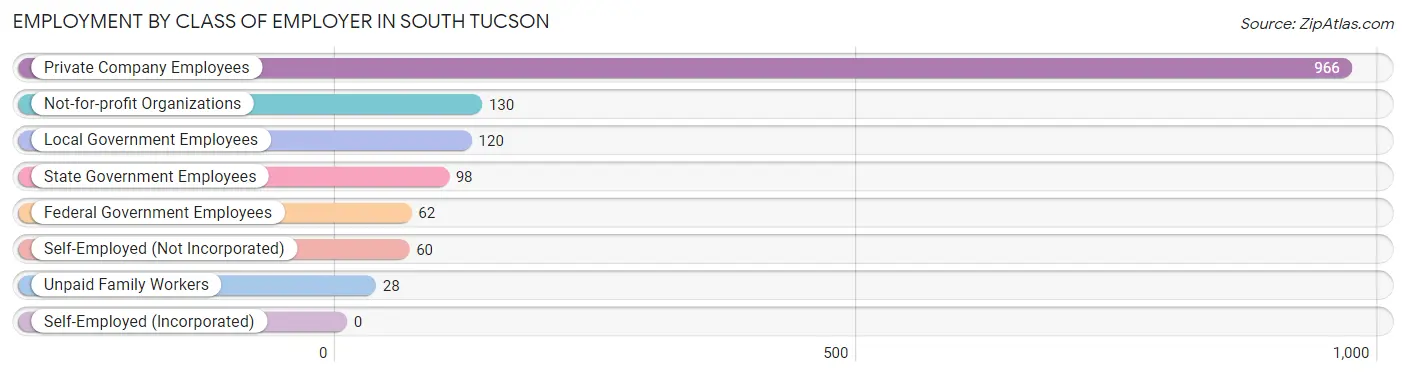
| Employer Class | # Employees | % Employees |
| Private Company Employees | 966 | 66.0% |
| Self-Employed (Incorporated) | 0 | 0.0% |
| Self-Employed (Not Incorporated) | 60 | 4.1% |
| Not-for-profit Organizations | 130 | 8.9% |
| Local Government Employees | 120 | 8.2% |
| State Government Employees | 98 | 6.7% |
| Federal Government Employees | 62 | 4.2% |
| Unpaid Family Workers | 28 | 1.9% |
| Total | 1,464 | 100.0% |
Employment Status by Age in South Tucson
According to the labor force statistics for South Tucson, out of the total population over 16 years of age (3,574), 48.6% or 1,737 individuals are in the labor force, with 14.2% or 247 of them unemployed. The age group with the highest labor force participation rate is 30 to 34 years, with 85.9% or 165 individuals in the labor force. Within the labor force, the 65 to 74 years age range has the highest percentage of unemployed individuals, with 41.9% or 54 of them being unemployed.
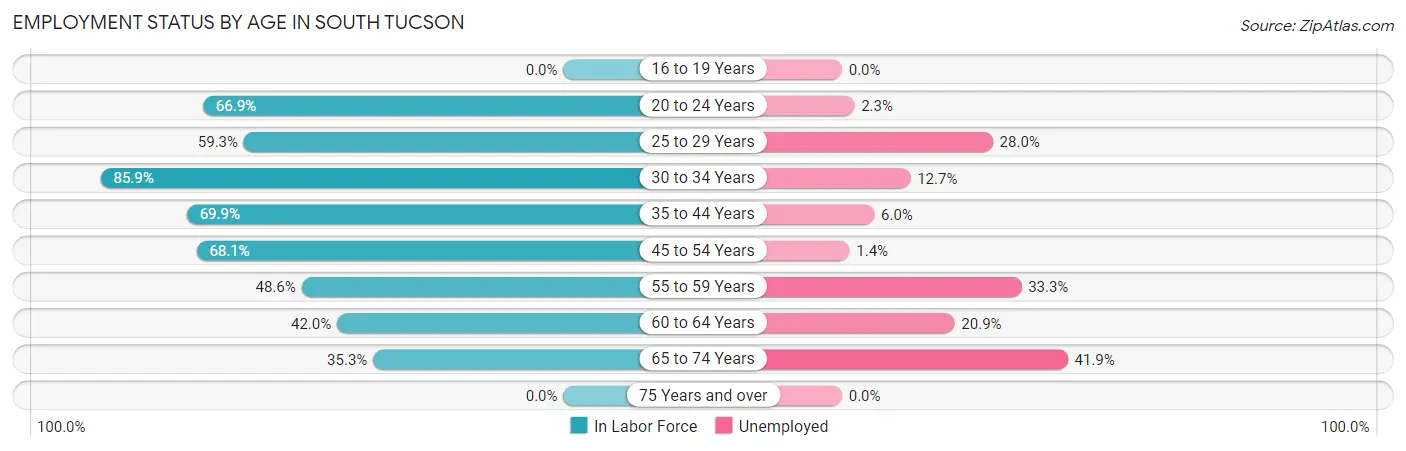
| Age Bracket | In Labor Force | Unemployed |
| 16 to 19 Years | 0 (0.0%) | 0 (0.0%) |
| 20 to 24 Years | 216 (66.9%) | 5 (2.3%) |
| 25 to 29 Years | 207 (59.3%) | 58 (28.0%) |
| 30 to 34 Years | 165 (85.9%) | 21 (12.7%) |
| 35 to 44 Years | 432 (69.9%) | 26 (6.0%) |
| 45 to 54 Years | 291 (68.1%) | 4 (1.4%) |
| 55 to 59 Years | 138 (48.6%) | 46 (33.3%) |
| 60 to 64 Years | 158 (42.0%) | 33 (20.9%) |
| 65 to 74 Years | 129 (35.3%) | 54 (41.9%) |
| 75 Years and over | 0 (0.0%) | 0 (0.0%) |
| Total | 1,737 (48.6%) | 247 (14.2%) |
Employment Status by Educational Attainment in South Tucson
According to labor force statistics for South Tucson, 61.9% of individuals (1,390) out of the total population between 25 and 64 years of age (2,246) are in the labor force, with 13.5% or 188 of them being unemployed. The group with the highest labor force participation rate are those with the educational attainment of high school diploma, with 68.6% or 568 individuals in the labor force. Within the labor force, individuals with less than high school education have the highest percentage of unemployment, with 23.4% or 83 of them being unemployed.
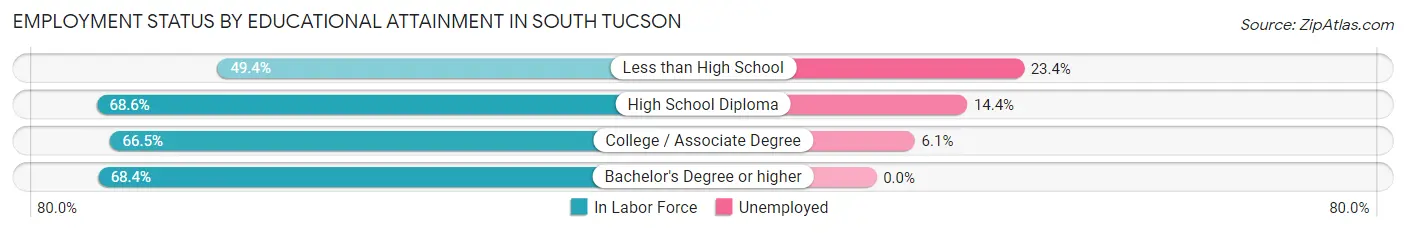
| Educational Attainment | In Labor Force | Unemployed |
| Less than High School | 354 (49.4%) | 168 (23.4%) |
| High School Diploma | 568 (68.6%) | 119 (14.4%) |
| College / Associate Degree | 378 (66.5%) | 35 (6.1%) |
| Bachelor's Degree or higher | 91 (68.4%) | 0 (0.0%) |
| Total | 1,390 (61.9%) | 303 (13.5%) |
Employment Occupations by Sex in South Tucson
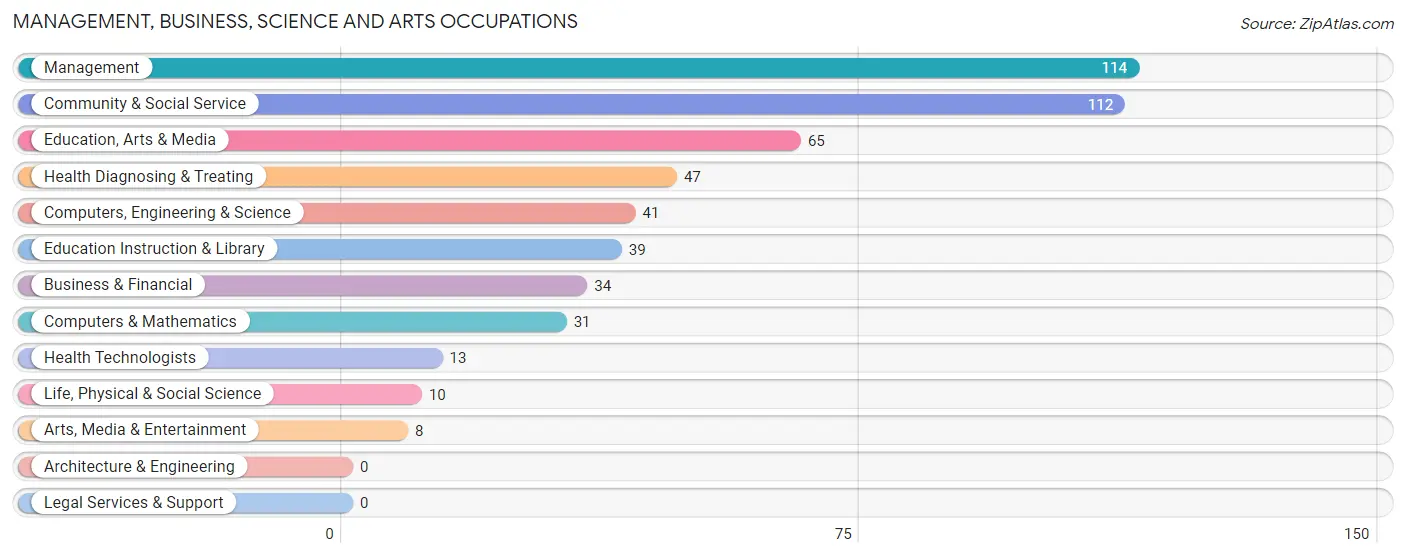
Management, Business, Science and Arts Occupations
The most common Management, Business, Science and Arts occupations in South Tucson are Management (114 | 7.7%), Community & Social Service (112 | 7.5%), Education, Arts & Media (65 | 4.4%), Health Diagnosing & Treating (47 | 3.2%), and Computers, Engineering & Science (41 | 2.8%).
Management, Business, Science and Arts Occupations by Sex
Within the Management, Business, Science and Arts occupations in South Tucson, the most male-oriented occupations are Education, Arts & Media (100.0%), Community & Social Service (58.0%), and Management (38.6%), while the most female-oriented occupations are Computers, Engineering & Science (100.0%), Computers & Mathematics (100.0%), and Life, Physical & Social Science (100.0%).
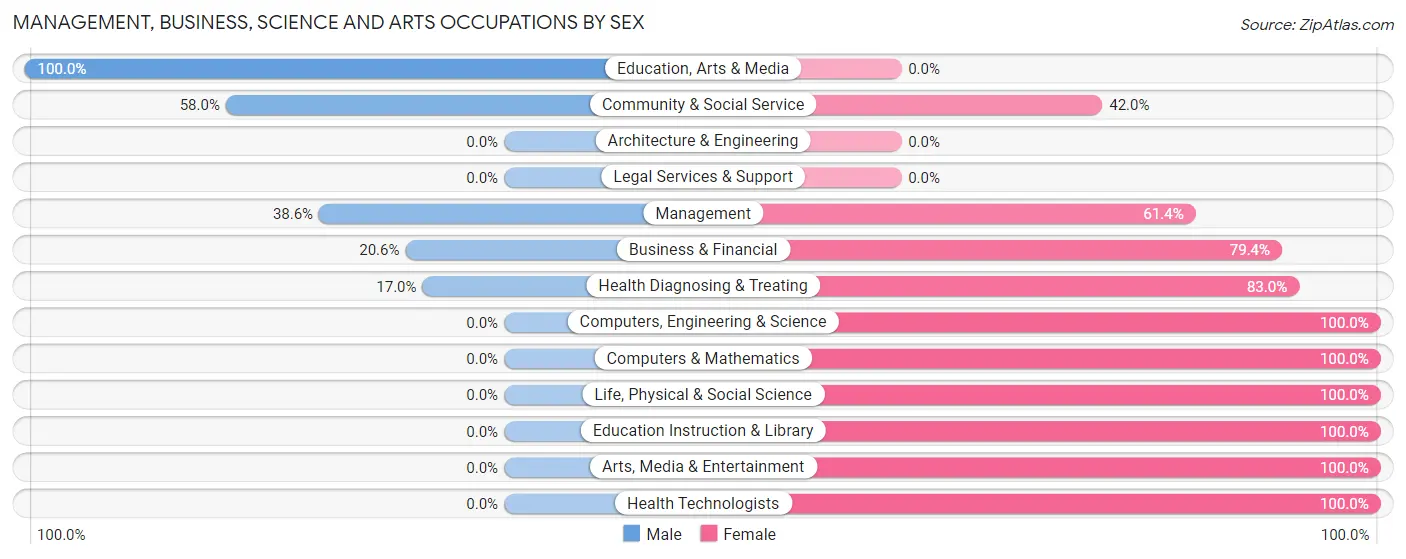
| Occupation | Male | Female |
| Management | 44 (38.6%) | 70 (61.4%) |
| Business & Financial | 7 (20.6%) | 27 (79.4%) |
| Computers, Engineering & Science | 0 (0.0%) | 41 (100.0%) |
| Computers & Mathematics | 0 (0.0%) | 31 (100.0%) |
| Architecture & Engineering | 0 (0.0%) | 0 (0.0%) |
| Life, Physical & Social Science | 0 (0.0%) | 10 (100.0%) |
| Community & Social Service | 65 (58.0%) | 47 (42.0%) |
| Education, Arts & Media | 65 (100.0%) | 0 (0.0%) |
| Legal Services & Support | 0 (0.0%) | 0 (0.0%) |
| Education Instruction & Library | 0 (0.0%) | 39 (100.0%) |
| Arts, Media & Entertainment | 0 (0.0%) | 8 (100.0%) |
| Health Diagnosing & Treating | 8 (17.0%) | 39 (83.0%) |
| Health Technologists | 0 (0.0%) | 13 (100.0%) |
| Total (Category) | 124 (35.6%) | 224 (64.4%) |
| Total (Overall) | 867 (58.2%) | 622 (41.8%) |
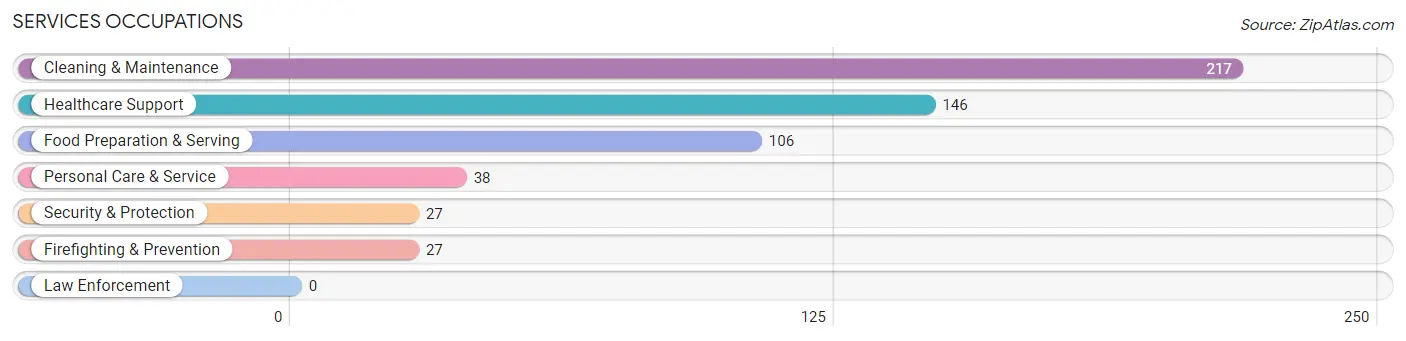
Services Occupations
The most common Services occupations in South Tucson are Cleaning & Maintenance (217 | 14.6%), Healthcare Support (146 | 9.8%), Food Preparation & Serving (106 | 7.1%), Personal Care & Service (38 | 2.5%), and Security & Protection (27 | 1.8%).
Services Occupations by Sex
Within the Services occupations in South Tucson, the most male-oriented occupations are Cleaning & Maintenance (59.0%), Security & Protection (51.8%), and Firefighting & Prevention (51.8%), while the most female-oriented occupations are Healthcare Support (70.6%), Food Preparation & Serving (67.9%), and Personal Care & Service (52.6%).
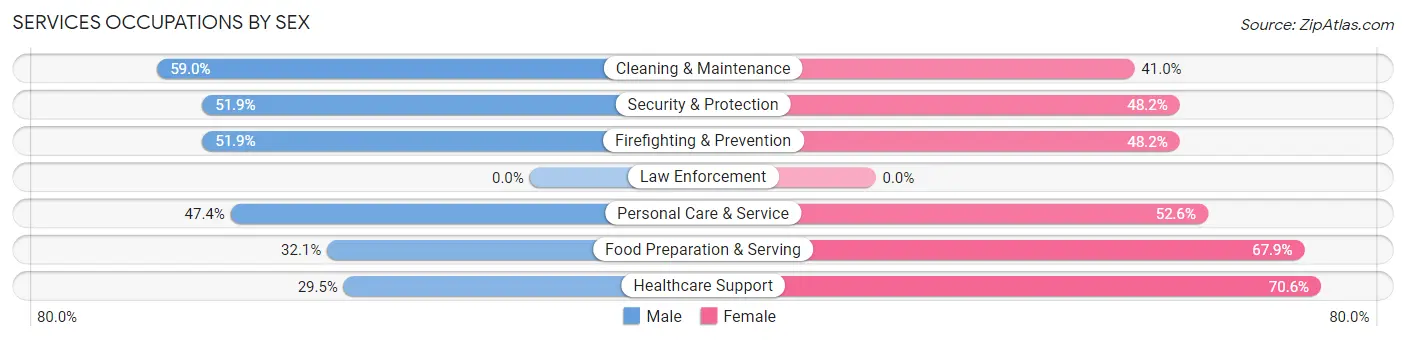
| Occupation | Male | Female |
| Healthcare Support | 43 (29.4%) | 103 (70.6%) |
| Security & Protection | 14 (51.8%) | 13 (48.1%) |
| Firefighting & Prevention | 14 (51.8%) | 13 (48.1%) |
| Law Enforcement | 0 (0.0%) | 0 (0.0%) |
| Food Preparation & Serving | 34 (32.1%) | 72 (67.9%) |
| Cleaning & Maintenance | 128 (59.0%) | 89 (41.0%) |
| Personal Care & Service | 18 (47.4%) | 20 (52.6%) |
| Total (Category) | 237 (44.4%) | 297 (55.6%) |
| Total (Overall) | 867 (58.2%) | 622 (41.8%) |
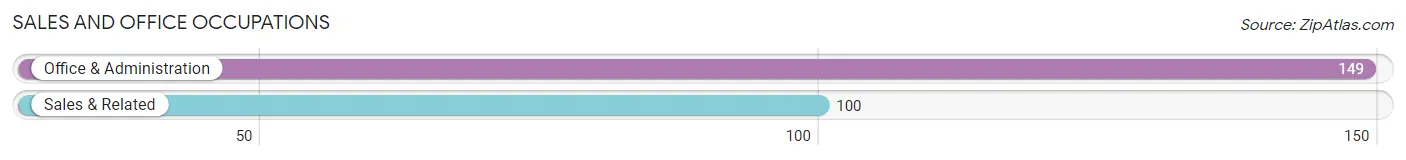
Sales and Office Occupations
The most common Sales and Office occupations in South Tucson are Office & Administration (149 | 10.0%), and Sales & Related (100 | 6.7%).
Sales and Office Occupations by Sex
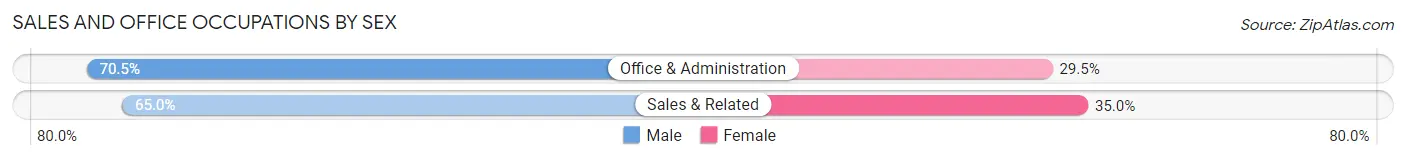
| Occupation | Male | Female |
| Sales & Related | 65 (65.0%) | 35 (35.0%) |
| Office & Administration | 105 (70.5%) | 44 (29.5%) |
| Total (Category) | 170 (68.3%) | 79 (31.7%) |
| Total (Overall) | 867 (58.2%) | 622 (41.8%) |
Natural Resources, Construction and Maintenance Occupations
The most common Natural Resources, Construction and Maintenance occupations in South Tucson are Construction & Extraction (67 | 4.5%), and Installation, Maintenance & Repair (41 | 2.8%).
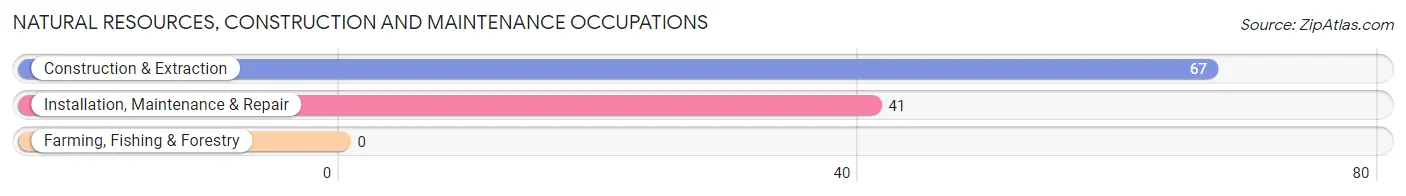
Natural Resources, Construction and Maintenance Occupations by Sex
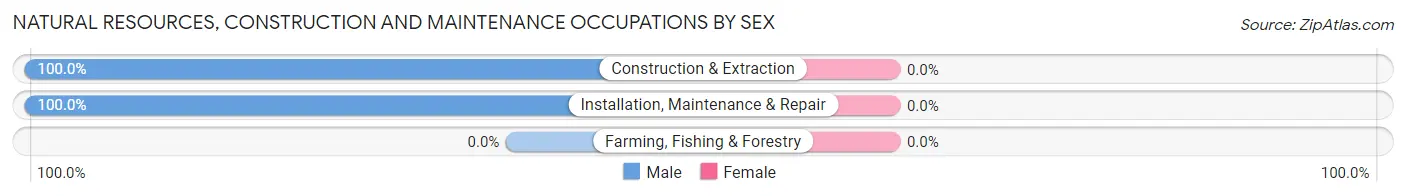
| Occupation | Male | Female |
| Farming, Fishing & Forestry | 0 (0.0%) | 0 (0.0%) |
| Construction & Extraction | 67 (100.0%) | 0 (0.0%) |
| Installation, Maintenance & Repair | 41 (100.0%) | 0 (0.0%) |
| Total (Category) | 108 (100.0%) | 0 (0.0%) |
| Total (Overall) | 867 (58.2%) | 622 (41.8%) |
Production, Transportation and Moving Occupations
The most common Production, Transportation and Moving occupations in South Tucson are Material Moving (145 | 9.7%), Production (71 | 4.8%), and Transportation (34 | 2.3%).
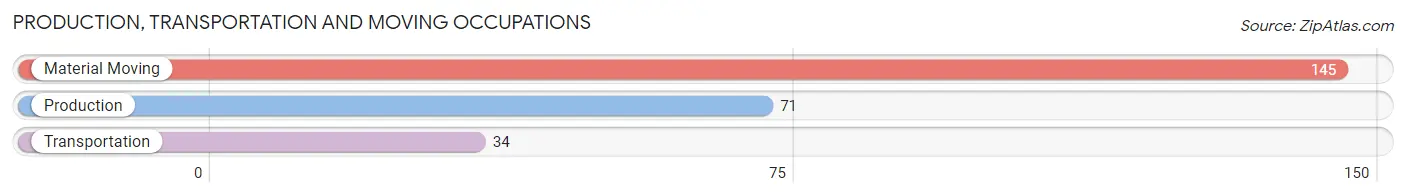
Production, Transportation and Moving Occupations by Sex
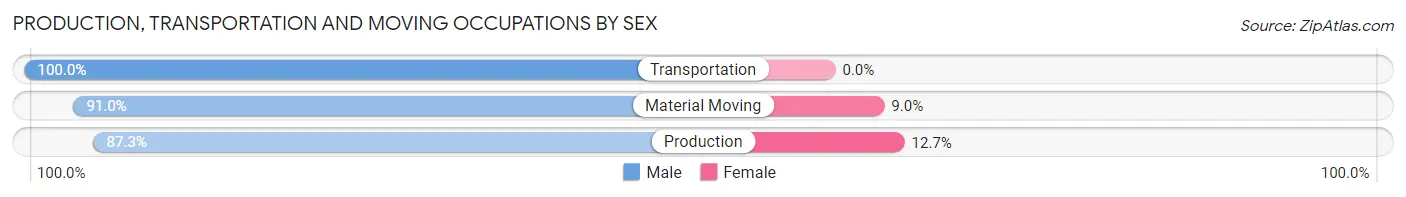
| Occupation | Male | Female |
| Production | 62 (87.3%) | 9 (12.7%) |
| Transportation | 34 (100.0%) | 0 (0.0%) |
| Material Moving | 132 (91.0%) | 13 (9.0%) |
| Total (Category) | 228 (91.2%) | 22 (8.8%) |
| Total (Overall) | 867 (58.2%) | 622 (41.8%) |
Employment Industries by Sex in South Tucson
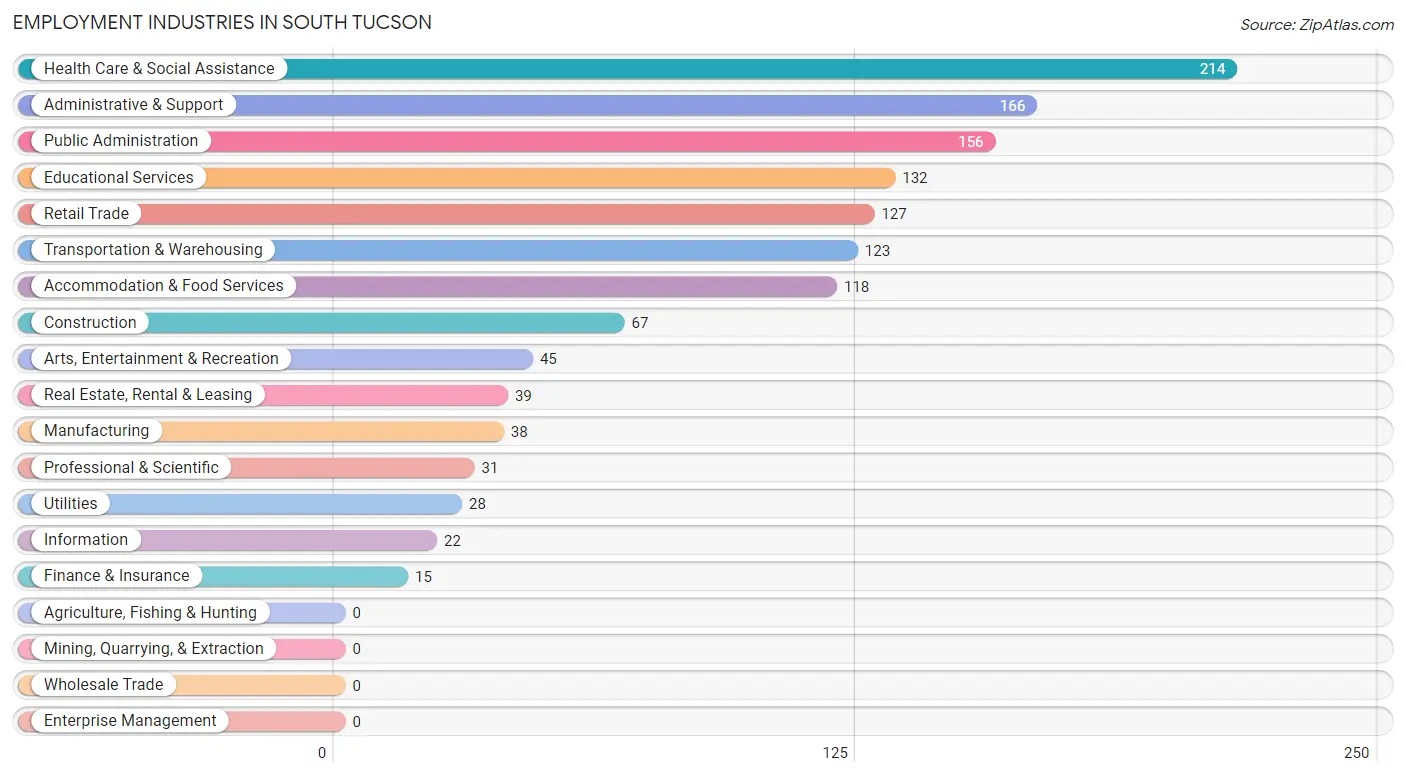
Employment Industries in South Tucson
The major employment industries in South Tucson include Health Care & Social Assistance (214 | 14.4%), Administrative & Support (166 | 11.2%), Public Administration (156 | 10.5%), Educational Services (132 | 8.9%), and Retail Trade (127 | 8.5%).
Employment Industries by Sex in South Tucson
The South Tucson industries that see more men than women are Construction (100.0%), Utilities (100.0%), and Finance & Insurance (100.0%), whereas the industries that tend to have a higher number of women are Professional & Scientific (100.0%), Information (77.3%), and Health Care & Social Assistance (71.5%).
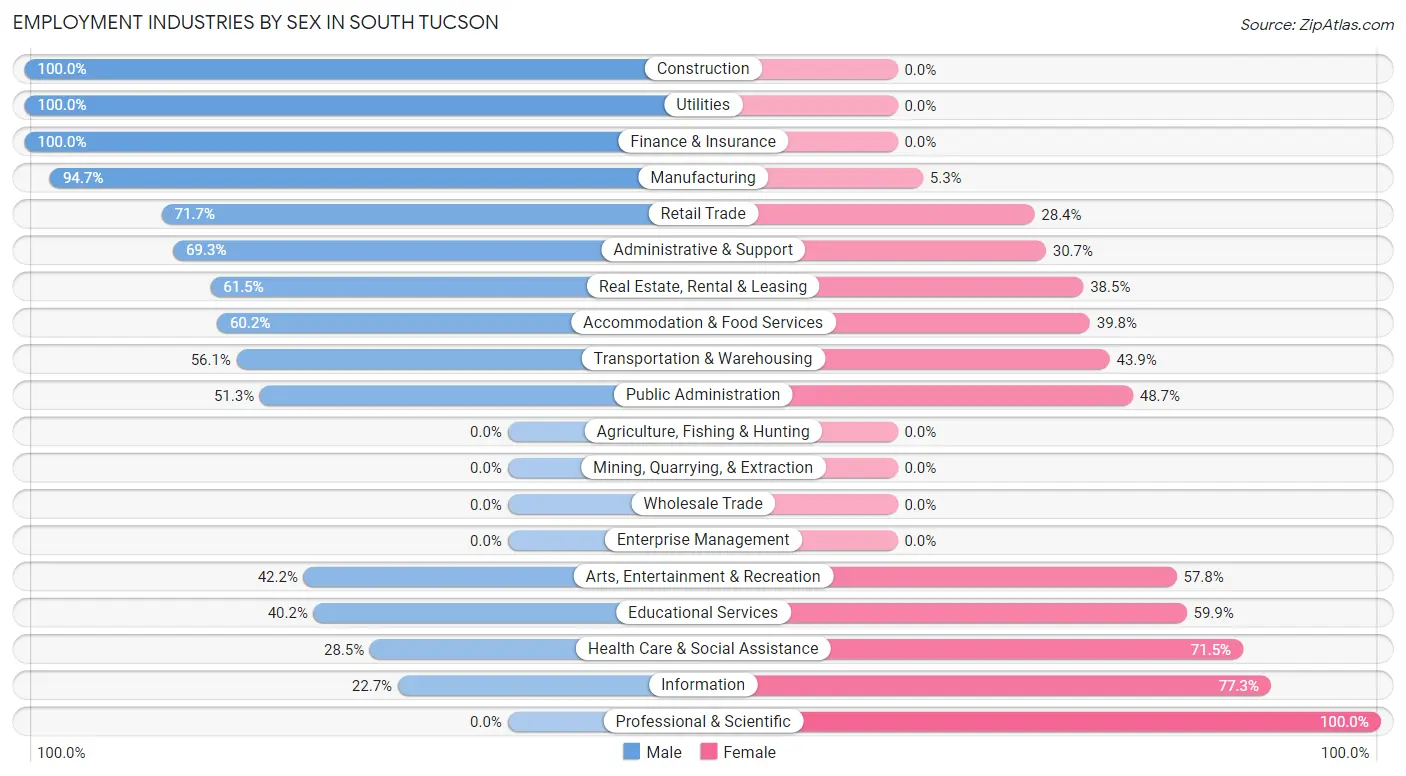
| Industry | Male | Female |
| Agriculture, Fishing & Hunting | 0 (0.0%) | 0 (0.0%) |
| Mining, Quarrying, & Extraction | 0 (0.0%) | 0 (0.0%) |
| Construction | 67 (100.0%) | 0 (0.0%) |
| Manufacturing | 36 (94.7%) | 2 (5.3%) |
| Wholesale Trade | 0 (0.0%) | 0 (0.0%) |
| Retail Trade | 91 (71.7%) | 36 (28.3%) |
| Transportation & Warehousing | 69 (56.1%) | 54 (43.9%) |
| Utilities | 28 (100.0%) | 0 (0.0%) |
| Information | 5 (22.7%) | 17 (77.3%) |
| Finance & Insurance | 15 (100.0%) | 0 (0.0%) |
| Real Estate, Rental & Leasing | 24 (61.5%) | 15 (38.5%) |
| Professional & Scientific | 0 (0.0%) | 31 (100.0%) |
| Enterprise Management | 0 (0.0%) | 0 (0.0%) |
| Administrative & Support | 115 (69.3%) | 51 (30.7%) |
| Educational Services | 53 (40.2%) | 79 (59.9%) |
| Health Care & Social Assistance | 61 (28.5%) | 153 (71.5%) |
| Arts, Entertainment & Recreation | 19 (42.2%) | 26 (57.8%) |
| Accommodation & Food Services | 71 (60.2%) | 47 (39.8%) |
| Public Administration | 80 (51.3%) | 76 (48.7%) |
| Total | 867 (58.2%) | 622 (41.8%) |
Education in South Tucson
School Enrollment in South Tucson
The most common levels of schooling among the 1,335 students in South Tucson are high school (405 | 30.3%), middle school (384 | 28.8%), and elementary school (358 | 26.8%).
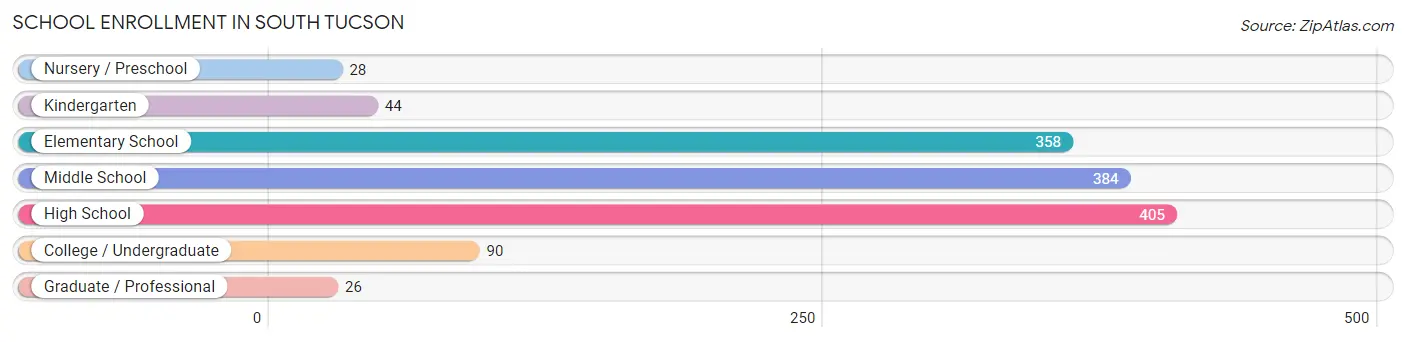
| School Level | # Students | % Students |
| Nursery / Preschool | 28 | 2.1% |
| Kindergarten | 44 | 3.3% |
| Elementary School | 358 | 26.8% |
| Middle School | 384 | 28.8% |
| High School | 405 | 30.3% |
| College / Undergraduate | 90 | 6.7% |
| Graduate / Professional | 26 | 1.9% |
| Total | 1,335 | 100.0% |
School Enrollment by Age by Funding Source in South Tucson
Out of a total of 1,335 students who are enrolled in schools in South Tucson, 119 (8.9%) attend a private institution, while the remaining 1,216 (91.1%) are enrolled in public schools. The age group of 35 years and over has the highest likelihood of being enrolled in private schools, with 8 (38.1% in the age bracket) enrolled. Conversely, the age group of 10 to 14 year olds has the lowest likelihood of being enrolled in a private school, with 416 (94.8% in the age bracket) attending a public institution.
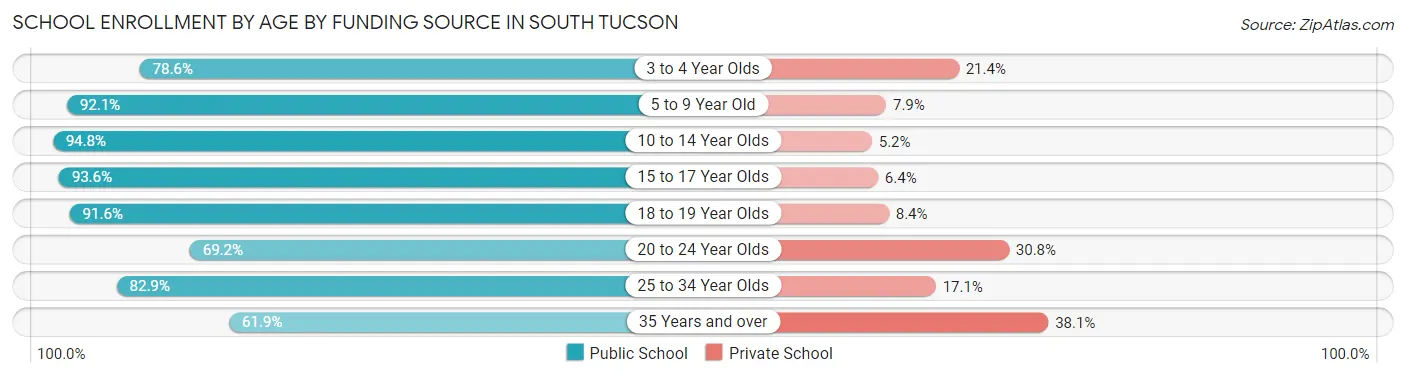
| Age Bracket | Public School | Private School |
| 3 to 4 Year Olds | 22 (78.6%) | 6 (21.4%) |
| 5 to 9 Year Old | 362 (92.1%) | 31 (7.9%) |
| 10 to 14 Year Olds | 416 (94.8%) | 23 (5.2%) |
| 15 to 17 Year Olds | 220 (93.6%) | 15 (6.4%) |
| 18 to 19 Year Olds | 109 (91.6%) | 10 (8.4%) |
| 20 to 24 Year Olds | 45 (69.2%) | 20 (30.8%) |
| 25 to 34 Year Olds | 29 (82.9%) | 6 (17.1%) |
| 35 Years and over | 13 (61.9%) | 8 (38.1%) |
| Total | 1,216 (91.1%) | 119 (8.9%) |
Educational Attainment by Field of Study in South Tucson
Education (67 | 24.1%), arts & humanities (61 | 21.9%), liberal arts & history (60 | 21.6%), business (25 | 9.0%), and science & technology (21 | 7.5%) are the most common fields of study among 278 individuals in South Tucson who have obtained a bachelor's degree or higher.
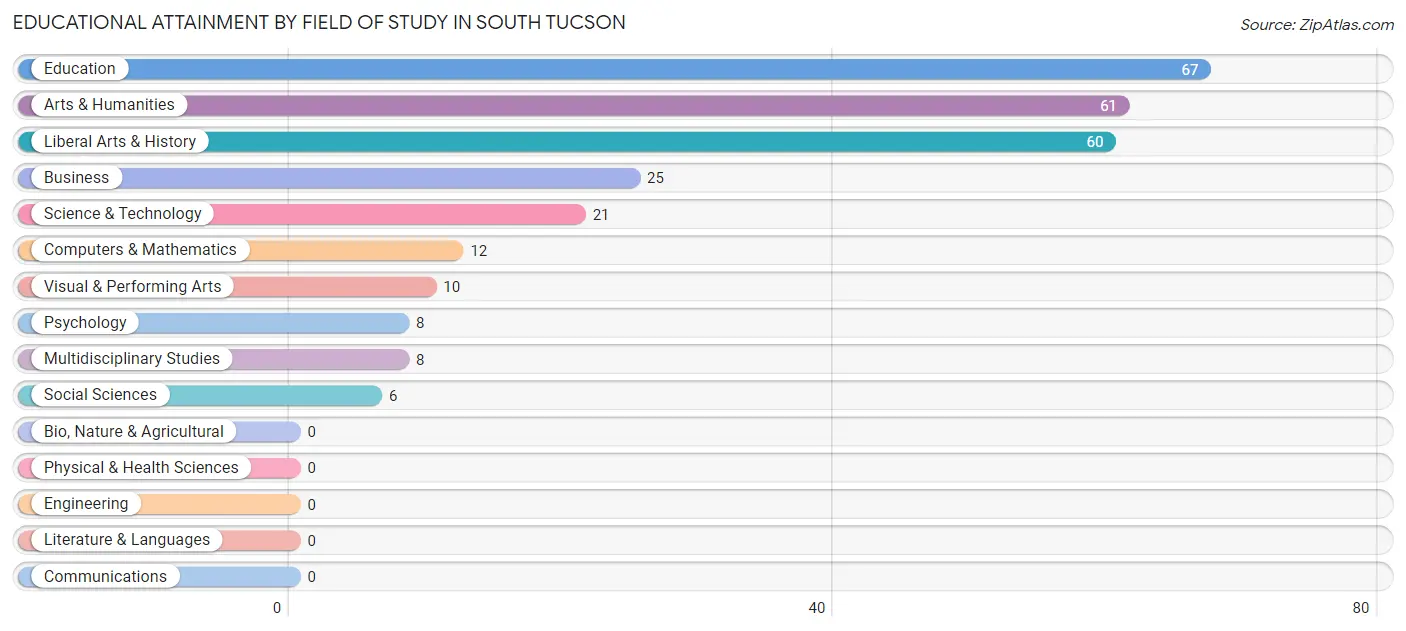
| Field of Study | # Graduates | % Graduates |
| Computers & Mathematics | 12 | 4.3% |
| Bio, Nature & Agricultural | 0 | 0.0% |
| Physical & Health Sciences | 0 | 0.0% |
| Psychology | 8 | 2.9% |
| Social Sciences | 6 | 2.2% |
| Engineering | 0 | 0.0% |
| Multidisciplinary Studies | 8 | 2.9% |
| Science & Technology | 21 | 7.5% |
| Business | 25 | 9.0% |
| Education | 67 | 24.1% |
| Literature & Languages | 0 | 0.0% |
| Liberal Arts & History | 60 | 21.6% |
| Visual & Performing Arts | 10 | 3.6% |
| Communications | 0 | 0.0% |
| Arts & Humanities | 61 | 21.9% |
| Total | 278 | 100.0% |
Transportation & Commute in South Tucson
Vehicle Availability by Sex in South Tucson
The most prevalent vehicle ownership categories in South Tucson are males with 2 vehicles (404, accounting for 51.9%) and females with 2 vehicles (255, making up 66.3%).
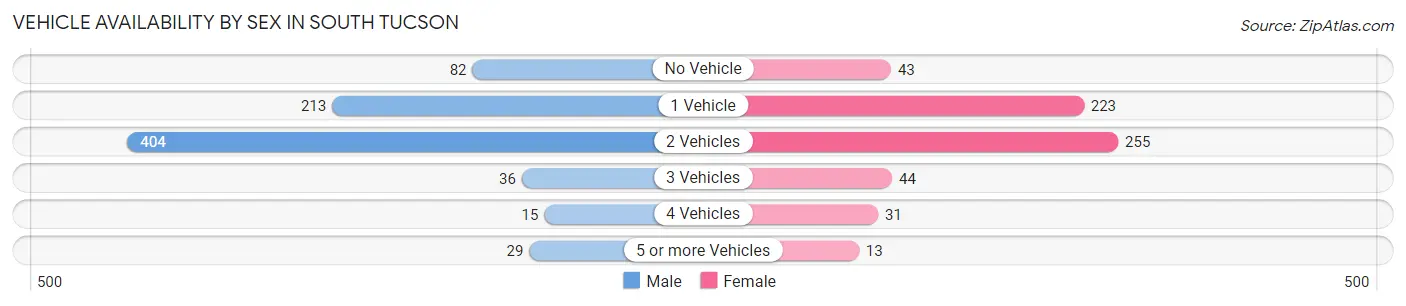
| Vehicles Available | Male | Female |
| No Vehicle | 82 (10.5%) | 43 (7.1%) |
| 1 Vehicle | 213 (27.3%) | 223 (36.6%) |
| 2 Vehicles | 404 (51.9%) | 255 (41.9%) |
| 3 Vehicles | 36 (4.6%) | 44 (7.2%) |
| 4 Vehicles | 15 (1.9%) | 31 (5.1%) |
| 5 or more Vehicles | 29 (3.7%) | 13 (2.1%) |
| Total | 779 (100.0%) | 609 (100.0%) |
Commute Time in South Tucson
The most frequently occuring commute durations in South Tucson are 15 to 19 minutes (317 commuters, 22.1%), 5 to 9 minutes (300 commuters, 20.9%), and 10 to 14 minutes (213 commuters, 14.8%).
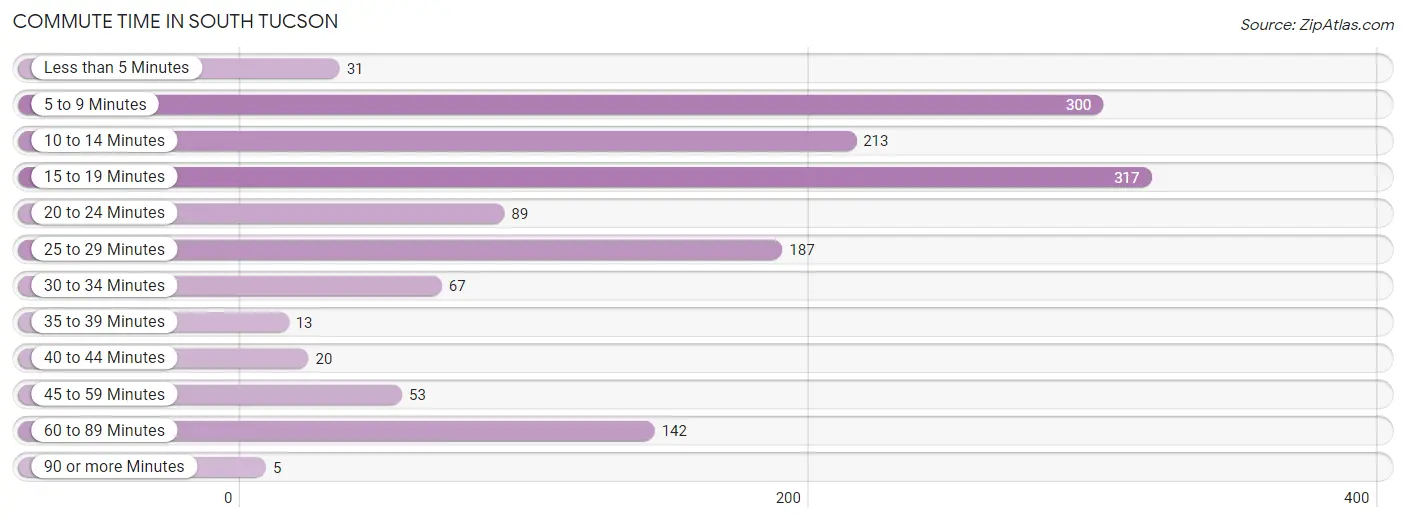
| Commute Time | # Commuters | % Commuters |
| Less than 5 Minutes | 31 | 2.2% |
| 5 to 9 Minutes | 300 | 20.9% |
| 10 to 14 Minutes | 213 | 14.8% |
| 15 to 19 Minutes | 317 | 22.1% |
| 20 to 24 Minutes | 89 | 6.2% |
| 25 to 29 Minutes | 187 | 13.0% |
| 30 to 34 Minutes | 67 | 4.7% |
| 35 to 39 Minutes | 13 | 0.9% |
| 40 to 44 Minutes | 20 | 1.4% |
| 45 to 59 Minutes | 53 | 3.7% |
| 60 to 89 Minutes | 142 | 9.9% |
| 90 or more Minutes | 5 | 0.4% |
Commute Time by Sex in South Tucson
The most common commute times in South Tucson are 15 to 19 minutes (211 commuters, 25.0%) for males and 5 to 9 minutes (114 commuters, 19.2%) for females.
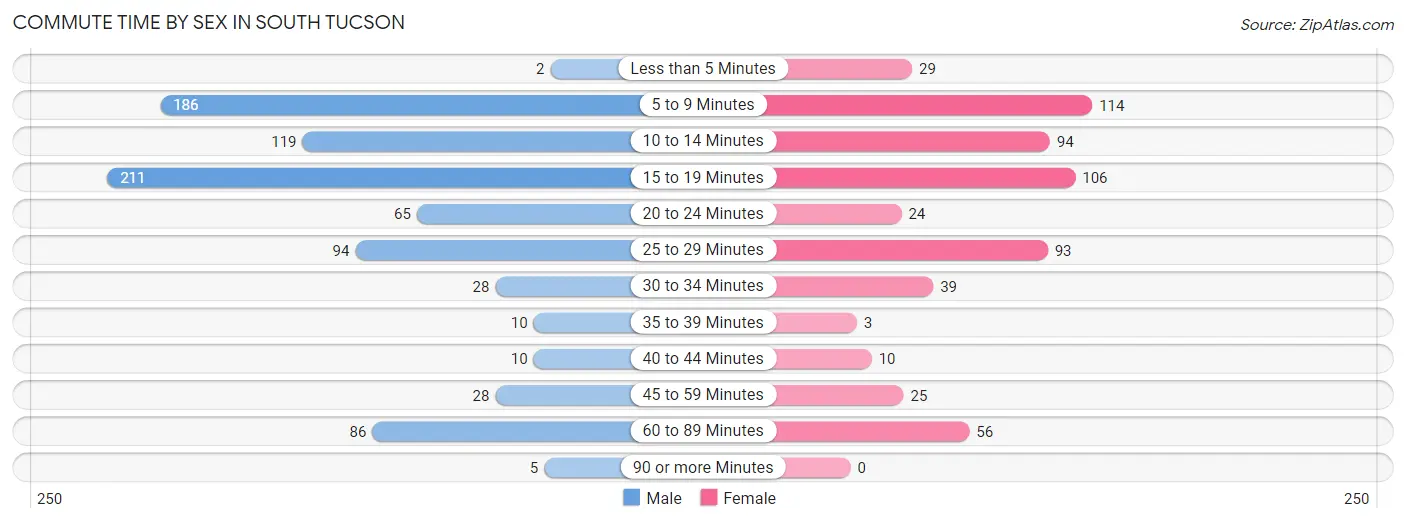
| Commute Time | Male | Female |
| Less than 5 Minutes | 2 (0.2%) | 29 (4.9%) |
| 5 to 9 Minutes | 186 (22.0%) | 114 (19.2%) |
| 10 to 14 Minutes | 119 (14.1%) | 94 (15.9%) |
| 15 to 19 Minutes | 211 (25.0%) | 106 (17.9%) |
| 20 to 24 Minutes | 65 (7.7%) | 24 (4.1%) |
| 25 to 29 Minutes | 94 (11.1%) | 93 (15.7%) |
| 30 to 34 Minutes | 28 (3.3%) | 39 (6.6%) |
| 35 to 39 Minutes | 10 (1.2%) | 3 (0.5%) |
| 40 to 44 Minutes | 10 (1.2%) | 10 (1.7%) |
| 45 to 59 Minutes | 28 (3.3%) | 25 (4.2%) |
| 60 to 89 Minutes | 86 (10.2%) | 56 (9.4%) |
| 90 or more Minutes | 5 (0.6%) | 0 (0.0%) |
Time of Departure to Work by Sex in South Tucson
The most frequent times of departure to work in South Tucson are 6:30 AM to 6:59 AM (112, 13.3%) for males and 7:00 AM to 7:29 AM (104, 17.5%) for females.
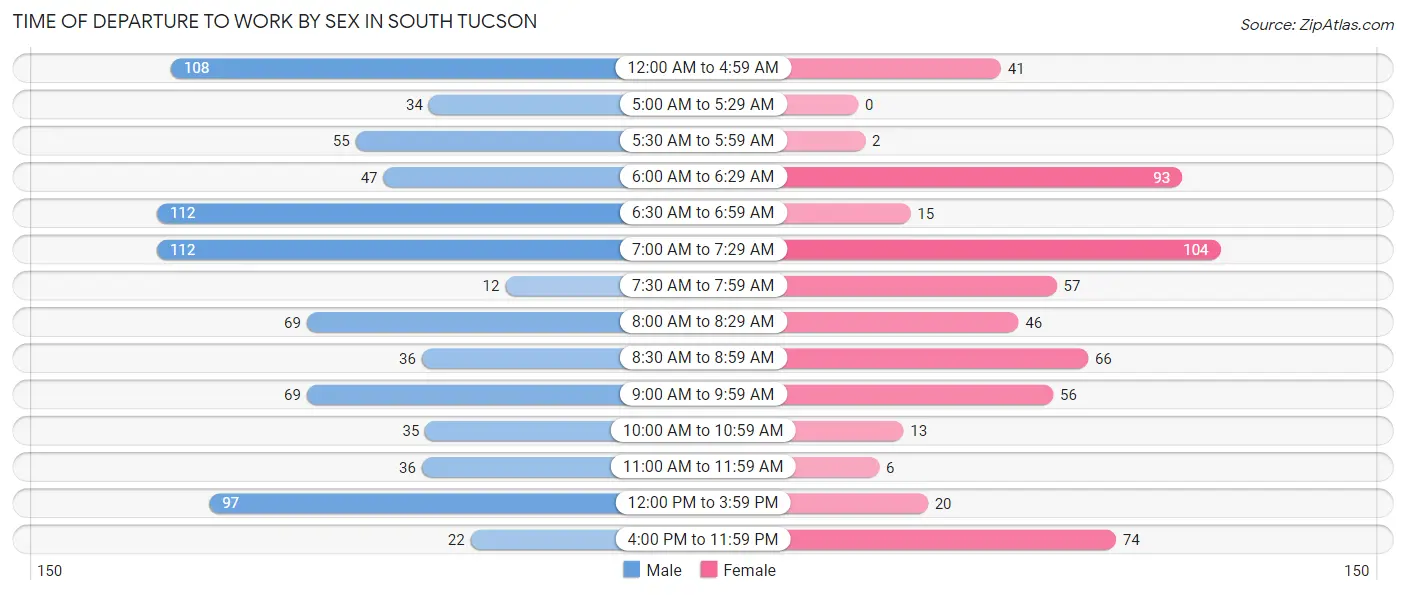
| Time of Departure | Male | Female |
| 12:00 AM to 4:59 AM | 108 (12.8%) | 41 (6.9%) |
| 5:00 AM to 5:29 AM | 34 (4.0%) | 0 (0.0%) |
| 5:30 AM to 5:59 AM | 55 (6.5%) | 2 (0.3%) |
| 6:00 AM to 6:29 AM | 47 (5.6%) | 93 (15.7%) |
| 6:30 AM to 6:59 AM | 112 (13.3%) | 15 (2.5%) |
| 7:00 AM to 7:29 AM | 112 (13.3%) | 104 (17.5%) |
| 7:30 AM to 7:59 AM | 12 (1.4%) | 57 (9.6%) |
| 8:00 AM to 8:29 AM | 69 (8.2%) | 46 (7.8%) |
| 8:30 AM to 8:59 AM | 36 (4.3%) | 66 (11.1%) |
| 9:00 AM to 9:59 AM | 69 (8.2%) | 56 (9.4%) |
| 10:00 AM to 10:59 AM | 35 (4.2%) | 13 (2.2%) |
| 11:00 AM to 11:59 AM | 36 (4.3%) | 6 (1.0%) |
| 12:00 PM to 3:59 PM | 97 (11.5%) | 20 (3.4%) |
| 4:00 PM to 11:59 PM | 22 (2.6%) | 74 (12.5%) |
| Total | 844 (100.0%) | 593 (100.0%) |
Housing Occupancy in South Tucson
Occupancy by Ownership in South Tucson
Of the total 1,480 dwellings in South Tucson, owner-occupied units account for 576 (38.9%), while renter-occupied units make up 904 (61.1%).
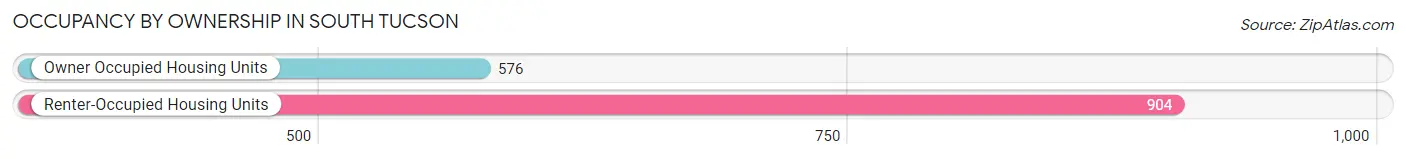
| Occupancy | # Housing Units | % Housing Units |
| Owner Occupied Housing Units | 576 | 38.9% |
| Renter-Occupied Housing Units | 904 | 61.1% |
| Total Occupied Housing Units | 1,480 | 100.0% |
Occupancy by Household Size in South Tucson
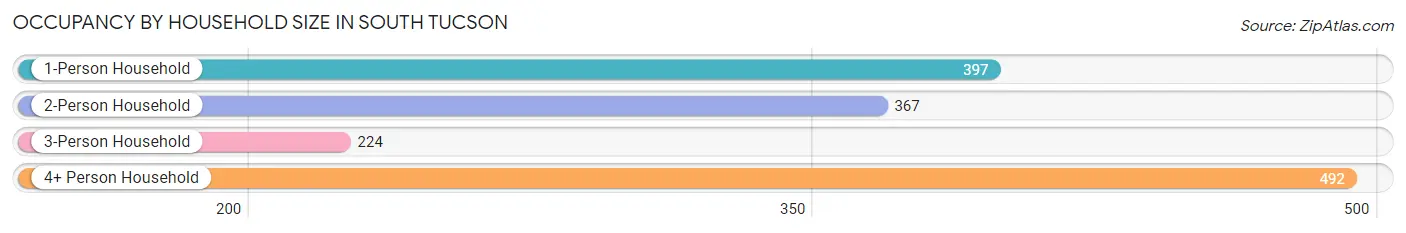
| Household Size | # Housing Units | % Housing Units |
| 1-Person Household | 397 | 26.8% |
| 2-Person Household | 367 | 24.8% |
| 3-Person Household | 224 | 15.1% |
| 4+ Person Household | 492 | 33.2% |
| Total Housing Units | 1,480 | 100.0% |
Occupancy by Ownership by Household Size in South Tucson
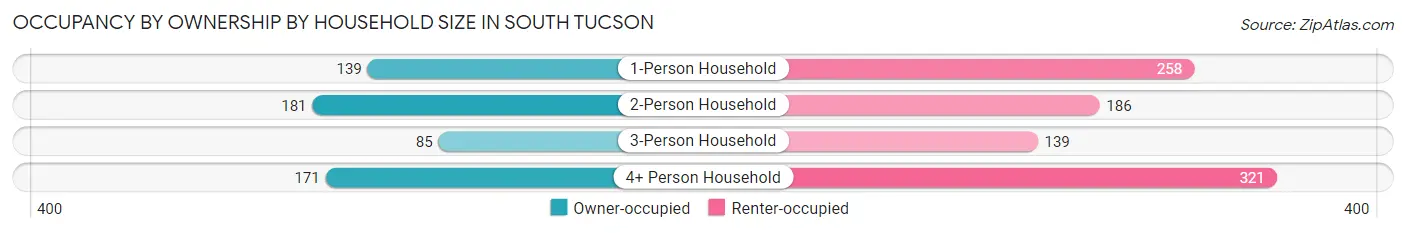
| Household Size | Owner-occupied | Renter-occupied |
| 1-Person Household | 139 (35.0%) | 258 (65.0%) |
| 2-Person Household | 181 (49.3%) | 186 (50.7%) |
| 3-Person Household | 85 (38.0%) | 139 (62.1%) |
| 4+ Person Household | 171 (34.8%) | 321 (65.2%) |
| Total Housing Units | 576 (38.9%) | 904 (61.1%) |
Occupancy by Educational Attainment in South Tucson
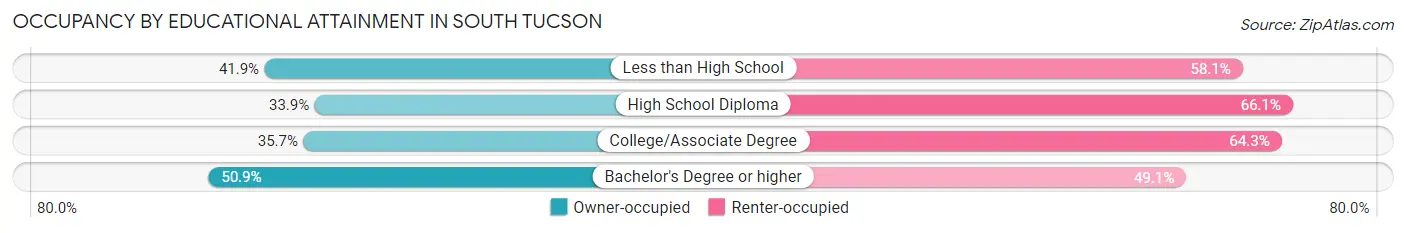
| Household Size | Owner-occupied | Renter-occupied |
| Less than High School | 196 (41.9%) | 272 (58.1%) |
| High School Diploma | 151 (33.9%) | 294 (66.1%) |
| College/Associate Degree | 140 (35.7%) | 252 (64.3%) |
| Bachelor's Degree or higher | 89 (50.9%) | 86 (49.1%) |
Occupancy by Age of Householder in South Tucson
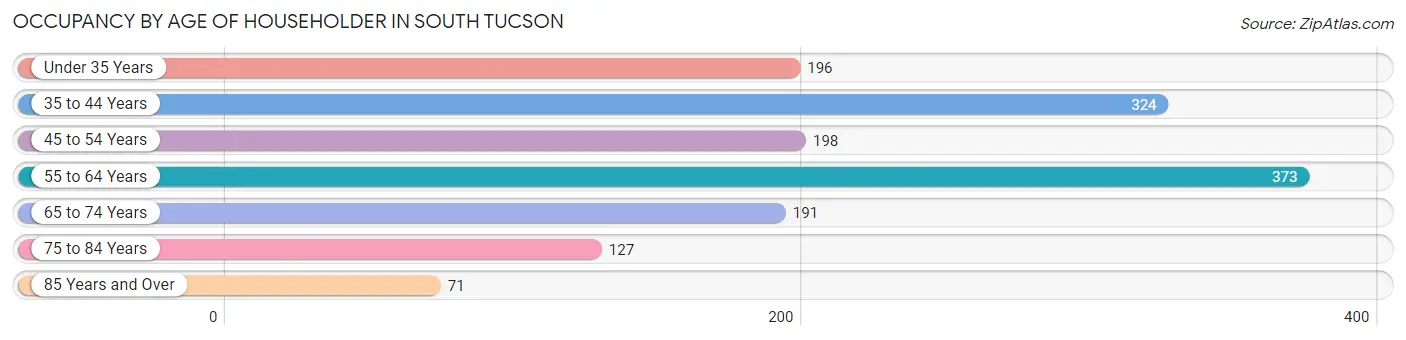
| Age Bracket | # Households | % Households |
| Under 35 Years | 196 | 13.2% |
| 35 to 44 Years | 324 | 21.9% |
| 45 to 54 Years | 198 | 13.4% |
| 55 to 64 Years | 373 | 25.2% |
| 65 to 74 Years | 191 | 12.9% |
| 75 to 84 Years | 127 | 8.6% |
| 85 Years and Over | 71 | 4.8% |
| Total | 1,480 | 100.0% |
Housing Finances in South Tucson
Median Income by Occupancy in South Tucson
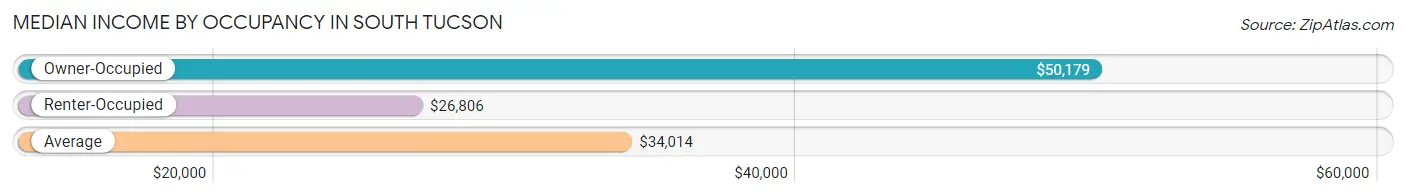
| Occupancy Type | # Households | Median Income |
| Owner-Occupied | 576 (38.9%) | $50,179 |
| Renter-Occupied | 904 (61.1%) | $26,806 |
| Average | 1,480 (100.0%) | $34,014 |
Occupancy by Householder Income Bracket in South Tucson
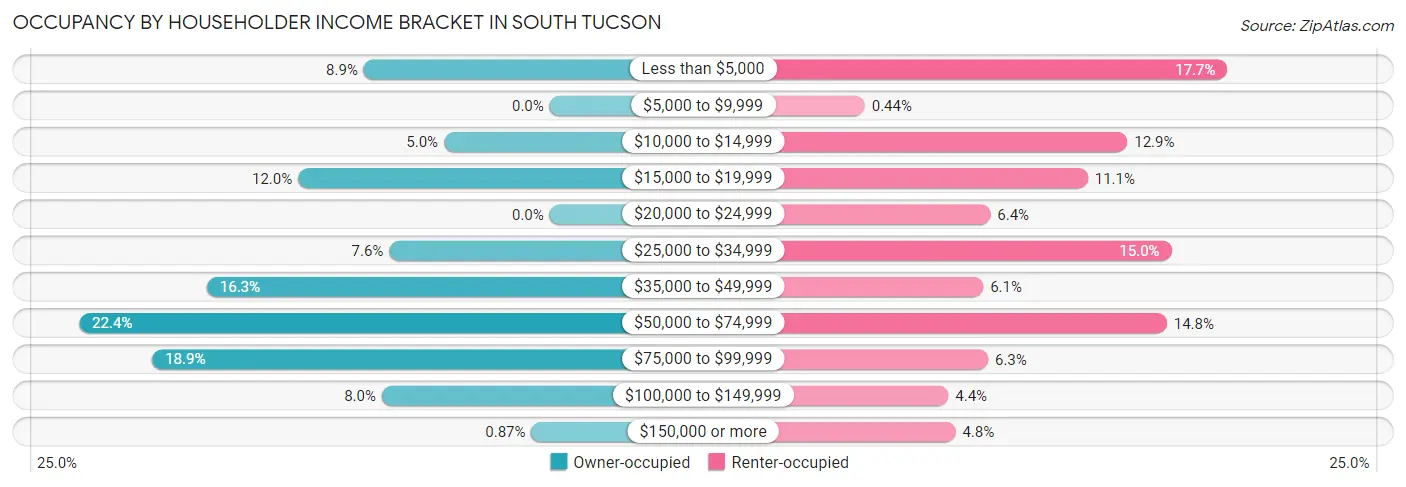
| Income Bracket | Owner-occupied | Renter-occupied |
| Less than $5,000 | 51 (8.8%) | 160 (17.7%) |
| $5,000 to $9,999 | 0 (0.0%) | 4 (0.4%) |
| $10,000 to $14,999 | 29 (5.0%) | 117 (12.9%) |
| $15,000 to $19,999 | 69 (12.0%) | 100 (11.1%) |
| $20,000 to $24,999 | 0 (0.0%) | 58 (6.4%) |
| $25,000 to $34,999 | 44 (7.6%) | 136 (15.0%) |
| $35,000 to $49,999 | 94 (16.3%) | 55 (6.1%) |
| $50,000 to $74,999 | 129 (22.4%) | 134 (14.8%) |
| $75,000 to $99,999 | 109 (18.9%) | 57 (6.3%) |
| $100,000 to $149,999 | 46 (8.0%) | 40 (4.4%) |
| $150,000 or more | 5 (0.9%) | 43 (4.8%) |
| Total | 576 (100.0%) | 904 (100.0%) |
Monthly Housing Cost Tiers in South Tucson
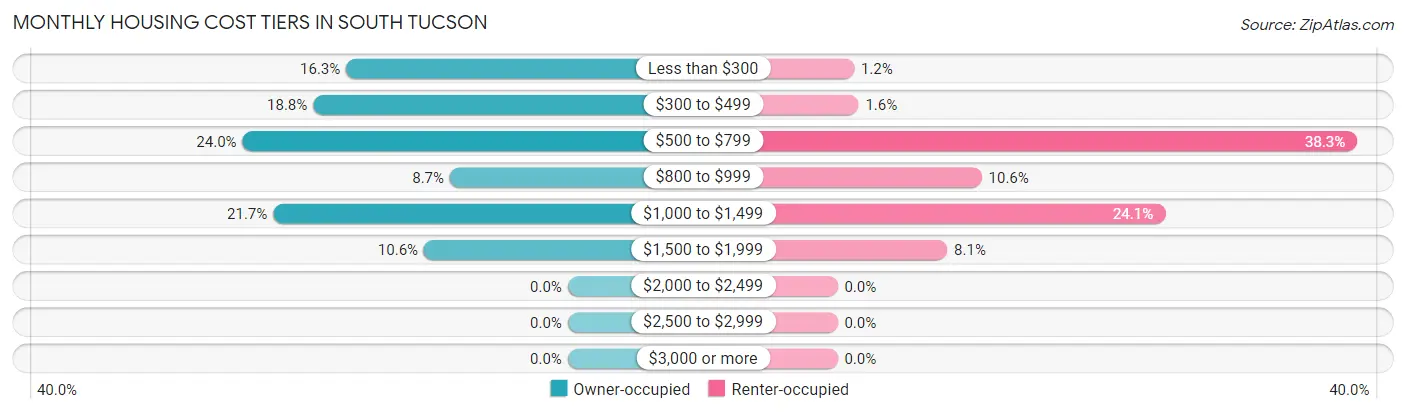
| Monthly Cost | Owner-occupied | Renter-occupied |
| Less than $300 | 94 (16.3%) | 11 (1.2%) |
| $300 to $499 | 108 (18.8%) | 14 (1.5%) |
| $500 to $799 | 138 (24.0%) | 346 (38.3%) |
| $800 to $999 | 50 (8.7%) | 96 (10.6%) |
| $1,000 to $1,499 | 125 (21.7%) | 218 (24.1%) |
| $1,500 to $1,999 | 61 (10.6%) | 73 (8.1%) |
| $2,000 to $2,499 | 0 (0.0%) | 0 (0.0%) |
| $2,500 to $2,999 | 0 (0.0%) | 0 (0.0%) |
| $3,000 or more | 0 (0.0%) | 0 (0.0%) |
| Total | 576 (100.0%) | 904 (100.0%) |
Physical Housing Characteristics in South Tucson
Housing Structures in South Tucson
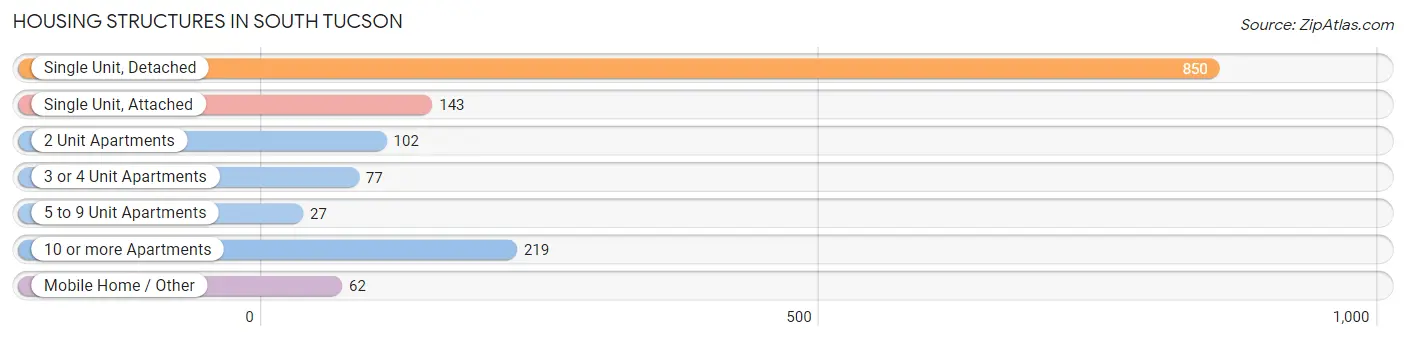
| Structure Type | # Housing Units | % Housing Units |
| Single Unit, Detached | 850 | 57.4% |
| Single Unit, Attached | 143 | 9.7% |
| 2 Unit Apartments | 102 | 6.9% |
| 3 or 4 Unit Apartments | 77 | 5.2% |
| 5 to 9 Unit Apartments | 27 | 1.8% |
| 10 or more Apartments | 219 | 14.8% |
| Mobile Home / Other | 62 | 4.2% |
| Total | 1,480 | 100.0% |
Housing Structures by Occupancy in South Tucson
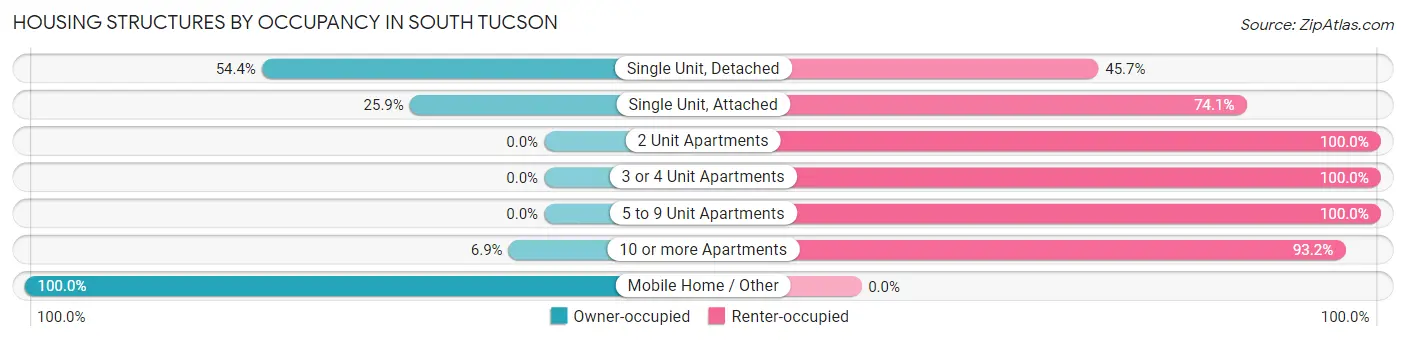
| Structure Type | Owner-occupied | Renter-occupied |
| Single Unit, Detached | 462 (54.3%) | 388 (45.7%) |
| Single Unit, Attached | 37 (25.9%) | 106 (74.1%) |
| 2 Unit Apartments | 0 (0.0%) | 102 (100.0%) |
| 3 or 4 Unit Apartments | 0 (0.0%) | 77 (100.0%) |
| 5 to 9 Unit Apartments | 0 (0.0%) | 27 (100.0%) |
| 10 or more Apartments | 15 (6.9%) | 204 (93.1%) |
| Mobile Home / Other | 62 (100.0%) | 0 (0.0%) |
| Total | 576 (38.9%) | 904 (61.1%) |
Housing Structures by Number of Rooms in South Tucson
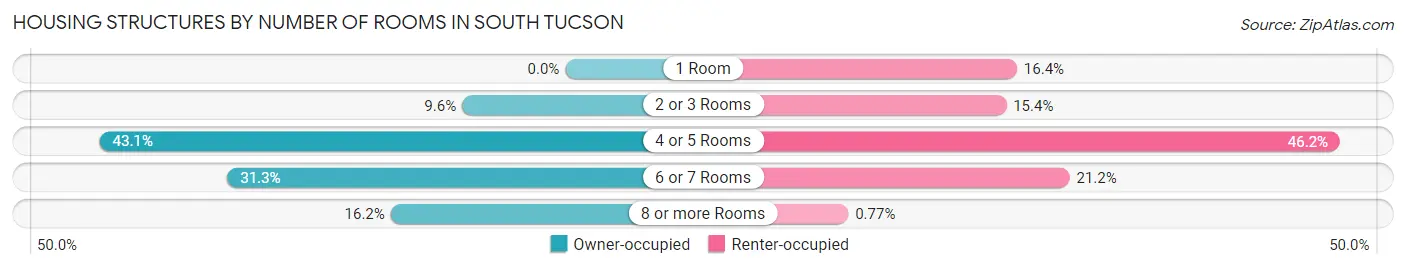
| Number of Rooms | Owner-occupied | Renter-occupied |
| 1 Room | 0 (0.0%) | 148 (16.4%) |
| 2 or 3 Rooms | 55 (9.6%) | 139 (15.4%) |
| 4 or 5 Rooms | 248 (43.1%) | 418 (46.2%) |
| 6 or 7 Rooms | 180 (31.2%) | 192 (21.2%) |
| 8 or more Rooms | 93 (16.2%) | 7 (0.8%) |
| Total | 576 (100.0%) | 904 (100.0%) |
Housing Structure by Heating Type in South Tucson
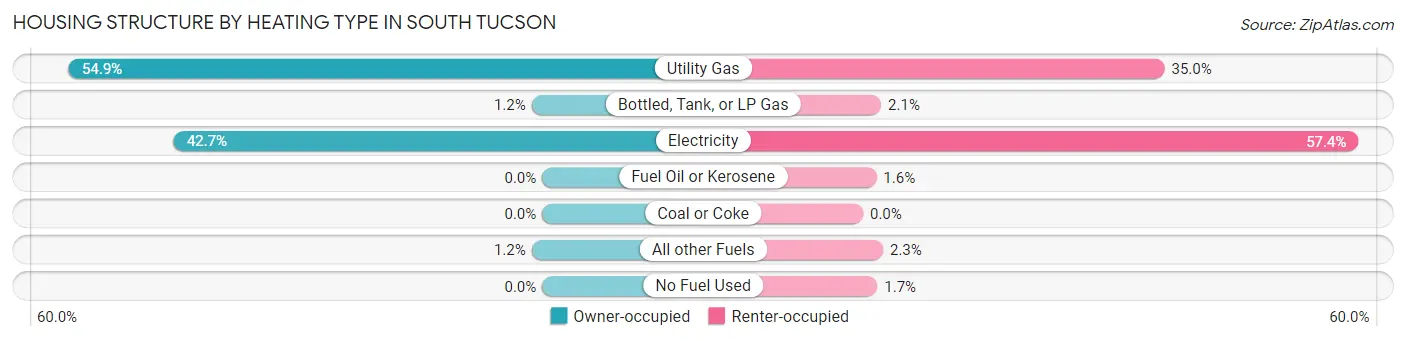
| Heating Type | Owner-occupied | Renter-occupied |
| Utility Gas | 316 (54.9%) | 316 (35.0%) |
| Bottled, Tank, or LP Gas | 7 (1.2%) | 19 (2.1%) |
| Electricity | 246 (42.7%) | 519 (57.4%) |
| Fuel Oil or Kerosene | 0 (0.0%) | 14 (1.5%) |
| Coal or Coke | 0 (0.0%) | 0 (0.0%) |
| All other Fuels | 7 (1.2%) | 21 (2.3%) |
| No Fuel Used | 0 (0.0%) | 15 (1.7%) |
| Total | 576 (100.0%) | 904 (100.0%) |
Household Vehicle Usage in South Tucson
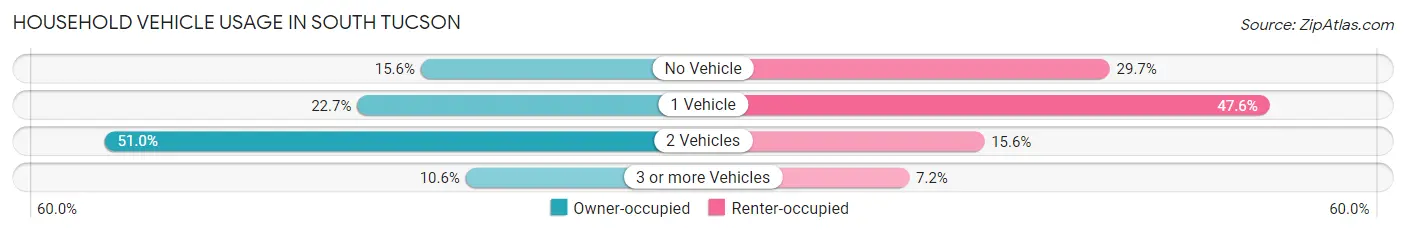
| Vehicles per Household | Owner-occupied | Renter-occupied |
| No Vehicle | 90 (15.6%) | 268 (29.6%) |
| 1 Vehicle | 131 (22.7%) | 430 (47.6%) |
| 2 Vehicles | 294 (51.0%) | 141 (15.6%) |
| 3 or more Vehicles | 61 (10.6%) | 65 (7.2%) |
| Total | 576 (100.0%) | 904 (100.0%) |
Real Estate & Mortgages in South Tucson
Real Estate and Mortgage Overview in South Tucson
| Characteristic | Without Mortgage | With Mortgage |
| Housing Units | 279 | 297 |
| Median Property Value | $121,400 | $149,700 |
| Median Household Income | $36,793 | $0 |
| Monthly Housing Costs | $356 | $0 |
| Real Estate Taxes | $814 | $8 |
Property Value by Mortgage Status in South Tucson
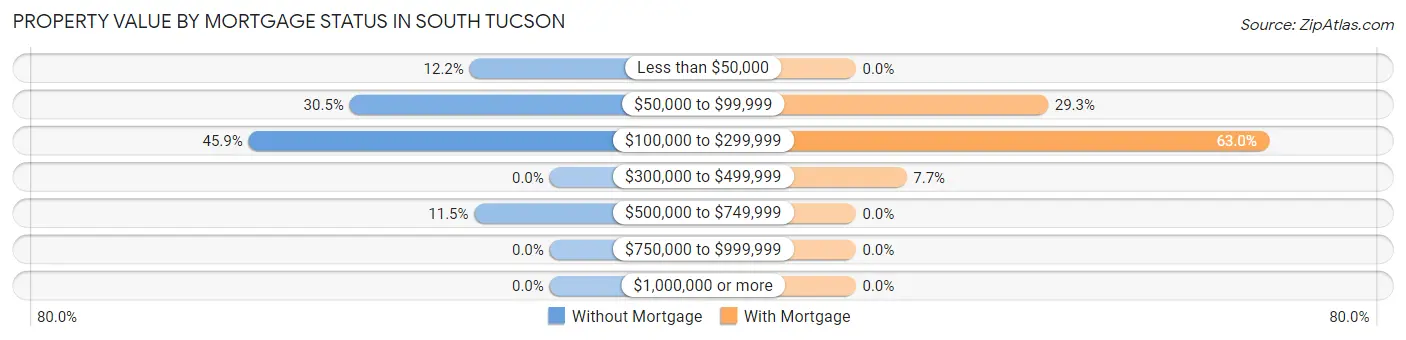
| Property Value | Without Mortgage | With Mortgage |
| Less than $50,000 | 34 (12.2%) | 0 (0.0%) |
| $50,000 to $99,999 | 85 (30.5%) | 87 (29.3%) |
| $100,000 to $299,999 | 128 (45.9%) | 187 (63.0%) |
| $300,000 to $499,999 | 0 (0.0%) | 23 (7.7%) |
| $500,000 to $749,999 | 32 (11.5%) | 0 (0.0%) |
| $750,000 to $999,999 | 0 (0.0%) | 0 (0.0%) |
| $1,000,000 or more | 0 (0.0%) | 0 (0.0%) |
| Total | 279 (100.0%) | 297 (100.0%) |
Household Income by Mortgage Status in South Tucson
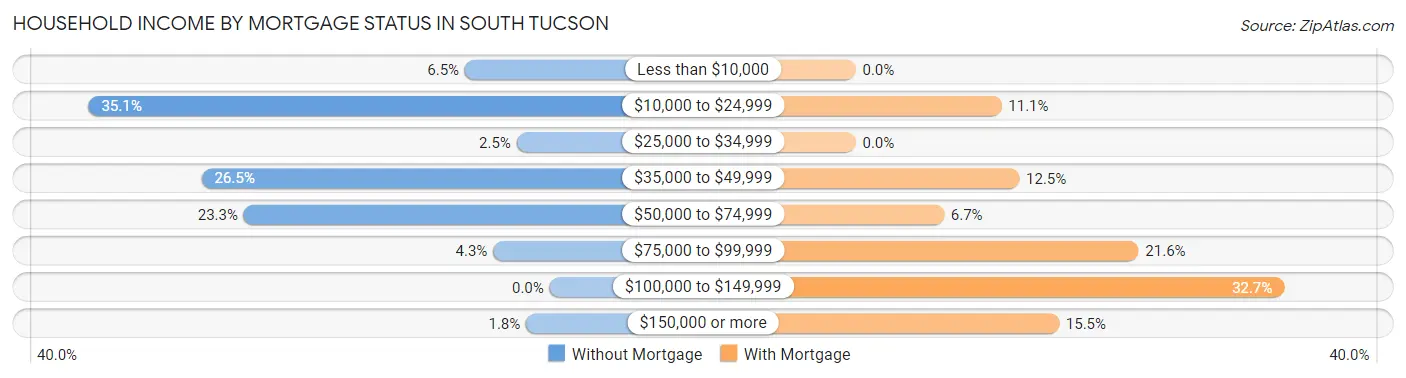
| Household Income | Without Mortgage | With Mortgage |
| Less than $10,000 | 18 (6.5%) | 0 (0.0%) |
| $10,000 to $24,999 | 98 (35.1%) | 33 (11.1%) |
| $25,000 to $34,999 | 7 (2.5%) | 0 (0.0%) |
| $35,000 to $49,999 | 74 (26.5%) | 37 (12.5%) |
| $50,000 to $74,999 | 65 (23.3%) | 20 (6.7%) |
| $75,000 to $99,999 | 12 (4.3%) | 64 (21.5%) |
| $100,000 to $149,999 | 0 (0.0%) | 97 (32.7%) |
| $150,000 or more | 5 (1.8%) | 46 (15.5%) |
| Total | 279 (100.0%) | 297 (100.0%) |
Property Value to Household Income Ratio in South Tucson
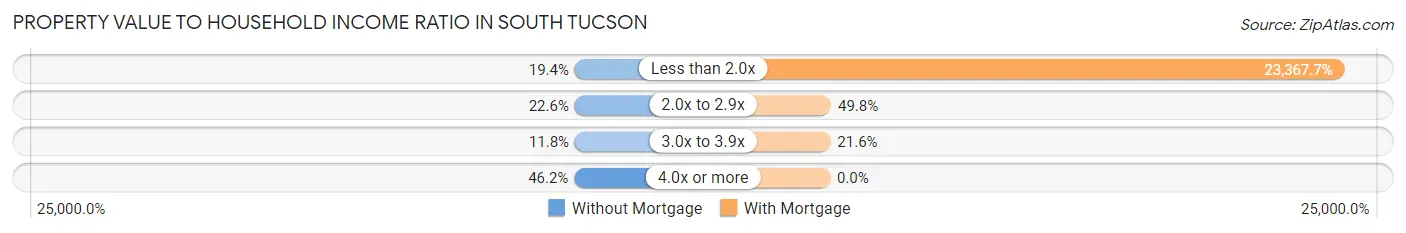
| Value-to-Income Ratio | Without Mortgage | With Mortgage |
| Less than 2.0x | 54 (19.4%) | 69,402 (23,367.7%) |
| 2.0x to 2.9x | 63 (22.6%) | 148 (49.8%) |
| 3.0x to 3.9x | 33 (11.8%) | 64 (21.5%) |
| 4.0x or more | 129 (46.2%) | 0 (0.0%) |
| Total | 279 (100.0%) | 297 (100.0%) |
Real Estate Taxes by Mortgage Status in South Tucson
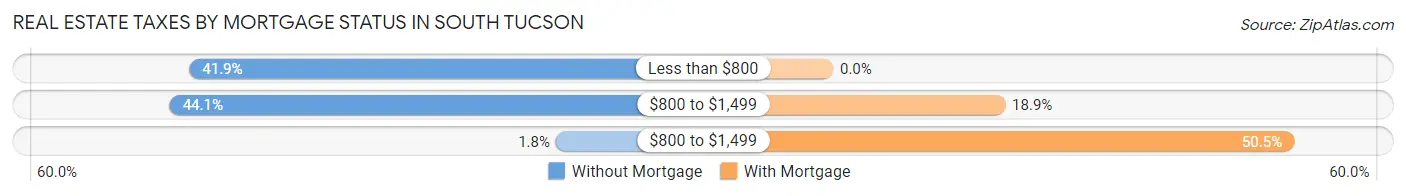
| Property Taxes | Without Mortgage | With Mortgage |
| Less than $800 | 117 (41.9%) | 0 (0.0%) |
| $800 to $1,499 | 123 (44.1%) | 56 (18.9%) |
| $800 to $1,499 | 5 (1.8%) | 150 (50.5%) |
| Total | 279 (100.0%) | 297 (100.0%) |
Health & Disability in South Tucson
Health Insurance Coverage by Age in South Tucson
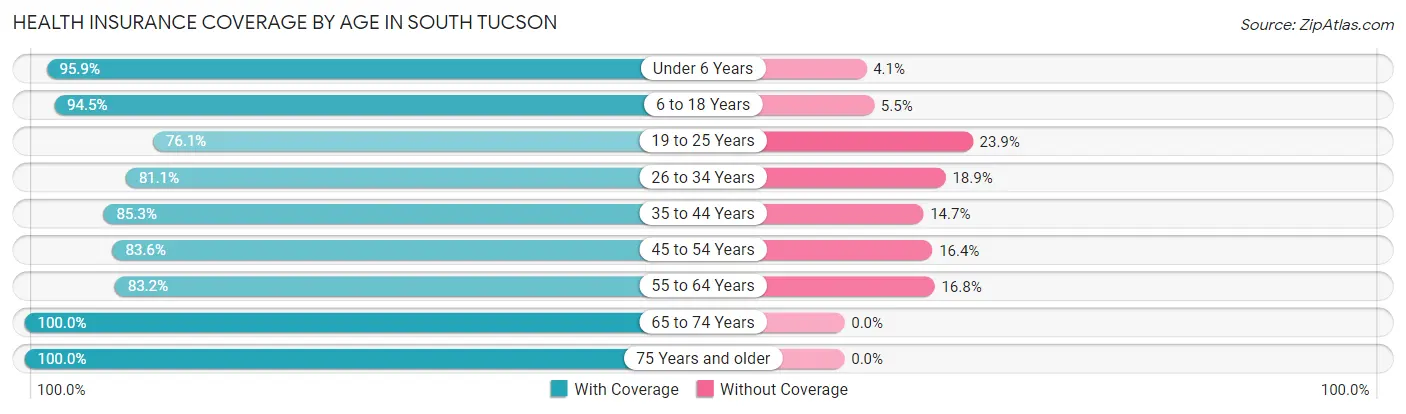
| Age Bracket | With Coverage | Without Coverage |
| Under 6 Years | 164 (95.9%) | 7 (4.1%) |
| 6 to 18 Years | 1,078 (94.5%) | 63 (5.5%) |
| 19 to 25 Years | 372 (76.1%) | 117 (23.9%) |
| 26 to 34 Years | 387 (81.1%) | 90 (18.9%) |
| 35 to 44 Years | 527 (85.3%) | 91 (14.7%) |
| 45 to 54 Years | 357 (83.6%) | 70 (16.4%) |
| 55 to 64 Years | 549 (83.2%) | 111 (16.8%) |
| 65 to 74 Years | 365 (100.0%) | 0 (0.0%) |
| 75 Years and older | 282 (100.0%) | 0 (0.0%) |
| Total | 4,081 (88.1%) | 549 (11.9%) |
Health Insurance Coverage by Citizenship Status in South Tucson
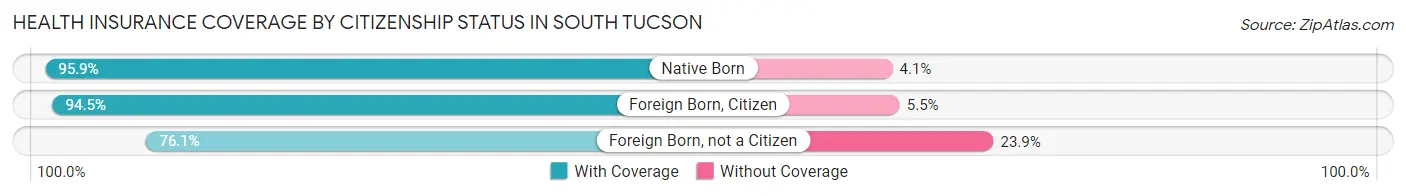
| Citizenship Status | With Coverage | Without Coverage |
| Native Born | 164 (95.9%) | 7 (4.1%) |
| Foreign Born, Citizen | 1,078 (94.5%) | 63 (5.5%) |
| Foreign Born, not a Citizen | 372 (76.1%) | 117 (23.9%) |
Health Insurance Coverage by Household Income in South Tucson
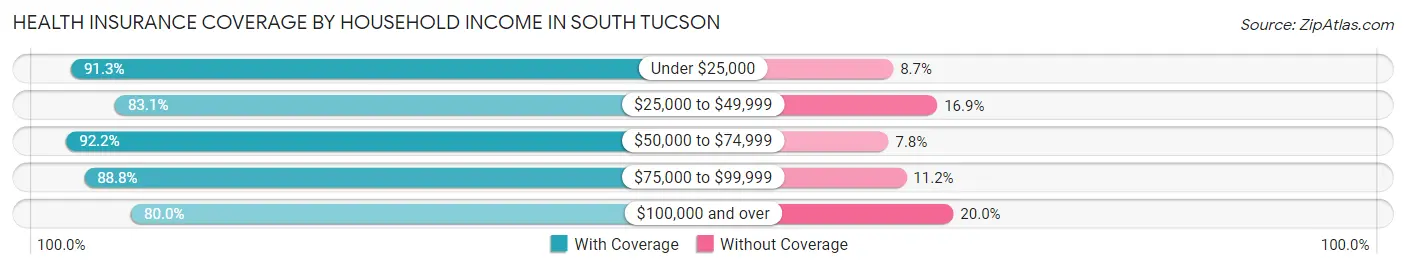
| Household Income | With Coverage | Without Coverage |
| Under $25,000 | 1,238 (91.3%) | 118 (8.7%) |
| $25,000 to $49,999 | 799 (83.1%) | 163 (16.9%) |
| $50,000 to $74,999 | 719 (92.2%) | 61 (7.8%) |
| $75,000 to $99,999 | 652 (88.8%) | 82 (11.2%) |
| $100,000 and over | 461 (80.0%) | 115 (20.0%) |
Public vs Private Health Insurance Coverage by Age in South Tucson
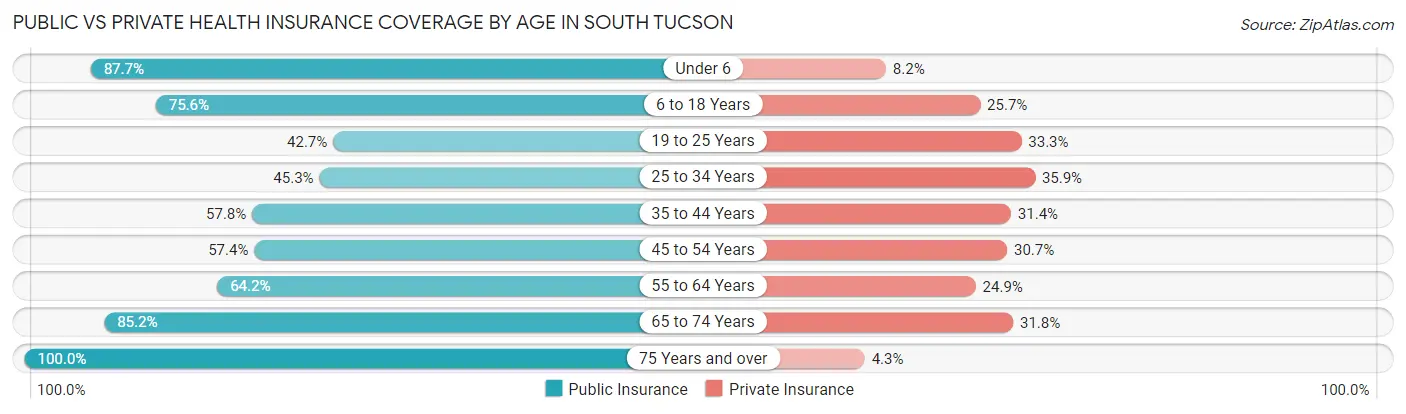
| Age Bracket | Public Insurance | Private Insurance |
| Under 6 | 150 (87.7%) | 14 (8.2%) |
| 6 to 18 Years | 863 (75.6%) | 293 (25.7%) |
| 19 to 25 Years | 209 (42.7%) | 163 (33.3%) |
| 25 to 34 Years | 216 (45.3%) | 171 (35.8%) |
| 35 to 44 Years | 357 (57.8%) | 194 (31.4%) |
| 45 to 54 Years | 245 (57.4%) | 131 (30.7%) |
| 55 to 64 Years | 424 (64.2%) | 164 (24.8%) |
| 65 to 74 Years | 311 (85.2%) | 116 (31.8%) |
| 75 Years and over | 282 (100.0%) | 12 (4.3%) |
| Total | 3,057 (66.0%) | 1,258 (27.2%) |
Disability Status by Sex by Age in South Tucson
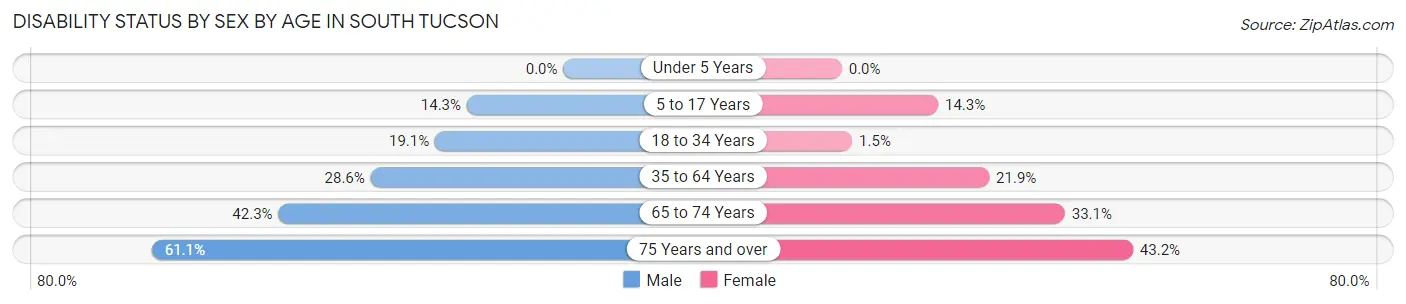
| Age Bracket | Male | Female |
| Under 5 Years | 0 (0.0%) | 0 (0.0%) |
| 5 to 17 Years | 89 (14.3%) | 67 (14.3%) |
| 18 to 34 Years | 100 (19.1%) | 8 (1.5%) |
| 35 to 64 Years | 259 (28.6%) | 175 (21.9%) |
| 65 to 74 Years | 88 (42.3%) | 52 (33.1%) |
| 75 Years and over | 55 (61.1%) | 83 (43.2%) |
Disability Class by Sex by Age in South Tucson
Disability Class: Hearing Difficulty
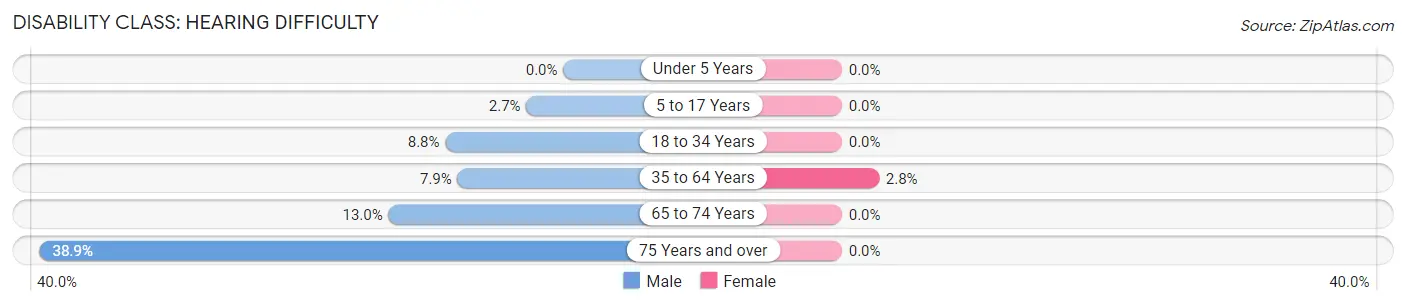
| Age Bracket | Male | Female |
| Under 5 Years | 0 (0.0%) | 0 (0.0%) |
| 5 to 17 Years | 17 (2.7%) | 0 (0.0%) |
| 18 to 34 Years | 46 (8.8%) | 0 (0.0%) |
| 35 to 64 Years | 71 (7.9%) | 22 (2.8%) |
| 65 to 74 Years | 27 (13.0%) | 0 (0.0%) |
| 75 Years and over | 35 (38.9%) | 0 (0.0%) |
Disability Class: Vision Difficulty
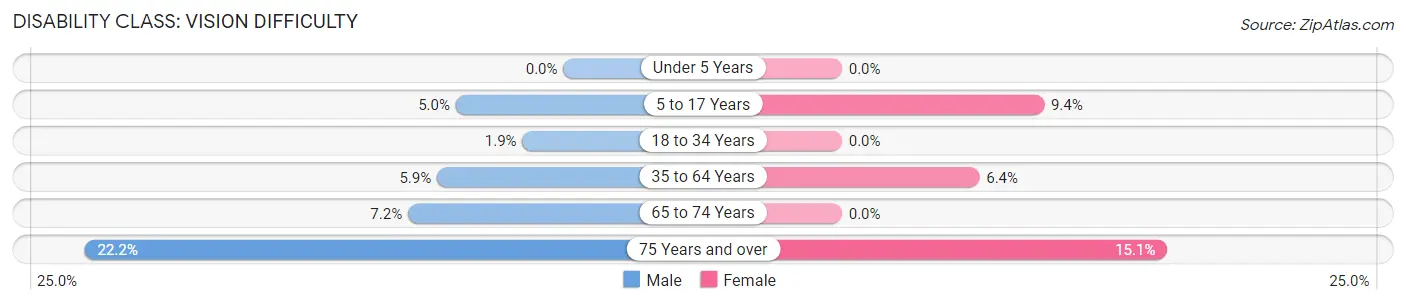
| Age Bracket | Male | Female |
| Under 5 Years | 0 (0.0%) | 0 (0.0%) |
| 5 to 17 Years | 31 (5.0%) | 44 (9.4%) |
| 18 to 34 Years | 10 (1.9%) | 0 (0.0%) |
| 35 to 64 Years | 53 (5.9%) | 51 (6.4%) |
| 65 to 74 Years | 15 (7.2%) | 0 (0.0%) |
| 75 Years and over | 20 (22.2%) | 29 (15.1%) |
Disability Class: Cognitive Difficulty
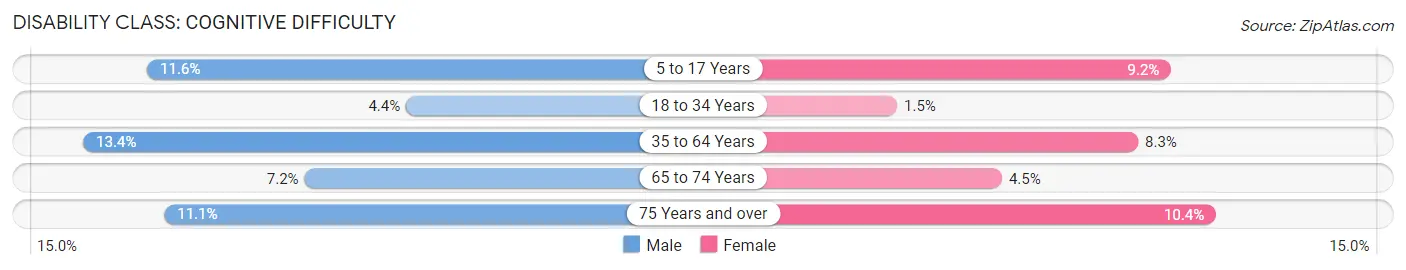
| Age Bracket | Male | Female |
| 5 to 17 Years | 72 (11.6%) | 43 (9.2%) |
| 18 to 34 Years | 23 (4.4%) | 8 (1.5%) |
| 35 to 64 Years | 121 (13.4%) | 66 (8.3%) |
| 65 to 74 Years | 15 (7.2%) | 7 (4.5%) |
| 75 Years and over | 10 (11.1%) | 20 (10.4%) |
Disability Class: Ambulatory Difficulty
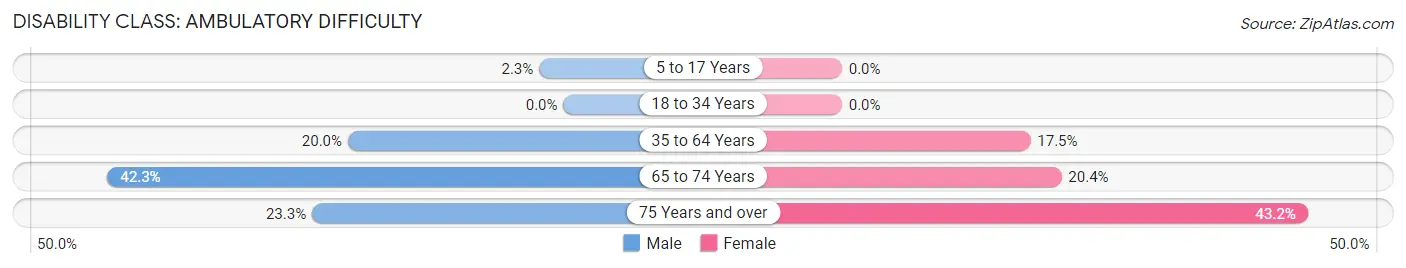
| Age Bracket | Male | Female |
| 5 to 17 Years | 14 (2.2%) | 0 (0.0%) |
| 18 to 34 Years | 0 (0.0%) | 0 (0.0%) |
| 35 to 64 Years | 181 (20.0%) | 140 (17.5%) |
| 65 to 74 Years | 88 (42.3%) | 32 (20.4%) |
| 75 Years and over | 21 (23.3%) | 83 (43.2%) |
Disability Class: Self-Care Difficulty
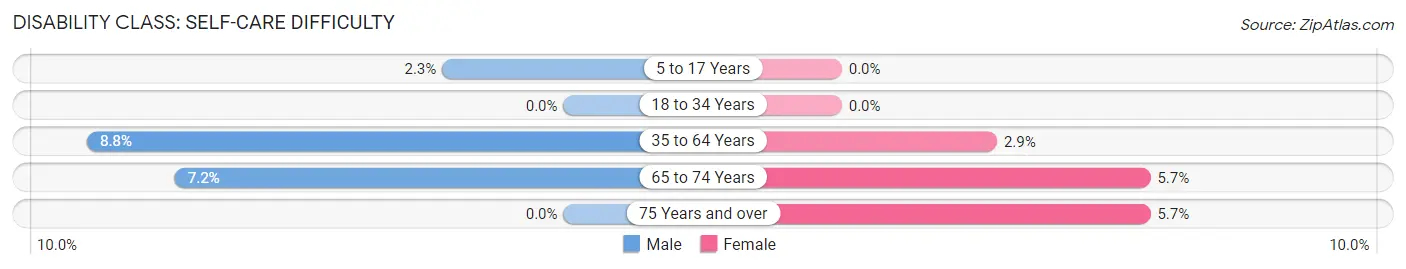
| Age Bracket | Male | Female |
| 5 to 17 Years | 14 (2.2%) | 0 (0.0%) |
| 18 to 34 Years | 0 (0.0%) | 0 (0.0%) |
| 35 to 64 Years | 80 (8.8%) | 23 (2.9%) |
| 65 to 74 Years | 15 (7.2%) | 9 (5.7%) |
| 75 Years and over | 0 (0.0%) | 11 (5.7%) |
Technology Access in South Tucson
Computing Device Access in South Tucson
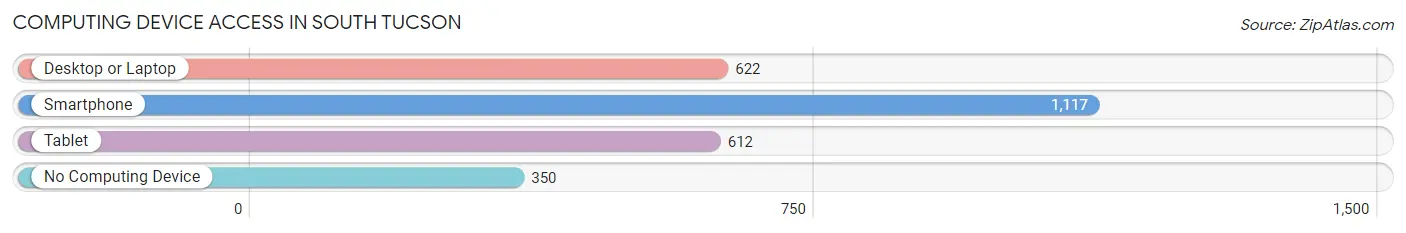
| Device Type | # Households | % Households |
| Desktop or Laptop | 622 | 42.0% |
| Smartphone | 1,117 | 75.5% |
| Tablet | 612 | 41.3% |
| No Computing Device | 350 | 23.6% |
| Total | 1,480 | 100.0% |
Internet Access in South Tucson
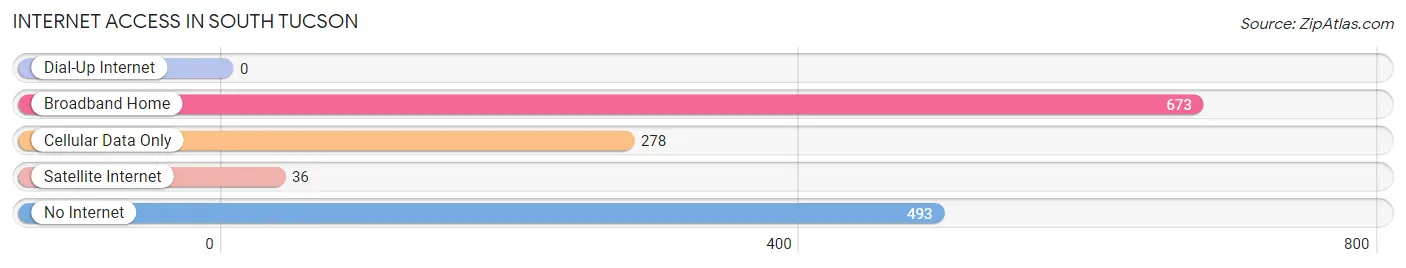
| Internet Type | # Households | % Households |
| Dial-Up Internet | 0 | 0.0% |
| Broadband Home | 673 | 45.5% |
| Cellular Data Only | 278 | 18.8% |
| Satellite Internet | 36 | 2.4% |
| No Internet | 493 | 33.3% |
| Total | 1,480 | 100.0% |
South Tucson Summary
Tucson, Arizona is a city located in the Sonoran Desert in the southwestern United States. It is the county seat of Pima County and the second largest city in the state. South Tucson is a small city located within the Tucson metropolitan area. It is located south of downtown Tucson and is bordered by the city of Tucson to the north, east, and west.
History
South Tucson was founded in 1920 as a small farming community. The area was originally inhabited by the Tohono O’odham people, who had lived in the area for centuries. The first settlers were Mexican immigrants who came to the area to work in the local mines and railroads. The city was incorporated in 1936 and was initially known as South Tucson.
In the 1950s, the city experienced a period of rapid growth as the population increased from 2,000 to over 10,000. This growth was largely due to the influx of Mexican immigrants who were attracted to the area by the availability of jobs in the local factories and businesses.
The city continued to grow throughout the 1960s and 1970s, and by the 1980s, the population had reached over 20,000. During this time, the city experienced a period of economic decline as many of the local factories and businesses closed. This led to an increase in poverty and crime in the area.
In the 1990s, the city began to experience a period of revitalization as new businesses and housing developments were built. This revitalization has continued into the 21st century, and the population of South Tucson has grown to over 25,000.
Geography
South Tucson is located in the Sonoran Desert in the southwestern United States. It is located south of downtown Tucson and is bordered by the city of Tucson to the north, east, and west. The city covers an area of 2.3 square miles and has an elevation of 2,400 feet.
The climate in South Tucson is hot and dry, with temperatures ranging from the mid-90s in the summer to the mid-50s in the winter. The area receives an average of 8.5 inches of rain per year.
Economy
South Tucson’s economy is largely based on the service industry. The city is home to a variety of restaurants, retail stores, and other businesses. The city is also home to several industrial parks, which provide jobs in manufacturing and other industries.
The city is also home to several educational institutions, including the University of Arizona South, Pima Community College, and the South Tucson Unified School District.
Demographics
As of the 2010 census, the population of South Tucson was 25,406. The racial makeup of the city was 79.3% Hispanic or Latino, 16.2% White, 1.2% African American, 0.7% Native American, 0.3% Asian, 0.1% Pacific Islander, and 2.4% from other races.
The median household income in South Tucson was $25,945, and the median family income was $30,945. The per capita income was $13,845. The poverty rate was 33.3%.
Conclusion
South Tucson is a small city located within the Tucson metropolitan area. It was founded in 1920 as a small farming community and has since grown to a population of over 25,000. The city’s economy is largely based on the service industry, and it is home to several educational institutions. The population of South Tucson is largely Hispanic or Latino, and the median household income is lower than the national average.
Common Questions
What is Per Capita Income in South Tucson?
Per Capita income in South Tucson is $16,508.
What is the Median Family Income in South Tucson?
Median Family Income in South Tucson is $39,868.
What is the Median Household income in South Tucson?
Median Household Income in South Tucson is $34,014.
What is Income or Wage Gap in South Tucson?
Income or Wage Gap in South Tucson is 23.4%.
Women in South Tucson earn 76.6 cents for every dollar earned by a man.
What is Family Income Deficit in South Tucson?
Family Income Deficit in South Tucson is $13,743.
Families that are below poverty line in South Tucson earn $13,743 less on average than the poverty threshold level.
What is Inequality or Gini Index in South Tucson?
Inequality or Gini Index in South Tucson is 0.50.
What is the Total Population of South Tucson?
Total Population of South Tucson is 4,642.
What is the Total Male Population of South Tucson?
Total Male Population of South Tucson is 2,425.
What is the Total Female Population of South Tucson?
Total Female Population of South Tucson is 2,217.
What is the Ratio of Males per 100 Females in South Tucson?
There are 109.38 Males per 100 Females in South Tucson.
What is the Ratio of Females per 100 Males in South Tucson?
There are 91.42 Females per 100 Males in South Tucson.
What is the Median Population Age in South Tucson?
Median Population Age in South Tucson is 35.6 Years.
What is the Average Family Size in South Tucson
Average Family Size in South Tucson is 3.5 People.
What is the Average Household Size in South Tucson
Average Household Size in South Tucson is 3.0 People.
How Large is the Labor Force in South Tucson?
There are 1,737 People in the Labor Forcein in South Tucson.
What is the Percentage of People in the Labor Force in South Tucson?
48.6% of People are in the Labor Force in South Tucson.
What is the Unemployment Rate in South Tucson?
Unemployment Rate in South Tucson is 14.2%.