Burnside, AZ Map & Demographics
Burnside Map
Burnside Overview
$12,569
PER CAPITA INCOME
$28,438
AVG FAMILY INCOME
$28,125
AVG HOUSEHOLD INCOME
38.4%
WAGE / INCOME GAP [ % ]
61.6¢/ $1
WAGE / INCOME GAP [ $ ]
0.61
INEQUALITY / GINI INDEX
505
TOTAL POPULATION
177
MALE POPULATION
328
FEMALE POPULATION
53.96
MALES / 100 FEMALES
185.31
FEMALES / 100 MALES
26.3
MEDIAN AGE
5.7
AVG FAMILY SIZE
4.5
AVG HOUSEHOLD SIZE
145
LABOR FORCE [ PEOPLE ]
40.7%
PERCENT IN LABOR FORCE
Income in Burnside
Income Overview in Burnside
Per Capita Income in Burnside is $12,569, while median incomes of families and households are $28,438 and $28,125 respectively.
| Characteristic | Number | Measure |
| Per Capita Income | 505 | $12,569 |
| Median Family Income | 82 | $28,438 |
| Mean Family Income | 82 | $49,562 |
| Median Household Income | 112 | $28,125 |
| Mean Household Income | 112 | $43,489 |
| Income Deficit | 82 | $0 |
| Wage / Income Gap (%) | 505 | 38.42% |
| Wage / Income Gap ($) | 505 | 61.58¢ per $1 |
| Gini / Inequality Index | 505 | 0.61 |
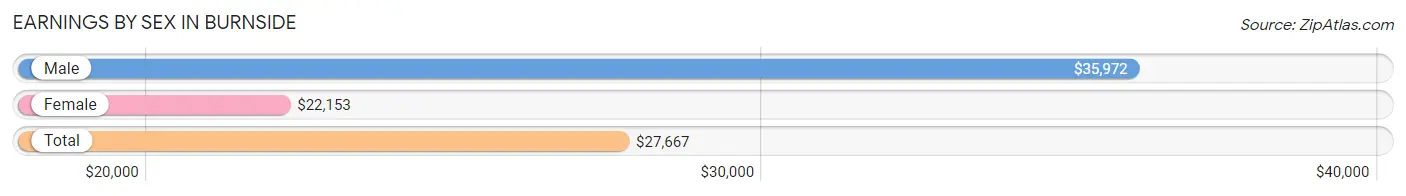
Earnings by Sex in Burnside
Average Earnings in Burnside are $27,667, $35,972 for men and $22,153 for women, a difference of 38.4%.
| Sex | Number | Average Earnings |
| Male | 65 (43.3%) | $35,972 |
| Female | 85 (56.7%) | $22,153 |
| Total | 150 (100.0%) | $27,667 |
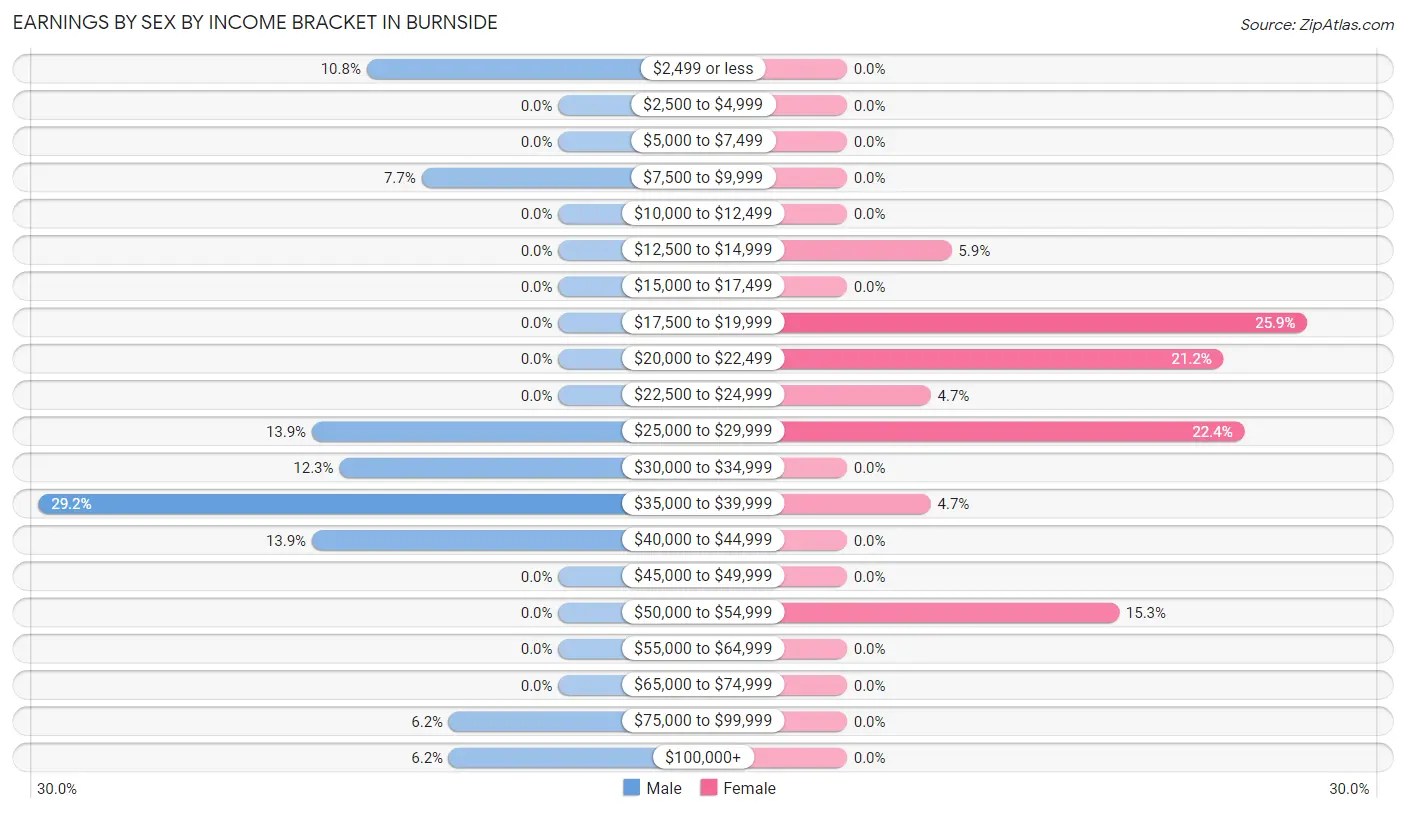
Earnings by Sex by Income Bracket in Burnside
The most common earnings brackets in Burnside are $35,000 to $39,999 for men (19 | 29.2%) and $17,500 to $19,999 for women (22 | 25.9%).
| Income | Male | Female |
| $2,499 or less | 7 (10.8%) | 0 (0.0%) |
| $2,500 to $4,999 | 0 (0.0%) | 0 (0.0%) |
| $5,000 to $7,499 | 0 (0.0%) | 0 (0.0%) |
| $7,500 to $9,999 | 5 (7.7%) | 0 (0.0%) |
| $10,000 to $12,499 | 0 (0.0%) | 0 (0.0%) |
| $12,500 to $14,999 | 0 (0.0%) | 5 (5.9%) |
| $15,000 to $17,499 | 0 (0.0%) | 0 (0.0%) |
| $17,500 to $19,999 | 0 (0.0%) | 22 (25.9%) |
| $20,000 to $22,499 | 0 (0.0%) | 18 (21.2%) |
| $22,500 to $24,999 | 0 (0.0%) | 4 (4.7%) |
| $25,000 to $29,999 | 9 (13.9%) | 19 (22.4%) |
| $30,000 to $34,999 | 8 (12.3%) | 0 (0.0%) |
| $35,000 to $39,999 | 19 (29.2%) | 4 (4.7%) |
| $40,000 to $44,999 | 9 (13.9%) | 0 (0.0%) |
| $45,000 to $49,999 | 0 (0.0%) | 0 (0.0%) |
| $50,000 to $54,999 | 0 (0.0%) | 13 (15.3%) |
| $55,000 to $64,999 | 0 (0.0%) | 0 (0.0%) |
| $65,000 to $74,999 | 0 (0.0%) | 0 (0.0%) |
| $75,000 to $99,999 | 4 (6.1%) | 0 (0.0%) |
| $100,000+ | 4 (6.1%) | 0 (0.0%) |
| Total | 65 (100.0%) | 85 (100.0%) |
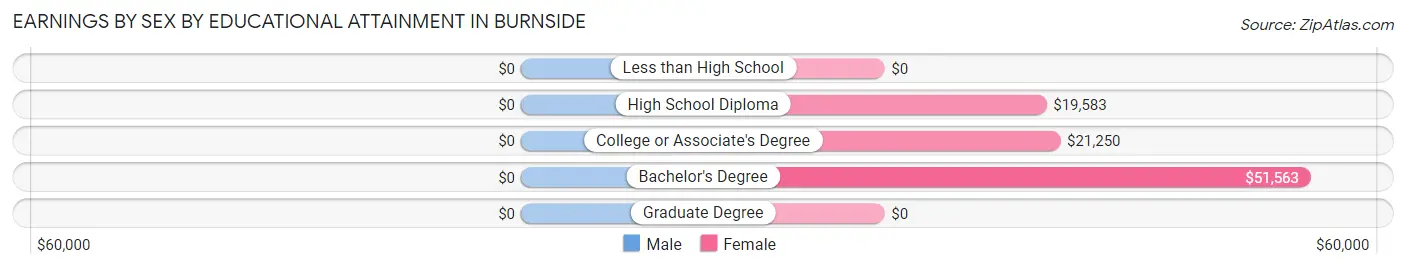
Earnings by Sex by Educational Attainment in Burnside
| Educational Attainment | Male Income | Female Income |
| Less than High School | - | - |
| High School Diploma | - | - |
| College or Associate's Degree | - | - |
| Bachelor's Degree | - | - |
| Graduate Degree | - | - |
| Total | $38,125 | $22,153 |
Family Income in Burnside
Family Income Brackets in Burnside
According to the Burnside family income data, there are 24 families falling into the $25,000 to $34,999 income range, which is the most common income bracket and makes up 29.3% of all families.
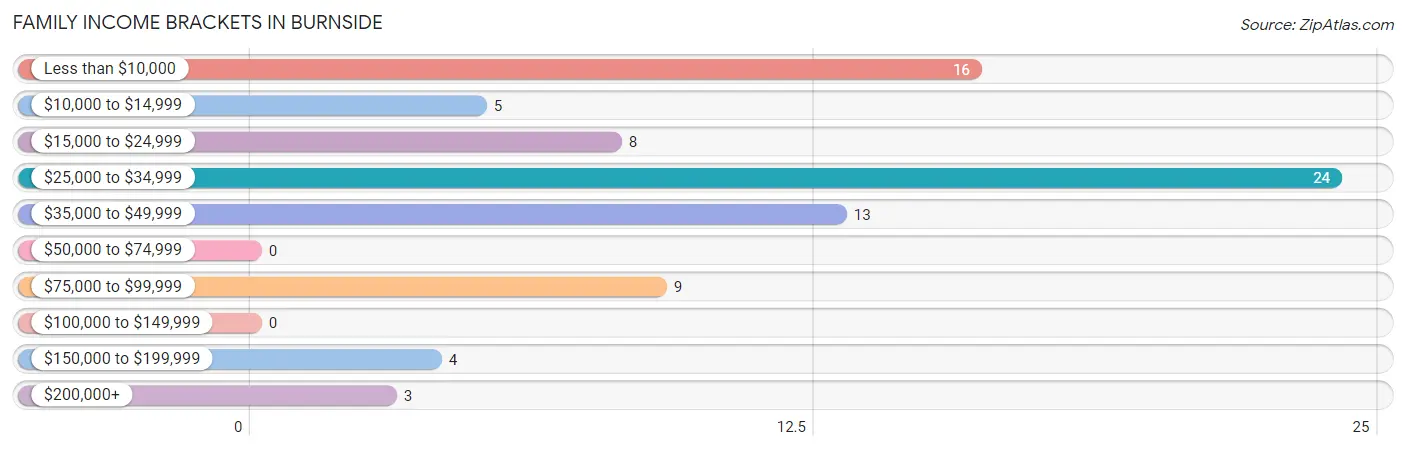
| Income Bracket | # Families | % Families |
| Less than $10,000 | 16 | 19.5% |
| $10,000 to $14,999 | 5 | 6.1% |
| $15,000 to $24,999 | 8 | 9.8% |
| $25,000 to $34,999 | 24 | 29.3% |
| $35,000 to $49,999 | 13 | 15.9% |
| $50,000 to $74,999 | 0 | 0.0% |
| $75,000 to $99,999 | 9 | 11.0% |
| $100,000 to $149,999 | 0 | 0.0% |
| $150,000 to $199,999 | 4 | 4.9% |
| $200,000+ | 3 | 3.7% |
Family Income by Famaliy Size in Burnside
4-person families (21 | 25.6%) account for the highest median family income in Burnside with $28,438 per family, while 3-person families (21 | 25.6%) have the highest median income of $8,854 per family member.
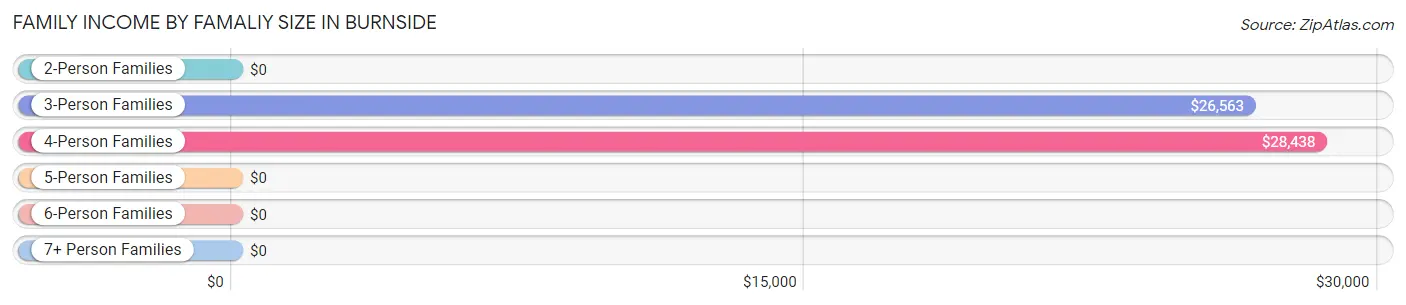
| Income Bracket | # Families | Median Income |
| 2-Person Families | 14 (17.1%) | $0 |
| 3-Person Families | 21 (25.6%) | $26,563 |
| 4-Person Families | 21 (25.6%) | $28,438 |
| 5-Person Families | 12 (14.6%) | $0 |
| 6-Person Families | 7 (8.5%) | $0 |
| 7+ Person Families | 7 (8.5%) | $0 |
| Total | 82 (100.0%) | $28,438 |
Family Income by Number of Earners in Burnside
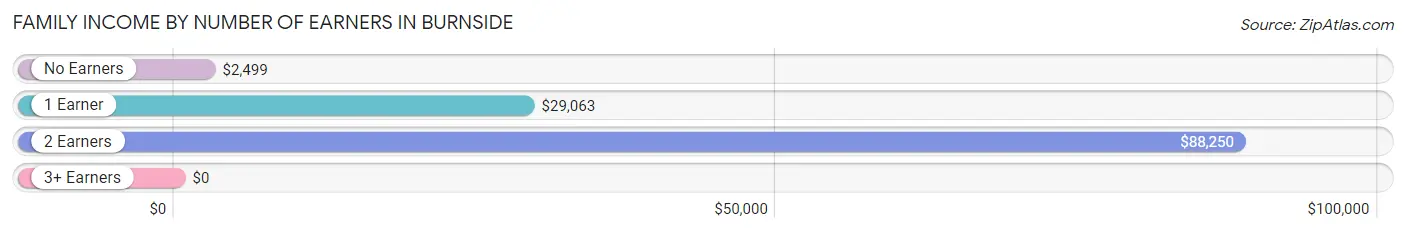
| Number of Earners | # Families | Median Income |
| No Earners | 21 (25.6%) | $2,499 |
| 1 Earner | 36 (43.9%) | $29,063 |
| 2 Earners | 21 (25.6%) | $88,250 |
| 3+ Earners | 4 (4.9%) | $0 |
| Total | 82 (100.0%) | $28,438 |
Household Income in Burnside
Household Income Brackets in Burnside
With 32 households falling in the category, the $25,000 to $34,999 income range is the most frequent in Burnside, accounting for 28.6% of all households.
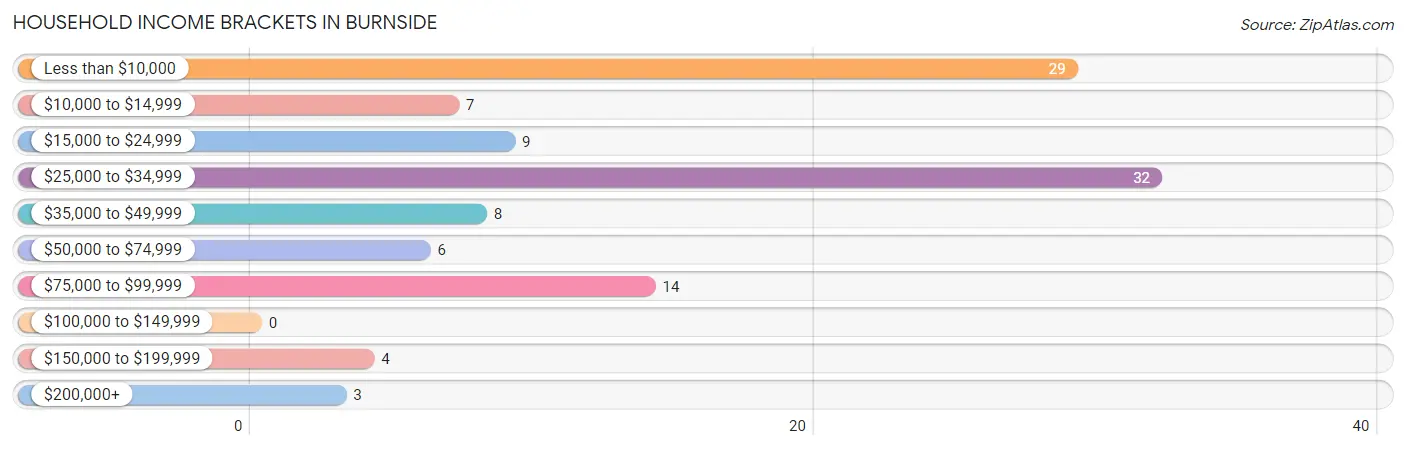
| Income Bracket | # Households | % Households |
| Less than $10,000 | 29 | 25.9% |
| $10,000 to $14,999 | 7 | 6.3% |
| $15,000 to $24,999 | 9 | 8.0% |
| $25,000 to $34,999 | 32 | 28.6% |
| $35,000 to $49,999 | 8 | 7.1% |
| $50,000 to $74,999 | 6 | 5.4% |
| $75,000 to $99,999 | 14 | 12.5% |
| $100,000 to $149,999 | 0 | 0.0% |
| $150,000 to $199,999 | 4 | 3.6% |
| $200,000+ | 3 | 2.7% |
Household Income by Householder Age in Burnside
The median household income in Burnside is $28,125, with the highest median household income of $31,667 found in the 65+ years age bracket for the primary householder. A total of 18 households (16.1%) fall into this category.
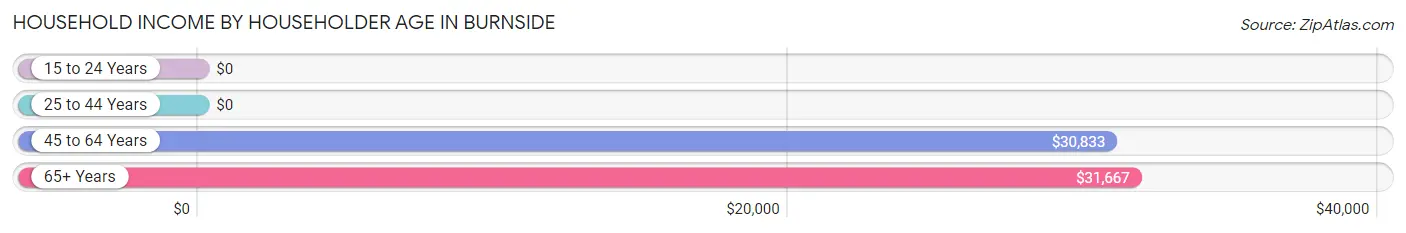
| Income Bracket | # Households | Median Income |
| 15 to 24 Years | 0 (0.0%) | $0 |
| 25 to 44 Years | 34 (30.4%) | $0 |
| 45 to 64 Years | 60 (53.6%) | $30,833 |
| 65+ Years | 18 (16.1%) | $31,667 |
| Total | 112 (100.0%) | $28,125 |
Poverty in Burnside
Income Below Poverty by Sex and Age in Burnside
With 51.4% poverty level for males and 60.7% for females among the residents of Burnside, 5 year old males and under 5 year old females are the most vulnerable to poverty, with 7 males (100.0%) and 31 females (100.0%) in their respective age groups living below the poverty level.
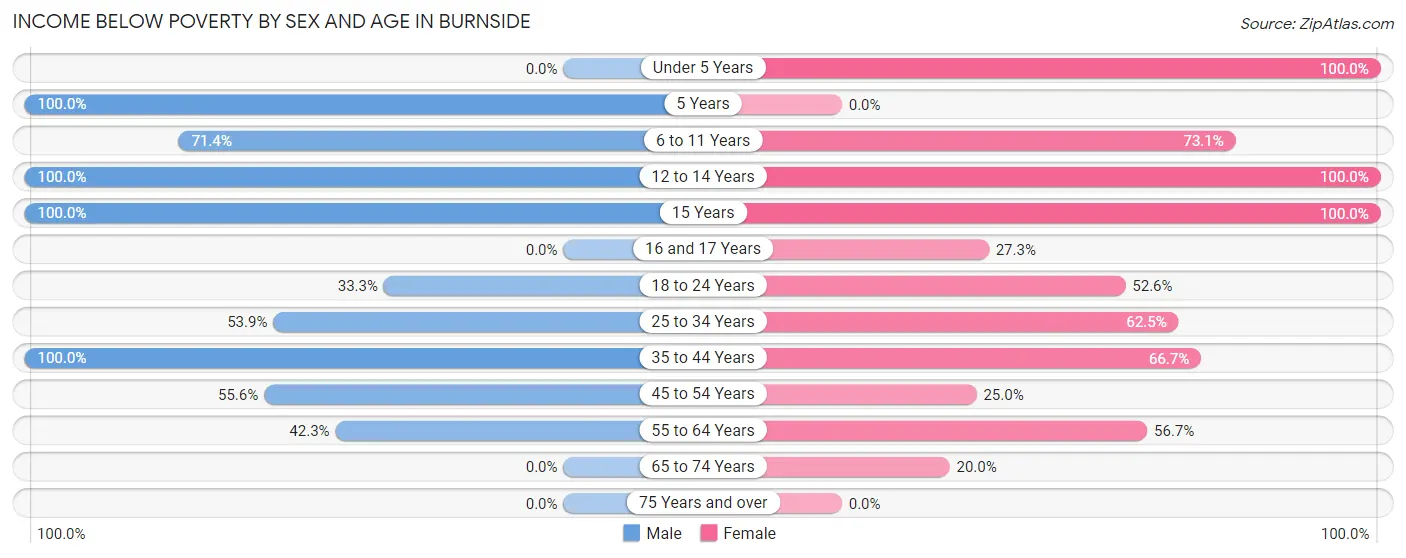
| Age Bracket | Male | Female |
| Under 5 Years | 0 (0.0%) | 31 (100.0%) |
| 5 Years | 7 (100.0%) | 0 (0.0%) |
| 6 to 11 Years | 15 (71.4%) | 38 (73.1%) |
| 12 to 14 Years | 5 (100.0%) | 16 (100.0%) |
| 15 Years | 6 (100.0%) | 6 (100.0%) |
| 16 and 17 Years | 0 (0.0%) | 6 (27.3%) |
| 18 to 24 Years | 14 (33.3%) | 10 (52.6%) |
| 25 to 34 Years | 21 (53.8%) | 45 (62.5%) |
| 35 to 44 Years | 7 (100.0%) | 20 (66.7%) |
| 45 to 54 Years | 5 (55.6%) | 8 (25.0%) |
| 55 to 64 Years | 11 (42.3%) | 17 (56.7%) |
| 65 to 74 Years | 0 (0.0%) | 2 (20.0%) |
| 75 Years and over | 0 (0.0%) | 0 (0.0%) |
| Total | 91 (51.4%) | 199 (60.7%) |
Income Above Poverty by Sex and Age in Burnside
According to the poverty statistics in Burnside, males aged under 5 years and females aged 75 years and over are the age groups that are most secure financially, with 100.0% of males and 100.0% of females in these age groups living above the poverty line.
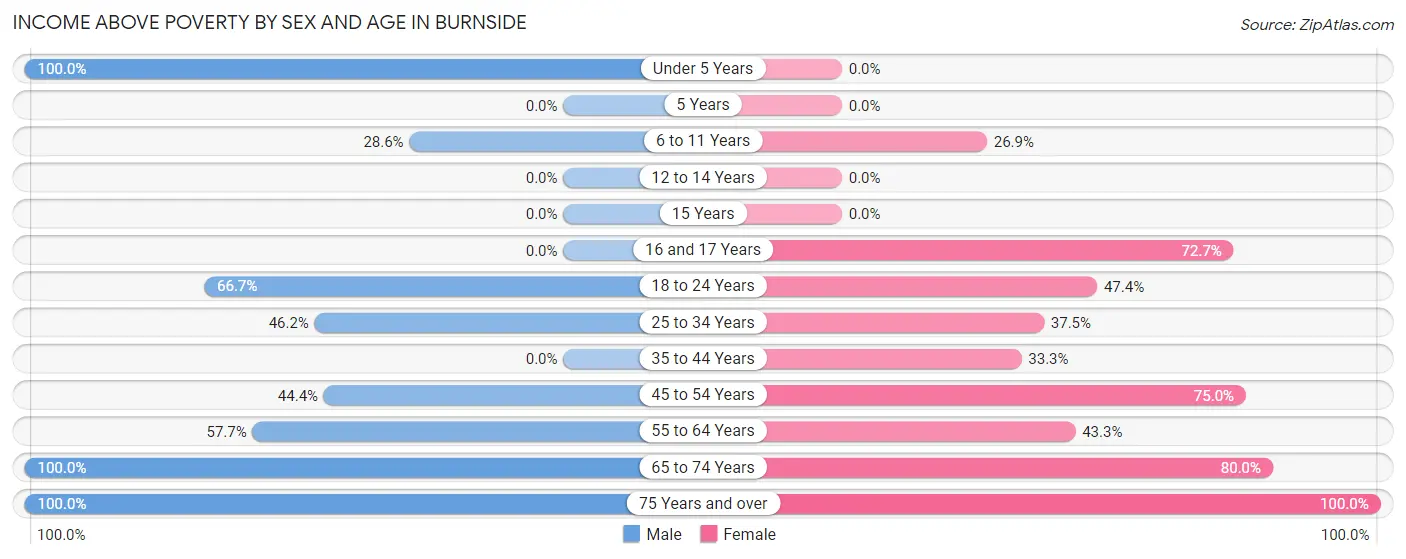
| Age Bracket | Male | Female |
| Under 5 Years | 5 (100.0%) | 0 (0.0%) |
| 5 Years | 0 (0.0%) | 0 (0.0%) |
| 6 to 11 Years | 6 (28.6%) | 14 (26.9%) |
| 12 to 14 Years | 0 (0.0%) | 0 (0.0%) |
| 15 Years | 0 (0.0%) | 0 (0.0%) |
| 16 and 17 Years | 0 (0.0%) | 16 (72.7%) |
| 18 to 24 Years | 28 (66.7%) | 9 (47.4%) |
| 25 to 34 Years | 18 (46.2%) | 27 (37.5%) |
| 35 to 44 Years | 0 (0.0%) | 10 (33.3%) |
| 45 to 54 Years | 4 (44.4%) | 24 (75.0%) |
| 55 to 64 Years | 15 (57.7%) | 13 (43.3%) |
| 65 to 74 Years | 4 (100.0%) | 8 (80.0%) |
| 75 Years and over | 6 (100.0%) | 8 (100.0%) |
| Total | 86 (48.6%) | 129 (39.3%) |
Income Below Poverty Among Married-Couple Families in Burnside
The poverty statistics for married-couple families in Burnside show that 36.8% or 14 of the total 38 families live below the poverty line. Families with 3 or 4 children have the highest poverty rate of 100.0%, comprising of 14 families. On the other hand, families with no children have the lowest poverty rate of 0.0%, which includes 0 families.
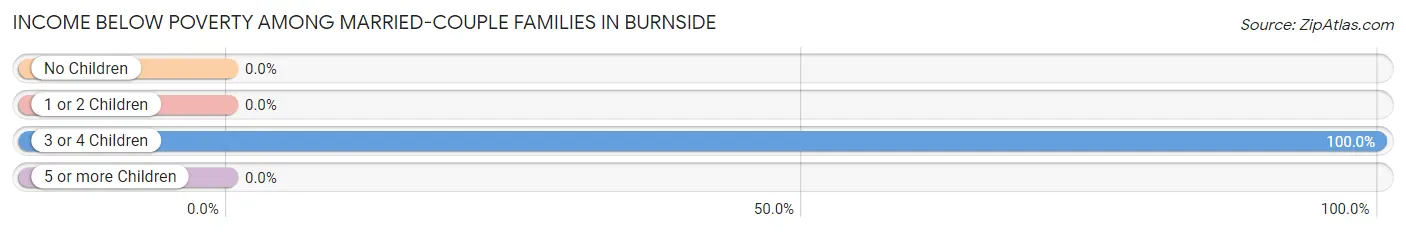
| Children | Above Poverty | Below Poverty |
| No Children | 9 (100.0%) | 0 (0.0%) |
| 1 or 2 Children | 15 (100.0%) | 0 (0.0%) |
| 3 or 4 Children | 0 (0.0%) | 14 (100.0%) |
| 5 or more Children | 0 (0.0%) | 0 (0.0%) |
| Total | 24 (63.2%) | 14 (36.8%) |
Income Below Poverty Among Single-Parent Households in Burnside
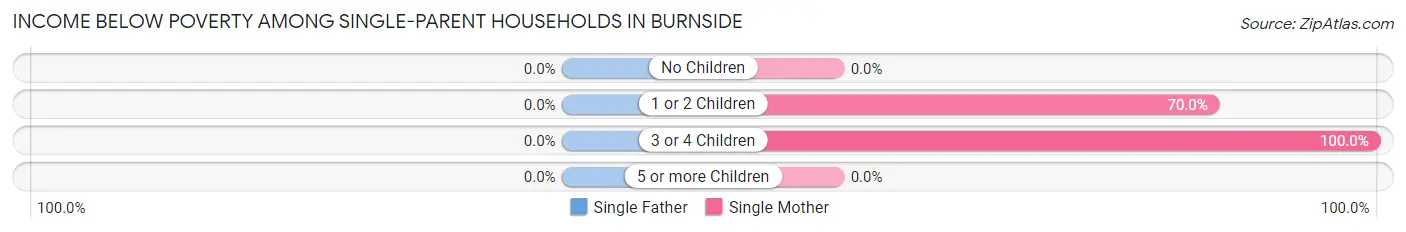
| Children | Single Father | Single Mother |
| No Children | 0 (0.0%) | 0 (0.0%) |
| 1 or 2 Children | 0 (0.0%) | 21 (70.0%) |
| 3 or 4 Children | 0 (0.0%) | 5 (100.0%) |
| 5 or more Children | 0 (0.0%) | 0 (0.0%) |
| Total | 0 (0.0%) | 26 (59.1%) |
Income Below Poverty Among Married-Couple vs Single-Parent Households in Burnside
The poverty data for Burnside shows that 14 of the married-couple family households (36.8%) and 26 of the single-parent households (59.1%) are living below the poverty level. Within the married-couple family households, those with 3 or 4 children have the highest poverty rate, with 14 households (100.0%) falling below the poverty line. Among the single-parent households, those with 3 or 4 children have the highest poverty rate, with 5 household (100.0%) living below poverty.
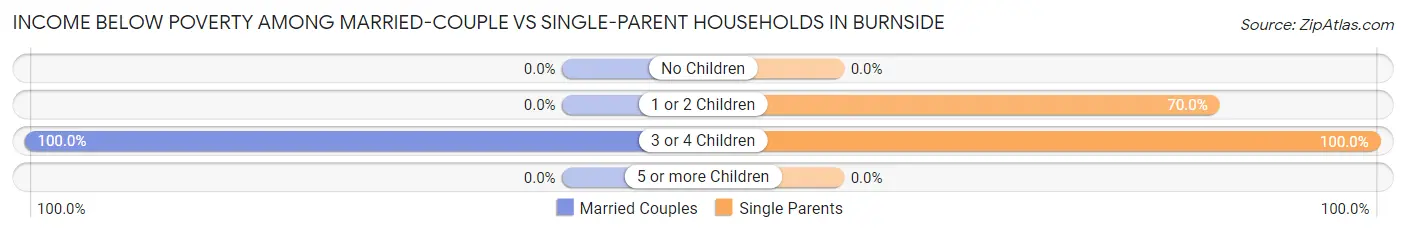
| Children | Married-Couple Families | Single-Parent Households |
| No Children | 0 (0.0%) | 0 (0.0%) |
| 1 or 2 Children | 0 (0.0%) | 21 (70.0%) |
| 3 or 4 Children | 14 (100.0%) | 5 (100.0%) |
| 5 or more Children | 0 (0.0%) | 0 (0.0%) |
| Total | 14 (36.8%) | 26 (59.1%) |
Race in Burnside
The most populous races in Burnside are Native / Alaskan (460 | 91.1%), Hispanic or Latino (27 | 5.3%), and Two or more Races (22 | 4.4%).
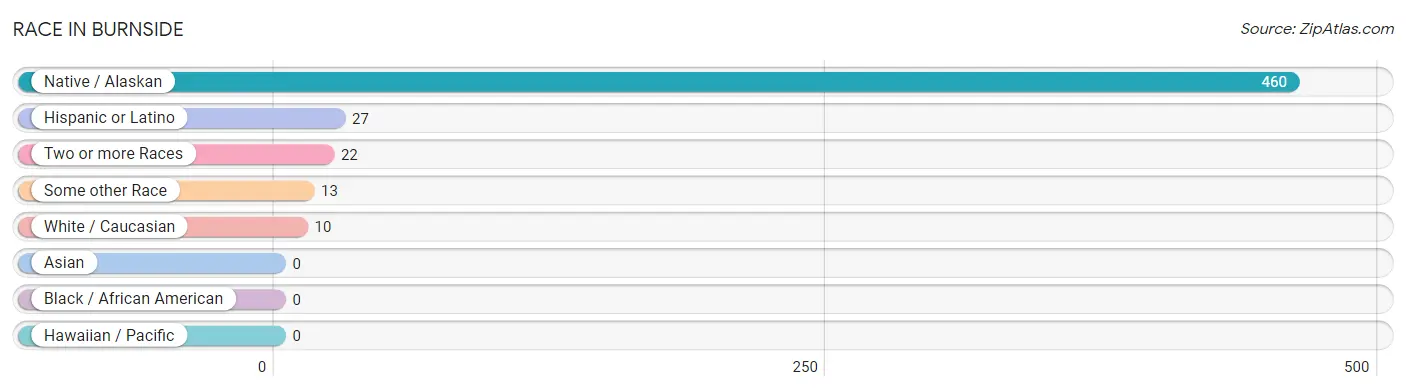
| Race | # Population | % Population |
| Asian | 0 | 0.0% |
| Black / African American | 0 | 0.0% |
| Hawaiian / Pacific | 0 | 0.0% |
| Hispanic or Latino | 27 | 5.3% |
| Native / Alaskan | 460 | 91.1% |
| White / Caucasian | 10 | 2.0% |
| Two or more Races | 22 | 4.4% |
| Some other Race | 13 | 2.6% |
| Total | 505 | 100.0% |
Ancestry in Burnside
The most populous ancestries reported in Burnside are Navajo (451 | 89.3%), Mexican (27 | 5.3%), Pima (27 | 5.3%), Danish (6 | 1.2%), and German (6 | 1.2%), together accounting for 102.4% of all Burnside residents.
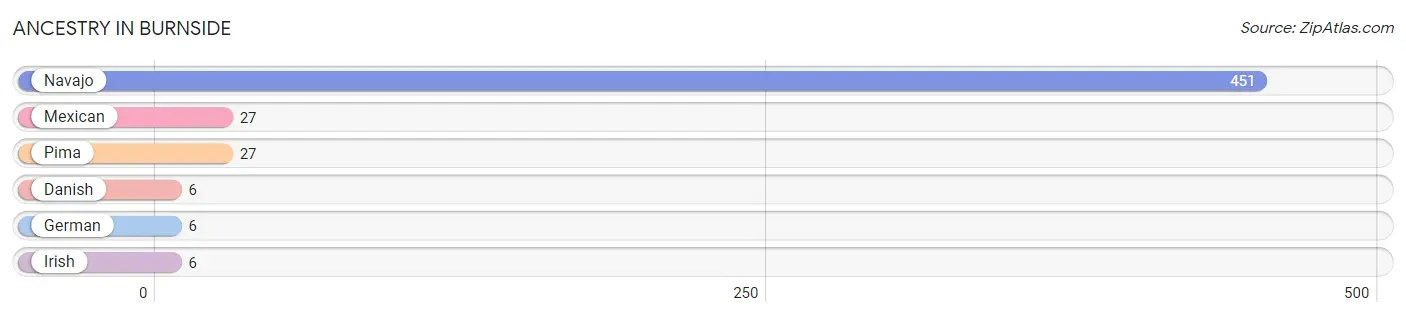
| Ancestry | # Population | % Population |
| Danish | 6 | 1.2% |
| German | 6 | 1.2% |
| Irish | 6 | 1.2% |
| Mexican | 27 | 5.3% |
| Navajo | 451 | 89.3% |
| Pima | 27 | 5.3% | View All 6 Rows |
Immigrants in Burnside

| Immigration Origin | # Population | % Population | View All 0 Rows |
Sex and Age in Burnside
Sex and Age in Burnside
The most populous age groups in Burnside are 20 to 24 Years (30 | 17.0%) for men and 30 to 34 Years (40 | 12.2%) for women.
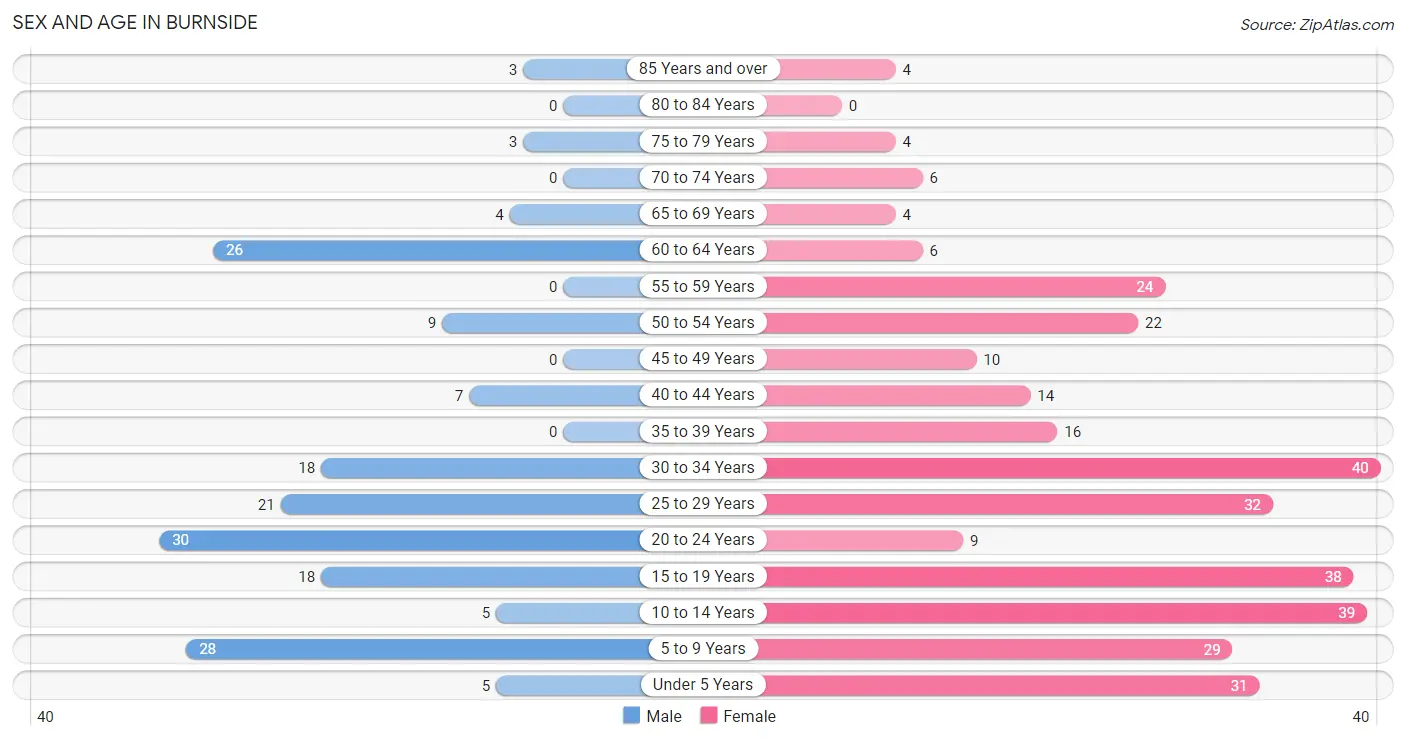
| Age Bracket | Male | Female |
| Under 5 Years | 5 (2.8%) | 31 (9.5%) |
| 5 to 9 Years | 28 (15.8%) | 29 (8.8%) |
| 10 to 14 Years | 5 (2.8%) | 39 (11.9%) |
| 15 to 19 Years | 18 (10.2%) | 38 (11.6%) |
| 20 to 24 Years | 30 (17.0%) | 9 (2.7%) |
| 25 to 29 Years | 21 (11.9%) | 32 (9.8%) |
| 30 to 34 Years | 18 (10.2%) | 40 (12.2%) |
| 35 to 39 Years | 0 (0.0%) | 16 (4.9%) |
| 40 to 44 Years | 7 (4.0%) | 14 (4.3%) |
| 45 to 49 Years | 0 (0.0%) | 10 (3.0%) |
| 50 to 54 Years | 9 (5.1%) | 22 (6.7%) |
| 55 to 59 Years | 0 (0.0%) | 24 (7.3%) |
| 60 to 64 Years | 26 (14.7%) | 6 (1.8%) |
| 65 to 69 Years | 4 (2.3%) | 4 (1.2%) |
| 70 to 74 Years | 0 (0.0%) | 6 (1.8%) |
| 75 to 79 Years | 3 (1.7%) | 4 (1.2%) |
| 80 to 84 Years | 0 (0.0%) | 0 (0.0%) |
| 85 Years and over | 3 (1.7%) | 4 (1.2%) |
| Total | 177 (100.0%) | 328 (100.0%) |
Families and Households in Burnside
Median Family Size in Burnside
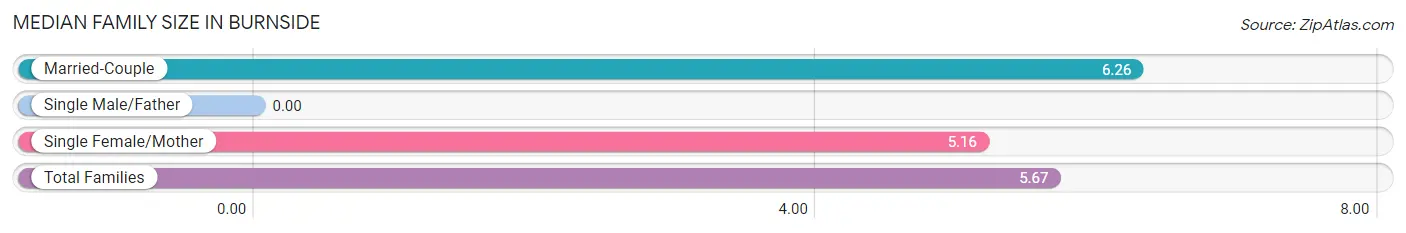
| Family Type | # Families | Family Size |
| Married-Couple | 38 (46.3%) | 6.26 |
| Single Male/Father | 0 (0.0%) | - |
| Single Female/Mother | 44 (53.7%) | 5.16 |
| Total Families | 82 (100.0%) | 5.67 |
Median Household Size in Burnside
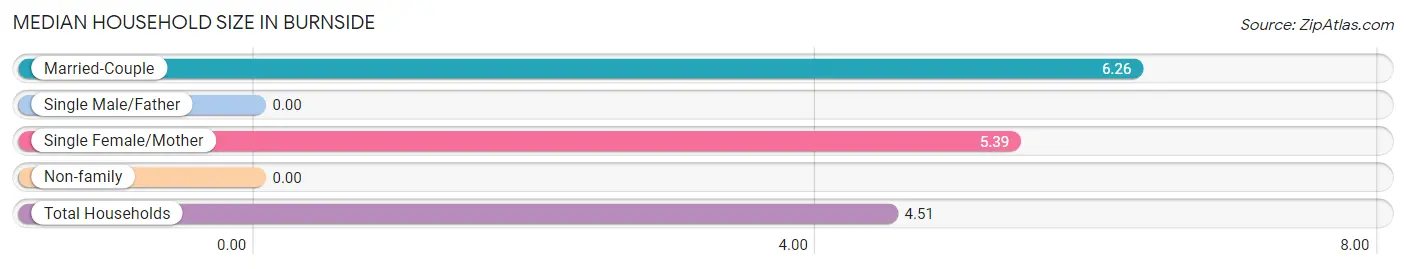
| Household Type | # Households | Household Size |
| Married-Couple | 38 (33.9%) | 6.26 |
| Single Male/Father | 0 (0.0%) | - |
| Single Female/Mother | 44 (39.3%) | 5.39 |
| Non-family | 30 (26.8%) | - |
| Total Households | 112 (100.0%) | 4.51 |
Household Size by Marriage Status in Burnside
Out of a total of 112 households in Burnside, 82 (73.2%) are family households, while 30 (26.8%) are nonfamily households. The most numerous type of family households are 4-person households, comprising 26, and the most common type of nonfamily households are 1-person households, comprising 30.
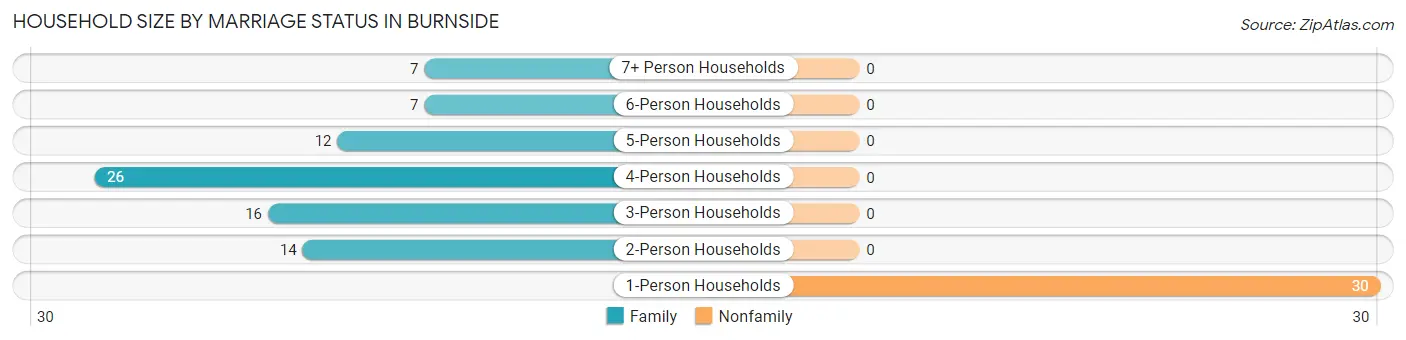
| Household Size | Family Households | Nonfamily Households |
| 1-Person Households | - | 30 (26.8%) |
| 2-Person Households | 14 (12.5%) | 0 (0.0%) |
| 3-Person Households | 16 (14.3%) | 0 (0.0%) |
| 4-Person Households | 26 (23.2%) | 0 (0.0%) |
| 5-Person Households | 12 (10.7%) | 0 (0.0%) |
| 6-Person Households | 7 (6.2%) | 0 (0.0%) |
| 7+ Person Households | 7 (6.2%) | 0 (0.0%) |
| Total | 82 (73.2%) | 30 (26.8%) |
Female Fertility in Burnside
Fertility by Age in Burnside
| Age Bracket | Women with Births | Births / 1,000 Women |
| 15 to 19 years | 0 (0.0%) | 0.0 |
| 20 to 34 years | 0 (0.0%) | 0.0 |
| 35 to 50 years | 0 (0.0%) | 0.0 |
| Total | 0 (0.0%) | 0.0 |
Fertility by Age by Marriage Status in Burnside
| Age Bracket | Married | Unmarried |
| 15 to 19 years | 0 (0.0%) | 0 (0.0%) |
| 20 to 34 years | 0 (0.0%) | 0 (0.0%) |
| 35 to 50 years | 0 (0.0%) | 0 (0.0%) |
| Total | 0 (0.0%) | 0 (0.0%) |
Fertility by Education in Burnside
| Educational Attainment | Women with Births | Births / 1,000 Women |
| Less than High School | 0 (0.0%) | 0.0 |
| High School Diploma | 0 (0.0%) | 0.0 |
| College or Associate's Degree | 0 (0.0%) | 0.0 |
| Bachelor's Degree | 0 (0.0%) | 0.0 |
| Graduate Degree | 0 (0.0%) | 0.0 |
| Total | 0 (0.0%) | 0.0 |
Fertility by Education by Marriage Status in Burnside
| Educational Attainment | Married | Unmarried |
| Less than High School | 0 (0.0%) | 0 (0.0%) |
| High School Diploma | 0 (0.0%) | 0 (0.0%) |
| College or Associate's Degree | 0 (0.0%) | 0 (0.0%) |
| Bachelor's Degree | 0 (0.0%) | 0 (0.0%) |
| Graduate Degree | 0 (0.0%) | 0 (0.0%) |
| Total | 0 (0.0%) | 0 (0.0%) |
Employment Characteristics in Burnside
Employment by Class of Employer in Burnside
Among the 145 employed individuals in Burnside, private company employees (69 | 47.6%), state government employees (26 | 17.9%), and federal government employees (26 | 17.9%) make up the most common classes of employment.
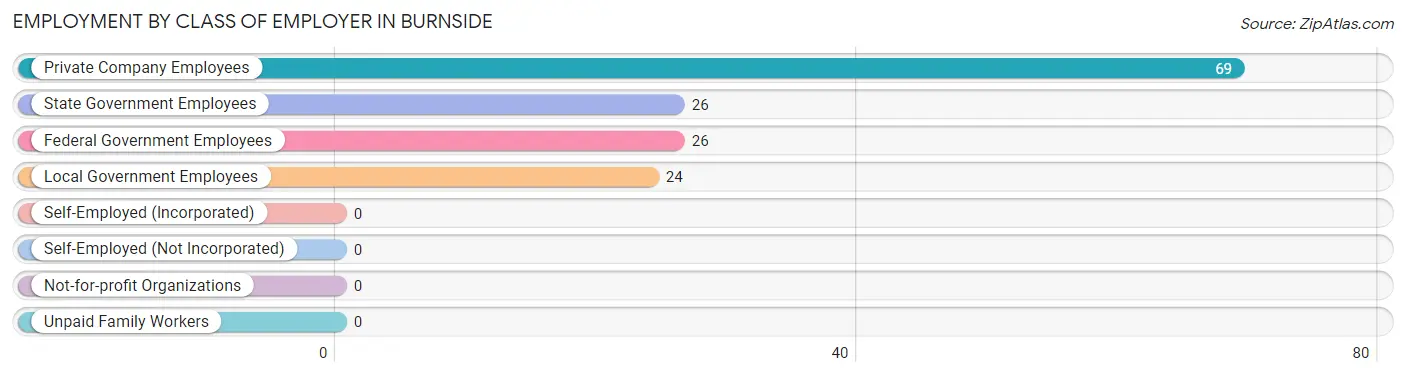
| Employer Class | # Employees | % Employees |
| Private Company Employees | 69 | 47.6% |
| Self-Employed (Incorporated) | 0 | 0.0% |
| Self-Employed (Not Incorporated) | 0 | 0.0% |
| Not-for-profit Organizations | 0 | 0.0% |
| Local Government Employees | 24 | 16.6% |
| State Government Employees | 26 | 17.9% |
| Federal Government Employees | 26 | 17.9% |
| Unpaid Family Workers | 0 | 0.0% |
| Total | 145 | 100.0% |
Employment Status by Age in Burnside
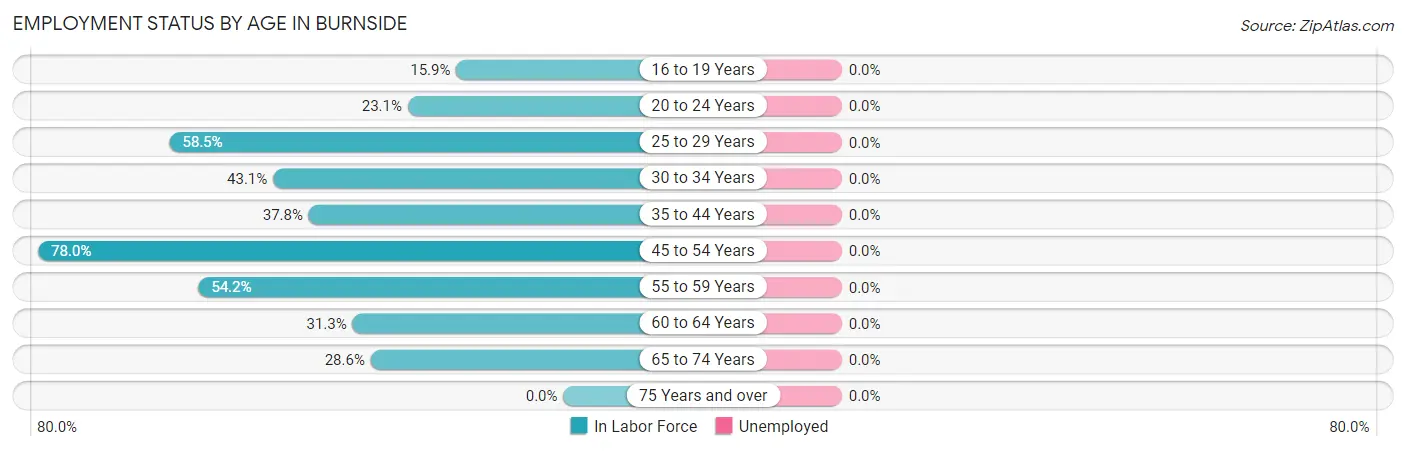
| Age Bracket | In Labor Force | Unemployed |
| 16 to 19 Years | 7 (15.9%) | 0 (0.0%) |
| 20 to 24 Years | 9 (23.1%) | 0 (0.0%) |
| 25 to 29 Years | 31 (58.5%) | 0 (0.0%) |
| 30 to 34 Years | 25 (43.1%) | 0 (0.0%) |
| 35 to 44 Years | 14 (37.8%) | 0 (0.0%) |
| 45 to 54 Years | 32 (78.0%) | 0 (0.0%) |
| 55 to 59 Years | 13 (54.2%) | 0 (0.0%) |
| 60 to 64 Years | 10 (31.3%) | 0 (0.0%) |
| 65 to 74 Years | 4 (28.6%) | 0 (0.0%) |
| 75 Years and over | 0 (0.0%) | 0 (0.0%) |
| Total | 145 (40.7%) | 0 (0.0%) |
Employment Status by Educational Attainment in Burnside
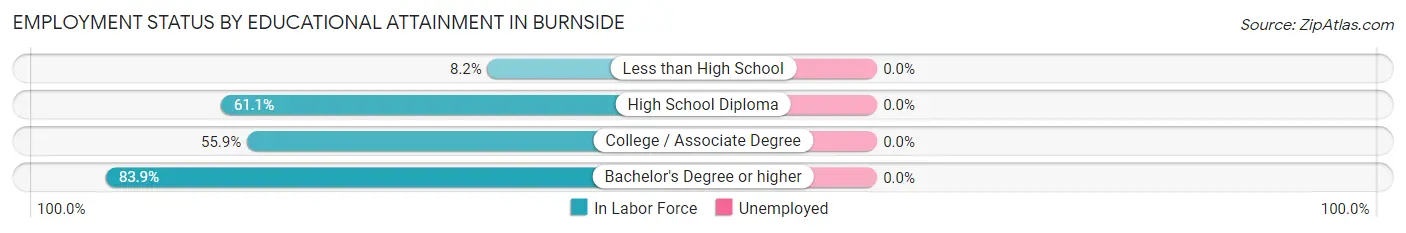
| Educational Attainment | In Labor Force | Unemployed |
| Less than High School | 4 (8.2%) | 0 (0.0%) |
| High School Diploma | 33 (61.1%) | 0 (0.0%) |
| College / Associate Degree | 62 (55.9%) | 0 (0.0%) |
| Bachelor's Degree or higher | 26 (83.9%) | 0 (0.0%) |
| Total | 125 (51.0%) | 0 (0.0%) |
Employment Occupations by Sex in Burnside
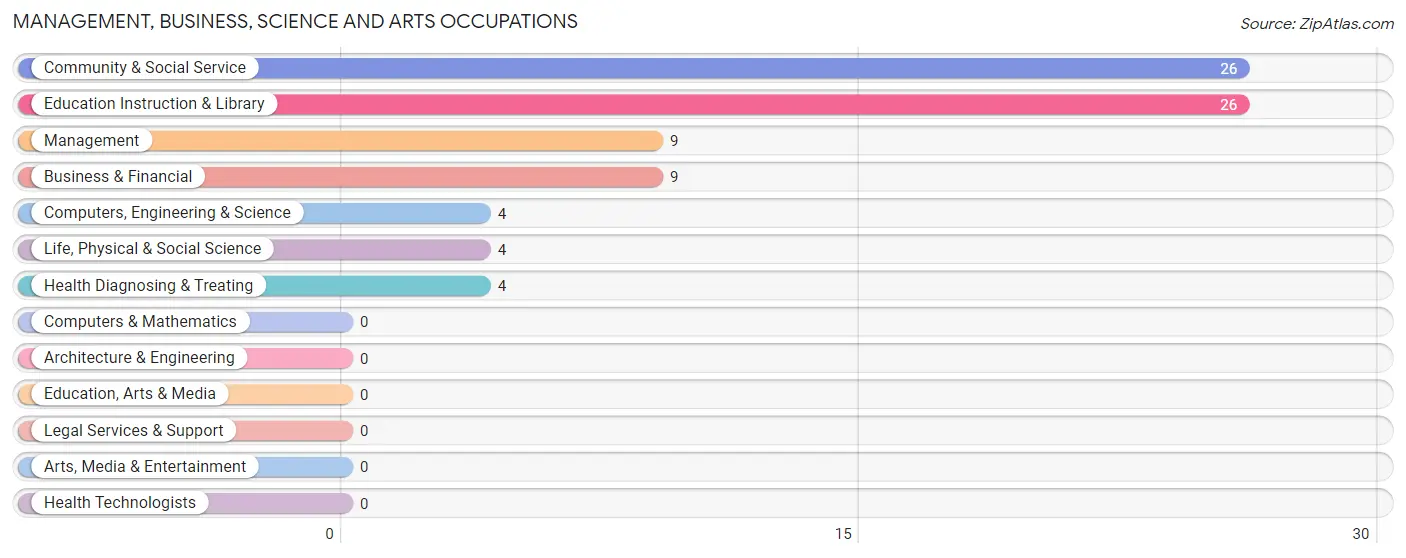
Management, Business, Science and Arts Occupations
The most common Management, Business, Science and Arts occupations in Burnside are Community & Social Service (26 | 17.9%), Education Instruction & Library (26 | 17.9%), Management (9 | 6.2%), Business & Financial (9 | 6.2%), and Computers, Engineering & Science (4 | 2.8%).
Management, Business, Science and Arts Occupations by Sex
Within the Management, Business, Science and Arts occupations in Burnside, the most male-oriented occupations are Management (100.0%), Business & Financial (100.0%), and Health Diagnosing & Treating (100.0%), while the most female-oriented occupations are Computers, Engineering & Science (100.0%), Life, Physical & Social Science (100.0%), and Community & Social Service (65.4%).
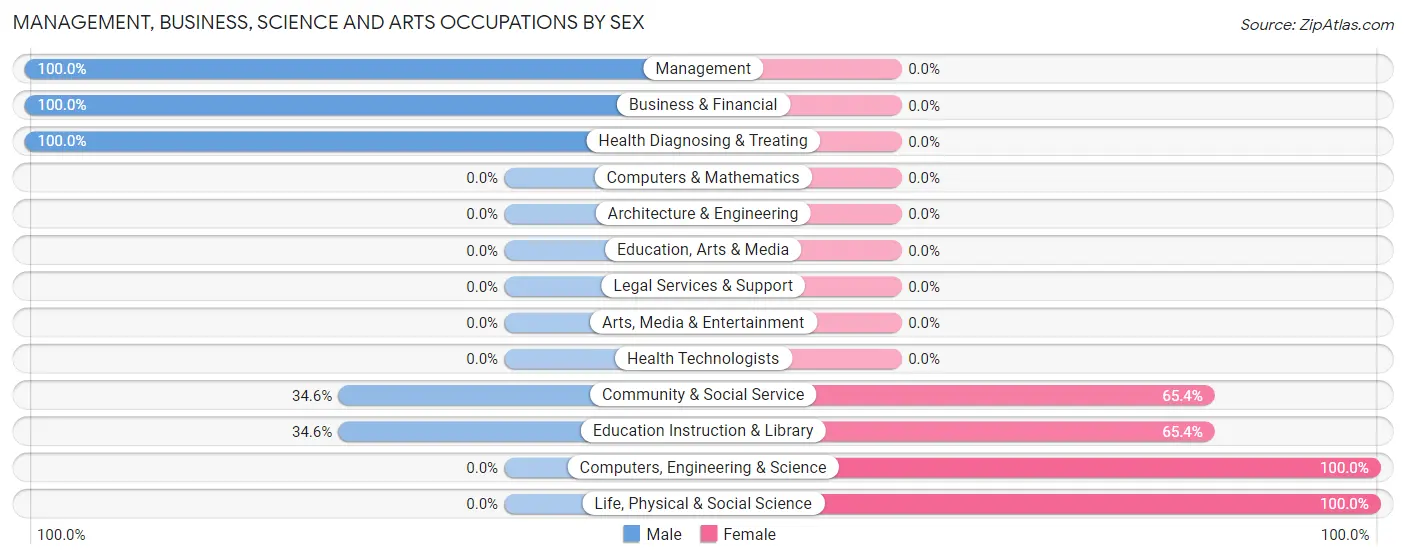
| Occupation | Male | Female |
| Management | 9 (100.0%) | 0 (0.0%) |
| Business & Financial | 9 (100.0%) | 0 (0.0%) |
| Computers, Engineering & Science | 0 (0.0%) | 4 (100.0%) |
| Computers & Mathematics | 0 (0.0%) | 0 (0.0%) |
| Architecture & Engineering | 0 (0.0%) | 0 (0.0%) |
| Life, Physical & Social Science | 0 (0.0%) | 4 (100.0%) |
| Community & Social Service | 9 (34.6%) | 17 (65.4%) |
| Education, Arts & Media | 0 (0.0%) | 0 (0.0%) |
| Legal Services & Support | 0 (0.0%) | 0 (0.0%) |
| Education Instruction & Library | 9 (34.6%) | 17 (65.4%) |
| Arts, Media & Entertainment | 0 (0.0%) | 0 (0.0%) |
| Health Diagnosing & Treating | 4 (100.0%) | 0 (0.0%) |
| Health Technologists | 0 (0.0%) | 0 (0.0%) |
| Total (Category) | 31 (59.6%) | 21 (40.4%) |
| Total (Overall) | 60 (41.4%) | 85 (58.6%) |
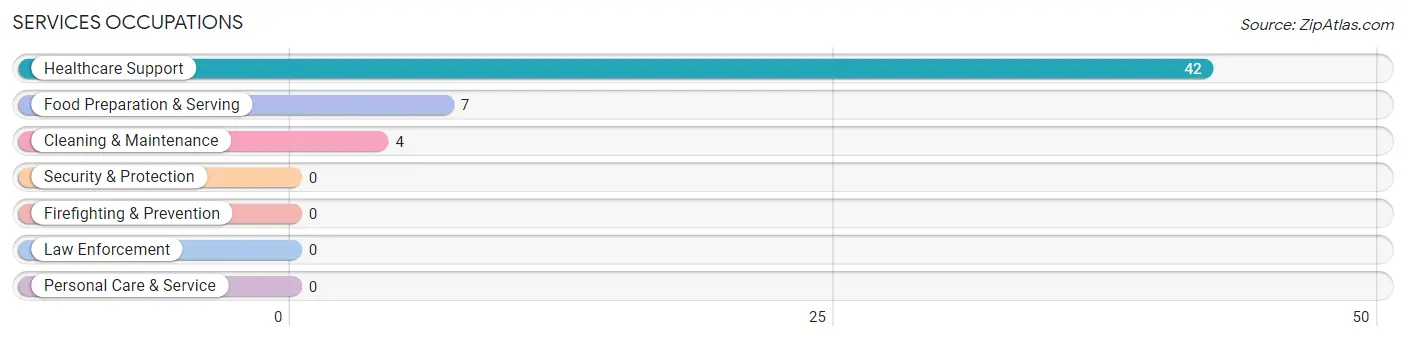
Services Occupations
The most common Services occupations in Burnside are Healthcare Support (42 | 29.0%), Food Preparation & Serving (7 | 4.8%), and Cleaning & Maintenance (4 | 2.8%).
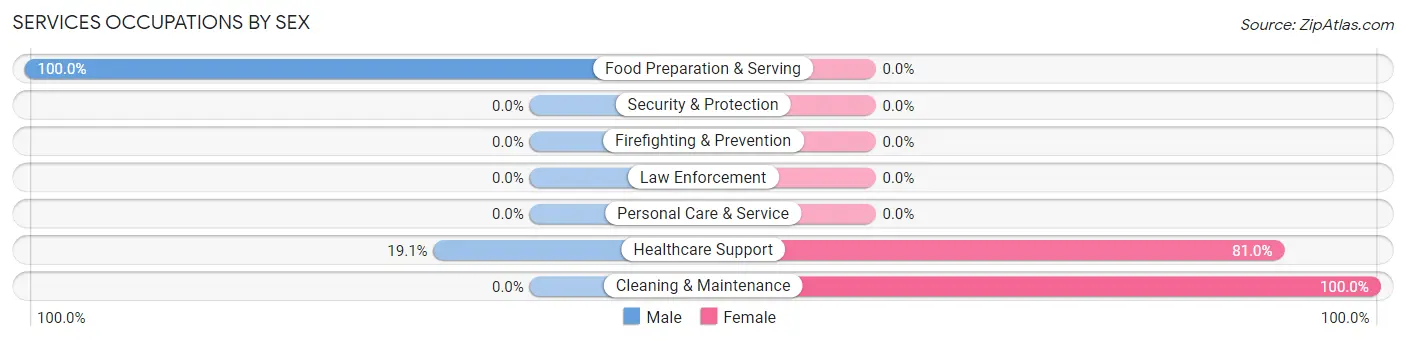
Services Occupations by Sex
Within the Services occupations in Burnside, the most male-oriented occupations are Food Preparation & Serving (100.0%), and Healthcare Support (19.1%), while the most female-oriented occupations are Cleaning & Maintenance (100.0%), and Healthcare Support (80.9%).
| Occupation | Male | Female |
| Healthcare Support | 8 (19.1%) | 34 (80.9%) |
| Security & Protection | 0 (0.0%) | 0 (0.0%) |
| Firefighting & Prevention | 0 (0.0%) | 0 (0.0%) |
| Law Enforcement | 0 (0.0%) | 0 (0.0%) |
| Food Preparation & Serving | 7 (100.0%) | 0 (0.0%) |
| Cleaning & Maintenance | 0 (0.0%) | 4 (100.0%) |
| Personal Care & Service | 0 (0.0%) | 0 (0.0%) |
| Total (Category) | 15 (28.3%) | 38 (71.7%) |
| Total (Overall) | 60 (41.4%) | 85 (58.6%) |
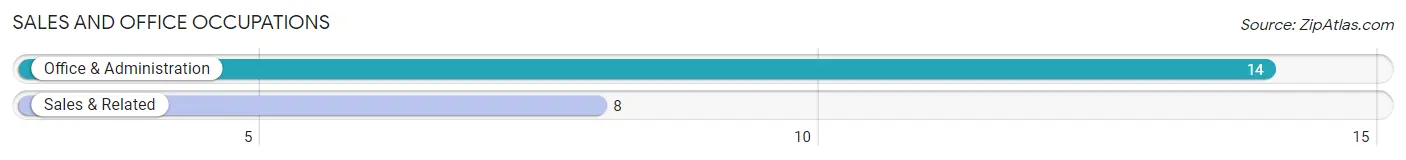
Sales and Office Occupations
The most common Sales and Office occupations in Burnside are Office & Administration (14 | 9.7%), and Sales & Related (8 | 5.5%).
Sales and Office Occupations by Sex
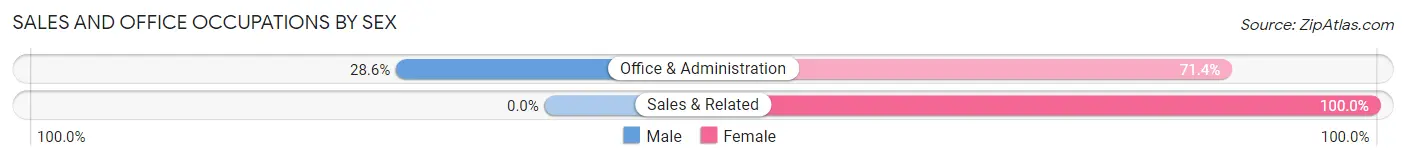
| Occupation | Male | Female |
| Sales & Related | 0 (0.0%) | 8 (100.0%) |
| Office & Administration | 4 (28.6%) | 10 (71.4%) |
| Total (Category) | 4 (18.2%) | 18 (81.8%) |
| Total (Overall) | 60 (41.4%) | 85 (58.6%) |
Natural Resources, Construction and Maintenance Occupations
Natural Resources, Construction and Maintenance Occupations by Sex
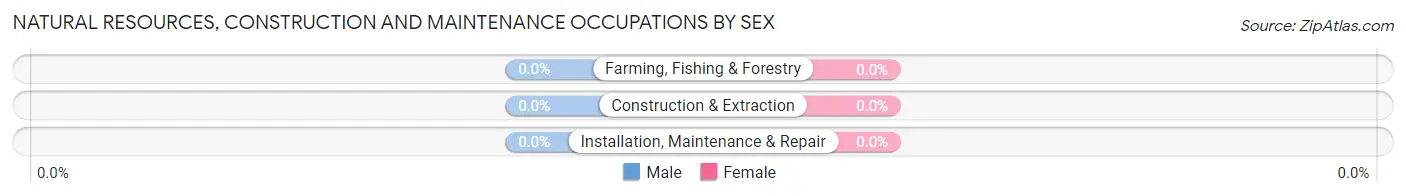
| Occupation | Male | Female |
| Farming, Fishing & Forestry | 0 (0.0%) | 0 (0.0%) |
| Construction & Extraction | 0 (0.0%) | 0 (0.0%) |
| Installation, Maintenance & Repair | 0 (0.0%) | 0 (0.0%) |
| Total (Category) | 0 (0.0%) | 0 (0.0%) |
| Total (Overall) | 60 (41.4%) | 85 (58.6%) |
Production, Transportation and Moving Occupations
The most common Production, Transportation and Moving occupations in Burnside are Transportation (10 | 6.9%), and Material Moving (8 | 5.5%).
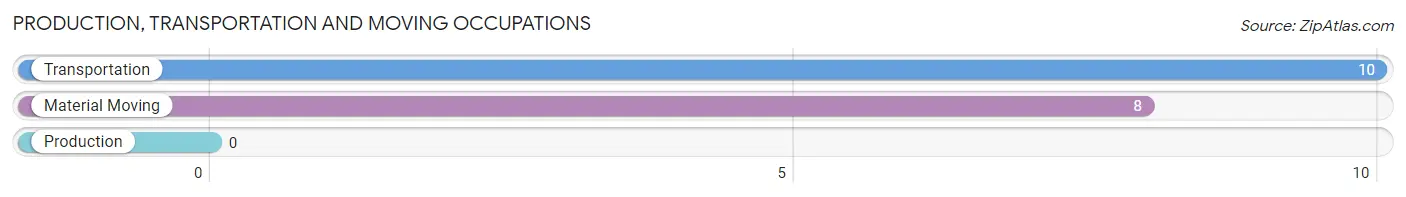
Production, Transportation and Moving Occupations by Sex
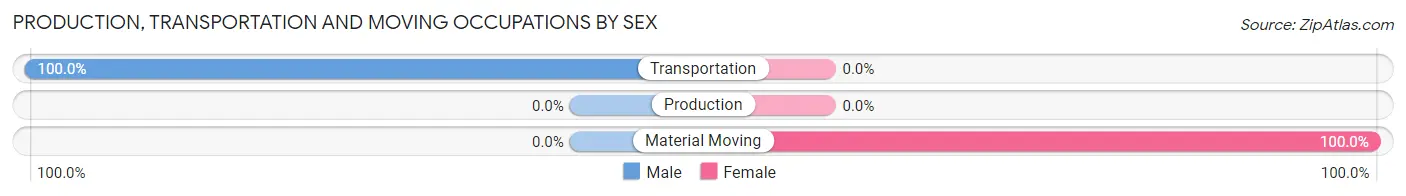
| Occupation | Male | Female |
| Production | 0 (0.0%) | 0 (0.0%) |
| Transportation | 10 (100.0%) | 0 (0.0%) |
| Material Moving | 0 (0.0%) | 8 (100.0%) |
| Total (Category) | 10 (55.6%) | 8 (44.4%) |
| Total (Overall) | 60 (41.4%) | 85 (58.6%) |
Employment Industries by Sex in Burnside
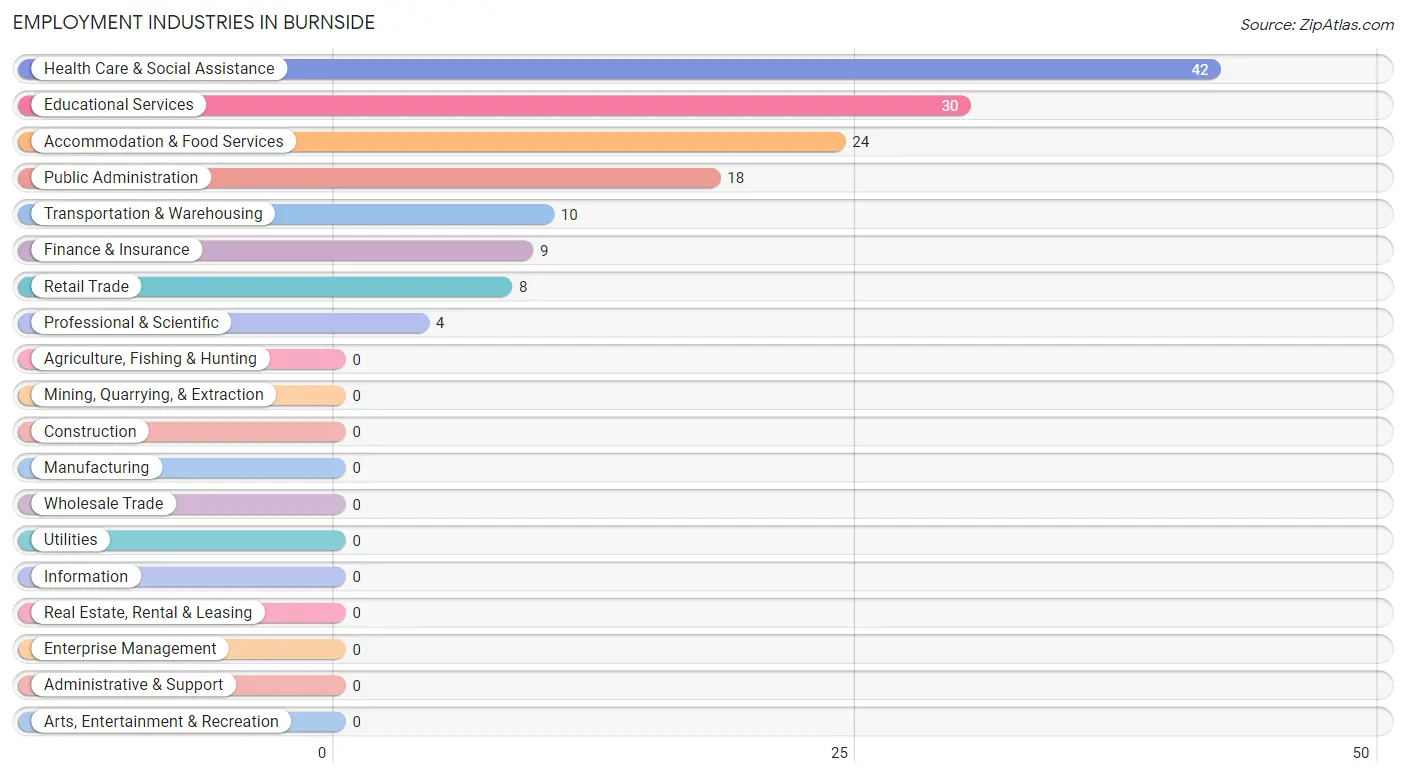
Employment Industries in Burnside
The major employment industries in Burnside include Health Care & Social Assistance (42 | 29.0%), Educational Services (30 | 20.7%), Accommodation & Food Services (24 | 16.6%), Public Administration (18 | 12.4%), and Transportation & Warehousing (10 | 6.9%).
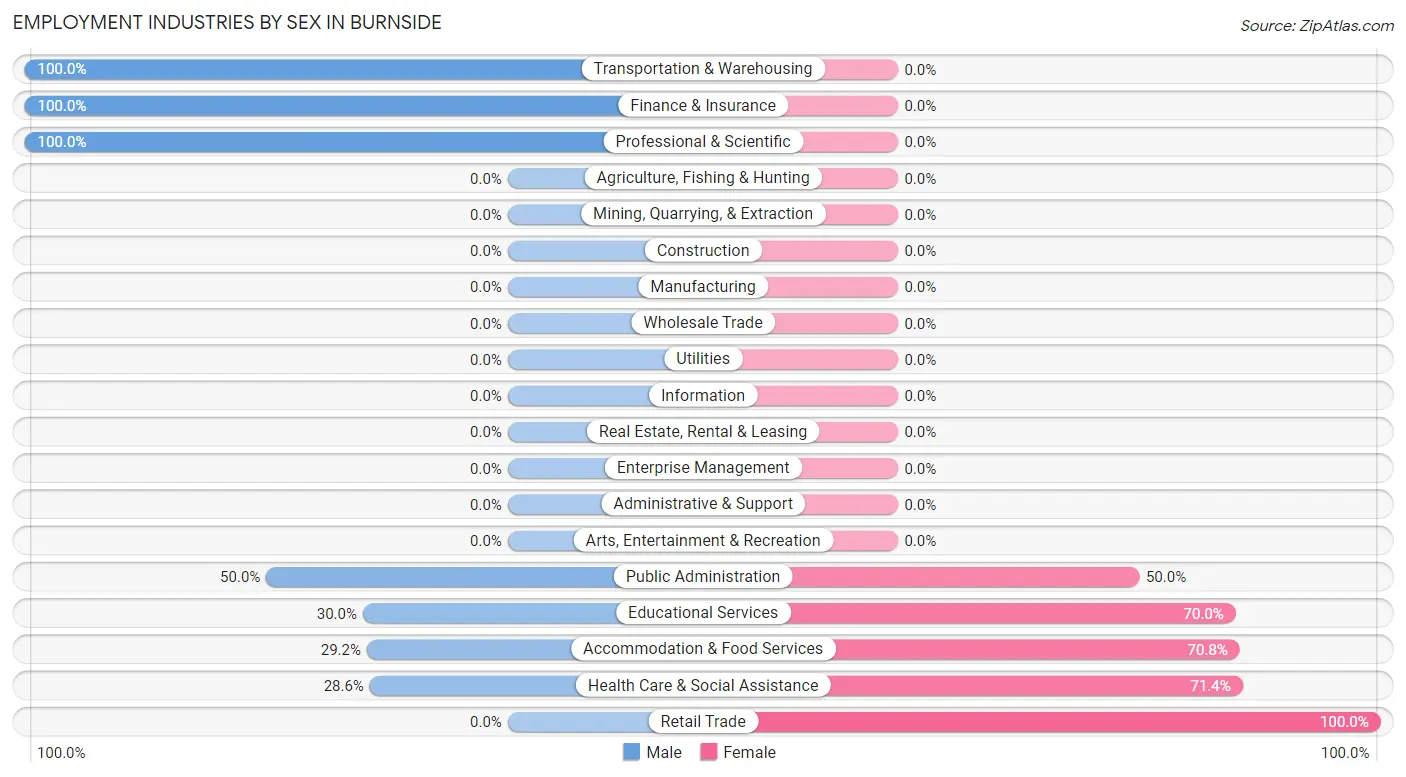
Employment Industries by Sex in Burnside
The Burnside industries that see more men than women are Transportation & Warehousing (100.0%), Finance & Insurance (100.0%), and Professional & Scientific (100.0%), whereas the industries that tend to have a higher number of women are Retail Trade (100.0%), Health Care & Social Assistance (71.4%), and Accommodation & Food Services (70.8%).
| Industry | Male | Female |
| Agriculture, Fishing & Hunting | 0 (0.0%) | 0 (0.0%) |
| Mining, Quarrying, & Extraction | 0 (0.0%) | 0 (0.0%) |
| Construction | 0 (0.0%) | 0 (0.0%) |
| Manufacturing | 0 (0.0%) | 0 (0.0%) |
| Wholesale Trade | 0 (0.0%) | 0 (0.0%) |
| Retail Trade | 0 (0.0%) | 8 (100.0%) |
| Transportation & Warehousing | 10 (100.0%) | 0 (0.0%) |
| Utilities | 0 (0.0%) | 0 (0.0%) |
| Information | 0 (0.0%) | 0 (0.0%) |
| Finance & Insurance | 9 (100.0%) | 0 (0.0%) |
| Real Estate, Rental & Leasing | 0 (0.0%) | 0 (0.0%) |
| Professional & Scientific | 4 (100.0%) | 0 (0.0%) |
| Enterprise Management | 0 (0.0%) | 0 (0.0%) |
| Administrative & Support | 0 (0.0%) | 0 (0.0%) |
| Educational Services | 9 (30.0%) | 21 (70.0%) |
| Health Care & Social Assistance | 12 (28.6%) | 30 (71.4%) |
| Arts, Entertainment & Recreation | 0 (0.0%) | 0 (0.0%) |
| Accommodation & Food Services | 7 (29.2%) | 17 (70.8%) |
| Public Administration | 9 (50.0%) | 9 (50.0%) |
| Total | 60 (41.4%) | 85 (58.6%) |
Education in Burnside
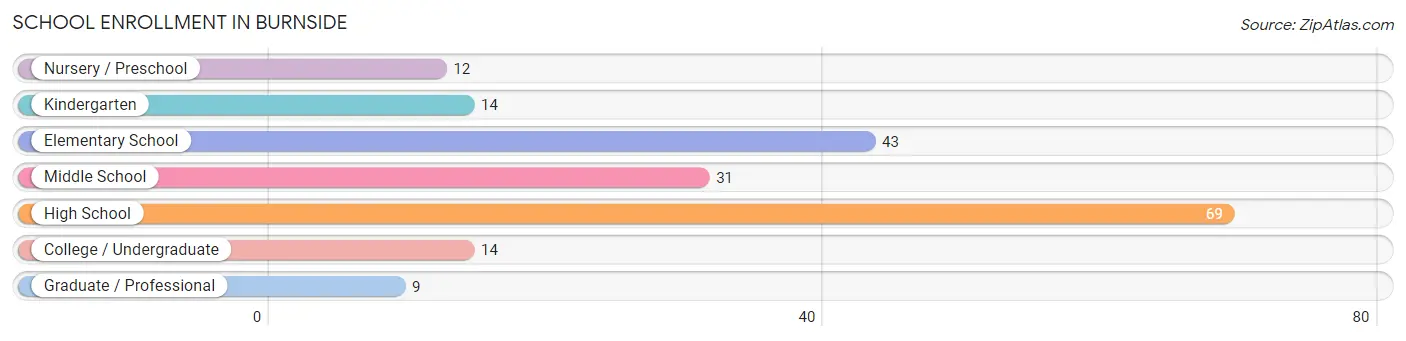
School Enrollment in Burnside
The most common levels of schooling among the 192 students in Burnside are high school (69 | 35.9%), elementary school (43 | 22.4%), and middle school (31 | 16.2%).
| School Level | # Students | % Students |
| Nursery / Preschool | 12 | 6.2% |
| Kindergarten | 14 | 7.3% |
| Elementary School | 43 | 22.4% |
| Middle School | 31 | 16.2% |
| High School | 69 | 35.9% |
| College / Undergraduate | 14 | 7.3% |
| Graduate / Professional | 9 | 4.7% |
| Total | 192 | 100.0% |
School Enrollment by Age by Funding Source in Burnside
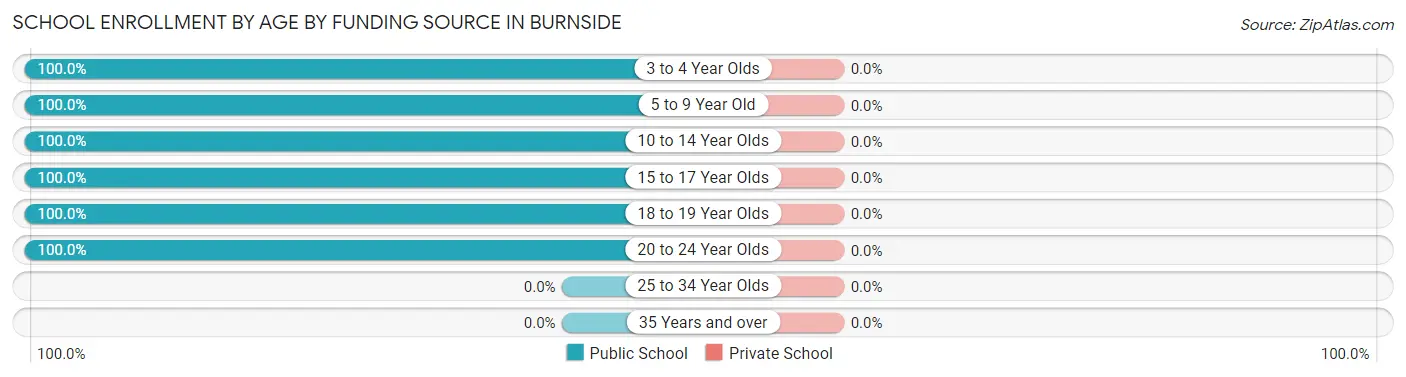
| Age Bracket | Public School | Private School |
| 3 to 4 Year Olds | 12 (100.0%) | 0 (0.0%) |
| 5 to 9 Year Old | 57 (100.0%) | 0 (0.0%) |
| 10 to 14 Year Olds | 44 (100.0%) | 0 (0.0%) |
| 15 to 17 Year Olds | 34 (100.0%) | 0 (0.0%) |
| 18 to 19 Year Olds | 22 (100.0%) | 0 (0.0%) |
| 20 to 24 Year Olds | 23 (100.0%) | 0 (0.0%) |
| 25 to 34 Year Olds | 0 (0.0%) | 0 (0.0%) |
| 35 Years and over | 0 (0.0%) | 0 (0.0%) |
| Total | 192 (100.0%) | 0 (0.0%) |
Educational Attainment by Field of Study in Burnside
Education (21 | 60.0%), bio, nature & agricultural (9 | 25.7%), and physical & health sciences (5 | 14.3%) are the most common fields of study among 35 individuals in Burnside who have obtained a bachelor's degree or higher.
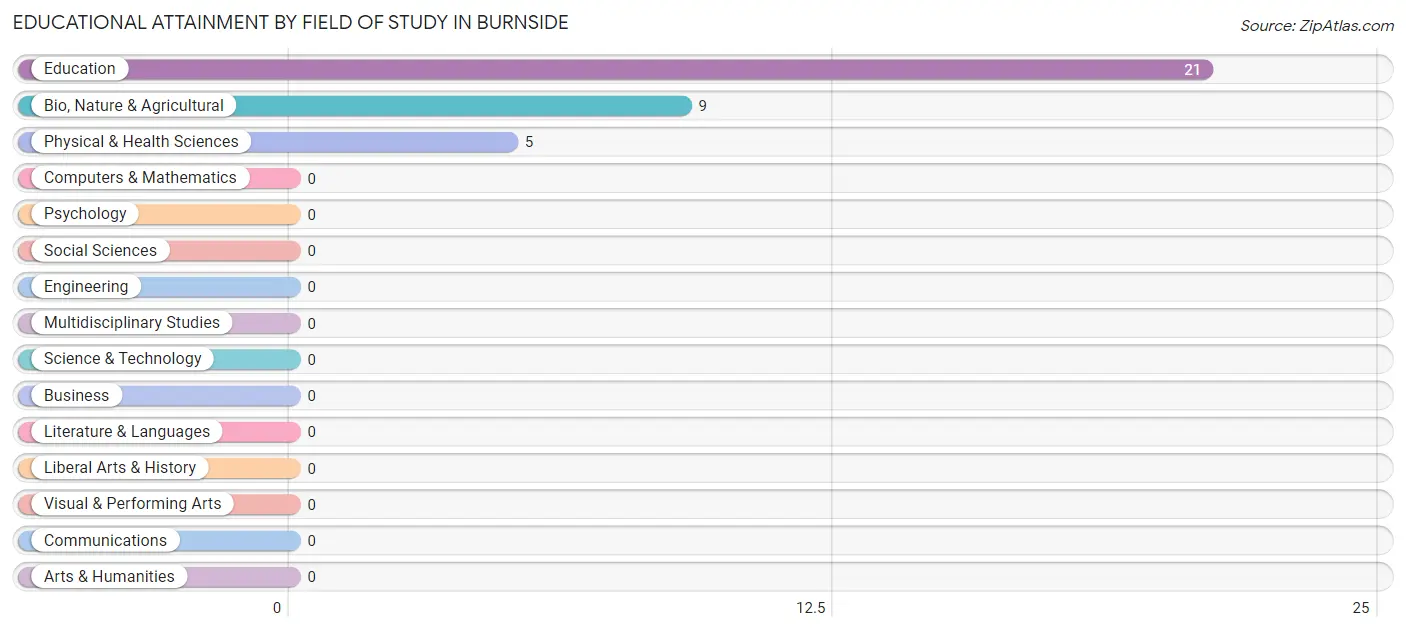
| Field of Study | # Graduates | % Graduates |
| Computers & Mathematics | 0 | 0.0% |
| Bio, Nature & Agricultural | 9 | 25.7% |
| Physical & Health Sciences | 5 | 14.3% |
| Psychology | 0 | 0.0% |
| Social Sciences | 0 | 0.0% |
| Engineering | 0 | 0.0% |
| Multidisciplinary Studies | 0 | 0.0% |
| Science & Technology | 0 | 0.0% |
| Business | 0 | 0.0% |
| Education | 21 | 60.0% |
| Literature & Languages | 0 | 0.0% |
| Liberal Arts & History | 0 | 0.0% |
| Visual & Performing Arts | 0 | 0.0% |
| Communications | 0 | 0.0% |
| Arts & Humanities | 0 | 0.0% |
| Total | 35 | 100.0% |
Transportation & Commute in Burnside
Vehicle Availability by Sex in Burnside
The most prevalent vehicle ownership categories in Burnside are males with 3 vehicles (22, accounting for 36.7%) and females with 3 vehicles (8, making up 25.9%).
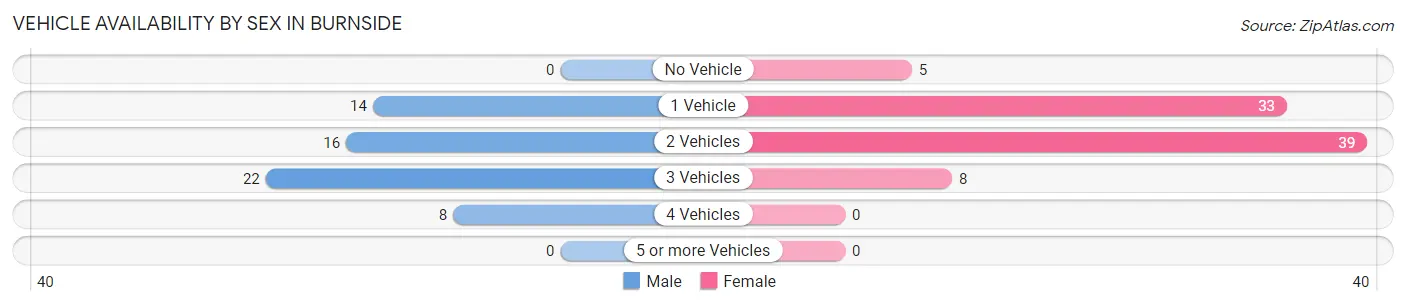
| Vehicles Available | Male | Female |
| No Vehicle | 0 (0.0%) | 5 (5.9%) |
| 1 Vehicle | 14 (23.3%) | 33 (38.8%) |
| 2 Vehicles | 16 (26.7%) | 39 (45.9%) |
| 3 Vehicles | 22 (36.7%) | 8 (9.4%) |
| 4 Vehicles | 8 (13.3%) | 0 (0.0%) |
| 5 or more Vehicles | 0 (0.0%) | 0 (0.0%) |
| Total | 60 (100.0%) | 85 (100.0%) |
Commute Time in Burnside
The most frequently occuring commute durations in Burnside are less than 5 minutes (28 commuters, 23.1%), 45 to 59 minutes (24 commuters, 19.8%), and 5 to 9 minutes (23 commuters, 19.0%).
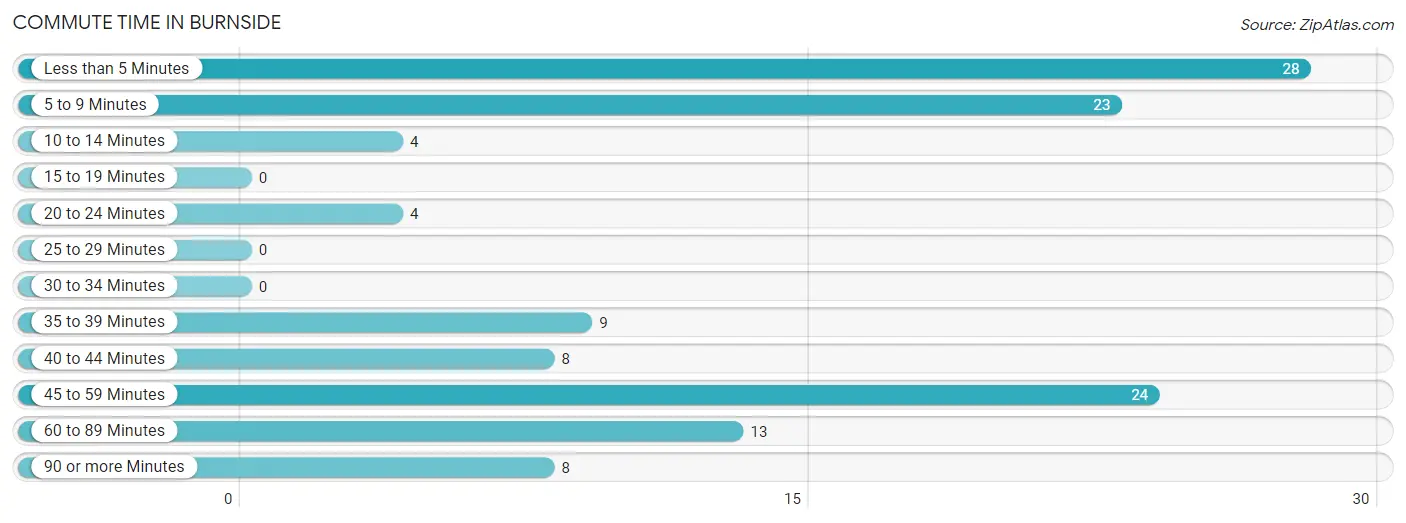
| Commute Time | # Commuters | % Commuters |
| Less than 5 Minutes | 28 | 23.1% |
| 5 to 9 Minutes | 23 | 19.0% |
| 10 to 14 Minutes | 4 | 3.3% |
| 15 to 19 Minutes | 0 | 0.0% |
| 20 to 24 Minutes | 4 | 3.3% |
| 25 to 29 Minutes | 0 | 0.0% |
| 30 to 34 Minutes | 0 | 0.0% |
| 35 to 39 Minutes | 9 | 7.4% |
| 40 to 44 Minutes | 8 | 6.6% |
| 45 to 59 Minutes | 24 | 19.8% |
| 60 to 89 Minutes | 13 | 10.7% |
| 90 or more Minutes | 8 | 6.6% |
Commute Time by Sex in Burnside
The most common commute times in Burnside are 5 to 9 minutes (19 commuters, 33.9%) for males and less than 5 minutes (21 commuters, 32.3%) for females.
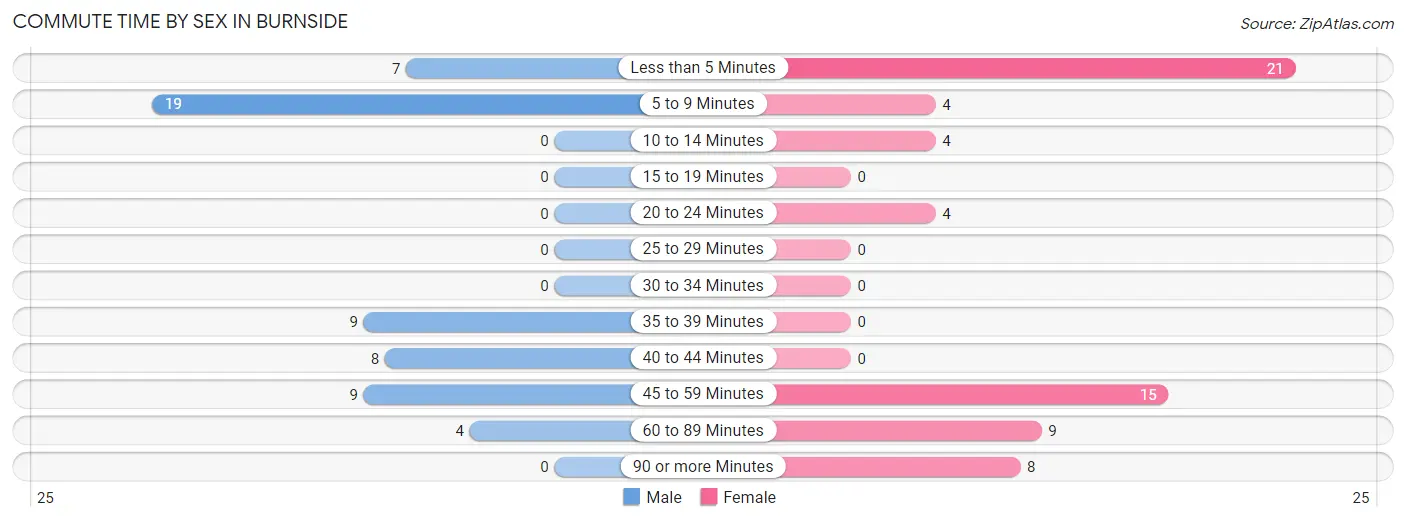
| Commute Time | Male | Female |
| Less than 5 Minutes | 7 (12.5%) | 21 (32.3%) |
| 5 to 9 Minutes | 19 (33.9%) | 4 (6.1%) |
| 10 to 14 Minutes | 0 (0.0%) | 4 (6.1%) |
| 15 to 19 Minutes | 0 (0.0%) | 0 (0.0%) |
| 20 to 24 Minutes | 0 (0.0%) | 4 (6.1%) |
| 25 to 29 Minutes | 0 (0.0%) | 0 (0.0%) |
| 30 to 34 Minutes | 0 (0.0%) | 0 (0.0%) |
| 35 to 39 Minutes | 9 (16.1%) | 0 (0.0%) |
| 40 to 44 Minutes | 8 (14.3%) | 0 (0.0%) |
| 45 to 59 Minutes | 9 (16.1%) | 15 (23.1%) |
| 60 to 89 Minutes | 4 (7.1%) | 9 (13.9%) |
| 90 or more Minutes | 0 (0.0%) | 8 (12.3%) |
Time of Departure to Work by Sex in Burnside
The most frequent times of departure to work in Burnside are 6:00 AM to 6:29 AM (19, 33.9%) for males and 7:00 AM to 7:29 AM (36, 55.4%) for females.
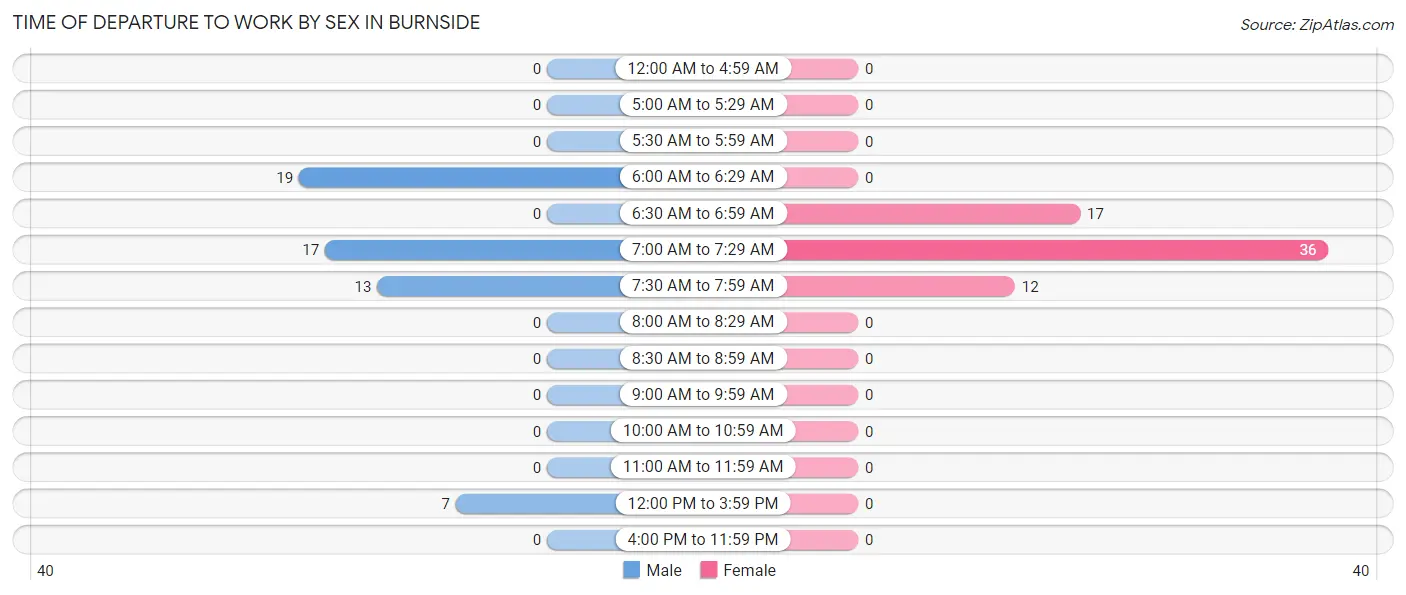
| Time of Departure | Male | Female |
| 12:00 AM to 4:59 AM | 0 (0.0%) | 0 (0.0%) |
| 5:00 AM to 5:29 AM | 0 (0.0%) | 0 (0.0%) |
| 5:30 AM to 5:59 AM | 0 (0.0%) | 0 (0.0%) |
| 6:00 AM to 6:29 AM | 19 (33.9%) | 0 (0.0%) |
| 6:30 AM to 6:59 AM | 0 (0.0%) | 17 (26.2%) |
| 7:00 AM to 7:29 AM | 17 (30.4%) | 36 (55.4%) |
| 7:30 AM to 7:59 AM | 13 (23.2%) | 12 (18.5%) |
| 8:00 AM to 8:29 AM | 0 (0.0%) | 0 (0.0%) |
| 8:30 AM to 8:59 AM | 0 (0.0%) | 0 (0.0%) |
| 9:00 AM to 9:59 AM | 0 (0.0%) | 0 (0.0%) |
| 10:00 AM to 10:59 AM | 0 (0.0%) | 0 (0.0%) |
| 11:00 AM to 11:59 AM | 0 (0.0%) | 0 (0.0%) |
| 12:00 PM to 3:59 PM | 7 (12.5%) | 0 (0.0%) |
| 4:00 PM to 11:59 PM | 0 (0.0%) | 0 (0.0%) |
| Total | 56 (100.0%) | 65 (100.0%) |
Housing Occupancy in Burnside
Occupancy by Ownership in Burnside
Of the total 112 dwellings in Burnside, owner-occupied units account for 52 (46.4%), while renter-occupied units make up 60 (53.6%).
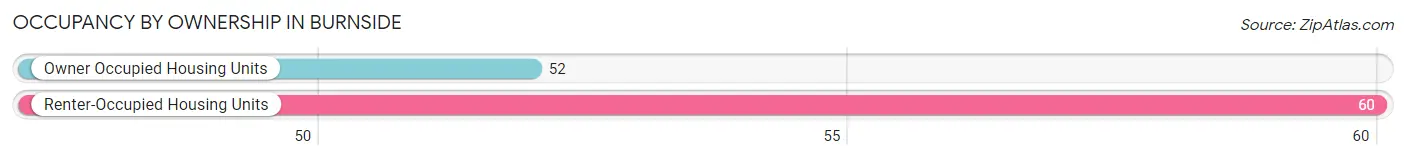
| Occupancy | # Housing Units | % Housing Units |
| Owner Occupied Housing Units | 52 | 46.4% |
| Renter-Occupied Housing Units | 60 | 53.6% |
| Total Occupied Housing Units | 112 | 100.0% |
Occupancy by Household Size in Burnside
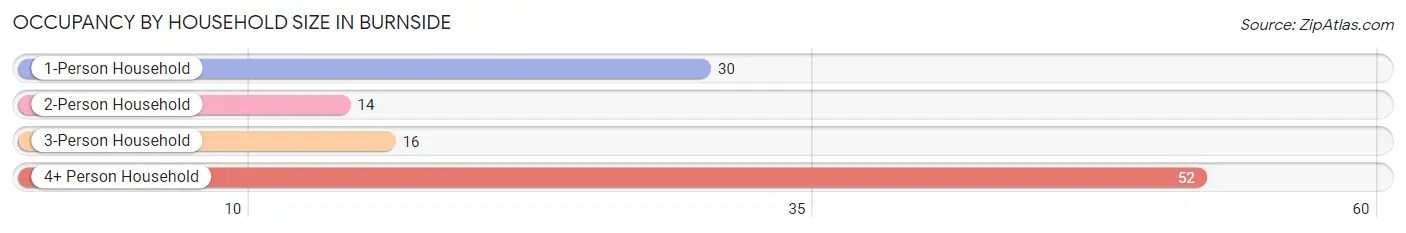
| Household Size | # Housing Units | % Housing Units |
| 1-Person Household | 30 | 26.8% |
| 2-Person Household | 14 | 12.5% |
| 3-Person Household | 16 | 14.3% |
| 4+ Person Household | 52 | 46.4% |
| Total Housing Units | 112 | 100.0% |
Occupancy by Ownership by Household Size in Burnside
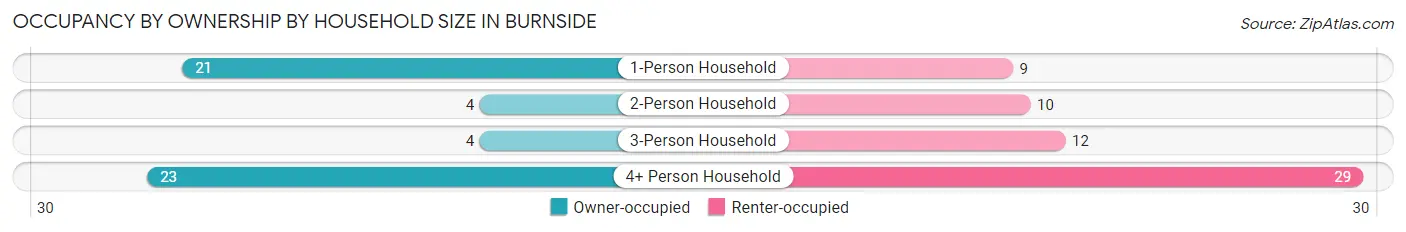
| Household Size | Owner-occupied | Renter-occupied |
| 1-Person Household | 21 (70.0%) | 9 (30.0%) |
| 2-Person Household | 4 (28.6%) | 10 (71.4%) |
| 3-Person Household | 4 (25.0%) | 12 (75.0%) |
| 4+ Person Household | 23 (44.2%) | 29 (55.8%) |
| Total Housing Units | 52 (46.4%) | 60 (53.6%) |
Occupancy by Educational Attainment in Burnside
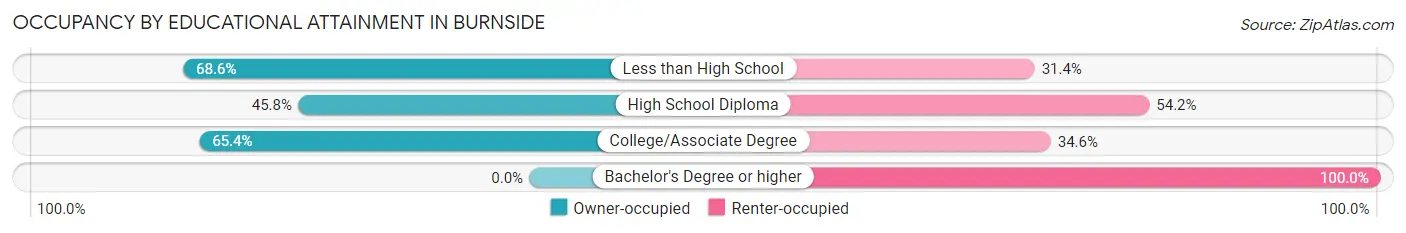
| Household Size | Owner-occupied | Renter-occupied |
| Less than High School | 24 (68.6%) | 11 (31.4%) |
| High School Diploma | 11 (45.8%) | 13 (54.2%) |
| College/Associate Degree | 17 (65.4%) | 9 (34.6%) |
| Bachelor's Degree or higher | 0 (0.0%) | 27 (100.0%) |
Occupancy by Age of Householder in Burnside
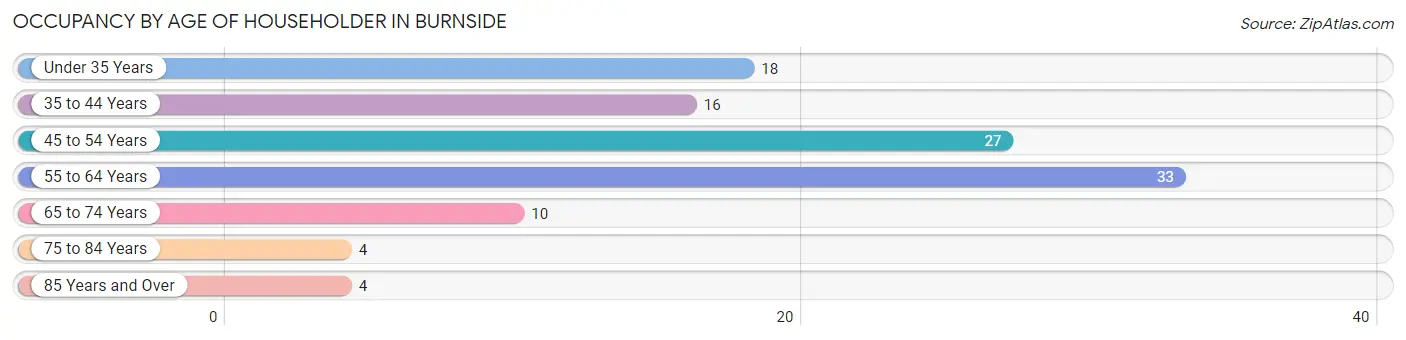
| Age Bracket | # Households | % Households |
| Under 35 Years | 18 | 16.1% |
| 35 to 44 Years | 16 | 14.3% |
| 45 to 54 Years | 27 | 24.1% |
| 55 to 64 Years | 33 | 29.5% |
| 65 to 74 Years | 10 | 8.9% |
| 75 to 84 Years | 4 | 3.6% |
| 85 Years and Over | 4 | 3.6% |
| Total | 112 | 100.0% |
Housing Finances in Burnside
Median Income by Occupancy in Burnside
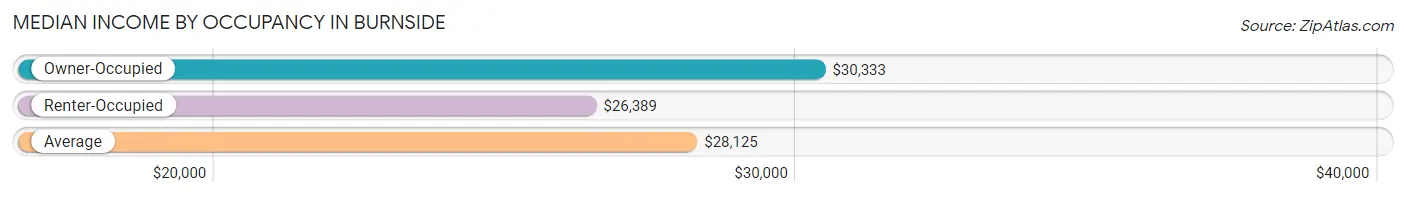
| Occupancy Type | # Households | Median Income |
| Owner-Occupied | 52 (46.4%) | $30,333 |
| Renter-Occupied | 60 (53.6%) | $26,389 |
| Average | 112 (100.0%) | $28,125 |
Occupancy by Householder Income Bracket in Burnside
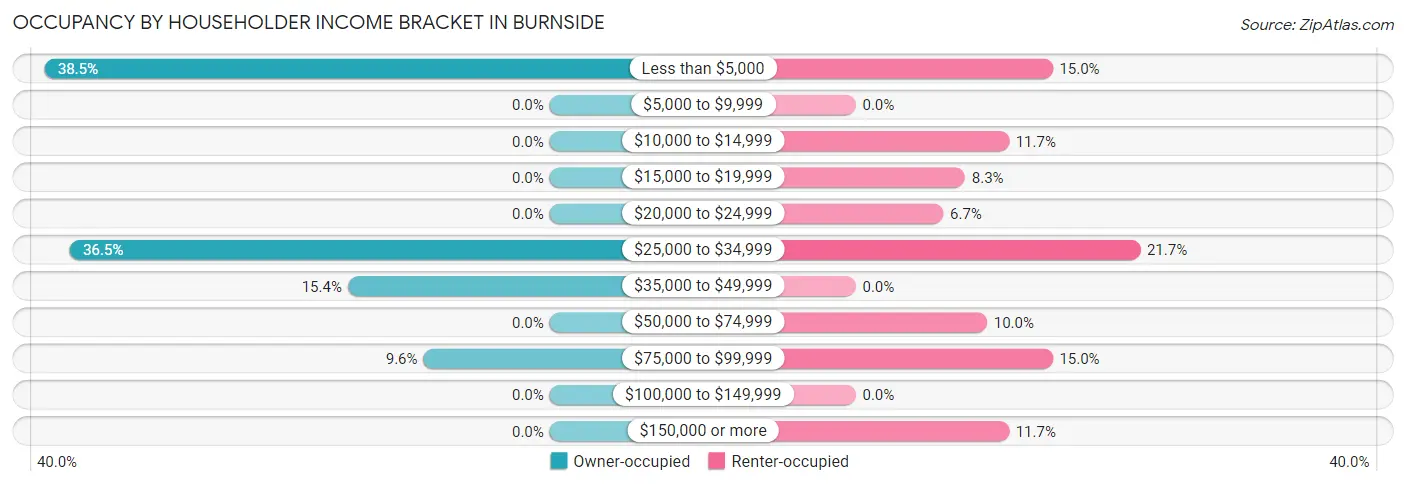
| Income Bracket | Owner-occupied | Renter-occupied |
| Less than $5,000 | 20 (38.5%) | 9 (15.0%) |
| $5,000 to $9,999 | 0 (0.0%) | 0 (0.0%) |
| $10,000 to $14,999 | 0 (0.0%) | 7 (11.7%) |
| $15,000 to $19,999 | 0 (0.0%) | 5 (8.3%) |
| $20,000 to $24,999 | 0 (0.0%) | 4 (6.7%) |
| $25,000 to $34,999 | 19 (36.5%) | 13 (21.7%) |
| $35,000 to $49,999 | 8 (15.4%) | 0 (0.0%) |
| $50,000 to $74,999 | 0 (0.0%) | 6 (10.0%) |
| $75,000 to $99,999 | 5 (9.6%) | 9 (15.0%) |
| $100,000 to $149,999 | 0 (0.0%) | 0 (0.0%) |
| $150,000 or more | 0 (0.0%) | 7 (11.7%) |
| Total | 52 (100.0%) | 60 (100.0%) |
Monthly Housing Cost Tiers in Burnside
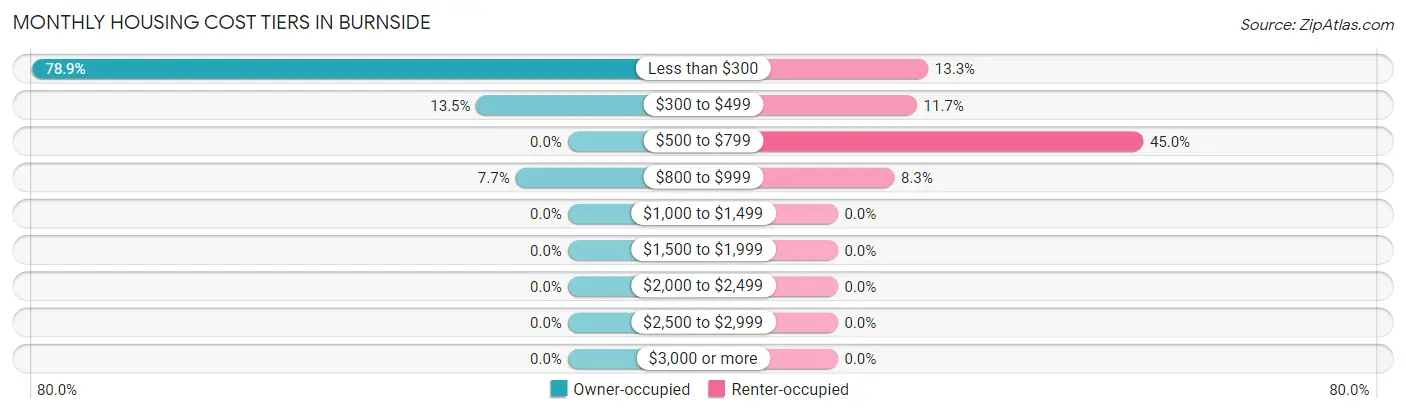
| Monthly Cost | Owner-occupied | Renter-occupied |
| Less than $300 | 41 (78.8%) | 8 (13.3%) |
| $300 to $499 | 7 (13.5%) | 7 (11.7%) |
| $500 to $799 | 0 (0.0%) | 27 (45.0%) |
| $800 to $999 | 4 (7.7%) | 5 (8.3%) |
| $1,000 to $1,499 | 0 (0.0%) | 0 (0.0%) |
| $1,500 to $1,999 | 0 (0.0%) | 0 (0.0%) |
| $2,000 to $2,499 | 0 (0.0%) | 0 (0.0%) |
| $2,500 to $2,999 | 0 (0.0%) | 0 (0.0%) |
| $3,000 or more | 0 (0.0%) | 0 (0.0%) |
| Total | 52 (100.0%) | 60 (100.0%) |
Physical Housing Characteristics in Burnside
Housing Structures in Burnside
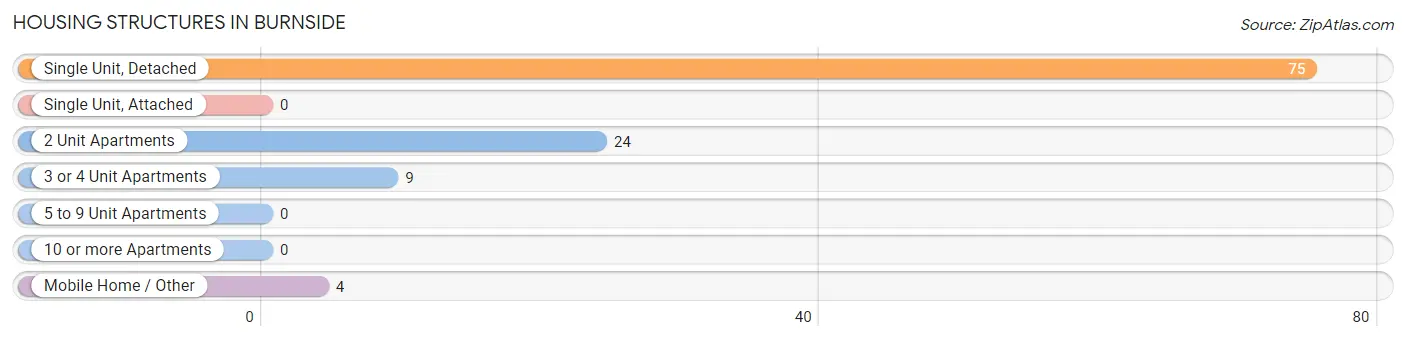
| Structure Type | # Housing Units | % Housing Units |
| Single Unit, Detached | 75 | 67.0% |
| Single Unit, Attached | 0 | 0.0% |
| 2 Unit Apartments | 24 | 21.4% |
| 3 or 4 Unit Apartments | 9 | 8.0% |
| 5 to 9 Unit Apartments | 0 | 0.0% |
| 10 or more Apartments | 0 | 0.0% |
| Mobile Home / Other | 4 | 3.6% |
| Total | 112 | 100.0% |
Housing Structures by Occupancy in Burnside
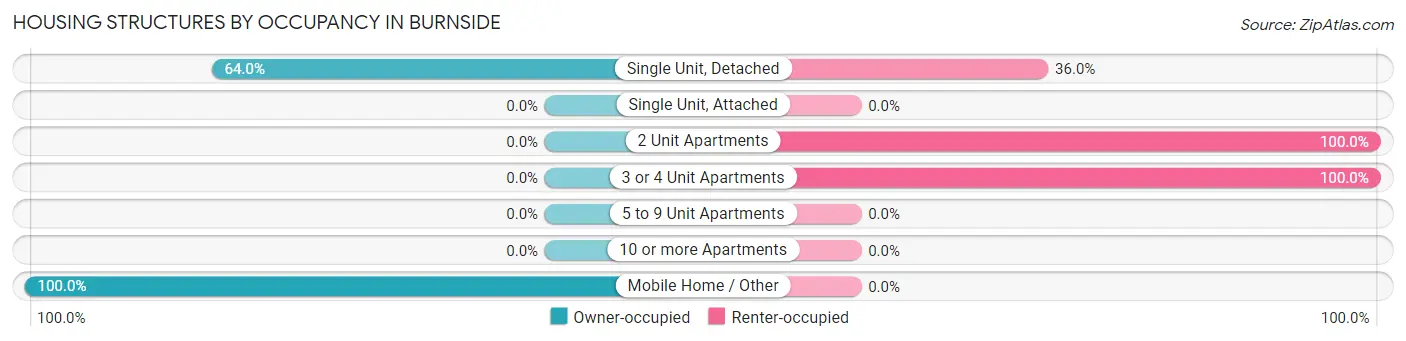
| Structure Type | Owner-occupied | Renter-occupied |
| Single Unit, Detached | 48 (64.0%) | 27 (36.0%) |
| Single Unit, Attached | 0 (0.0%) | 0 (0.0%) |
| 2 Unit Apartments | 0 (0.0%) | 24 (100.0%) |
| 3 or 4 Unit Apartments | 0 (0.0%) | 9 (100.0%) |
| 5 to 9 Unit Apartments | 0 (0.0%) | 0 (0.0%) |
| 10 or more Apartments | 0 (0.0%) | 0 (0.0%) |
| Mobile Home / Other | 4 (100.0%) | 0 (0.0%) |
| Total | 52 (46.4%) | 60 (53.6%) |
Housing Structures by Number of Rooms in Burnside
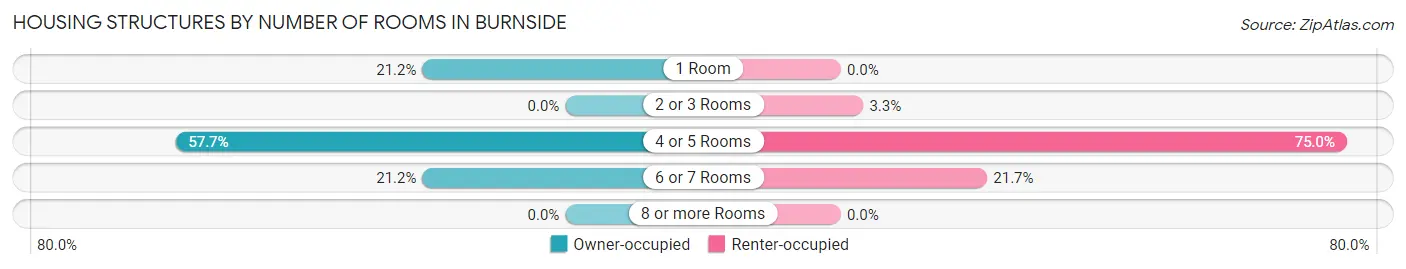
| Number of Rooms | Owner-occupied | Renter-occupied |
| 1 Room | 11 (21.1%) | 0 (0.0%) |
| 2 or 3 Rooms | 0 (0.0%) | 2 (3.3%) |
| 4 or 5 Rooms | 30 (57.7%) | 45 (75.0%) |
| 6 or 7 Rooms | 11 (21.1%) | 13 (21.7%) |
| 8 or more Rooms | 0 (0.0%) | 0 (0.0%) |
| Total | 52 (100.0%) | 60 (100.0%) |
Housing Structure by Heating Type in Burnside
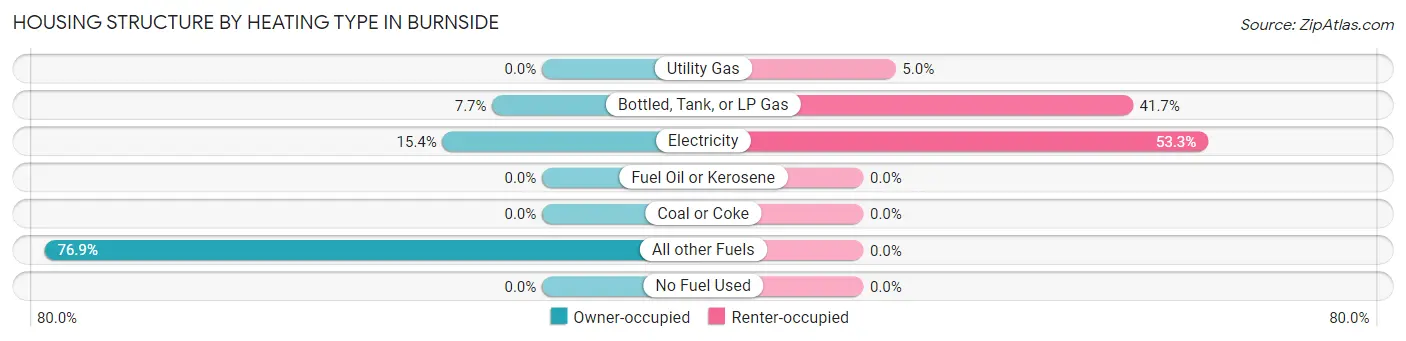
| Heating Type | Owner-occupied | Renter-occupied |
| Utility Gas | 0 (0.0%) | 3 (5.0%) |
| Bottled, Tank, or LP Gas | 4 (7.7%) | 25 (41.7%) |
| Electricity | 8 (15.4%) | 32 (53.3%) |
| Fuel Oil or Kerosene | 0 (0.0%) | 0 (0.0%) |
| Coal or Coke | 0 (0.0%) | 0 (0.0%) |
| All other Fuels | 40 (76.9%) | 0 (0.0%) |
| No Fuel Used | 0 (0.0%) | 0 (0.0%) |
| Total | 52 (100.0%) | 60 (100.0%) |
Household Vehicle Usage in Burnside
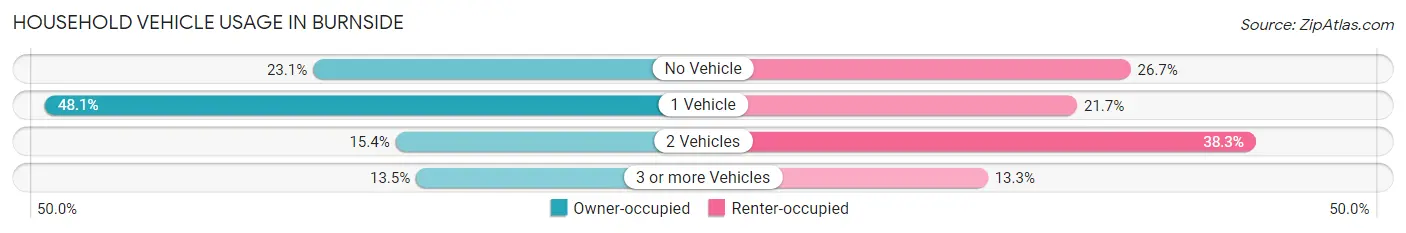
| Vehicles per Household | Owner-occupied | Renter-occupied |
| No Vehicle | 12 (23.1%) | 16 (26.7%) |
| 1 Vehicle | 25 (48.1%) | 13 (21.7%) |
| 2 Vehicles | 8 (15.4%) | 23 (38.3%) |
| 3 or more Vehicles | 7 (13.5%) | 8 (13.3%) |
| Total | 52 (100.0%) | 60 (100.0%) |
Real Estate & Mortgages in Burnside
Real Estate and Mortgage Overview in Burnside
| Characteristic | Without Mortgage | With Mortgage |
| Housing Units | 52 | 0 |
| Median Property Value | - | - |
| Median Household Income | $30,333 | $0 |
| Monthly Housing Costs | $150 | $0 |
| Real Estate Taxes | - | - |
Property Value by Mortgage Status in Burnside
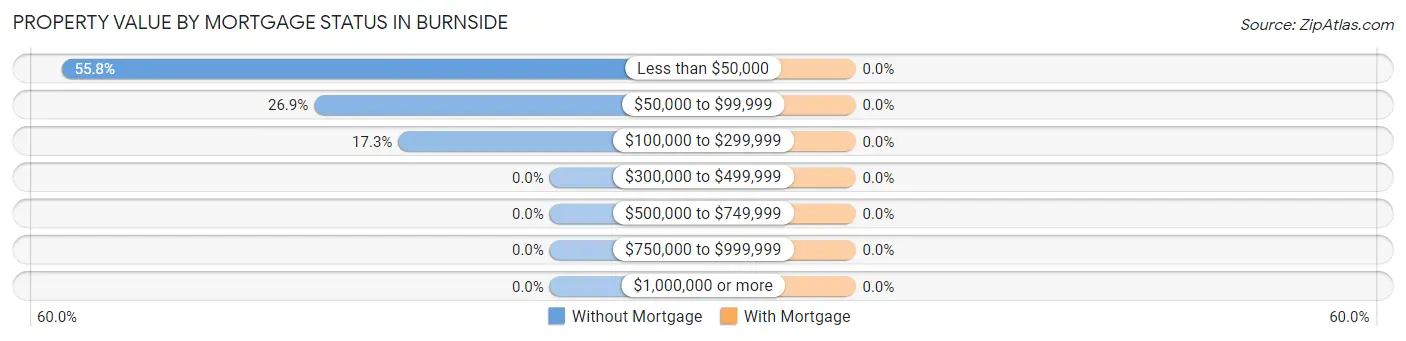
| Property Value | Without Mortgage | With Mortgage |
| Less than $50,000 | 29 (55.8%) | 0 (0.0%) |
| $50,000 to $99,999 | 14 (26.9%) | 0 (0.0%) |
| $100,000 to $299,999 | 9 (17.3%) | 0 (0.0%) |
| $300,000 to $499,999 | 0 (0.0%) | 0 (0.0%) |
| $500,000 to $749,999 | 0 (0.0%) | 0 (0.0%) |
| $750,000 to $999,999 | 0 (0.0%) | 0 (0.0%) |
| $1,000,000 or more | 0 (0.0%) | 0 (0.0%) |
| Total | 52 (100.0%) | 0 (0.0%) |
Household Income by Mortgage Status in Burnside
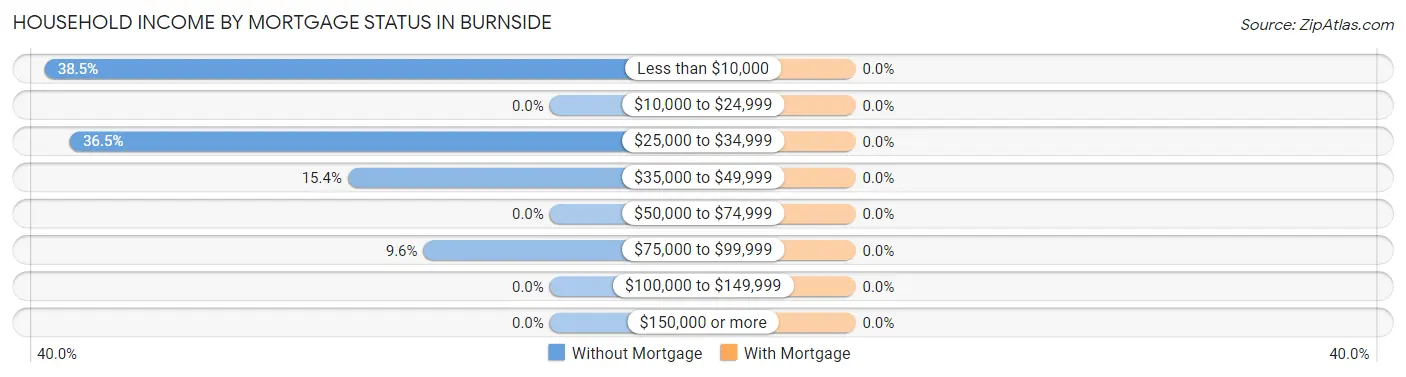
| Household Income | Without Mortgage | With Mortgage |
| Less than $10,000 | 20 (38.5%) | 0 (0.0%) |
| $10,000 to $24,999 | 0 (0.0%) | 0 (0.0%) |
| $25,000 to $34,999 | 19 (36.5%) | 0 (0.0%) |
| $35,000 to $49,999 | 8 (15.4%) | 0 (0.0%) |
| $50,000 to $74,999 | 0 (0.0%) | 0 (0.0%) |
| $75,000 to $99,999 | 5 (9.6%) | 0 (0.0%) |
| $100,000 to $149,999 | 0 (0.0%) | 0 (0.0%) |
| $150,000 or more | 0 (0.0%) | 0 (0.0%) |
| Total | 52 (100.0%) | 0 (0.0%) |
Property Value to Household Income Ratio in Burnside
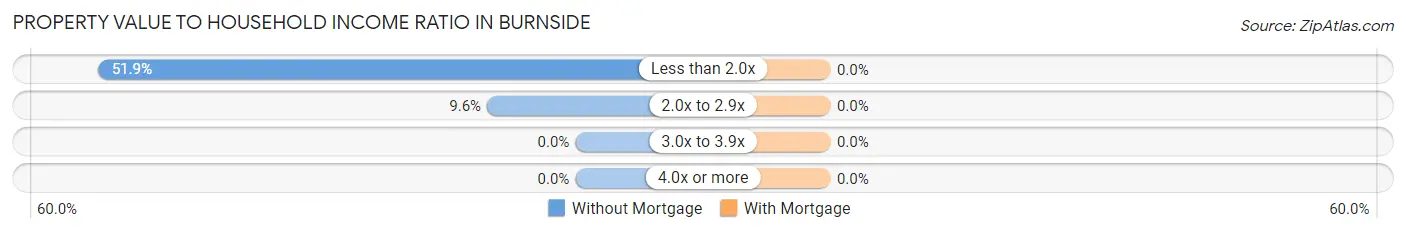
| Value-to-Income Ratio | Without Mortgage | With Mortgage |
| Less than 2.0x | 27 (51.9%) | 0 (0.0%) |
| 2.0x to 2.9x | 5 (9.6%) | 0 (0.0%) |
| 3.0x to 3.9x | 0 (0.0%) | 0 (0.0%) |
| 4.0x or more | 0 (0.0%) | 0 (0.0%) |
| Total | 52 (100.0%) | 0 (0.0%) |
Real Estate Taxes by Mortgage Status in Burnside
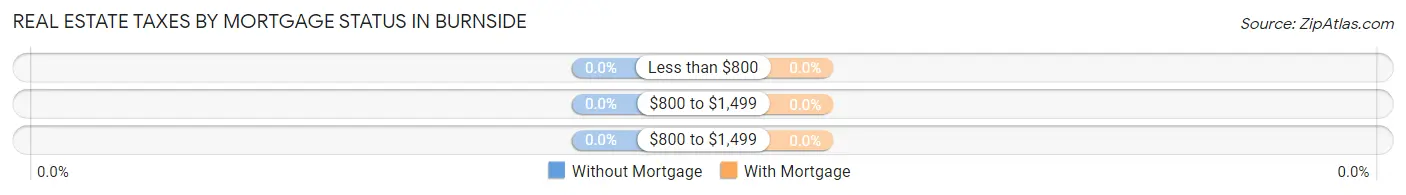
| Property Taxes | Without Mortgage | With Mortgage |
| Less than $800 | 0 (0.0%) | 0 (0.0%) |
| $800 to $1,499 | 0 (0.0%) | 0 (0.0%) |
| $800 to $1,499 | 0 (0.0%) | 0 (0.0%) |
| Total | 52 (100.0%) | 0 (0.0%) |
Health & Disability in Burnside
Health Insurance Coverage by Age in Burnside
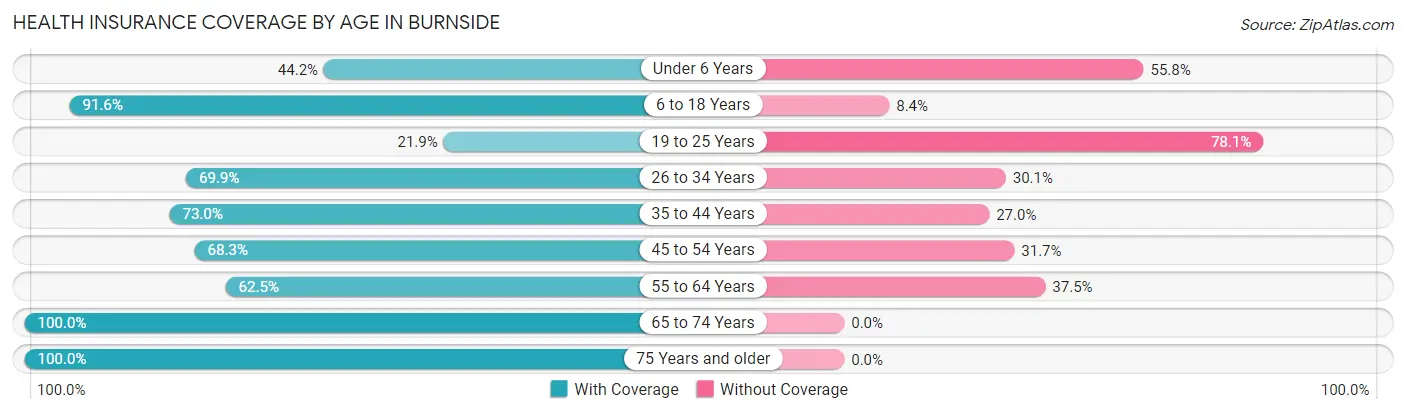
| Age Bracket | With Coverage | Without Coverage |
| Under 6 Years | 19 (44.2%) | 24 (55.8%) |
| 6 to 18 Years | 131 (91.6%) | 12 (8.4%) |
| 19 to 25 Years | 14 (21.9%) | 50 (78.1%) |
| 26 to 34 Years | 65 (69.9%) | 28 (30.1%) |
| 35 to 44 Years | 27 (73.0%) | 10 (27.0%) |
| 45 to 54 Years | 28 (68.3%) | 13 (31.7%) |
| 55 to 64 Years | 35 (62.5%) | 21 (37.5%) |
| 65 to 74 Years | 14 (100.0%) | 0 (0.0%) |
| 75 Years and older | 14 (100.0%) | 0 (0.0%) |
| Total | 347 (68.7%) | 158 (31.3%) |
Health Insurance Coverage by Citizenship Status in Burnside
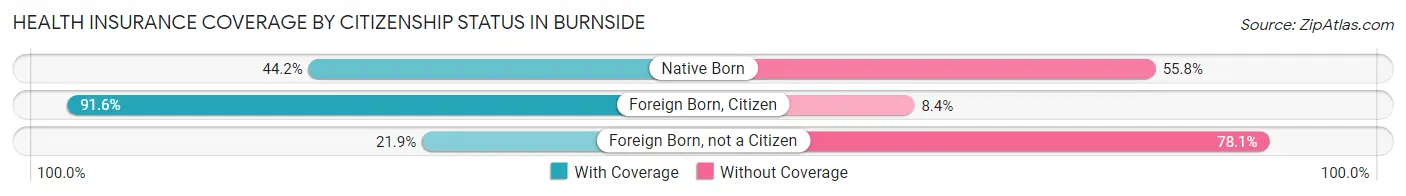
| Citizenship Status | With Coverage | Without Coverage |
| Native Born | 19 (44.2%) | 24 (55.8%) |
| Foreign Born, Citizen | 131 (91.6%) | 12 (8.4%) |
| Foreign Born, not a Citizen | 14 (21.9%) | 50 (78.1%) |
Health Insurance Coverage by Household Income in Burnside
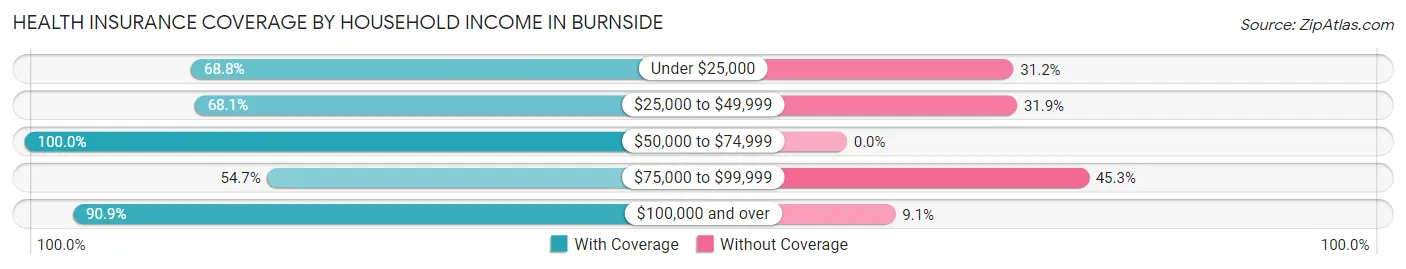
| Household Income | With Coverage | Without Coverage |
| Under $25,000 | 119 (68.8%) | 54 (31.2%) |
| $25,000 to $49,999 | 141 (68.1%) | 66 (31.9%) |
| $50,000 to $74,999 | 6 (100.0%) | 0 (0.0%) |
| $75,000 to $99,999 | 41 (54.7%) | 34 (45.3%) |
| $100,000 and over | 40 (90.9%) | 4 (9.1%) |
Public vs Private Health Insurance Coverage by Age in Burnside
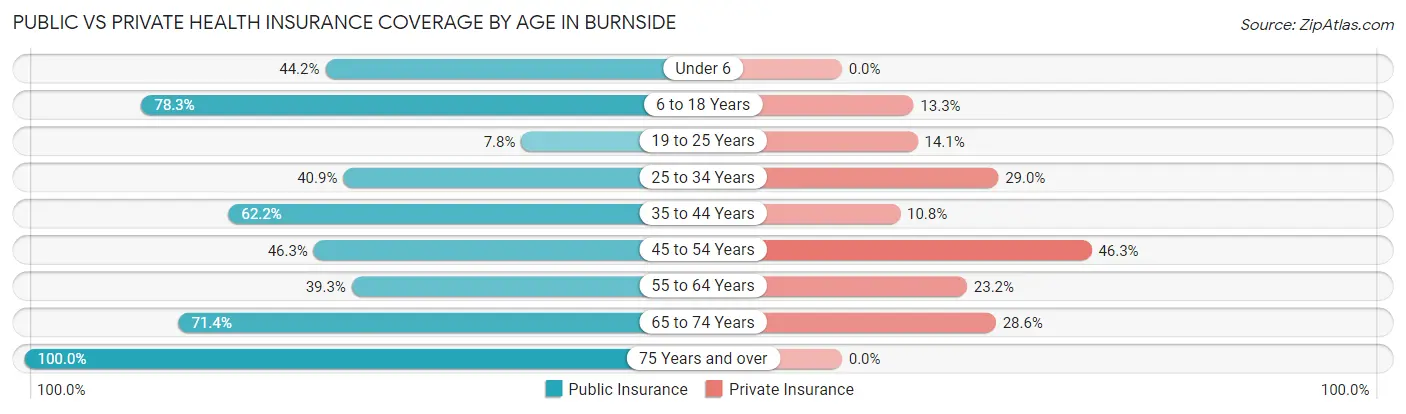
| Age Bracket | Public Insurance | Private Insurance |
| Under 6 | 19 (44.2%) | 0 (0.0%) |
| 6 to 18 Years | 112 (78.3%) | 19 (13.3%) |
| 19 to 25 Years | 5 (7.8%) | 9 (14.1%) |
| 25 to 34 Years | 38 (40.9%) | 27 (29.0%) |
| 35 to 44 Years | 23 (62.2%) | 4 (10.8%) |
| 45 to 54 Years | 19 (46.3%) | 19 (46.3%) |
| 55 to 64 Years | 22 (39.3%) | 13 (23.2%) |
| 65 to 74 Years | 10 (71.4%) | 4 (28.6%) |
| 75 Years and over | 14 (100.0%) | 0 (0.0%) |
| Total | 262 (51.9%) | 95 (18.8%) |
Disability Status by Sex by Age in Burnside
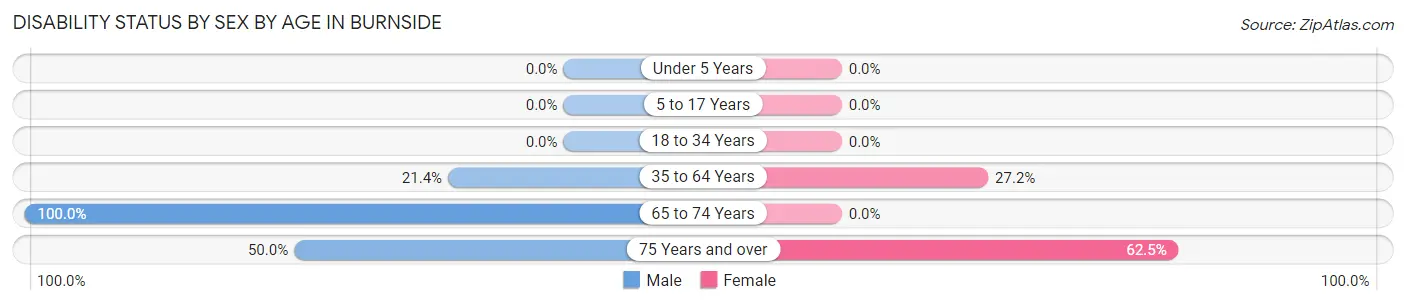
| Age Bracket | Male | Female |
| Under 5 Years | 0 (0.0%) | 0 (0.0%) |
| 5 to 17 Years | 0 (0.0%) | 0 (0.0%) |
| 18 to 34 Years | 0 (0.0%) | 0 (0.0%) |
| 35 to 64 Years | 9 (21.4%) | 25 (27.2%) |
| 65 to 74 Years | 4 (100.0%) | 0 (0.0%) |
| 75 Years and over | 3 (50.0%) | 5 (62.5%) |
Disability Class by Sex by Age in Burnside
Disability Class: Hearing Difficulty
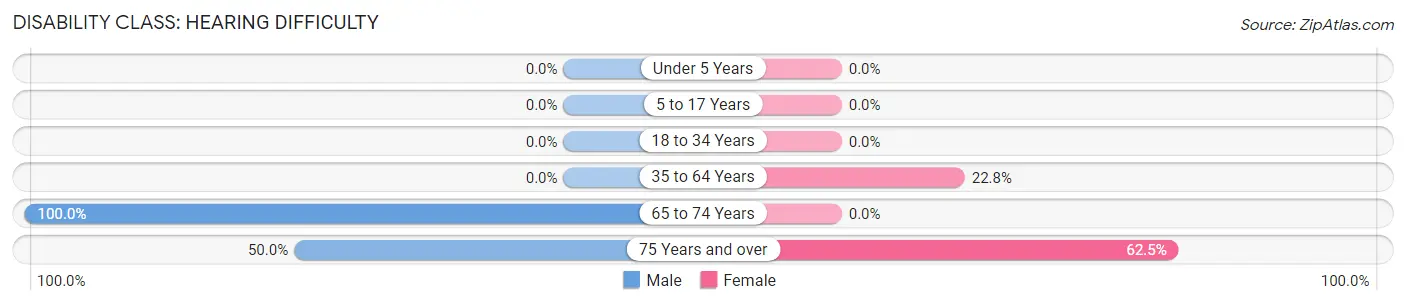
| Age Bracket | Male | Female |
| Under 5 Years | 0 (0.0%) | 0 (0.0%) |
| 5 to 17 Years | 0 (0.0%) | 0 (0.0%) |
| 18 to 34 Years | 0 (0.0%) | 0 (0.0%) |
| 35 to 64 Years | 0 (0.0%) | 21 (22.8%) |
| 65 to 74 Years | 4 (100.0%) | 0 (0.0%) |
| 75 Years and over | 3 (50.0%) | 5 (62.5%) |
Disability Class: Vision Difficulty
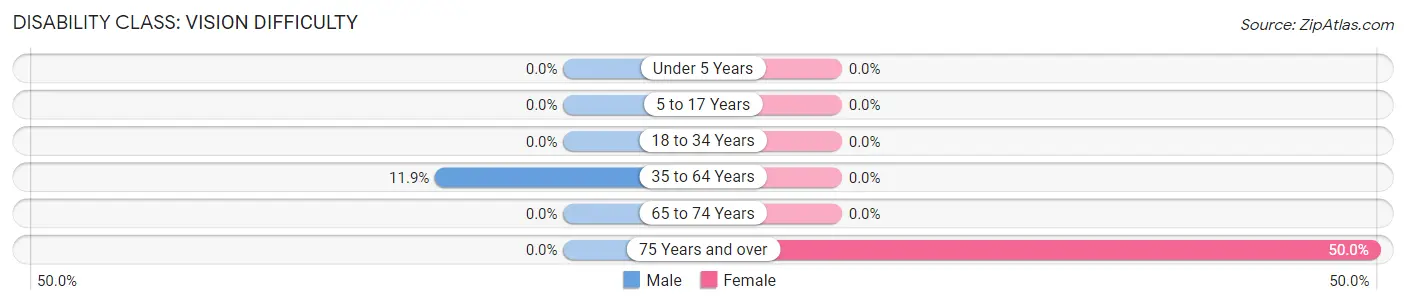
| Age Bracket | Male | Female |
| Under 5 Years | 0 (0.0%) | 0 (0.0%) |
| 5 to 17 Years | 0 (0.0%) | 0 (0.0%) |
| 18 to 34 Years | 0 (0.0%) | 0 (0.0%) |
| 35 to 64 Years | 5 (11.9%) | 0 (0.0%) |
| 65 to 74 Years | 0 (0.0%) | 0 (0.0%) |
| 75 Years and over | 0 (0.0%) | 4 (50.0%) |
Disability Class: Cognitive Difficulty
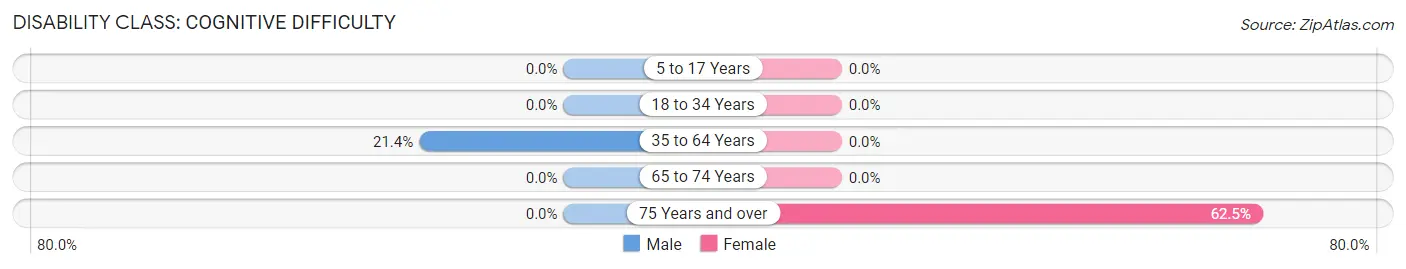
| Age Bracket | Male | Female |
| 5 to 17 Years | 0 (0.0%) | 0 (0.0%) |
| 18 to 34 Years | 0 (0.0%) | 0 (0.0%) |
| 35 to 64 Years | 9 (21.4%) | 0 (0.0%) |
| 65 to 74 Years | 0 (0.0%) | 0 (0.0%) |
| 75 Years and over | 0 (0.0%) | 5 (62.5%) |
Disability Class: Ambulatory Difficulty
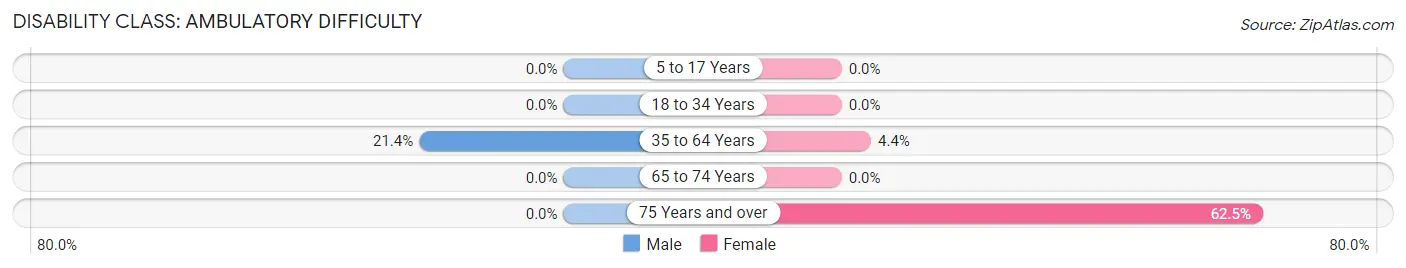
| Age Bracket | Male | Female |
| 5 to 17 Years | 0 (0.0%) | 0 (0.0%) |
| 18 to 34 Years | 0 (0.0%) | 0 (0.0%) |
| 35 to 64 Years | 9 (21.4%) | 4 (4.3%) |
| 65 to 74 Years | 0 (0.0%) | 0 (0.0%) |
| 75 Years and over | 0 (0.0%) | 5 (62.5%) |
Disability Class: Self-Care Difficulty
| Age Bracket | Male | Female |
| 5 to 17 Years | 0 (0.0%) | 0 (0.0%) |
| 18 to 34 Years | 0 (0.0%) | 0 (0.0%) |
| 35 to 64 Years | 0 (0.0%) | 0 (0.0%) |
| 65 to 74 Years | 0 (0.0%) | 0 (0.0%) |
| 75 Years and over | 0 (0.0%) | 0 (0.0%) |
Technology Access in Burnside
Computing Device Access in Burnside
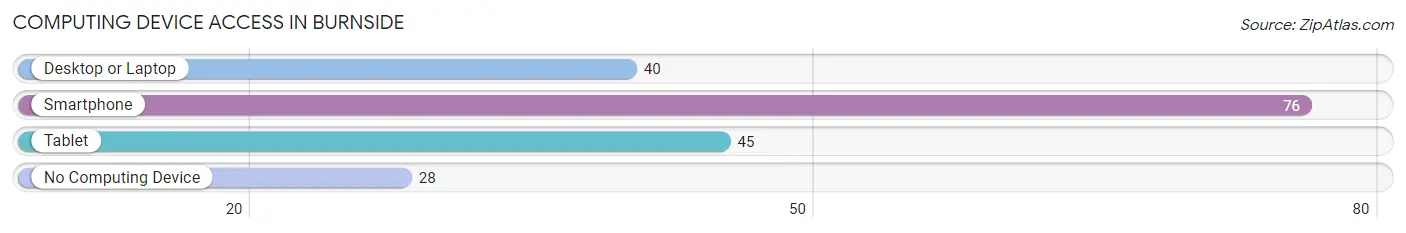
| Device Type | # Households | % Households |
| Desktop or Laptop | 40 | 35.7% |
| Smartphone | 76 | 67.9% |
| Tablet | 45 | 40.2% |
| No Computing Device | 28 | 25.0% |
| Total | 112 | 100.0% |
Internet Access in Burnside
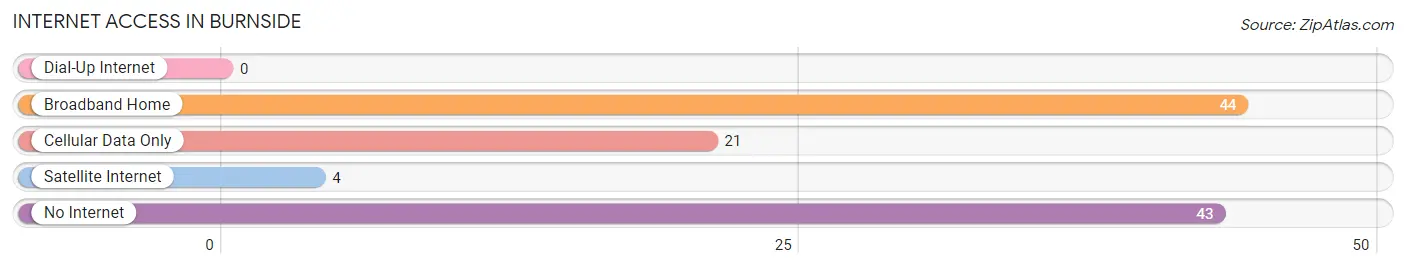
| Internet Type | # Households | % Households |
| Dial-Up Internet | 0 | 0.0% |
| Broadband Home | 44 | 39.3% |
| Cellular Data Only | 21 | 18.8% |
| Satellite Internet | 4 | 3.6% |
| No Internet | 43 | 38.4% |
| Total | 112 | 100.0% |
Burnside Summary
History
Burnside is a small unincorporated community located in Yavapai County, Arizona. It is situated in the Bradshaw Mountains, approximately 20 miles south of Prescott. The area was first settled in the late 1800s by ranchers and miners. The town was named after a local rancher, William Burnside, who owned a large ranch in the area.
The town was officially established in the early 1900s and was home to a post office, a general store, a school, and a few other businesses. The town was a popular stop for travelers and miners, and it was also a popular destination for hunting and fishing.
In the early 1900s, the town was home to a large copper mine, which provided employment for many of the town's residents. The mine closed in the 1930s, and the town's population began to decline.
In the 1950s, the town was home to a large sawmill, which provided employment for many of the town's residents. The sawmill closed in the 1970s, and the town's population began to decline again.
Today, Burnside is a small, quiet community with a population of approximately 200 people. The town is home to a few businesses, including a general store, a post office, and a few restaurants.
Geography
Burnside is located in the Bradshaw Mountains, approximately 20 miles south of Prescott. The town is situated at an elevation of 5,000 feet, and the surrounding area is characterized by rolling hills and pine forests. The town is located in a semi-arid climate, with hot summers and cold winters.
The town is located near several lakes, including Lynx Lake, Watson Lake, and Granite Basin Lake. These lakes provide recreational opportunities for fishing, boating, and swimming.
Economy
The economy of Burnside is largely based on tourism and recreation. The town is a popular destination for hikers, campers, and hunters, and it is also a popular destination for fishing and boating.
The town is also home to a few small businesses, including a general store, a post office, and a few restaurants.
Demographics
As of the 2010 census, the population of Burnside was 200 people. The racial makeup of the town was 95.5% White, 0.5% Native American, 0.5% Asian, and 3.5% from other races.
The median household income in Burnside was $37,500, and the median family income was $41,250. The per capita income in Burnside was $17,500. Approximately 10.5% of the population was below the poverty line.
Common Questions
What is Per Capita Income in Burnside?
Per Capita income in Burnside is $12,569.
What is the Median Family Income in Burnside?
Median Family Income in Burnside is $28,438.
What is the Median Household income in Burnside?
Median Household Income in Burnside is $28,125.
What is Income or Wage Gap in Burnside?
Income or Wage Gap in Burnside is 38.4%.
Women in Burnside earn 61.6 cents for every dollar earned by a man.
What is Inequality or Gini Index in Burnside?
Inequality or Gini Index in Burnside is 0.61.
What is the Total Population of Burnside?
Total Population of Burnside is 505.
What is the Total Male Population of Burnside?
Total Male Population of Burnside is 177.
What is the Total Female Population of Burnside?
Total Female Population of Burnside is 328.
What is the Ratio of Males per 100 Females in Burnside?
There are 53.96 Males per 100 Females in Burnside.
What is the Ratio of Females per 100 Males in Burnside?
There are 185.31 Females per 100 Males in Burnside.
What is the Median Population Age in Burnside?
Median Population Age in Burnside is 26.3 Years.
What is the Average Family Size in Burnside
Average Family Size in Burnside is 5.7 People.
What is the Average Household Size in Burnside
Average Household Size in Burnside is 4.5 People.
How Large is the Labor Force in Burnside?
There are 145 People in the Labor Forcein in Burnside.
What is the Percentage of People in the Labor Force in Burnside?
40.7% of People are in the Labor Force in Burnside.