Red Mesa, AZ Map & Demographics
Red Mesa Map
Red Mesa Overview
$23,064
PER CAPITA INCOME
$69,934
AVG FAMILY INCOME
$69,659
AVG HOUSEHOLD INCOME
32.9%
WAGE / INCOME GAP [ % ]
67.1¢/ $1
WAGE / INCOME GAP [ $ ]
0.38
INEQUALITY / GINI INDEX
494
TOTAL POPULATION
260
MALE POPULATION
234
FEMALE POPULATION
111.11
MALES / 100 FEMALES
90.00
FEMALES / 100 MALES
39.6
MEDIAN AGE
4.0
AVG FAMILY SIZE
3.6
AVG HOUSEHOLD SIZE
214
LABOR FORCE [ PEOPLE ]
55.3%
PERCENT IN LABOR FORCE
14.5%
UNEMPLOYMENT RATE
Income in Red Mesa
Income Overview in Red Mesa
Per Capita Income in Red Mesa is $23,064, while median incomes of families and households are $69,934 and $69,659 respectively.
| Characteristic | Number | Measure |
| Per Capita Income | 494 | $23,064 |
| Median Family Income | 111 | $69,934 |
| Mean Family Income | 111 | $80,835 |
| Median Household Income | 138 | $69,659 |
| Mean Household Income | 138 | $78,624 |
| Income Deficit | 111 | $0 |
| Wage / Income Gap (%) | 494 | 32.86% |
| Wage / Income Gap ($) | 494 | 67.14¢ per $1 |
| Gini / Inequality Index | 494 | 0.38 |
Earnings by Sex in Red Mesa
Average Earnings in Red Mesa are $45,096, $35,563 for men and $52,969 for women, a difference of 32.9%.
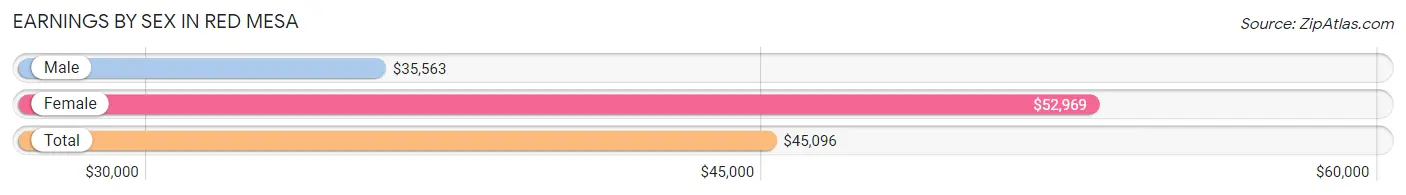
| Sex | Number | Average Earnings |
| Male | 89 (44.7%) | $35,563 |
| Female | 110 (55.3%) | $52,969 |
| Total | 199 (100.0%) | $45,096 |
Earnings by Sex by Income Bracket in Red Mesa
The most common earnings brackets in Red Mesa are $5,000 to $7,499 for men (21 | 23.6%) and $75,000 to $99,999 for women (22 | 20.0%).
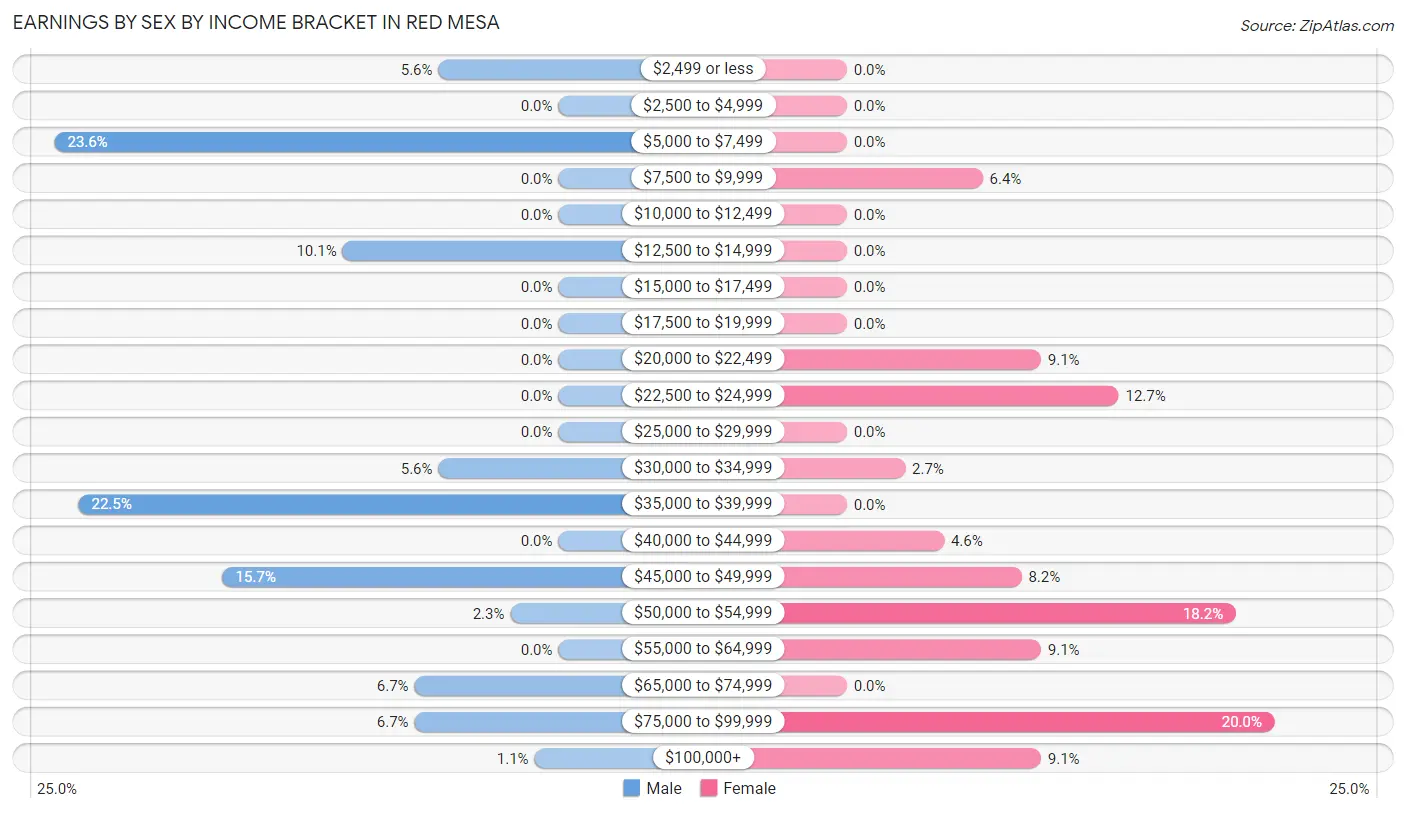
| Income | Male | Female |
| $2,499 or less | 5 (5.6%) | 0 (0.0%) |
| $2,500 to $4,999 | 0 (0.0%) | 0 (0.0%) |
| $5,000 to $7,499 | 21 (23.6%) | 0 (0.0%) |
| $7,500 to $9,999 | 0 (0.0%) | 7 (6.4%) |
| $10,000 to $12,499 | 0 (0.0%) | 0 (0.0%) |
| $12,500 to $14,999 | 9 (10.1%) | 0 (0.0%) |
| $15,000 to $17,499 | 0 (0.0%) | 0 (0.0%) |
| $17,500 to $19,999 | 0 (0.0%) | 0 (0.0%) |
| $20,000 to $22,499 | 0 (0.0%) | 10 (9.1%) |
| $22,500 to $24,999 | 0 (0.0%) | 14 (12.7%) |
| $25,000 to $29,999 | 0 (0.0%) | 0 (0.0%) |
| $30,000 to $34,999 | 5 (5.6%) | 3 (2.7%) |
| $35,000 to $39,999 | 20 (22.5%) | 0 (0.0%) |
| $40,000 to $44,999 | 0 (0.0%) | 5 (4.5%) |
| $45,000 to $49,999 | 14 (15.7%) | 9 (8.2%) |
| $50,000 to $54,999 | 2 (2.2%) | 20 (18.2%) |
| $55,000 to $64,999 | 0 (0.0%) | 10 (9.1%) |
| $65,000 to $74,999 | 6 (6.7%) | 0 (0.0%) |
| $75,000 to $99,999 | 6 (6.7%) | 22 (20.0%) |
| $100,000+ | 1 (1.1%) | 10 (9.1%) |
| Total | 89 (100.0%) | 110 (100.0%) |
Earnings by Sex by Educational Attainment in Red Mesa
Average earnings in Red Mesa are $35,563 for men and $52,969 for women, a difference of 32.9%. Men with an educational attainment of graduate degree enjoy the highest average annual earnings of $69,375, while those with high school diploma education earn the least with $45,313. Women with an educational attainment of graduate degree earn the most with the average annual earnings of $92,500, while those with bachelor's degree education have the smallest earnings of $24,107.
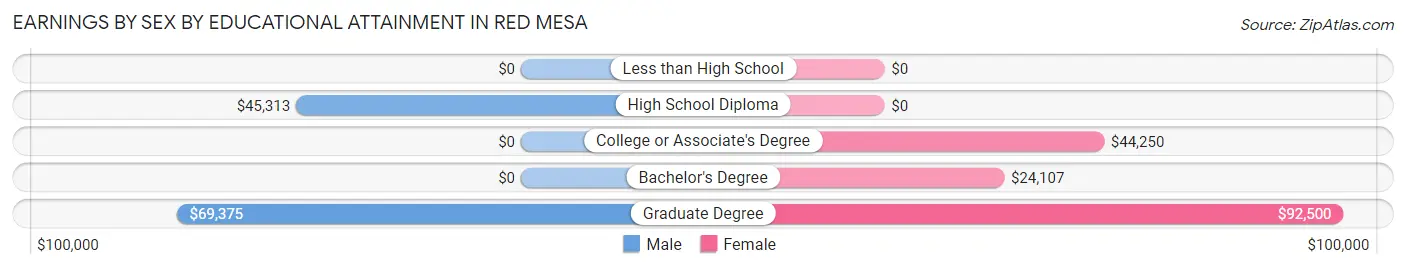
| Educational Attainment | Male Income | Female Income |
| Less than High School | - | - |
| High School Diploma | $45,313 | $0 |
| College or Associate's Degree | - | - |
| Bachelor's Degree | - | - |
| Graduate Degree | $69,375 | $92,500 |
| Total | $35,563 | $52,969 |
Family Income in Red Mesa
Family Income Brackets in Red Mesa
According to the Red Mesa family income data, there are 45 families falling into the $50,000 to $74,999 income range, which is the most common income bracket and makes up 40.5% of all families.
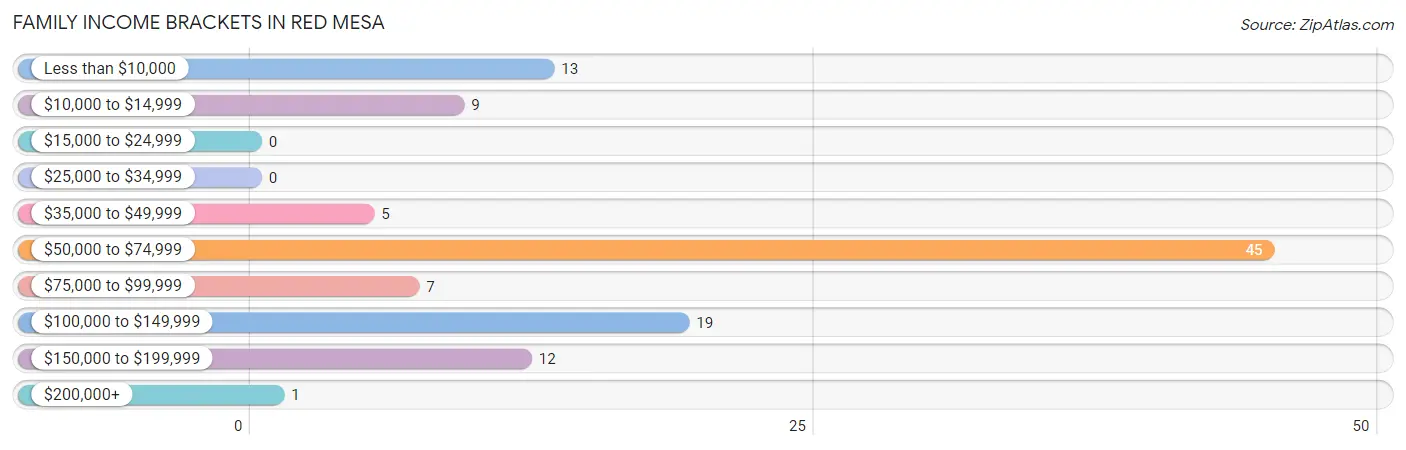
| Income Bracket | # Families | % Families |
| Less than $10,000 | 13 | 11.7% |
| $10,000 to $14,999 | 9 | 8.1% |
| $15,000 to $24,999 | 0 | 0.0% |
| $25,000 to $34,999 | 0 | 0.0% |
| $35,000 to $49,999 | 5 | 4.5% |
| $50,000 to $74,999 | 45 | 40.5% |
| $75,000 to $99,999 | 7 | 6.3% |
| $100,000 to $149,999 | 19 | 17.1% |
| $150,000 to $199,999 | 12 | 10.8% |
| $200,000+ | 1 | 0.9% |
Family Income by Famaliy Size in Red Mesa
2-person families (18 | 16.2%) account for the highest median family income in Red Mesa with $132,500 per family, while 2-person families (18 | 16.2%) have the highest median income of $66,250 per family member.
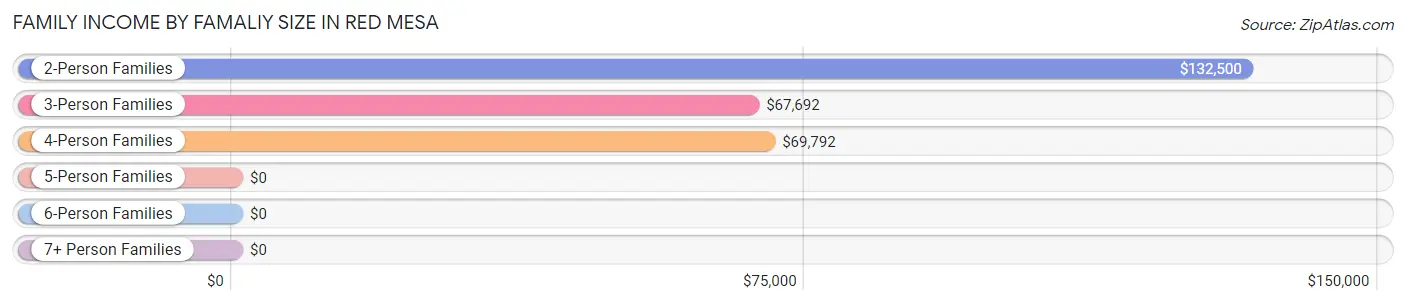
| Income Bracket | # Families | Median Income |
| 2-Person Families | 18 (16.2%) | $132,500 |
| 3-Person Families | 58 (52.2%) | $67,692 |
| 4-Person Families | 19 (17.1%) | $69,792 |
| 5-Person Families | 0 (0.0%) | $0 |
| 6-Person Families | 16 (14.4%) | $0 |
| 7+ Person Families | 0 (0.0%) | $0 |
| Total | 111 (100.0%) | $69,934 |
Family Income by Number of Earners in Red Mesa
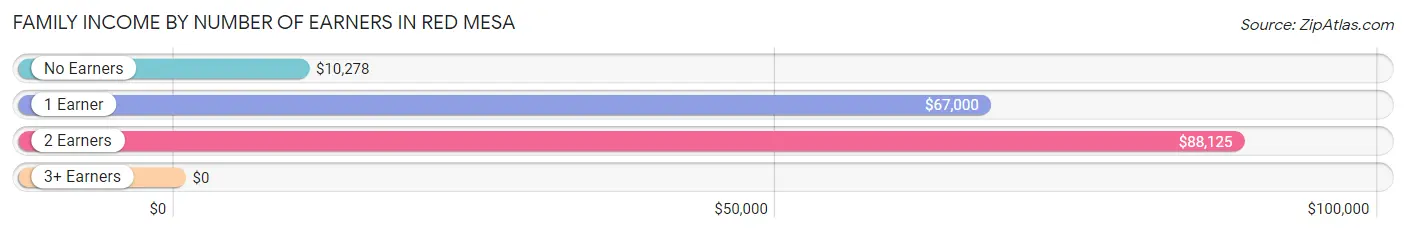
| Number of Earners | # Families | Median Income |
| No Earners | 18 (16.2%) | $10,278 |
| 1 Earner | 36 (32.4%) | $67,000 |
| 2 Earners | 34 (30.6%) | $88,125 |
| 3+ Earners | 23 (20.7%) | $0 |
| Total | 111 (100.0%) | $69,934 |
Household Income in Red Mesa
Household Income Brackets in Red Mesa
With 48 households falling in the category, the $50,000 to $74,999 income range is the most frequent in Red Mesa, accounting for 34.8% of all households.
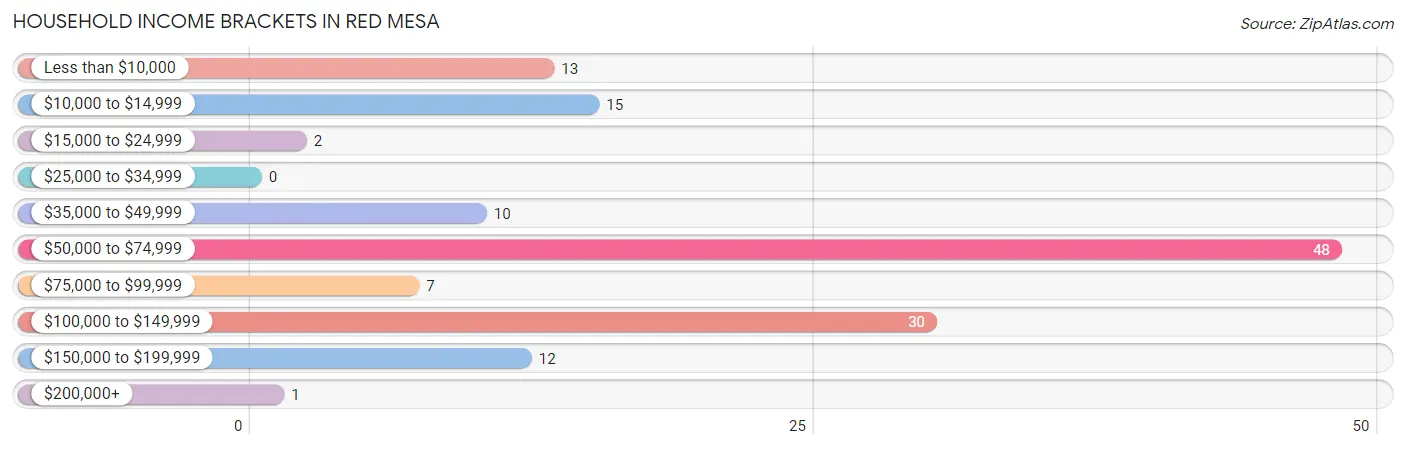
| Income Bracket | # Households | % Households |
| Less than $10,000 | 13 | 9.4% |
| $10,000 to $14,999 | 15 | 10.9% |
| $15,000 to $24,999 | 2 | 1.4% |
| $25,000 to $34,999 | 0 | 0.0% |
| $35,000 to $49,999 | 10 | 7.2% |
| $50,000 to $74,999 | 48 | 34.8% |
| $75,000 to $99,999 | 7 | 5.1% |
| $100,000 to $149,999 | 30 | 21.7% |
| $150,000 to $199,999 | 12 | 8.7% |
| $200,000+ | 1 | 0.7% |
Household Income by Householder Age in Red Mesa
The median household income in Red Mesa is $69,659, with the highest median household income of $101,875 found in the 45 to 64 years age bracket for the primary householder. A total of 71 households (51.4%) fall into this category.
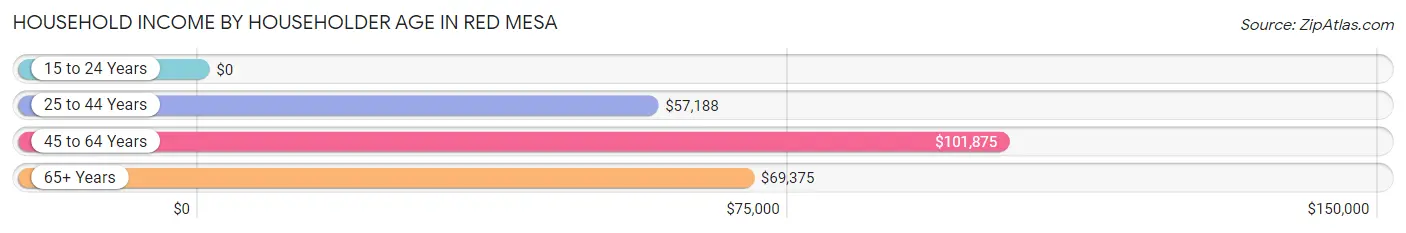
| Income Bracket | # Households | Median Income |
| 15 to 24 Years | 0 (0.0%) | $0 |
| 25 to 44 Years | 27 (19.6%) | $57,188 |
| 45 to 64 Years | 71 (51.4%) | $101,875 |
| 65+ Years | 40 (29.0%) | $69,375 |
| Total | 138 (100.0%) | $69,659 |
Poverty in Red Mesa
Income Below Poverty by Sex and Age in Red Mesa
With 20.0% poverty level for males and 20.1% for females among the residents of Red Mesa, 5 year old males and 15 year old females are the most vulnerable to poverty, with 8 males (50.0%) and 9 females (100.0%) in their respective age groups living below the poverty level.
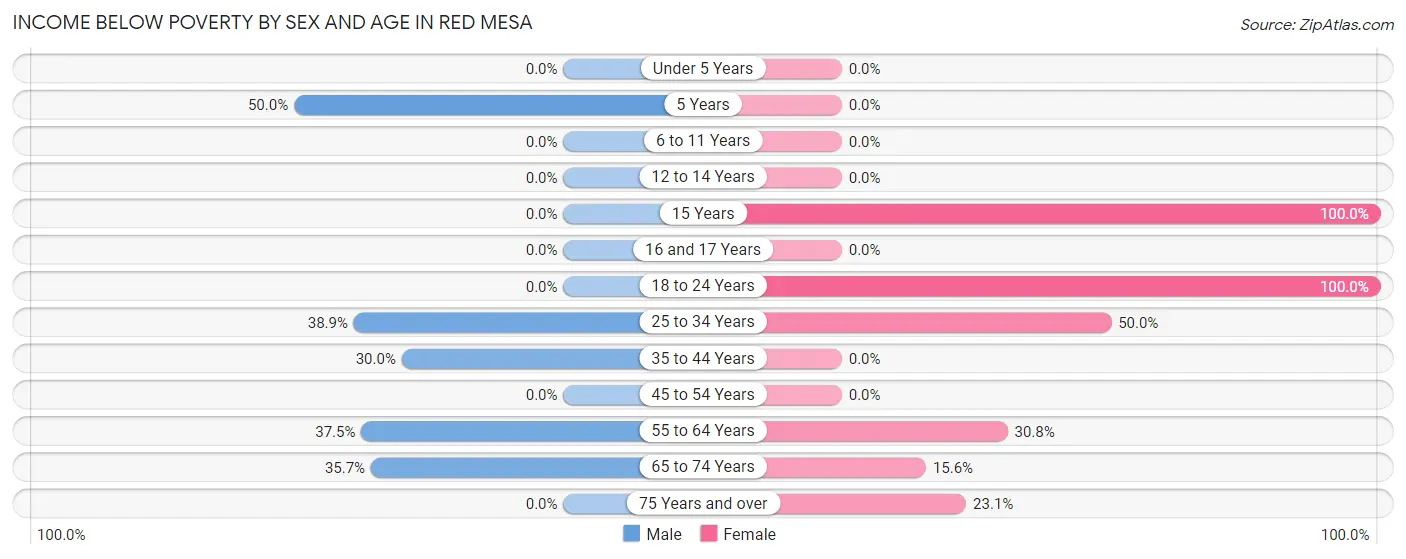
| Age Bracket | Male | Female |
| Under 5 Years | 0 (0.0%) | 0 (0.0%) |
| 5 Years | 8 (50.0%) | 0 (0.0%) |
| 6 to 11 Years | 0 (0.0%) | 0 (0.0%) |
| 12 to 14 Years | 0 (0.0%) | 0 (0.0%) |
| 15 Years | 0 (0.0%) | 9 (100.0%) |
| 16 and 17 Years | 0 (0.0%) | 0 (0.0%) |
| 18 to 24 Years | 0 (0.0%) | 8 (100.0%) |
| 25 to 34 Years | 21 (38.9%) | 7 (50.0%) |
| 35 to 44 Years | 12 (30.0%) | 0 (0.0%) |
| 45 to 54 Years | 0 (0.0%) | 0 (0.0%) |
| 55 to 64 Years | 6 (37.5%) | 12 (30.8%) |
| 65 to 74 Years | 5 (35.7%) | 5 (15.6%) |
| 75 Years and over | 0 (0.0%) | 6 (23.1%) |
| Total | 52 (20.0%) | 47 (20.1%) |
Income Above Poverty by Sex and Age in Red Mesa
According to the poverty statistics in Red Mesa, males aged under 5 years and females aged under 5 years are the age groups that are most secure financially, with 100.0% of males and 100.0% of females in these age groups living above the poverty line.
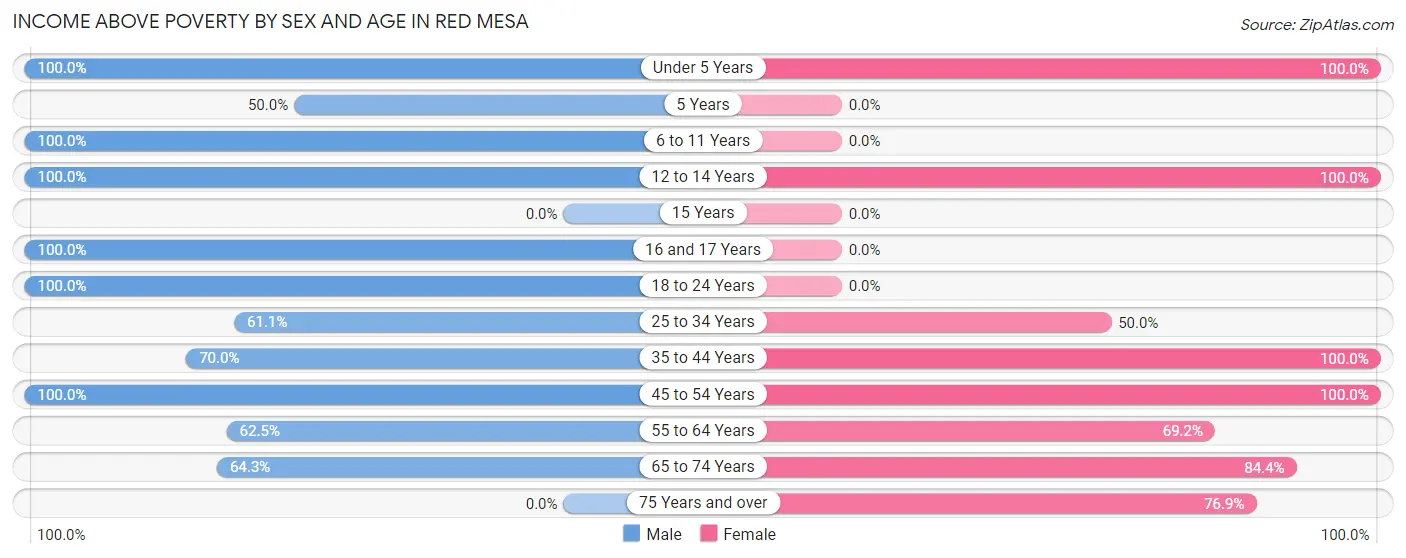
| Age Bracket | Male | Female |
| Under 5 Years | 23 (100.0%) | 3 (100.0%) |
| 5 Years | 8 (50.0%) | 0 (0.0%) |
| 6 to 11 Years | 33 (100.0%) | 0 (0.0%) |
| 12 to 14 Years | 6 (100.0%) | 17 (100.0%) |
| 15 Years | 0 (0.0%) | 0 (0.0%) |
| 16 and 17 Years | 7 (100.0%) | 0 (0.0%) |
| 18 to 24 Years | 25 (100.0%) | 0 (0.0%) |
| 25 to 34 Years | 33 (61.1%) | 7 (50.0%) |
| 35 to 44 Years | 28 (70.0%) | 42 (100.0%) |
| 45 to 54 Years | 26 (100.0%) | 44 (100.0%) |
| 55 to 64 Years | 10 (62.5%) | 27 (69.2%) |
| 65 to 74 Years | 9 (64.3%) | 27 (84.4%) |
| 75 Years and over | 0 (0.0%) | 20 (76.9%) |
| Total | 208 (80.0%) | 187 (79.9%) |
Income Below Poverty Among Married-Couple Families in Red Mesa
The poverty statistics for married-couple families in Red Mesa show that 17.9% or 10 of the total 56 families live below the poverty line. Families with 1 or 2 children have the highest poverty rate of 37.0%, comprising of 10 families. On the other hand, families with no children have the lowest poverty rate of 0.0%, which includes 0 families.
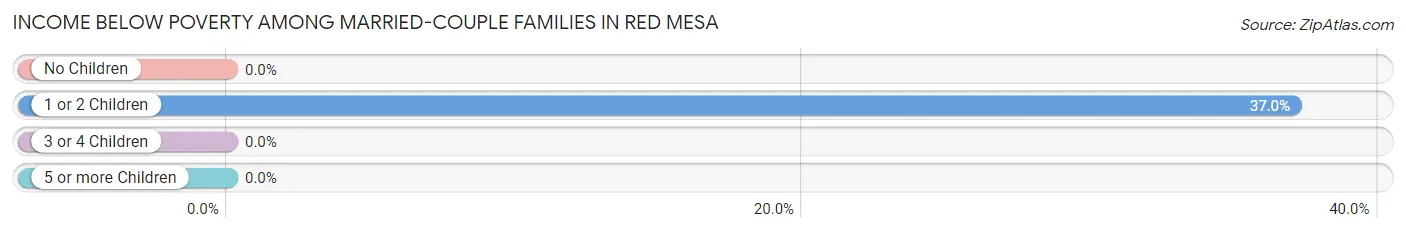
| Children | Above Poverty | Below Poverty |
| No Children | 29 (100.0%) | 0 (0.0%) |
| 1 or 2 Children | 17 (63.0%) | 10 (37.0%) |
| 3 or 4 Children | 0 (0.0%) | 0 (0.0%) |
| 5 or more Children | 0 (0.0%) | 0 (0.0%) |
| Total | 46 (82.1%) | 10 (17.9%) |
Income Below Poverty Among Single-Parent Households in Red Mesa
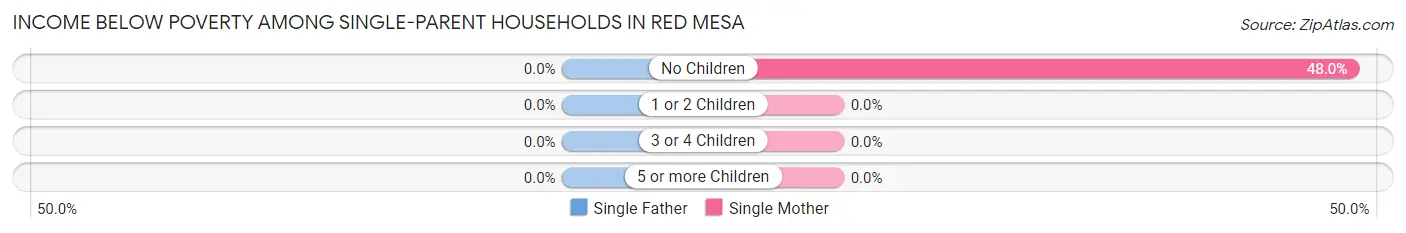
| Children | Single Father | Single Mother |
| No Children | 0 (0.0%) | 12 (48.0%) |
| 1 or 2 Children | 0 (0.0%) | 0 (0.0%) |
| 3 or 4 Children | 0 (0.0%) | 0 (0.0%) |
| 5 or more Children | 0 (0.0%) | 0 (0.0%) |
| Total | 0 (0.0%) | 12 (24.0%) |
Income Below Poverty Among Married-Couple vs Single-Parent Households in Red Mesa
The poverty data for Red Mesa shows that 10 of the married-couple family households (17.9%) and 12 of the single-parent households (21.8%) are living below the poverty level. Within the married-couple family households, those with 1 or 2 children have the highest poverty rate, with 10 households (37.0%) falling below the poverty line. Among the single-parent households, those with no children have the highest poverty rate, with 12 household (40.0%) living below poverty.
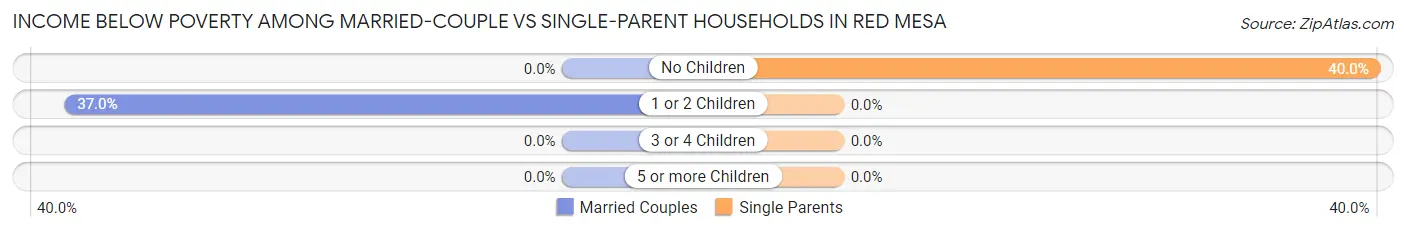
| Children | Married-Couple Families | Single-Parent Households |
| No Children | 0 (0.0%) | 12 (40.0%) |
| 1 or 2 Children | 10 (37.0%) | 0 (0.0%) |
| 3 or 4 Children | 0 (0.0%) | 0 (0.0%) |
| 5 or more Children | 0 (0.0%) | 0 (0.0%) |
| Total | 10 (17.9%) | 12 (21.8%) |
Race in Red Mesa
The most populous races in Red Mesa are Native / Alaskan (402 | 81.4%), Two or more Races (35 | 7.1%), and Asian (29 | 5.9%).
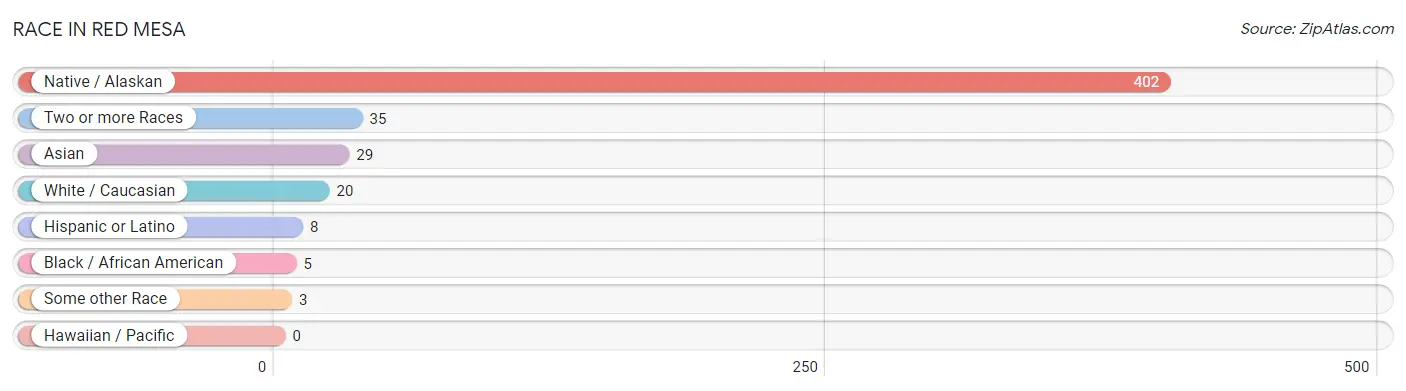
| Race | # Population | % Population |
| Asian | 29 | 5.9% |
| Black / African American | 5 | 1.0% |
| Hawaiian / Pacific | 0 | 0.0% |
| Hispanic or Latino | 8 | 1.6% |
| Native / Alaskan | 402 | 81.4% |
| White / Caucasian | 20 | 4.1% |
| Two or more Races | 35 | 7.1% |
| Some other Race | 3 | 0.6% |
| Total | 494 | 100.0% |
Ancestry in Red Mesa
The most populous ancestries reported in Red Mesa are Navajo (364 | 73.7%), Korean (56 | 11.3%), Irish (14 | 2.8%), Arapaho (12 | 2.4%), and Scottish (8 | 1.6%), together accounting for 91.9% of all Red Mesa residents.
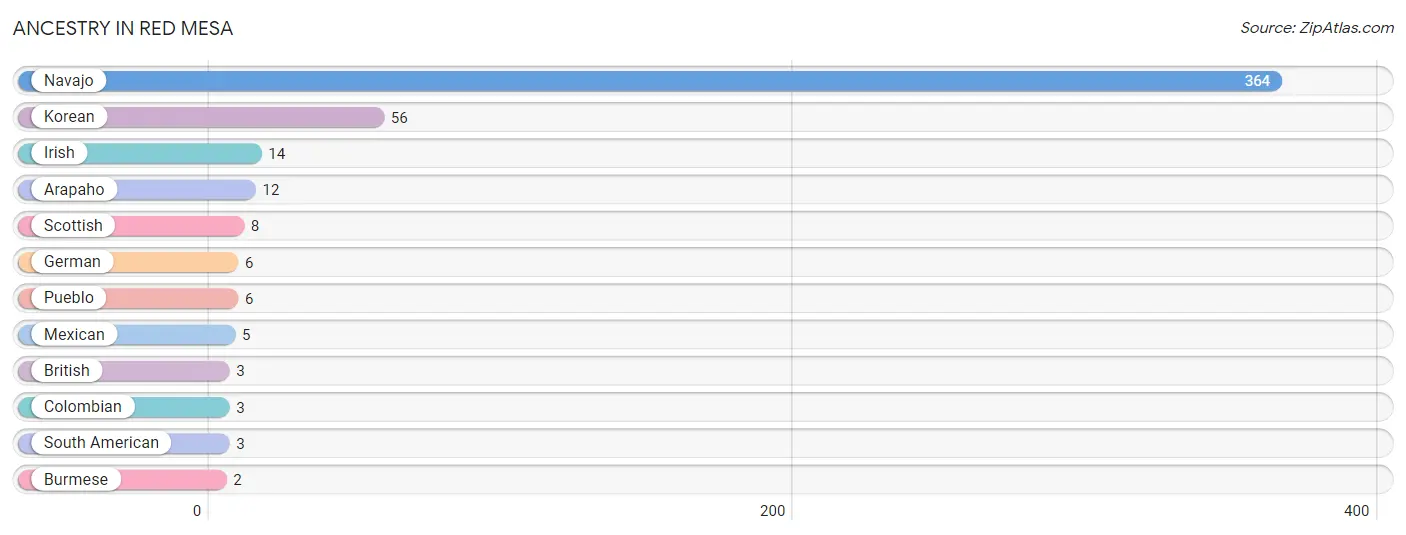
| Ancestry | # Population | % Population |
| Arapaho | 12 | 2.4% |
| British | 3 | 0.6% |
| Burmese | 2 | 0.4% |
| Colombian | 3 | 0.6% |
| German | 6 | 1.2% |
| Irish | 14 | 2.8% |
| Korean | 56 | 11.3% |
| Mexican | 5 | 1.0% |
| Navajo | 364 | 73.7% |
| Pueblo | 6 | 1.2% |
| Scottish | 8 | 1.6% |
| South American | 3 | 0.6% | View All 12 Rows |
Immigrants in Red Mesa
The most numerous immigrant groups reported in Red Mesa came from Asia (29 | 5.9%), Philippines (27 | 5.5%), South Eastern Asia (27 | 5.5%), Eastern Asia (2 | 0.4%), and Korea (2 | 0.4%), together accounting for 17.6% of all Red Mesa residents.
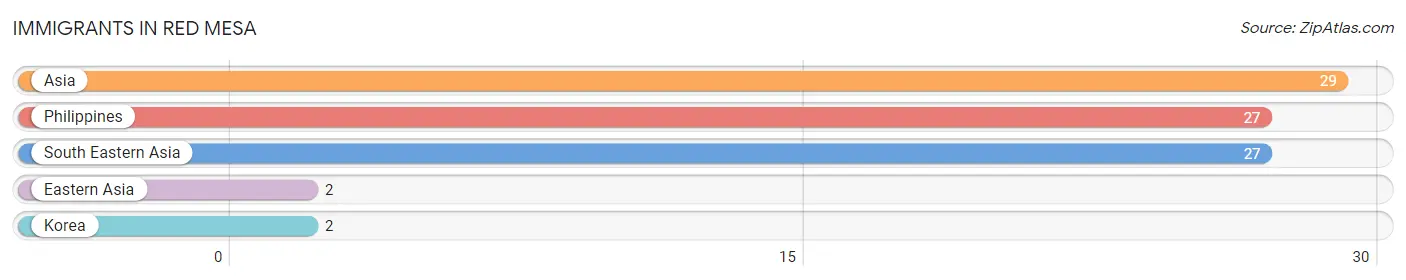
| Immigration Origin | # Population | % Population |
| Asia | 29 | 5.9% |
| Eastern Asia | 2 | 0.4% |
| Korea | 2 | 0.4% |
| Philippines | 27 | 5.5% |
| South Eastern Asia | 27 | 5.5% | View All 5 Rows |
Sex and Age in Red Mesa
Sex and Age in Red Mesa
The most populous age groups in Red Mesa are 5 to 9 Years (40 | 15.4%) for men and 45 to 49 Years (34 | 14.5%) for women.
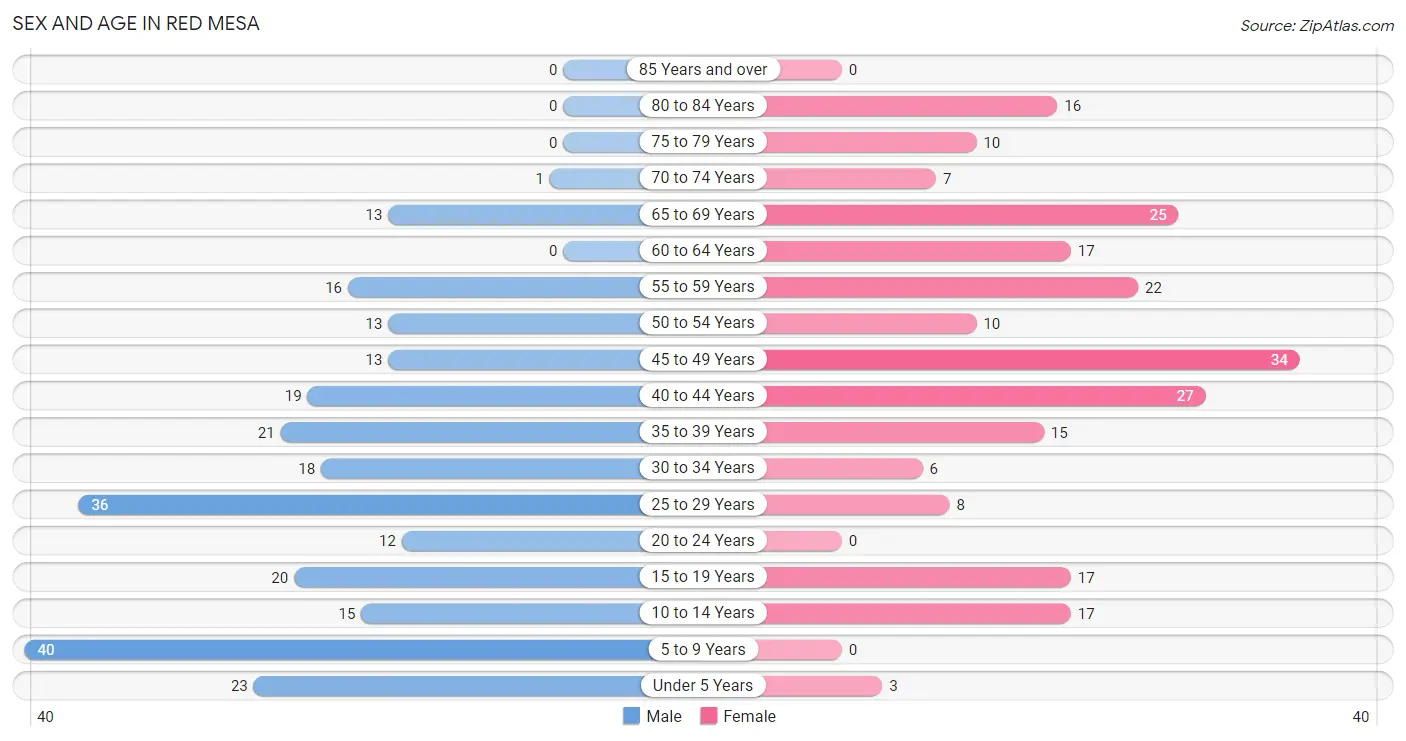
| Age Bracket | Male | Female |
| Under 5 Years | 23 (8.8%) | 3 (1.3%) |
| 5 to 9 Years | 40 (15.4%) | 0 (0.0%) |
| 10 to 14 Years | 15 (5.8%) | 17 (7.3%) |
| 15 to 19 Years | 20 (7.7%) | 17 (7.3%) |
| 20 to 24 Years | 12 (4.6%) | 0 (0.0%) |
| 25 to 29 Years | 36 (13.9%) | 8 (3.4%) |
| 30 to 34 Years | 18 (6.9%) | 6 (2.6%) |
| 35 to 39 Years | 21 (8.1%) | 15 (6.4%) |
| 40 to 44 Years | 19 (7.3%) | 27 (11.5%) |
| 45 to 49 Years | 13 (5.0%) | 34 (14.5%) |
| 50 to 54 Years | 13 (5.0%) | 10 (4.3%) |
| 55 to 59 Years | 16 (6.1%) | 22 (9.4%) |
| 60 to 64 Years | 0 (0.0%) | 17 (7.3%) |
| 65 to 69 Years | 13 (5.0%) | 25 (10.7%) |
| 70 to 74 Years | 1 (0.4%) | 7 (3.0%) |
| 75 to 79 Years | 0 (0.0%) | 10 (4.3%) |
| 80 to 84 Years | 0 (0.0%) | 16 (6.8%) |
| 85 Years and over | 0 (0.0%) | 0 (0.0%) |
| Total | 260 (100.0%) | 234 (100.0%) |
Families and Households in Red Mesa
Median Family Size in Red Mesa
The median family size in Red Mesa is 4.03 persons per family, with single male/father families (5 | 4.5%) accounting for the largest median family size of 5.2 persons per family. On the other hand, single female/mother families (50 | 45.1%) represent the smallest median family size with 3.78 persons per family.
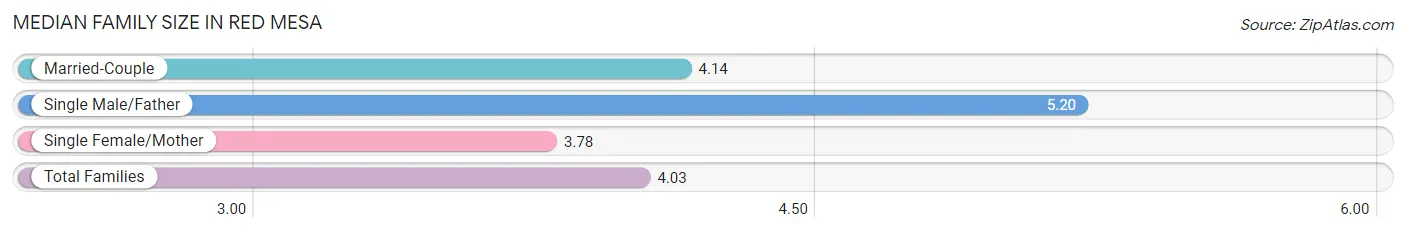
| Family Type | # Families | Family Size |
| Married-Couple | 56 (50.4%) | 4.14 |
| Single Male/Father | 5 (4.5%) | 5.20 |
| Single Female/Mother | 50 (45.1%) | 3.78 |
| Total Families | 111 (100.0%) | 4.03 |
Median Household Size in Red Mesa
The median household size in Red Mesa is 3.58 persons per household, with single male/father households (5 | 3.6%) accounting for the largest median household size of 5.2 persons per household. non-family households (27 | 19.6%) represent the smallest median household size with 1.74 persons per household.
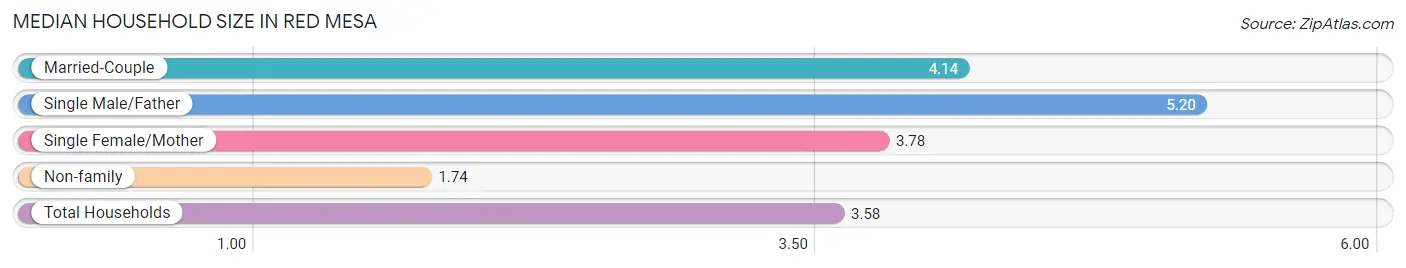
| Household Type | # Households | Household Size |
| Married-Couple | 56 (40.6%) | 4.14 |
| Single Male/Father | 5 (3.6%) | 5.20 |
| Single Female/Mother | 50 (36.2%) | 3.78 |
| Non-family | 27 (19.6%) | 1.74 |
| Total Households | 138 (100.0%) | 3.58 |
Household Size by Marriage Status in Red Mesa
Out of a total of 138 households in Red Mesa, 111 (80.4%) are family households, while 27 (19.6%) are nonfamily households. The most numerous type of family households are 3-person households, comprising 58, and the most common type of nonfamily households are 1-person households, comprising 21.
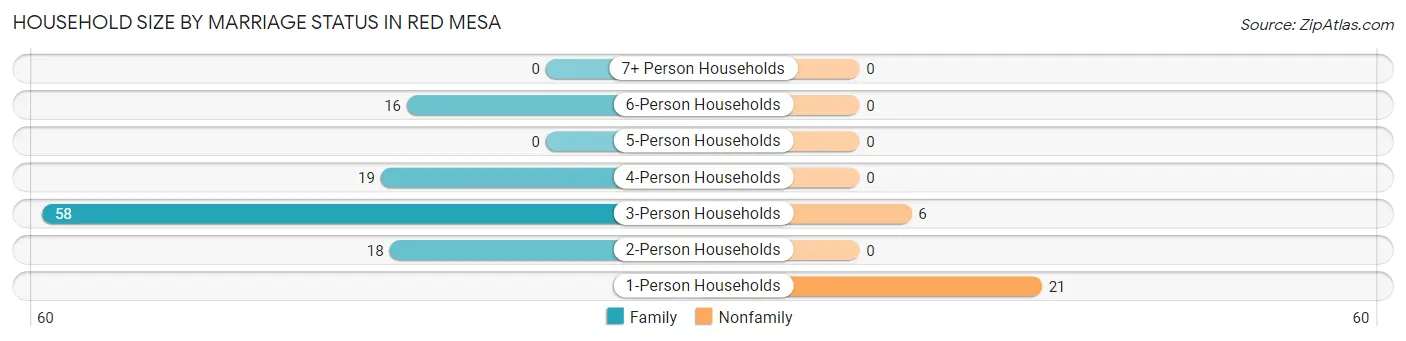
| Household Size | Family Households | Nonfamily Households |
| 1-Person Households | - | 21 (15.2%) |
| 2-Person Households | 18 (13.0%) | 0 (0.0%) |
| 3-Person Households | 58 (42.0%) | 6 (4.3%) |
| 4-Person Households | 19 (13.8%) | 0 (0.0%) |
| 5-Person Households | 0 (0.0%) | 0 (0.0%) |
| 6-Person Households | 16 (11.6%) | 0 (0.0%) |
| 7+ Person Households | 0 (0.0%) | 0 (0.0%) |
| Total | 111 (80.4%) | 27 (19.6%) |
Female Fertility in Red Mesa
Fertility by Age in Red Mesa
Average fertility rate in Red Mesa is 9.0 births per 1,000 women. Women in the age bracket of 20 to 34 years have the highest fertility rate with 71.0 births per 1,000 women. Women in the age bracket of 20 to 34 years acount for 100.0% of all women with births.
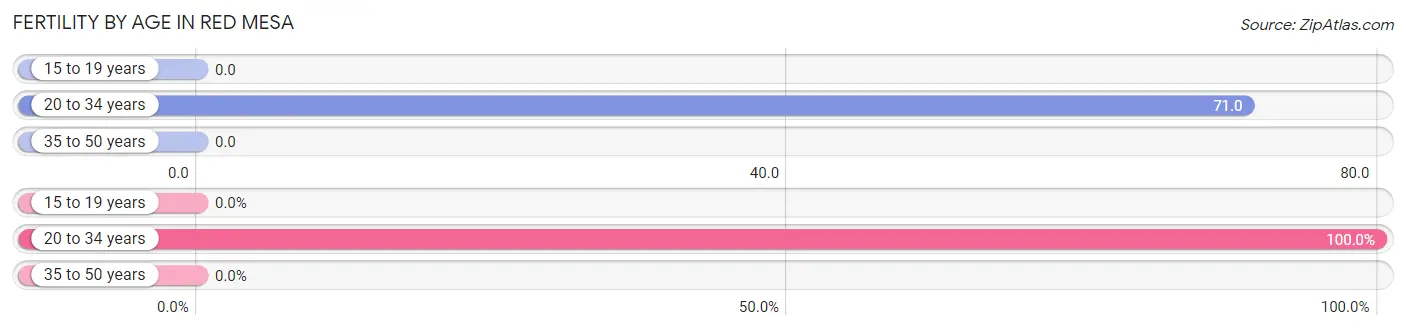
| Age Bracket | Women with Births | Births / 1,000 Women |
| 15 to 19 years | 0 (0.0%) | 0.0 |
| 20 to 34 years | 1 (100.0%) | 71.0 |
| 35 to 50 years | 0 (0.0%) | 0.0 |
| Total | 1 (100.0%) | 9.0 |
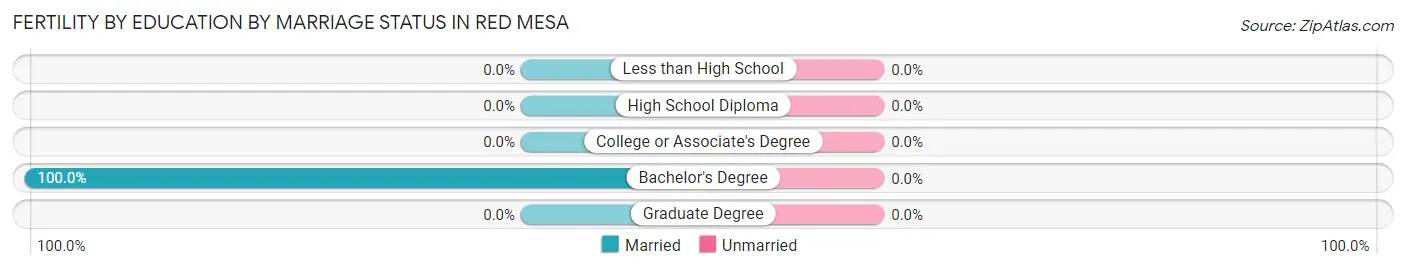
Fertility by Age by Marriage Status in Red Mesa
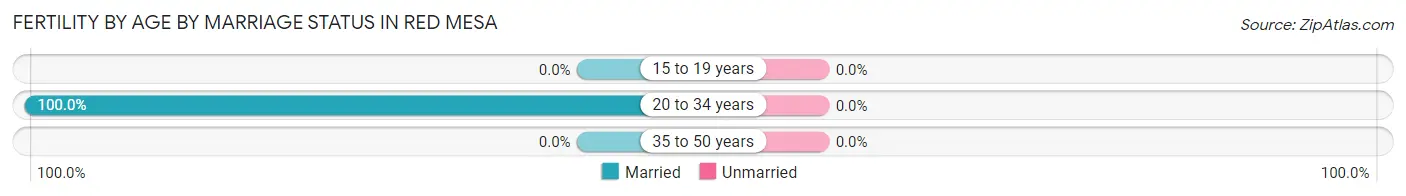
| Age Bracket | Married | Unmarried |
| 15 to 19 years | 0 (0.0%) | 0 (0.0%) |
| 20 to 34 years | 1 (100.0%) | 0 (0.0%) |
| 35 to 50 years | 0 (0.0%) | 0 (0.0%) |
| Total | 1 (100.0%) | 0 (0.0%) |
Fertility by Education in Red Mesa
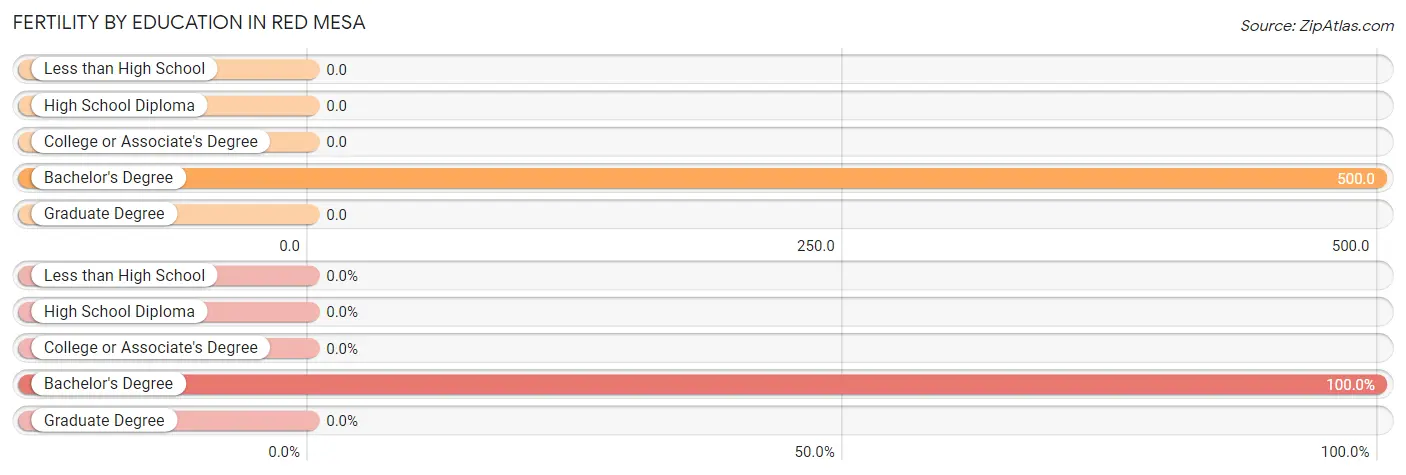
| Educational Attainment | Women with Births | Births / 1,000 Women |
| Less than High School | 0 (0.0%) | 0.0 |
| High School Diploma | 0 (0.0%) | 0.0 |
| College or Associate's Degree | 0 (0.0%) | 0.0 |
| Bachelor's Degree | 1 (100.0%) | 500.0 |
| Graduate Degree | 0 (0.0%) | 0.0 |
| Total | 1 (100.0%) | 9.0 |
Fertility by Education by Marriage Status in Red Mesa
| Educational Attainment | Married | Unmarried |
| Less than High School | 0 (0.0%) | 0 (0.0%) |
| High School Diploma | 0 (0.0%) | 0 (0.0%) |
| College or Associate's Degree | 0 (0.0%) | 0 (0.0%) |
| Bachelor's Degree | 1 (100.0%) | 0 (0.0%) |
| Graduate Degree | 0 (0.0%) | 0 (0.0%) |
| Total | 1 (100.0%) | 0 (0.0%) |
Employment Characteristics in Red Mesa
Employment by Class of Employer in Red Mesa
Among the 178 employed individuals in Red Mesa, federal government employees (56 | 31.5%), state government employees (54 | 30.3%), and private company employees (33 | 18.5%) make up the most common classes of employment.
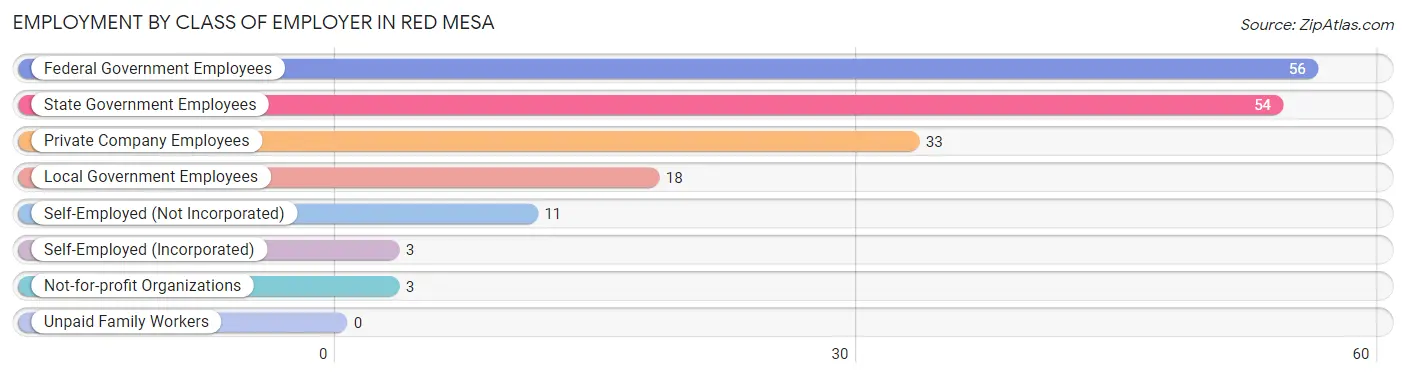
| Employer Class | # Employees | % Employees |
| Private Company Employees | 33 | 18.5% |
| Self-Employed (Incorporated) | 3 | 1.7% |
| Self-Employed (Not Incorporated) | 11 | 6.2% |
| Not-for-profit Organizations | 3 | 1.7% |
| Local Government Employees | 18 | 10.1% |
| State Government Employees | 54 | 30.3% |
| Federal Government Employees | 56 | 31.5% |
| Unpaid Family Workers | 0 | 0.0% |
| Total | 178 | 100.0% |
Employment Status by Age in Red Mesa
According to the labor force statistics for Red Mesa, out of the total population over 16 years of age (387), 55.3% or 214 individuals are in the labor force, with 14.5% or 31 of them unemployed. The age group with the highest labor force participation rate is 45 to 54 years, with 100.0% or 70 individuals in the labor force. Within the labor force, the 25 to 29 years age range has the highest percentage of unemployed individuals, with 69.6% or 16 of them being unemployed.
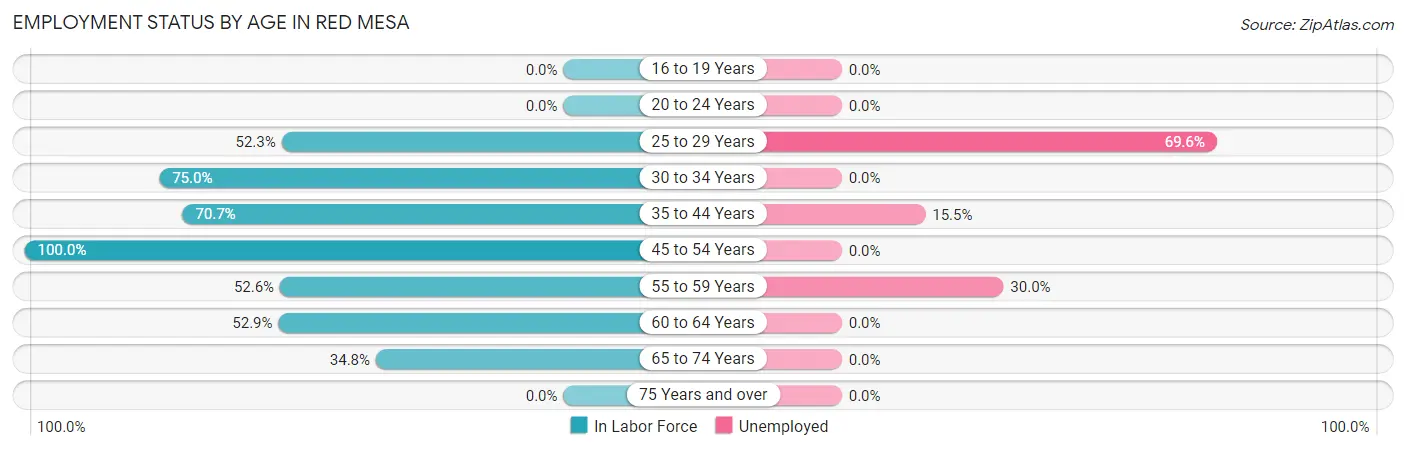
| Age Bracket | In Labor Force | Unemployed |
| 16 to 19 Years | 0 (0.0%) | 0 (0.0%) |
| 20 to 24 Years | 0 (0.0%) | 0 (0.0%) |
| 25 to 29 Years | 23 (52.3%) | 16 (69.6%) |
| 30 to 34 Years | 18 (75.0%) | 0 (0.0%) |
| 35 to 44 Years | 58 (70.7%) | 9 (15.5%) |
| 45 to 54 Years | 70 (100.0%) | 0 (0.0%) |
| 55 to 59 Years | 20 (52.6%) | 6 (30.0%) |
| 60 to 64 Years | 9 (52.9%) | 0 (0.0%) |
| 65 to 74 Years | 16 (34.8%) | 0 (0.0%) |
| 75 Years and over | 0 (0.0%) | 0 (0.0%) |
| Total | 214 (55.3%) | 31 (14.5%) |
Employment Status by Educational Attainment in Red Mesa
According to labor force statistics for Red Mesa, 72.0% of individuals (198) out of the total population between 25 and 64 years of age (275) are in the labor force, with 15.7% or 31 of them being unemployed. The group with the highest labor force participation rate are those with the educational attainment of bachelor's degree or higher, with 98.3% or 59 individuals in the labor force. Within the labor force, individuals with college / associate degree education have the highest percentage of unemployment, with 39.2% or 31 of them being unemployed.
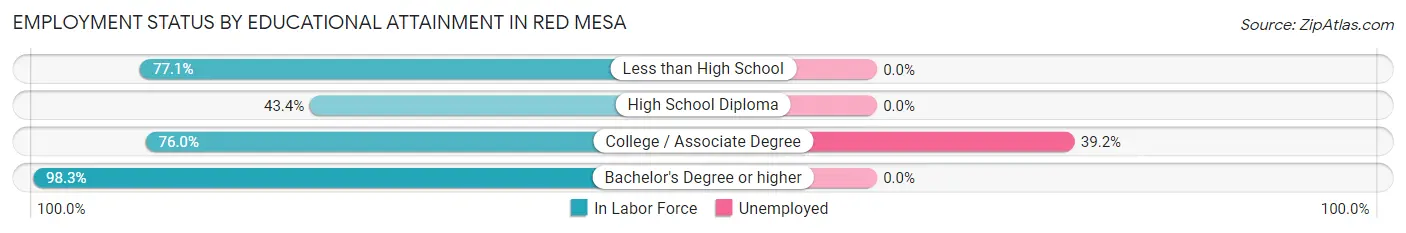
| Educational Attainment | In Labor Force | Unemployed |
| Less than High School | 27 (77.1%) | 0 (0.0%) |
| High School Diploma | 33 (43.4%) | 0 (0.0%) |
| College / Associate Degree | 79 (76.0%) | 41 (39.2%) |
| Bachelor's Degree or higher | 59 (98.3%) | 0 (0.0%) |
| Total | 198 (72.0%) | 43 (15.7%) |
Employment Occupations by Sex in Red Mesa
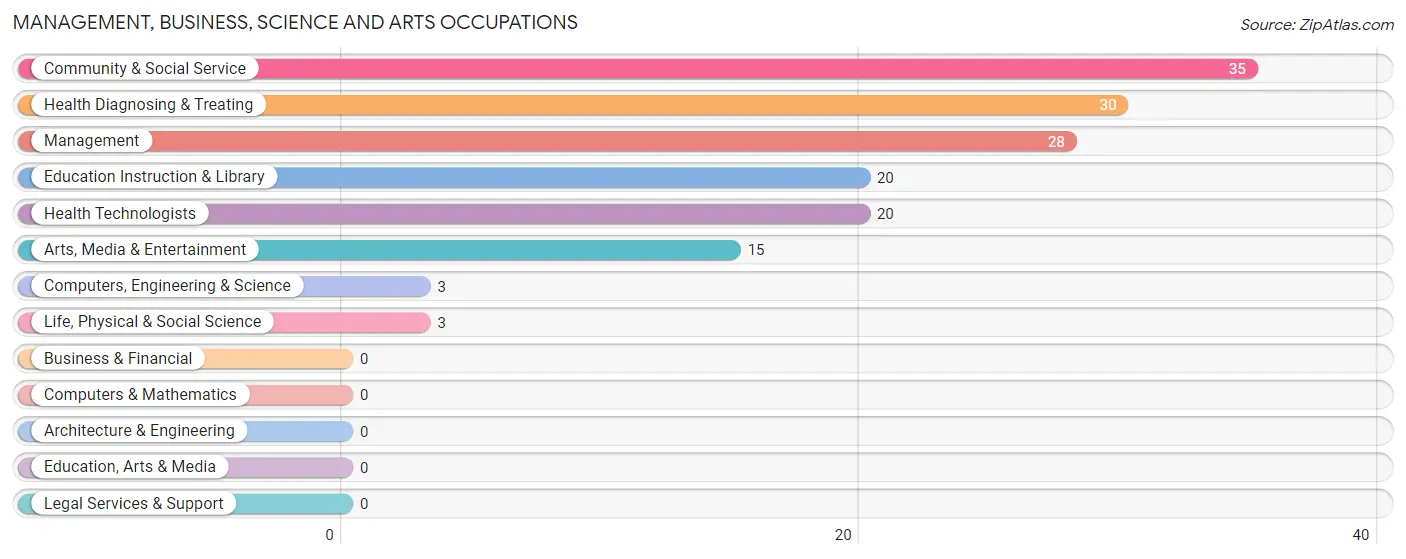
Management, Business, Science and Arts Occupations
The most common Management, Business, Science and Arts occupations in Red Mesa are Community & Social Service (35 | 19.1%), Health Diagnosing & Treating (30 | 16.4%), Management (28 | 15.3%), Education Instruction & Library (20 | 10.9%), and Health Technologists (20 | 10.9%).
Management, Business, Science and Arts Occupations by Sex
Within the Management, Business, Science and Arts occupations in Red Mesa, the most male-oriented occupations are Arts, Media & Entertainment (100.0%), Health Technologists (45.0%), and Community & Social Service (42.9%), while the most female-oriented occupations are Computers, Engineering & Science (100.0%), Life, Physical & Social Science (100.0%), and Education Instruction & Library (100.0%).
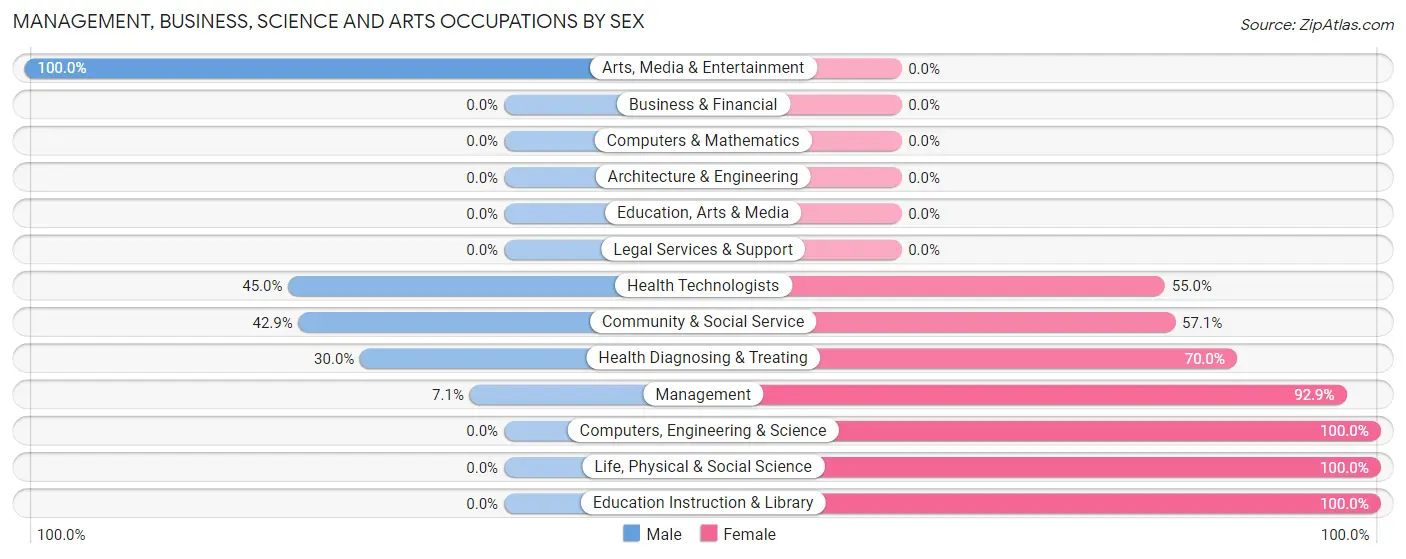
| Occupation | Male | Female |
| Management | 2 (7.1%) | 26 (92.9%) |
| Business & Financial | 0 (0.0%) | 0 (0.0%) |
| Computers, Engineering & Science | 0 (0.0%) | 3 (100.0%) |
| Computers & Mathematics | 0 (0.0%) | 0 (0.0%) |
| Architecture & Engineering | 0 (0.0%) | 0 (0.0%) |
| Life, Physical & Social Science | 0 (0.0%) | 3 (100.0%) |
| Community & Social Service | 15 (42.9%) | 20 (57.1%) |
| Education, Arts & Media | 0 (0.0%) | 0 (0.0%) |
| Legal Services & Support | 0 (0.0%) | 0 (0.0%) |
| Education Instruction & Library | 0 (0.0%) | 20 (100.0%) |
| Arts, Media & Entertainment | 15 (100.0%) | 0 (0.0%) |
| Health Diagnosing & Treating | 9 (30.0%) | 21 (70.0%) |
| Health Technologists | 9 (45.0%) | 11 (55.0%) |
| Total (Category) | 26 (27.1%) | 70 (72.9%) |
| Total (Overall) | 74 (40.4%) | 109 (59.6%) |
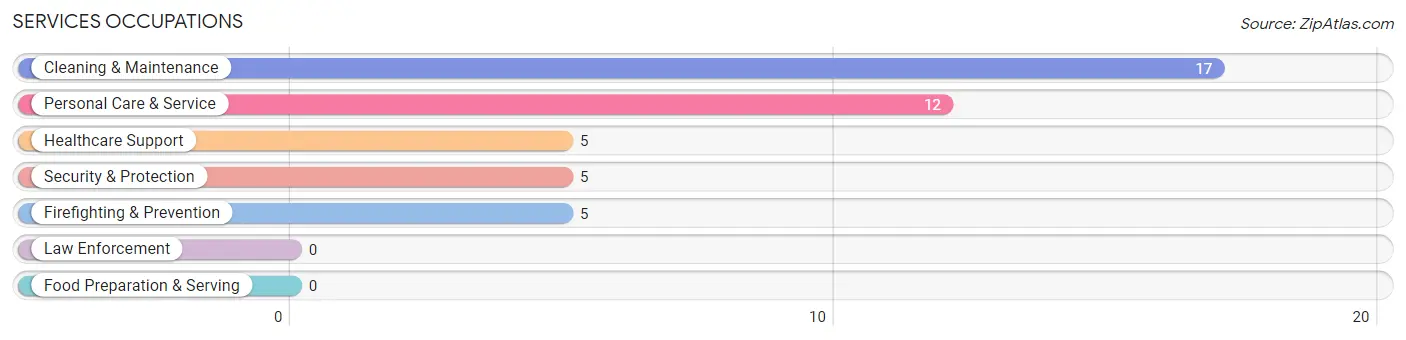
Services Occupations
The most common Services occupations in Red Mesa are Cleaning & Maintenance (17 | 9.3%), Personal Care & Service (12 | 6.6%), Healthcare Support (5 | 2.7%), Security & Protection (5 | 2.7%), and Firefighting & Prevention (5 | 2.7%).
Services Occupations by Sex
Within the Services occupations in Red Mesa, the most male-oriented occupations are Security & Protection (100.0%), Firefighting & Prevention (100.0%), and Personal Care & Service (100.0%), while the most female-oriented occupations are Healthcare Support (100.0%), and Cleaning & Maintenance (70.6%).
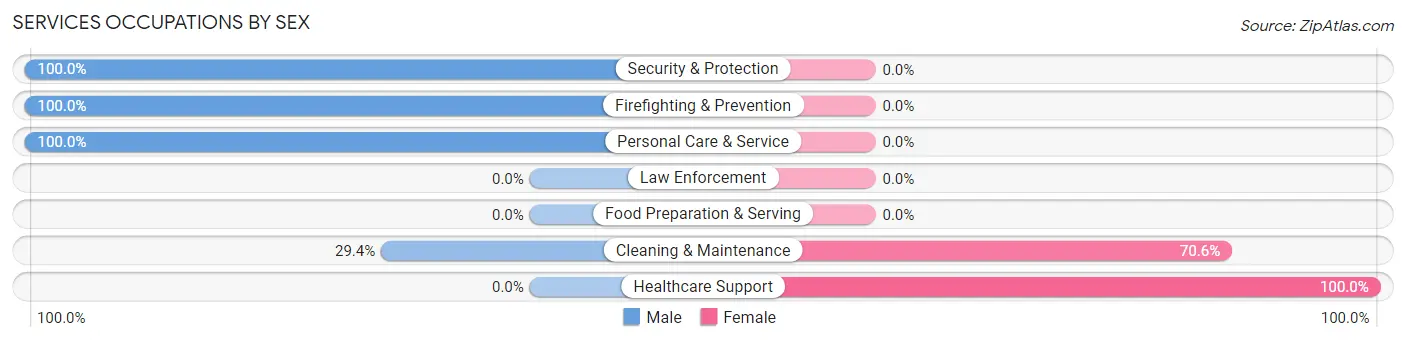
| Occupation | Male | Female |
| Healthcare Support | 0 (0.0%) | 5 (100.0%) |
| Security & Protection | 5 (100.0%) | 0 (0.0%) |
| Firefighting & Prevention | 5 (100.0%) | 0 (0.0%) |
| Law Enforcement | 0 (0.0%) | 0 (0.0%) |
| Food Preparation & Serving | 0 (0.0%) | 0 (0.0%) |
| Cleaning & Maintenance | 5 (29.4%) | 12 (70.6%) |
| Personal Care & Service | 12 (100.0%) | 0 (0.0%) |
| Total (Category) | 22 (56.4%) | 17 (43.6%) |
| Total (Overall) | 74 (40.4%) | 109 (59.6%) |
Sales and Office Occupations
The most common Sales and Office occupations in Red Mesa are Office & Administration (15 | 8.2%), and Sales & Related (10 | 5.5%).
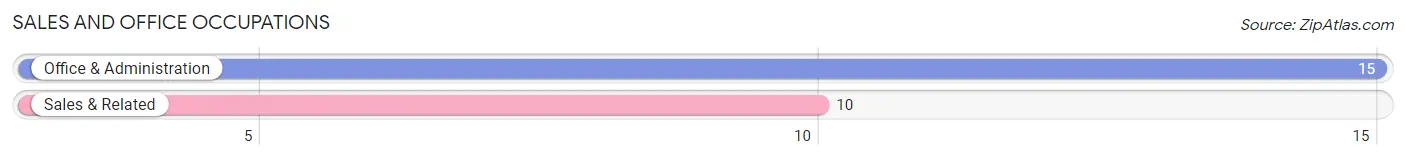
Sales and Office Occupations by Sex
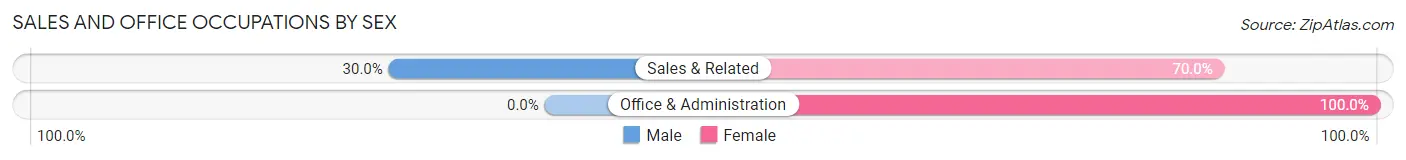
| Occupation | Male | Female |
| Sales & Related | 3 (30.0%) | 7 (70.0%) |
| Office & Administration | 0 (0.0%) | 15 (100.0%) |
| Total (Category) | 3 (12.0%) | 22 (88.0%) |
| Total (Overall) | 74 (40.4%) | 109 (59.6%) |
Natural Resources, Construction and Maintenance Occupations
The most common Natural Resources, Construction and Maintenance occupations in Red Mesa are , and Construction & Extraction (6 | 3.3%).
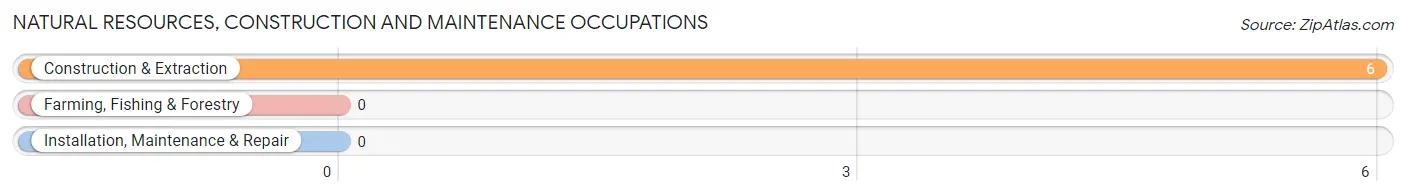
Natural Resources, Construction and Maintenance Occupations by Sex
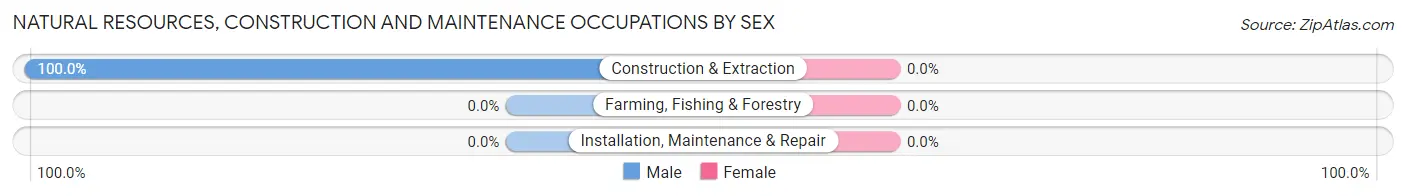
| Occupation | Male | Female |
| Farming, Fishing & Forestry | 0 (0.0%) | 0 (0.0%) |
| Construction & Extraction | 6 (100.0%) | 0 (0.0%) |
| Installation, Maintenance & Repair | 0 (0.0%) | 0 (0.0%) |
| Total (Category) | 6 (100.0%) | 0 (0.0%) |
| Total (Overall) | 74 (40.4%) | 109 (59.6%) |
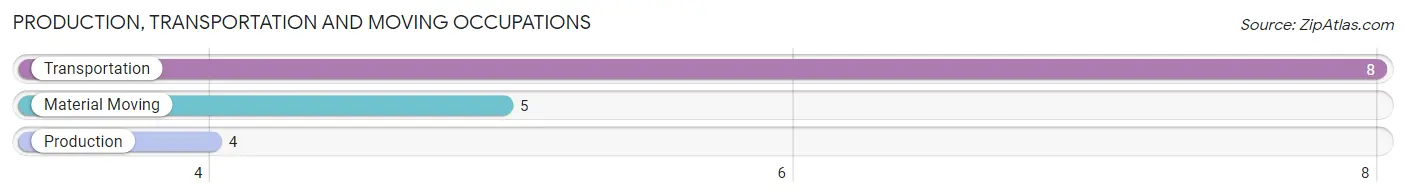
Production, Transportation and Moving Occupations
The most common Production, Transportation and Moving occupations in Red Mesa are Transportation (8 | 4.4%), Material Moving (5 | 2.7%), and Production (4 | 2.2%).
Production, Transportation and Moving Occupations by Sex
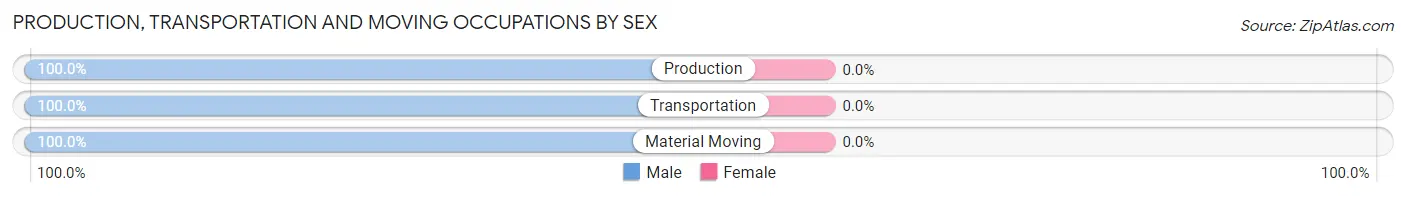
| Occupation | Male | Female |
| Production | 4 (100.0%) | 0 (0.0%) |
| Transportation | 8 (100.0%) | 0 (0.0%) |
| Material Moving | 5 (100.0%) | 0 (0.0%) |
| Total (Category) | 17 (100.0%) | 0 (0.0%) |
| Total (Overall) | 74 (40.4%) | 109 (59.6%) |
Employment Industries by Sex in Red Mesa
Employment Industries in Red Mesa
The major employment industries in Red Mesa include Health Care & Social Assistance (57 | 31.1%), Educational Services (47 | 25.7%), Administrative & Support (23 | 12.6%), Public Administration (15 | 8.2%), and Arts, Entertainment & Recreation (12 | 6.6%).
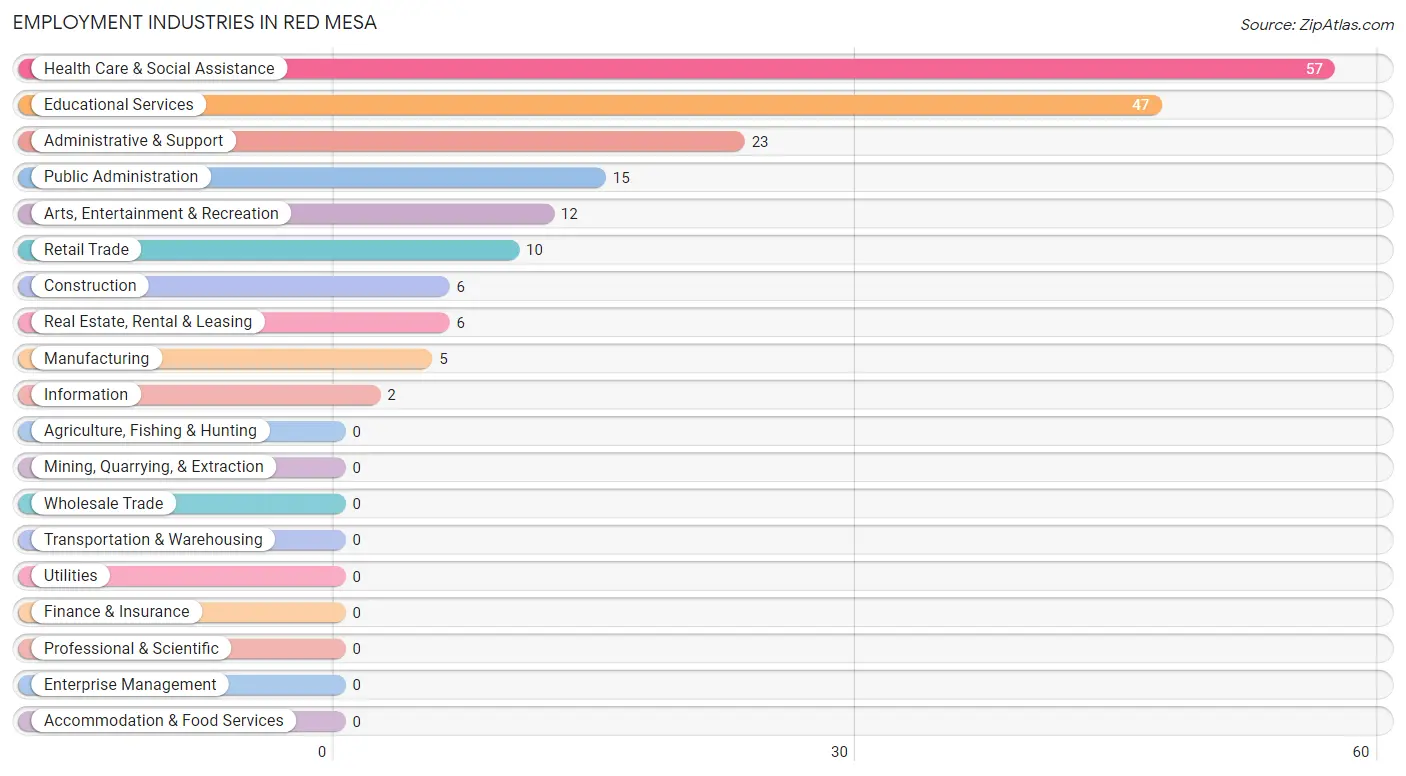
Employment Industries by Sex in Red Mesa
The Red Mesa industries that see more men than women are Construction (100.0%), Manufacturing (100.0%), and Information (100.0%), whereas the industries that tend to have a higher number of women are Real Estate, Rental & Leasing (100.0%), Health Care & Social Assistance (84.2%), and Educational Services (80.8%).
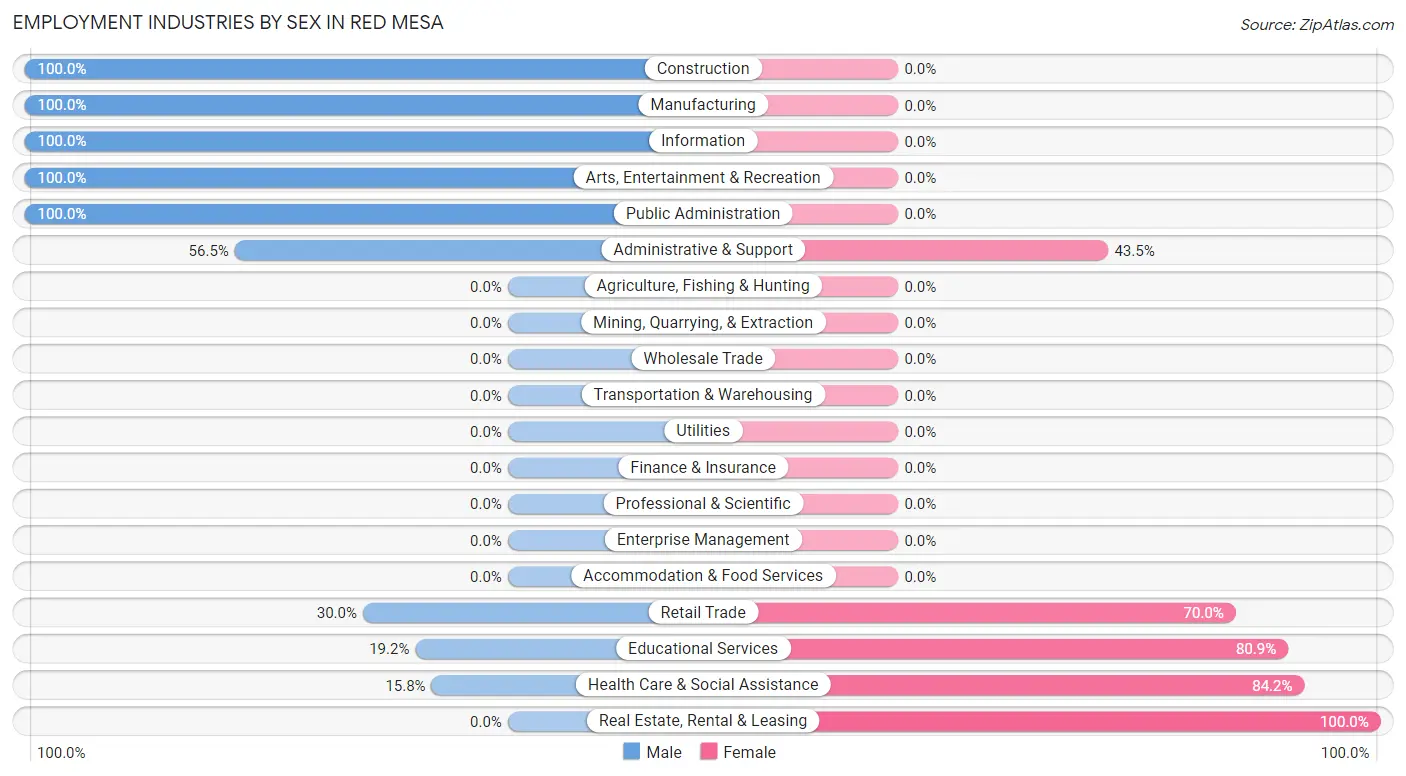
| Industry | Male | Female |
| Agriculture, Fishing & Hunting | 0 (0.0%) | 0 (0.0%) |
| Mining, Quarrying, & Extraction | 0 (0.0%) | 0 (0.0%) |
| Construction | 6 (100.0%) | 0 (0.0%) |
| Manufacturing | 5 (100.0%) | 0 (0.0%) |
| Wholesale Trade | 0 (0.0%) | 0 (0.0%) |
| Retail Trade | 3 (30.0%) | 7 (70.0%) |
| Transportation & Warehousing | 0 (0.0%) | 0 (0.0%) |
| Utilities | 0 (0.0%) | 0 (0.0%) |
| Information | 2 (100.0%) | 0 (0.0%) |
| Finance & Insurance | 0 (0.0%) | 0 (0.0%) |
| Real Estate, Rental & Leasing | 0 (0.0%) | 6 (100.0%) |
| Professional & Scientific | 0 (0.0%) | 0 (0.0%) |
| Enterprise Management | 0 (0.0%) | 0 (0.0%) |
| Administrative & Support | 13 (56.5%) | 10 (43.5%) |
| Educational Services | 9 (19.2%) | 38 (80.8%) |
| Health Care & Social Assistance | 9 (15.8%) | 48 (84.2%) |
| Arts, Entertainment & Recreation | 12 (100.0%) | 0 (0.0%) |
| Accommodation & Food Services | 0 (0.0%) | 0 (0.0%) |
| Public Administration | 15 (100.0%) | 0 (0.0%) |
| Total | 74 (40.4%) | 109 (59.6%) |
Education in Red Mesa
School Enrollment in Red Mesa
The most common levels of schooling among the 124 students in Red Mesa are high school (46 | 37.1%), middle school (21 | 16.9%), and elementary school (18 | 14.5%).
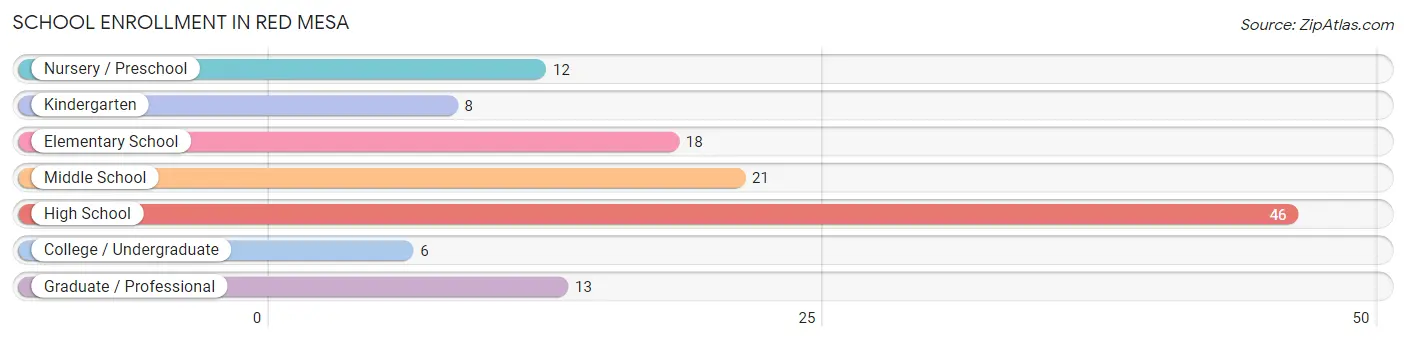
| School Level | # Students | % Students |
| Nursery / Preschool | 12 | 9.7% |
| Kindergarten | 8 | 6.5% |
| Elementary School | 18 | 14.5% |
| Middle School | 21 | 16.9% |
| High School | 46 | 37.1% |
| College / Undergraduate | 6 | 4.8% |
| Graduate / Professional | 13 | 10.5% |
| Total | 124 | 100.0% |
School Enrollment by Age by Funding Source in Red Mesa
Out of a total of 124 students who are enrolled in schools in Red Mesa, 6 (4.8%) attend a private institution, while the remaining 118 (95.2%) are enrolled in public schools. The age group of 35 years and over has the highest likelihood of being enrolled in private schools, with 6 (31.6% in the age bracket) enrolled. Conversely, the age group of 3 to 4 year olds has the lowest likelihood of being enrolled in a private school, with 12 (100.0% in the age bracket) attending a public institution.
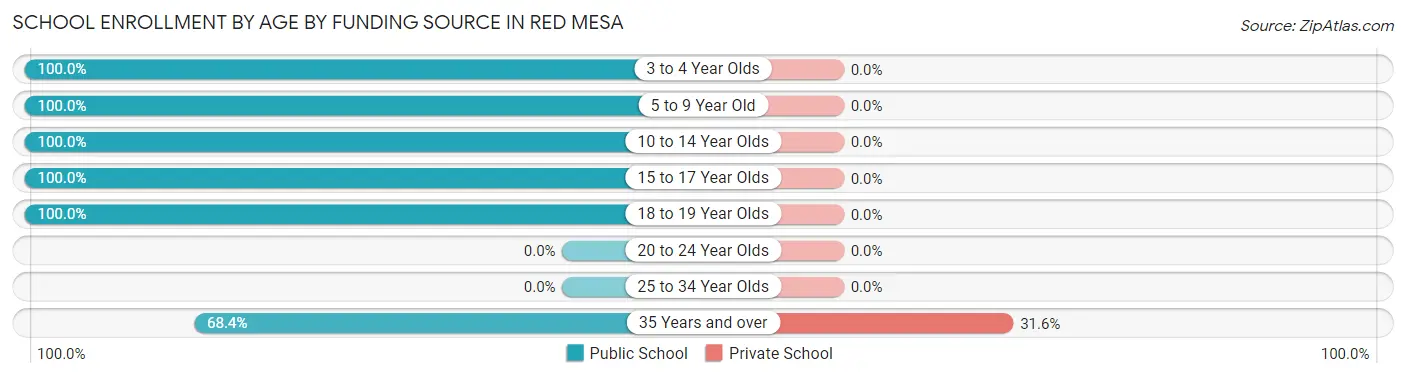
| Age Bracket | Public School | Private School |
| 3 to 4 Year Olds | 12 (100.0%) | 0 (0.0%) |
| 5 to 9 Year Old | 32 (100.0%) | 0 (0.0%) |
| 10 to 14 Year Olds | 32 (100.0%) | 0 (0.0%) |
| 15 to 17 Year Olds | 16 (100.0%) | 0 (0.0%) |
| 18 to 19 Year Olds | 13 (100.0%) | 0 (0.0%) |
| 20 to 24 Year Olds | 0 (0.0%) | 0 (0.0%) |
| 25 to 34 Year Olds | 0 (0.0%) | 0 (0.0%) |
| 35 Years and over | 13 (68.4%) | 6 (31.6%) |
| Total | 118 (95.2%) | 6 (4.8%) |
Educational Attainment by Field of Study in Red Mesa
Education (36 | 47.4%), science & technology (14 | 18.4%), business (11 | 14.5%), physical & health sciences (6 | 7.9%), and arts & humanities (6 | 7.9%) are the most common fields of study among 76 individuals in Red Mesa who have obtained a bachelor's degree or higher.
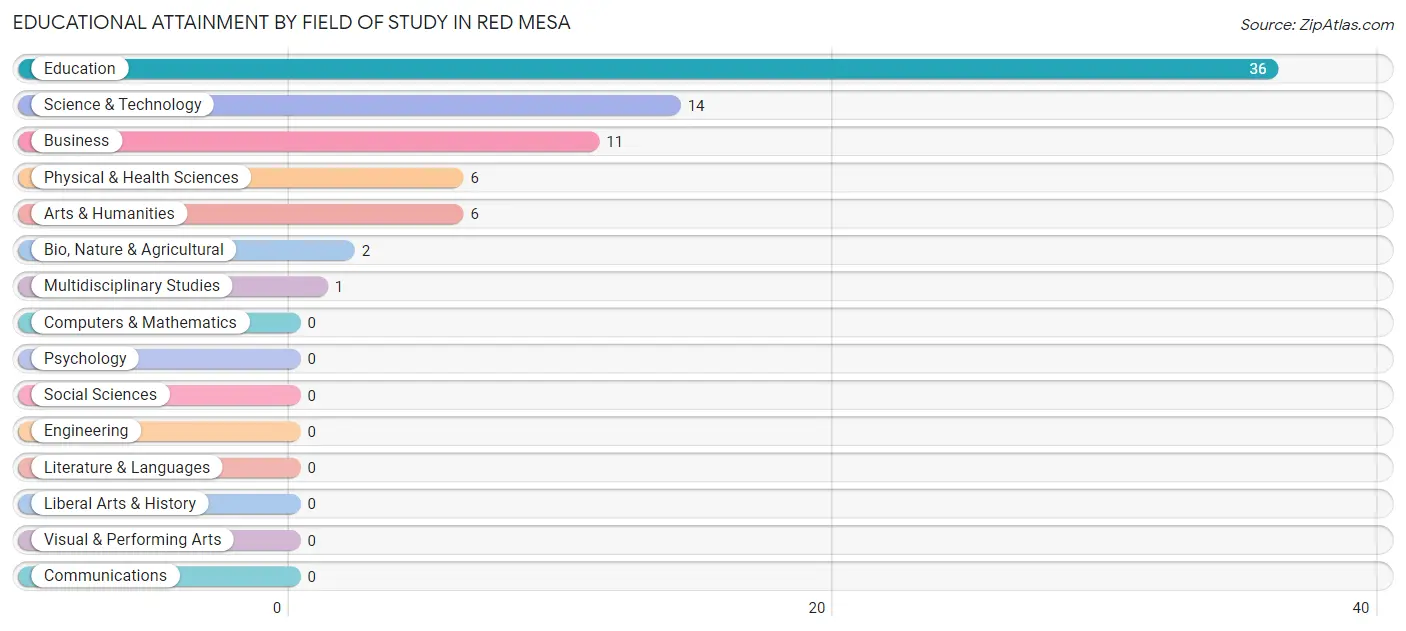
| Field of Study | # Graduates | % Graduates |
| Computers & Mathematics | 0 | 0.0% |
| Bio, Nature & Agricultural | 2 | 2.6% |
| Physical & Health Sciences | 6 | 7.9% |
| Psychology | 0 | 0.0% |
| Social Sciences | 0 | 0.0% |
| Engineering | 0 | 0.0% |
| Multidisciplinary Studies | 1 | 1.3% |
| Science & Technology | 14 | 18.4% |
| Business | 11 | 14.5% |
| Education | 36 | 47.4% |
| Literature & Languages | 0 | 0.0% |
| Liberal Arts & History | 0 | 0.0% |
| Visual & Performing Arts | 0 | 0.0% |
| Communications | 0 | 0.0% |
| Arts & Humanities | 6 | 7.9% |
| Total | 76 | 100.0% |
Transportation & Commute in Red Mesa
Vehicle Availability by Sex in Red Mesa
The most prevalent vehicle ownership categories in Red Mesa are males with 1 vehicle (31, accounting for 41.9%) and females with 1 vehicle (63, making up 29.8%).
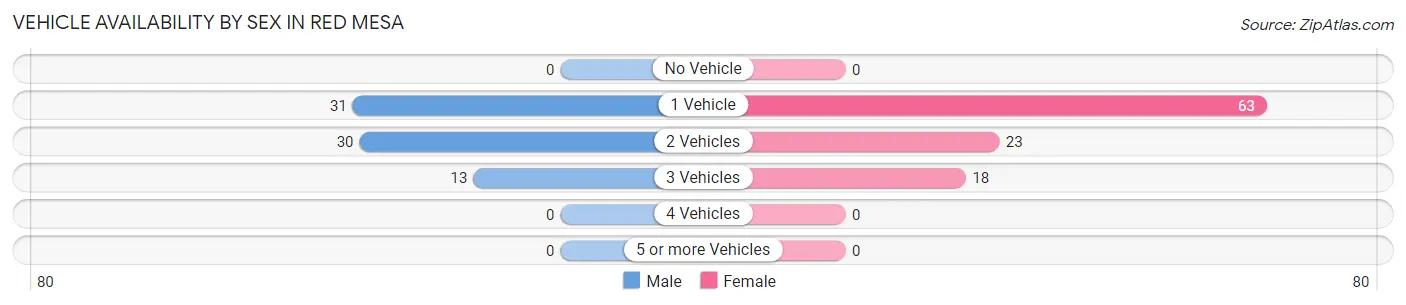
| Vehicles Available | Male | Female |
| No Vehicle | 0 (0.0%) | 0 (0.0%) |
| 1 Vehicle | 31 (41.9%) | 63 (60.6%) |
| 2 Vehicles | 30 (40.5%) | 23 (22.1%) |
| 3 Vehicles | 13 (17.6%) | 18 (17.3%) |
| 4 Vehicles | 0 (0.0%) | 0 (0.0%) |
| 5 or more Vehicles | 0 (0.0%) | 0 (0.0%) |
| Total | 74 (100.0%) | 104 (100.0%) |
Commute Time in Red Mesa
The most frequently occuring commute durations in Red Mesa are 5 to 9 minutes (57 commuters, 35.4%), 30 to 34 minutes (27 commuters, 16.8%), and 10 to 14 minutes (26 commuters, 16.2%).
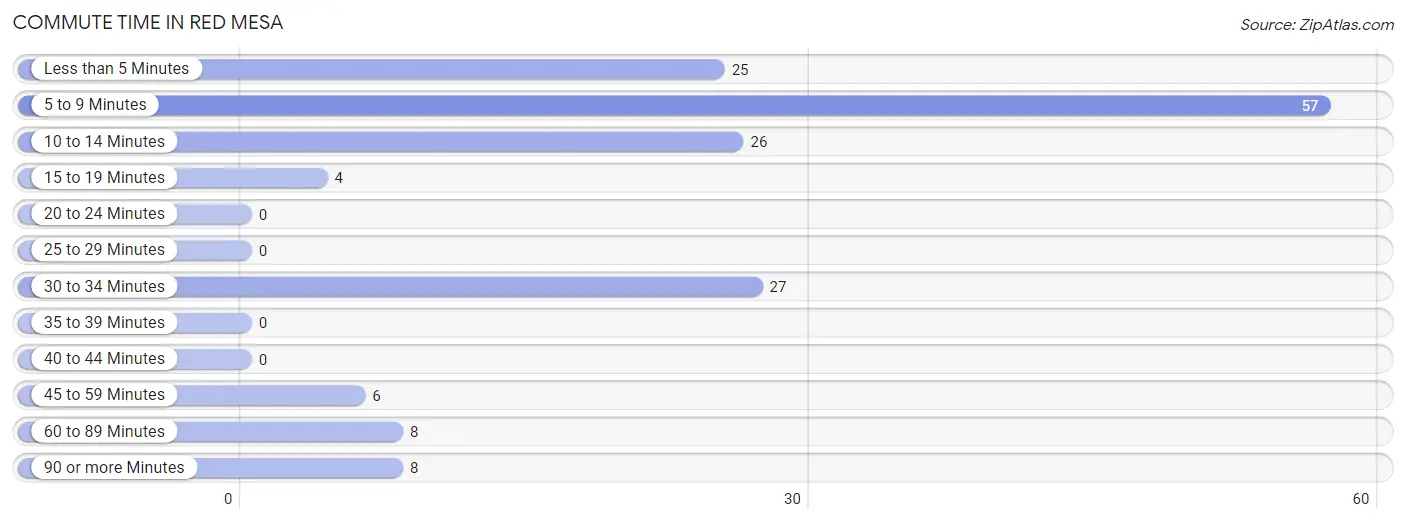
| Commute Time | # Commuters | % Commuters |
| Less than 5 Minutes | 25 | 15.5% |
| 5 to 9 Minutes | 57 | 35.4% |
| 10 to 14 Minutes | 26 | 16.2% |
| 15 to 19 Minutes | 4 | 2.5% |
| 20 to 24 Minutes | 0 | 0.0% |
| 25 to 29 Minutes | 0 | 0.0% |
| 30 to 34 Minutes | 27 | 16.8% |
| 35 to 39 Minutes | 0 | 0.0% |
| 40 to 44 Minutes | 0 | 0.0% |
| 45 to 59 Minutes | 6 | 3.7% |
| 60 to 89 Minutes | 8 | 5.0% |
| 90 or more Minutes | 8 | 5.0% |
Commute Time by Sex in Red Mesa
The most common commute times in Red Mesa are 30 to 34 minutes (20 commuters, 29.0%) for males and 5 to 9 minutes (39 commuters, 42.4%) for females.
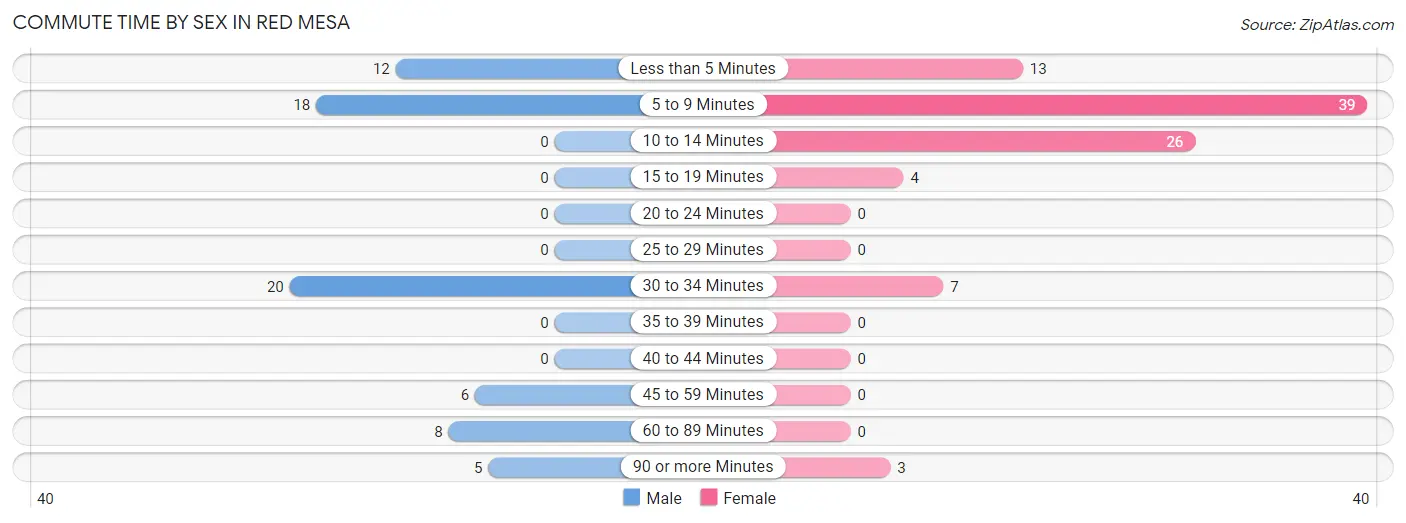
| Commute Time | Male | Female |
| Less than 5 Minutes | 12 (17.4%) | 13 (14.1%) |
| 5 to 9 Minutes | 18 (26.1%) | 39 (42.4%) |
| 10 to 14 Minutes | 0 (0.0%) | 26 (28.3%) |
| 15 to 19 Minutes | 0 (0.0%) | 4 (4.3%) |
| 20 to 24 Minutes | 0 (0.0%) | 0 (0.0%) |
| 25 to 29 Minutes | 0 (0.0%) | 0 (0.0%) |
| 30 to 34 Minutes | 20 (29.0%) | 7 (7.6%) |
| 35 to 39 Minutes | 0 (0.0%) | 0 (0.0%) |
| 40 to 44 Minutes | 0 (0.0%) | 0 (0.0%) |
| 45 to 59 Minutes | 6 (8.7%) | 0 (0.0%) |
| 60 to 89 Minutes | 8 (11.6%) | 0 (0.0%) |
| 90 or more Minutes | 5 (7.2%) | 3 (3.3%) |
Time of Departure to Work by Sex in Red Mesa
The most frequent times of departure to work in Red Mesa are 7:30 AM to 7:59 AM (40, 58.0%) for males and 7:00 AM to 7:29 AM (32, 34.8%) for females.
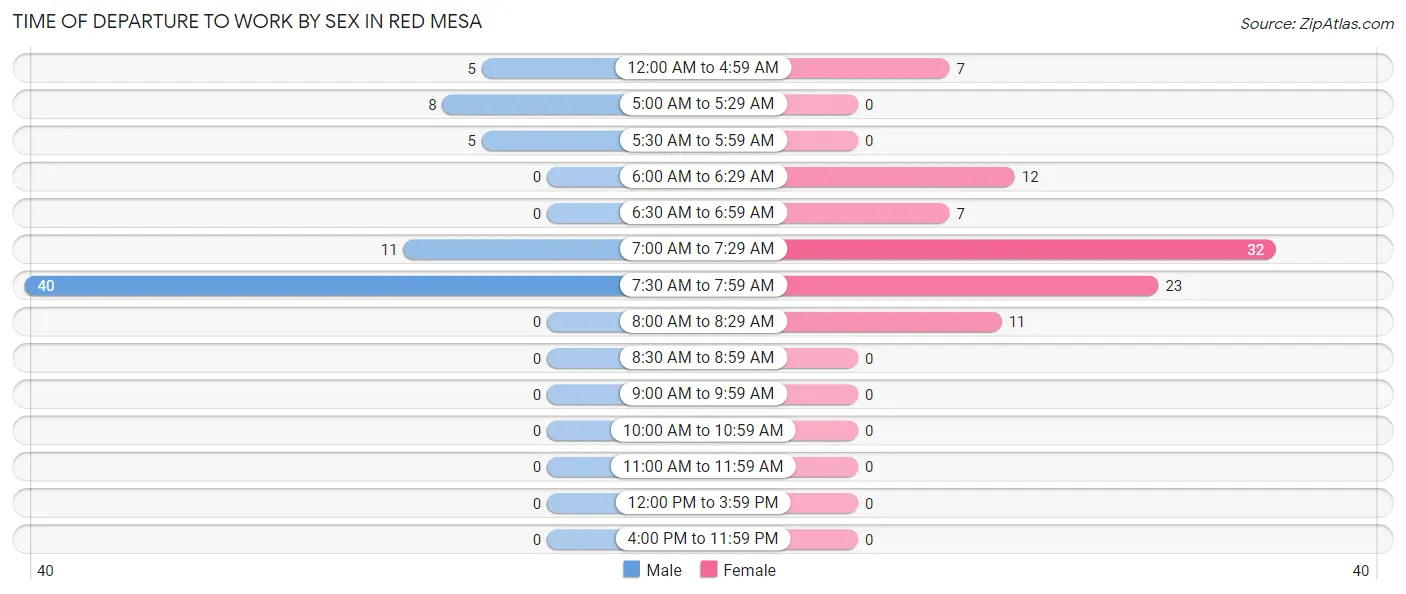
| Time of Departure | Male | Female |
| 12:00 AM to 4:59 AM | 5 (7.2%) | 7 (7.6%) |
| 5:00 AM to 5:29 AM | 8 (11.6%) | 0 (0.0%) |
| 5:30 AM to 5:59 AM | 5 (7.2%) | 0 (0.0%) |
| 6:00 AM to 6:29 AM | 0 (0.0%) | 12 (13.0%) |
| 6:30 AM to 6:59 AM | 0 (0.0%) | 7 (7.6%) |
| 7:00 AM to 7:29 AM | 11 (15.9%) | 32 (34.8%) |
| 7:30 AM to 7:59 AM | 40 (58.0%) | 23 (25.0%) |
| 8:00 AM to 8:29 AM | 0 (0.0%) | 11 (12.0%) |
| 8:30 AM to 8:59 AM | 0 (0.0%) | 0 (0.0%) |
| 9:00 AM to 9:59 AM | 0 (0.0%) | 0 (0.0%) |
| 10:00 AM to 10:59 AM | 0 (0.0%) | 0 (0.0%) |
| 11:00 AM to 11:59 AM | 0 (0.0%) | 0 (0.0%) |
| 12:00 PM to 3:59 PM | 0 (0.0%) | 0 (0.0%) |
| 4:00 PM to 11:59 PM | 0 (0.0%) | 0 (0.0%) |
| Total | 69 (100.0%) | 92 (100.0%) |
Housing Occupancy in Red Mesa
Occupancy by Ownership in Red Mesa
Of the total 138 dwellings in Red Mesa, owner-occupied units account for 23 (16.7%), while renter-occupied units make up 115 (83.3%).
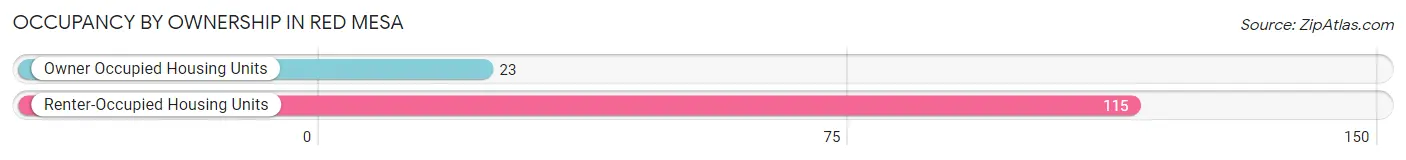
| Occupancy | # Housing Units | % Housing Units |
| Owner Occupied Housing Units | 23 | 16.7% |
| Renter-Occupied Housing Units | 115 | 83.3% |
| Total Occupied Housing Units | 138 | 100.0% |
Occupancy by Household Size in Red Mesa
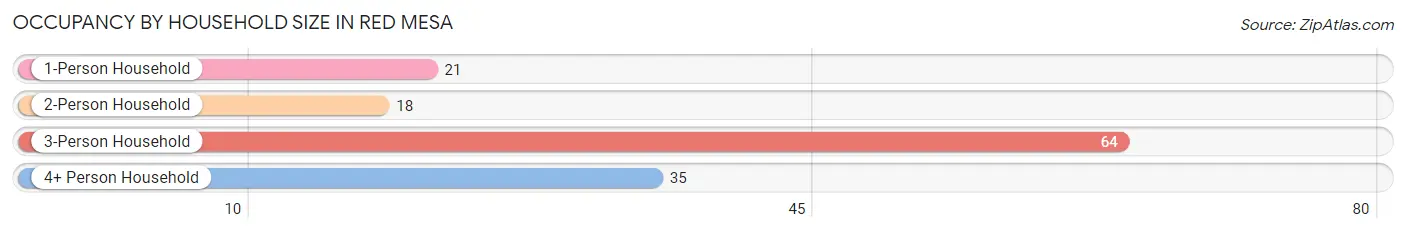
| Household Size | # Housing Units | % Housing Units |
| 1-Person Household | 21 | 15.2% |
| 2-Person Household | 18 | 13.0% |
| 3-Person Household | 64 | 46.4% |
| 4+ Person Household | 35 | 25.4% |
| Total Housing Units | 138 | 100.0% |
Occupancy by Ownership by Household Size in Red Mesa
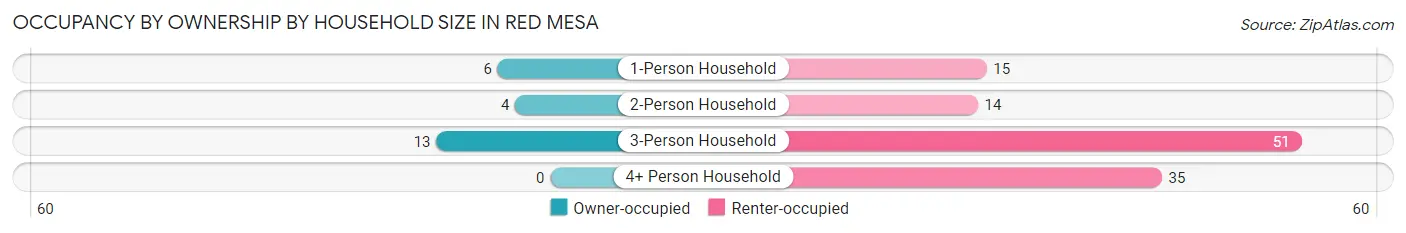
| Household Size | Owner-occupied | Renter-occupied |
| 1-Person Household | 6 (28.6%) | 15 (71.4%) |
| 2-Person Household | 4 (22.2%) | 14 (77.8%) |
| 3-Person Household | 13 (20.3%) | 51 (79.7%) |
| 4+ Person Household | 0 (0.0%) | 35 (100.0%) |
| Total Housing Units | 23 (16.7%) | 115 (83.3%) |
Occupancy by Educational Attainment in Red Mesa
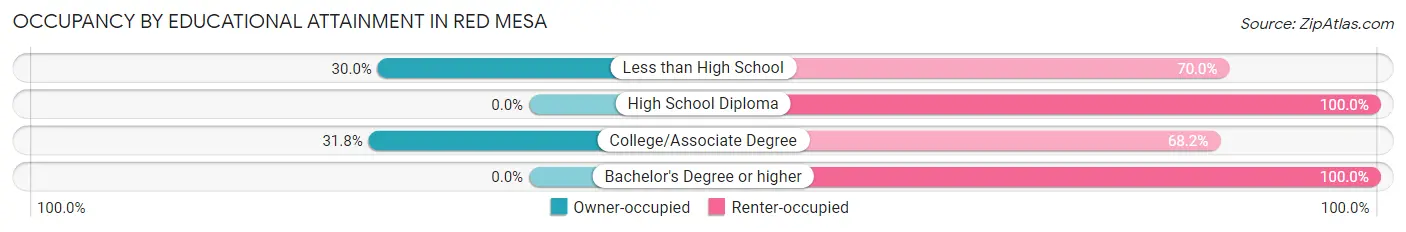
| Household Size | Owner-occupied | Renter-occupied |
| Less than High School | 9 (30.0%) | 21 (70.0%) |
| High School Diploma | 0 (0.0%) | 6 (100.0%) |
| College/Associate Degree | 14 (31.8%) | 30 (68.2%) |
| Bachelor's Degree or higher | 0 (0.0%) | 58 (100.0%) |
Occupancy by Age of Householder in Red Mesa
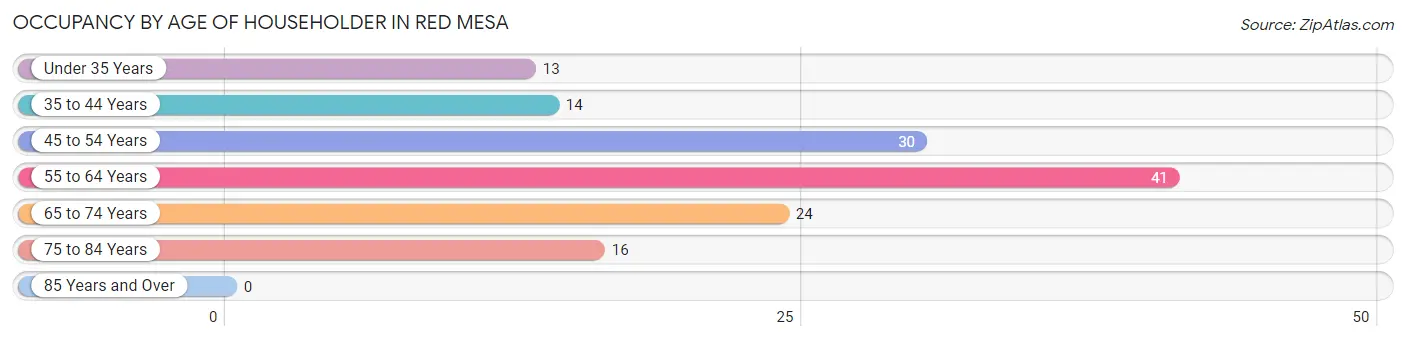
| Age Bracket | # Households | % Households |
| Under 35 Years | 13 | 9.4% |
| 35 to 44 Years | 14 | 10.1% |
| 45 to 54 Years | 30 | 21.7% |
| 55 to 64 Years | 41 | 29.7% |
| 65 to 74 Years | 24 | 17.4% |
| 75 to 84 Years | 16 | 11.6% |
| 85 Years and Over | 0 | 0.0% |
| Total | 138 | 100.0% |
Housing Finances in Red Mesa
Median Income by Occupancy in Red Mesa
| Occupancy Type | # Households | Median Income |
| Owner-Occupied | 23 (16.7%) | $0 |
| Renter-Occupied | 115 (83.3%) | $73,359 |
| Average | 138 (100.0%) | $69,659 |
Occupancy by Householder Income Bracket in Red Mesa
| Income Bracket | Owner-occupied | Renter-occupied |
| Less than $5,000 | 0 (0.0%) | 5 (4.3%) |
| $5,000 to $9,999 | 8 (34.8%) | 0 (0.0%) |
| $10,000 to $14,999 | 6 (26.1%) | 9 (7.8%) |
| $15,000 to $19,999 | 0 (0.0%) | 2 (1.7%) |
| $20,000 to $24,999 | 0 (0.0%) | 0 (0.0%) |
| $25,000 to $34,999 | 0 (0.0%) | 0 (0.0%) |
| $35,000 to $49,999 | 0 (0.0%) | 10 (8.7%) |
| $50,000 to $74,999 | 6 (26.1%) | 42 (36.5%) |
| $75,000 to $99,999 | 3 (13.0%) | 4 (3.5%) |
| $100,000 to $149,999 | 0 (0.0%) | 30 (26.1%) |
| $150,000 or more | 0 (0.0%) | 13 (11.3%) |
| Total | 23 (100.0%) | 115 (100.0%) |
Monthly Housing Cost Tiers in Red Mesa
| Monthly Cost | Owner-occupied | Renter-occupied |
| Less than $300 | 19 (82.6%) | 19 (16.5%) |
| $300 to $499 | 1 (4.3%) | 27 (23.5%) |
| $500 to $799 | 0 (0.0%) | 4 (3.5%) |
| $800 to $999 | 3 (13.0%) | 27 (23.5%) |
| $1,000 to $1,499 | 0 (0.0%) | 30 (26.1%) |
| $1,500 to $1,999 | 0 (0.0%) | 8 (7.0%) |
| $2,000 to $2,499 | 0 (0.0%) | 0 (0.0%) |
| $2,500 to $2,999 | 0 (0.0%) | 0 (0.0%) |
| $3,000 or more | 0 (0.0%) | 0 (0.0%) |
| Total | 23 (100.0%) | 115 (100.0%) |
Physical Housing Characteristics in Red Mesa
Housing Structures in Red Mesa
| Structure Type | # Housing Units | % Housing Units |
| Single Unit, Detached | 51 | 37.0% |
| Single Unit, Attached | 15 | 10.9% |
| 2 Unit Apartments | 43 | 31.2% |
| 3 or 4 Unit Apartments | 13 | 9.4% |
| 5 to 9 Unit Apartments | 0 | 0.0% |
| 10 or more Apartments | 0 | 0.0% |
| Mobile Home / Other | 16 | 11.6% |
| Total | 138 | 100.0% |
Housing Structures by Occupancy in Red Mesa
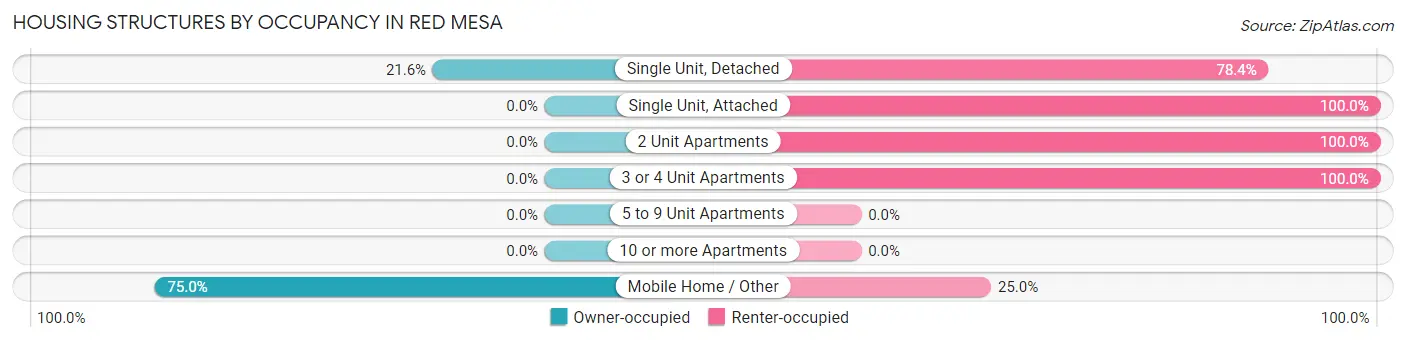
| Structure Type | Owner-occupied | Renter-occupied |
| Single Unit, Detached | 11 (21.6%) | 40 (78.4%) |
| Single Unit, Attached | 0 (0.0%) | 15 (100.0%) |
| 2 Unit Apartments | 0 (0.0%) | 43 (100.0%) |
| 3 or 4 Unit Apartments | 0 (0.0%) | 13 (100.0%) |
| 5 to 9 Unit Apartments | 0 (0.0%) | 0 (0.0%) |
| 10 or more Apartments | 0 (0.0%) | 0 (0.0%) |
| Mobile Home / Other | 12 (75.0%) | 4 (25.0%) |
| Total | 23 (16.7%) | 115 (83.3%) |
Housing Structures by Number of Rooms in Red Mesa
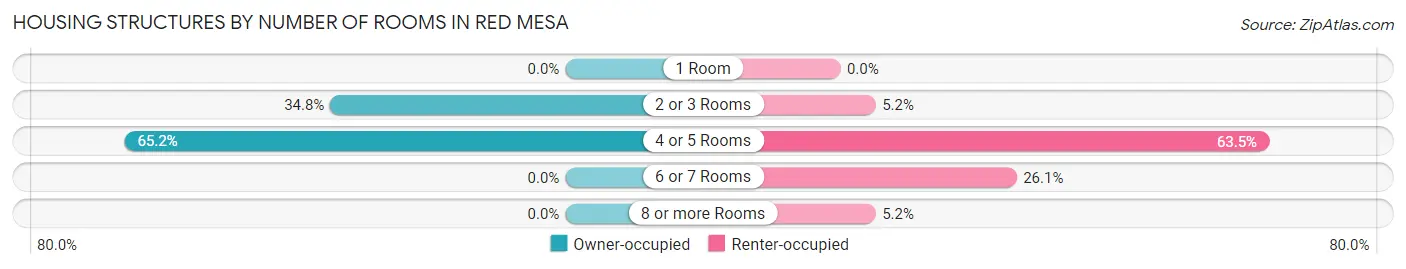
| Number of Rooms | Owner-occupied | Renter-occupied |
| 1 Room | 0 (0.0%) | 0 (0.0%) |
| 2 or 3 Rooms | 8 (34.8%) | 6 (5.2%) |
| 4 or 5 Rooms | 15 (65.2%) | 73 (63.5%) |
| 6 or 7 Rooms | 0 (0.0%) | 30 (26.1%) |
| 8 or more Rooms | 0 (0.0%) | 6 (5.2%) |
| Total | 23 (100.0%) | 115 (100.0%) |
Housing Structure by Heating Type in Red Mesa
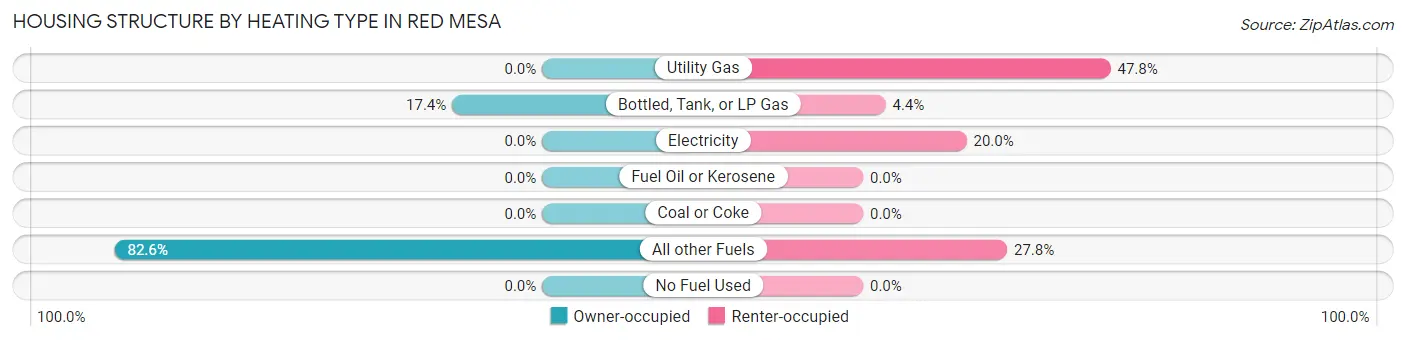
| Heating Type | Owner-occupied | Renter-occupied |
| Utility Gas | 0 (0.0%) | 55 (47.8%) |
| Bottled, Tank, or LP Gas | 4 (17.4%) | 5 (4.3%) |
| Electricity | 0 (0.0%) | 23 (20.0%) |
| Fuel Oil or Kerosene | 0 (0.0%) | 0 (0.0%) |
| Coal or Coke | 0 (0.0%) | 0 (0.0%) |
| All other Fuels | 19 (82.6%) | 32 (27.8%) |
| No Fuel Used | 0 (0.0%) | 0 (0.0%) |
| Total | 23 (100.0%) | 115 (100.0%) |
Household Vehicle Usage in Red Mesa
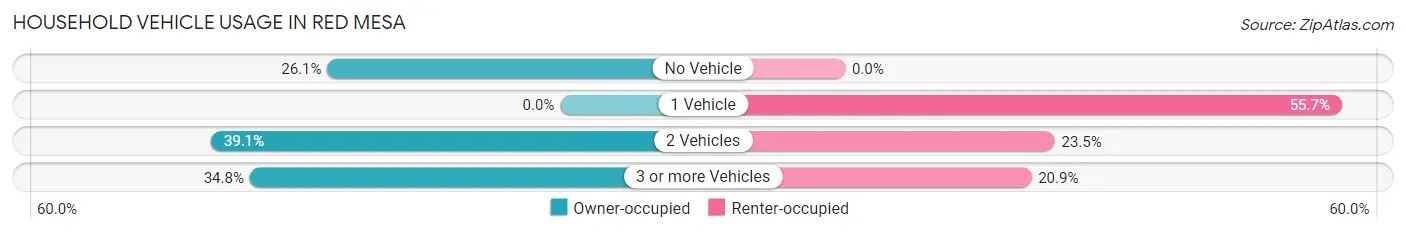
| Vehicles per Household | Owner-occupied | Renter-occupied |
| No Vehicle | 6 (26.1%) | 0 (0.0%) |
| 1 Vehicle | 0 (0.0%) | 64 (55.6%) |
| 2 Vehicles | 9 (39.1%) | 27 (23.5%) |
| 3 or more Vehicles | 8 (34.8%) | 24 (20.9%) |
| Total | 23 (100.0%) | 115 (100.0%) |
Real Estate & Mortgages in Red Mesa
Real Estate and Mortgage Overview in Red Mesa
| Characteristic | Without Mortgage | With Mortgage |
| Housing Units | 20 | 3 |
| Median Property Value | - | - |
| Median Household Income | - | - |
| Monthly Housing Costs | $99 | $0 |
| Real Estate Taxes | - | - |
Property Value by Mortgage Status in Red Mesa
| Property Value | Without Mortgage | With Mortgage |
| Less than $50,000 | 20 (100.0%) | 3 (100.0%) |
| $50,000 to $99,999 | 0 (0.0%) | 0 (0.0%) |
| $100,000 to $299,999 | 0 (0.0%) | 0 (0.0%) |
| $300,000 to $499,999 | 0 (0.0%) | 0 (0.0%) |
| $500,000 to $749,999 | 0 (0.0%) | 0 (0.0%) |
| $750,000 to $999,999 | 0 (0.0%) | 0 (0.0%) |
| $1,000,000 or more | 0 (0.0%) | 0 (0.0%) |
| Total | 20 (100.0%) | 3 (100.0%) |
Household Income by Mortgage Status in Red Mesa
| Household Income | Without Mortgage | With Mortgage |
| Less than $10,000 | 8 (40.0%) | 0 (0.0%) |
| $10,000 to $24,999 | 6 (30.0%) | 0 (0.0%) |
| $25,000 to $34,999 | 0 (0.0%) | 0 (0.0%) |
| $35,000 to $49,999 | 0 (0.0%) | 0 (0.0%) |
| $50,000 to $74,999 | 6 (30.0%) | 0 (0.0%) |
| $75,000 to $99,999 | 0 (0.0%) | 0 (0.0%) |
| $100,000 to $149,999 | 0 (0.0%) | 3 (100.0%) |
| $150,000 or more | 0 (0.0%) | 0 (0.0%) |
| Total | 20 (100.0%) | 3 (100.0%) |
Property Value to Household Income Ratio in Red Mesa
| Value-to-Income Ratio | Without Mortgage | With Mortgage |
| Less than 2.0x | 14 (70.0%) | 0 (0.0%) |
| 2.0x to 2.9x | 0 (0.0%) | 3 (100.0%) |
| 3.0x to 3.9x | 0 (0.0%) | 0 (0.0%) |
| 4.0x or more | 6 (30.0%) | 0 (0.0%) |
| Total | 20 (100.0%) | 3 (100.0%) |
Real Estate Taxes by Mortgage Status in Red Mesa
| Property Taxes | Without Mortgage | With Mortgage |
| Less than $800 | 0 (0.0%) | 0 (0.0%) |
| $800 to $1,499 | 0 (0.0%) | 0 (0.0%) |
| $800 to $1,499 | 0 (0.0%) | 0 (0.0%) |
| Total | 20 (100.0%) | 3 (100.0%) |
Health & Disability in Red Mesa
Health Insurance Coverage by Age in Red Mesa
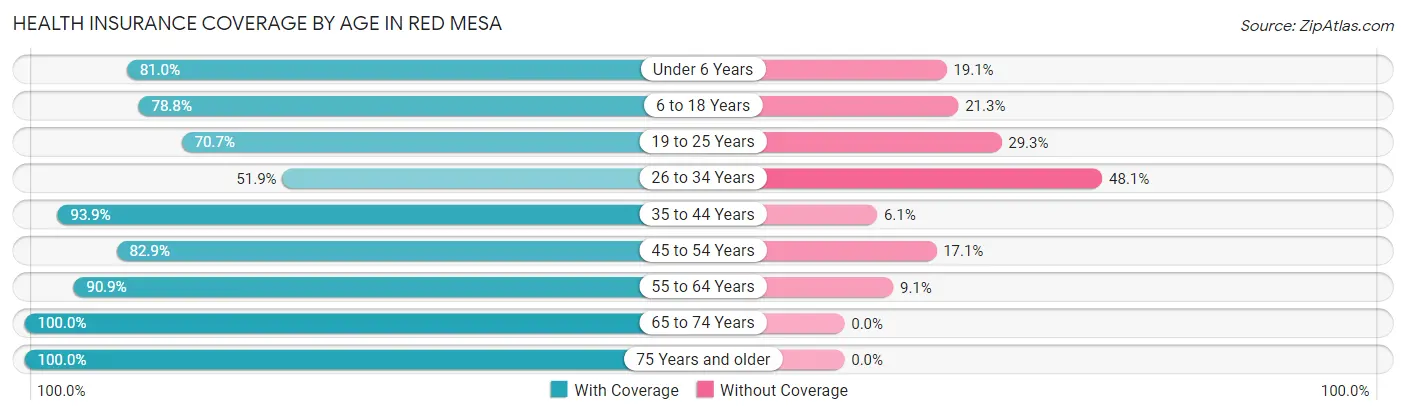
| Age Bracket | With Coverage | Without Coverage |
| Under 6 Years | 34 (80.9%) | 8 (19.1%) |
| 6 to 18 Years | 63 (78.7%) | 17 (21.2%) |
| 19 to 25 Years | 29 (70.7%) | 12 (29.3%) |
| 26 to 34 Years | 27 (51.9%) | 25 (48.1%) |
| 35 to 44 Years | 77 (93.9%) | 5 (6.1%) |
| 45 to 54 Years | 58 (82.9%) | 12 (17.1%) |
| 55 to 64 Years | 50 (90.9%) | 5 (9.1%) |
| 65 to 74 Years | 46 (100.0%) | 0 (0.0%) |
| 75 Years and older | 26 (100.0%) | 0 (0.0%) |
| Total | 410 (83.0%) | 84 (17.0%) |
Health Insurance Coverage by Citizenship Status in Red Mesa
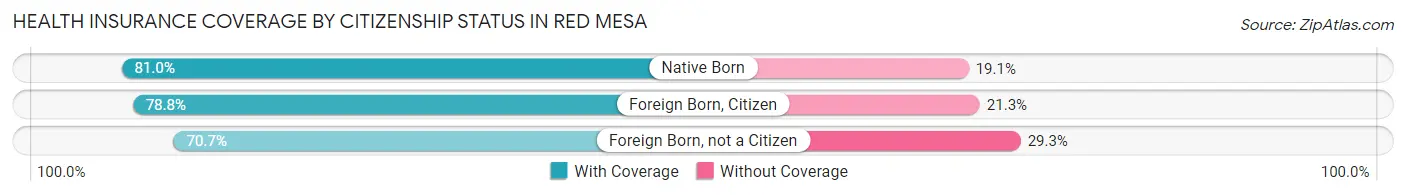
| Citizenship Status | With Coverage | Without Coverage |
| Native Born | 34 (80.9%) | 8 (19.1%) |
| Foreign Born, Citizen | 63 (78.7%) | 17 (21.2%) |
| Foreign Born, not a Citizen | 29 (70.7%) | 12 (29.3%) |
Health Insurance Coverage by Household Income in Red Mesa
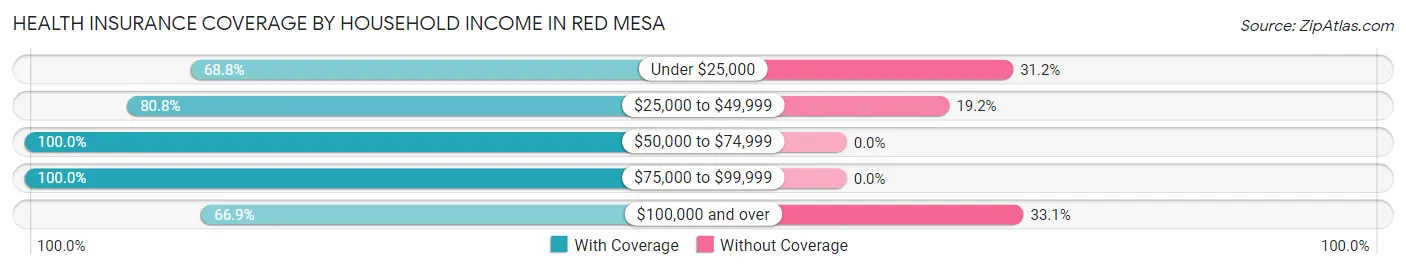
| Household Income | With Coverage | Without Coverage |
| Under $25,000 | 64 (68.8%) | 29 (31.2%) |
| $25,000 to $49,999 | 21 (80.8%) | 5 (19.2%) |
| $50,000 to $74,999 | 191 (100.0%) | 0 (0.0%) |
| $75,000 to $99,999 | 33 (100.0%) | 0 (0.0%) |
| $100,000 and over | 101 (66.9%) | 50 (33.1%) |
Public vs Private Health Insurance Coverage by Age in Red Mesa
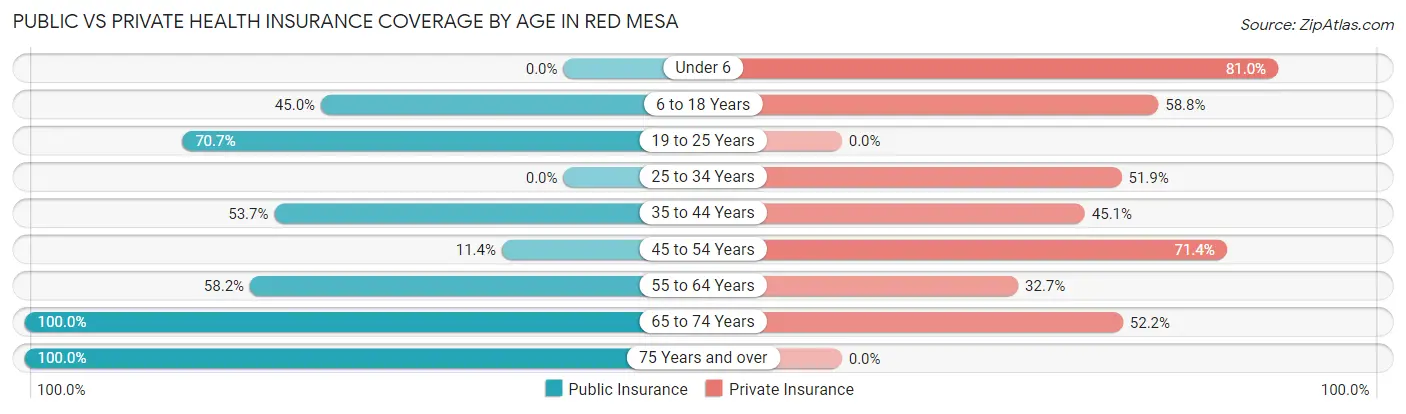
| Age Bracket | Public Insurance | Private Insurance |
| Under 6 | 0 (0.0%) | 34 (80.9%) |
| 6 to 18 Years | 36 (45.0%) | 47 (58.8%) |
| 19 to 25 Years | 29 (70.7%) | 0 (0.0%) |
| 25 to 34 Years | 0 (0.0%) | 27 (51.9%) |
| 35 to 44 Years | 44 (53.7%) | 37 (45.1%) |
| 45 to 54 Years | 8 (11.4%) | 50 (71.4%) |
| 55 to 64 Years | 32 (58.2%) | 18 (32.7%) |
| 65 to 74 Years | 46 (100.0%) | 24 (52.2%) |
| 75 Years and over | 26 (100.0%) | 0 (0.0%) |
| Total | 221 (44.7%) | 237 (48.0%) |
Disability Status by Sex by Age in Red Mesa
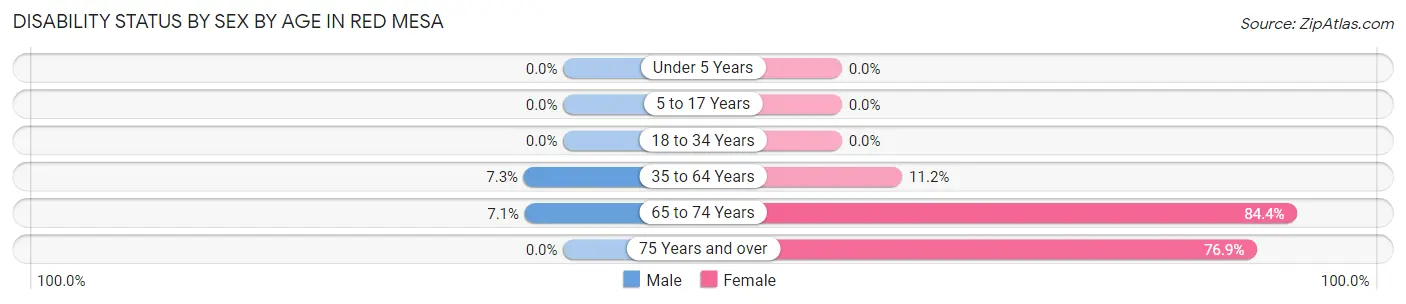
| Age Bracket | Male | Female |
| Under 5 Years | 0 (0.0%) | 0 (0.0%) |
| 5 to 17 Years | 0 (0.0%) | 0 (0.0%) |
| 18 to 34 Years | 0 (0.0%) | 0 (0.0%) |
| 35 to 64 Years | 6 (7.3%) | 14 (11.2%) |
| 65 to 74 Years | 1 (7.1%) | 27 (84.4%) |
| 75 Years and over | 0 (0.0%) | 20 (76.9%) |
Disability Class by Sex by Age in Red Mesa
Disability Class: Hearing Difficulty
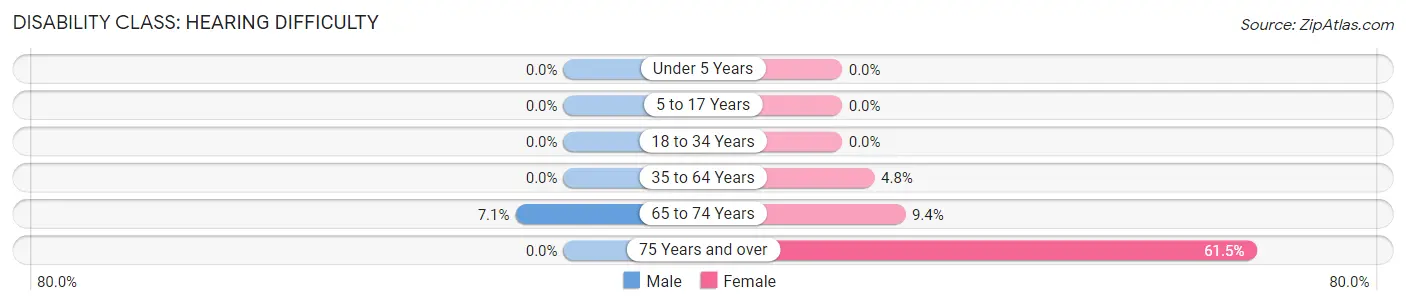
| Age Bracket | Male | Female |
| Under 5 Years | 0 (0.0%) | 0 (0.0%) |
| 5 to 17 Years | 0 (0.0%) | 0 (0.0%) |
| 18 to 34 Years | 0 (0.0%) | 0 (0.0%) |
| 35 to 64 Years | 0 (0.0%) | 6 (4.8%) |
| 65 to 74 Years | 1 (7.1%) | 3 (9.4%) |
| 75 Years and over | 0 (0.0%) | 16 (61.5%) |
Disability Class: Vision Difficulty
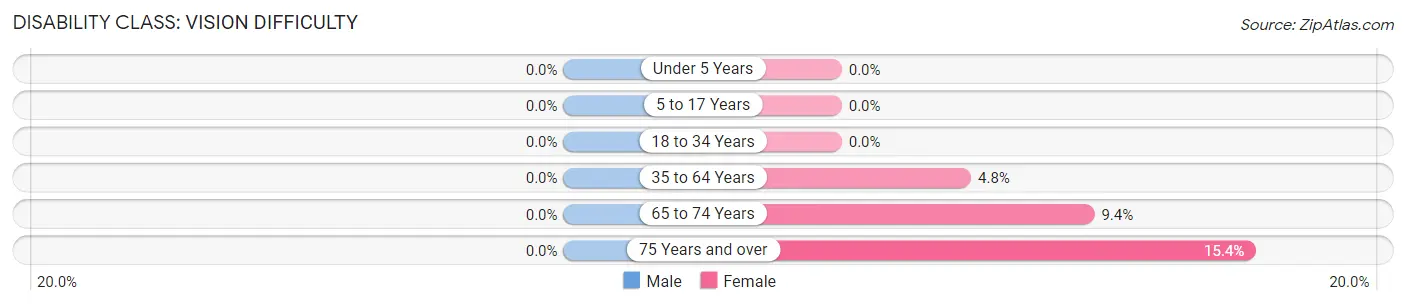
| Age Bracket | Male | Female |
| Under 5 Years | 0 (0.0%) | 0 (0.0%) |
| 5 to 17 Years | 0 (0.0%) | 0 (0.0%) |
| 18 to 34 Years | 0 (0.0%) | 0 (0.0%) |
| 35 to 64 Years | 0 (0.0%) | 6 (4.8%) |
| 65 to 74 Years | 0 (0.0%) | 3 (9.4%) |
| 75 Years and over | 0 (0.0%) | 4 (15.4%) |
Disability Class: Cognitive Difficulty
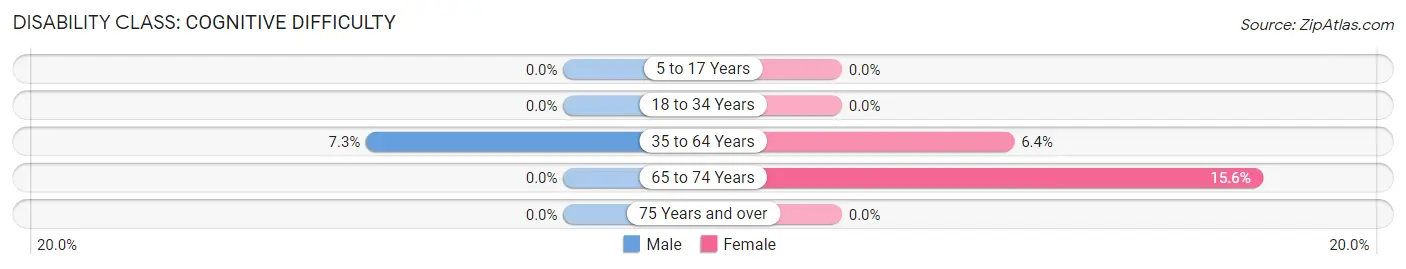
| Age Bracket | Male | Female |
| 5 to 17 Years | 0 (0.0%) | 0 (0.0%) |
| 18 to 34 Years | 0 (0.0%) | 0 (0.0%) |
| 35 to 64 Years | 6 (7.3%) | 8 (6.4%) |
| 65 to 74 Years | 0 (0.0%) | 5 (15.6%) |
| 75 Years and over | 0 (0.0%) | 0 (0.0%) |
Disability Class: Ambulatory Difficulty
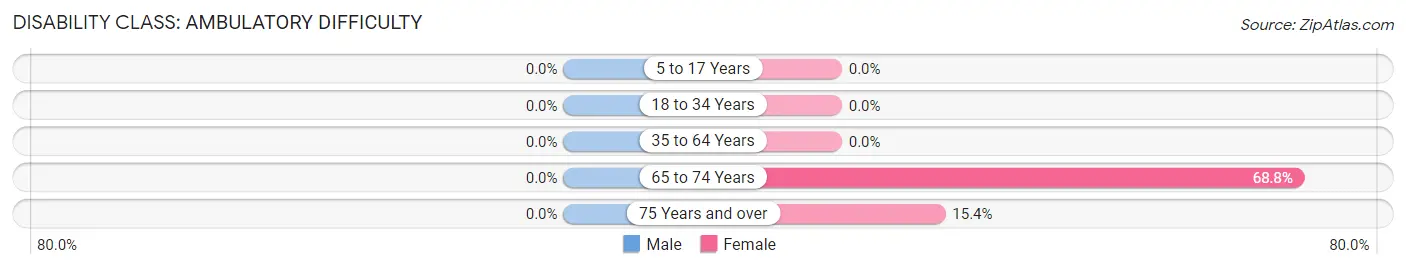
| Age Bracket | Male | Female |
| 5 to 17 Years | 0 (0.0%) | 0 (0.0%) |
| 18 to 34 Years | 0 (0.0%) | 0 (0.0%) |
| 35 to 64 Years | 0 (0.0%) | 0 (0.0%) |
| 65 to 74 Years | 0 (0.0%) | 22 (68.8%) |
| 75 Years and over | 0 (0.0%) | 4 (15.4%) |
Disability Class: Self-Care Difficulty
| Age Bracket | Male | Female |
| 5 to 17 Years | 0 (0.0%) | 0 (0.0%) |
| 18 to 34 Years | 0 (0.0%) | 0 (0.0%) |
| 35 to 64 Years | 0 (0.0%) | 0 (0.0%) |
| 65 to 74 Years | 0 (0.0%) | 0 (0.0%) |
| 75 Years and over | 0 (0.0%) | 0 (0.0%) |
Technology Access in Red Mesa
Computing Device Access in Red Mesa
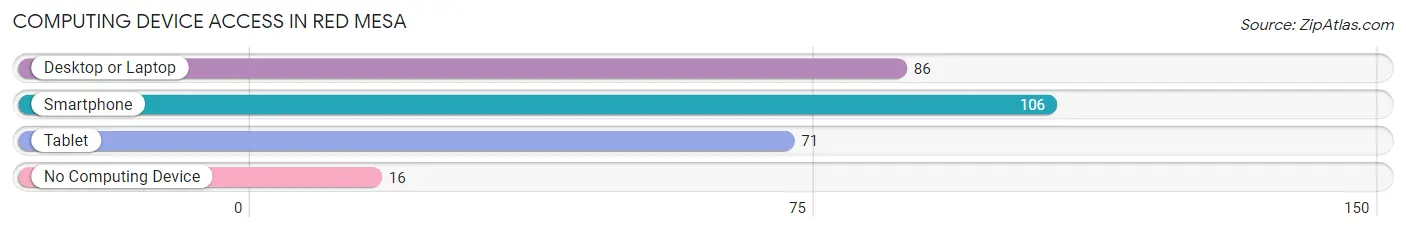
| Device Type | # Households | % Households |
| Desktop or Laptop | 86 | 62.3% |
| Smartphone | 106 | 76.8% |
| Tablet | 71 | 51.4% |
| No Computing Device | 16 | 11.6% |
| Total | 138 | 100.0% |
Internet Access in Red Mesa
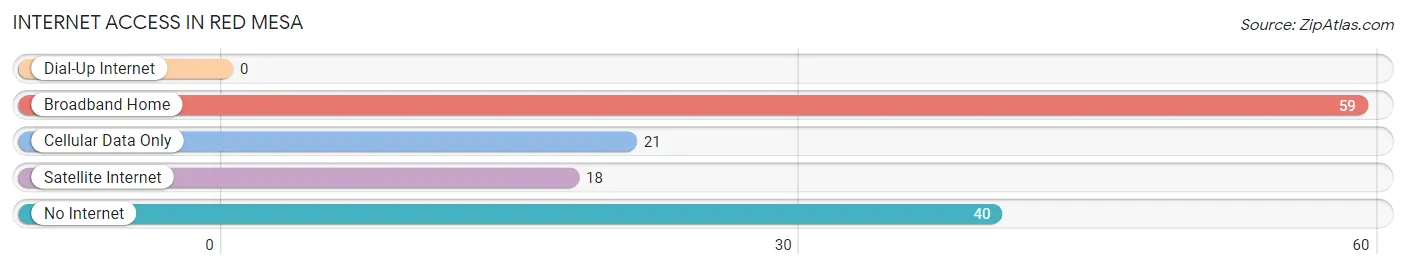
| Internet Type | # Households | % Households |
| Dial-Up Internet | 0 | 0.0% |
| Broadband Home | 59 | 42.7% |
| Cellular Data Only | 21 | 15.2% |
| Satellite Internet | 18 | 13.0% |
| No Internet | 40 | 29.0% |
| Total | 138 | 100.0% |
Red Mesa Summary
Mesa, Arizona is a city located in Maricopa County, Arizona, United States. It is a suburb of Phoenix and is the third-largest city in Arizona. The city is located in the Salt River Valley, near the confluence of the Salt and Gila Rivers. It is bordered by Tempe on the west, the Salt River Pima-Maricopa Indian Community on the north, Chandler and Gilbert on the south, and Apache Junction on the east.
History
Mesa was founded in 1878 by Mormon settlers who were sent by Brigham Young to establish a settlement in the Salt River Valley. The settlers named the area after the Spanish word for “table”, mesa, due to the flat-topped hills in the area. The city was incorporated in 1883 and has grown steadily since then.
Geography
Mesa is located in the Salt River Valley, near the confluence of the Salt and Gila Rivers. It is bordered by Tempe on the west, the Salt River Pima-Maricopa Indian Community on the north, Chandler and Gilbert on the south, and Apache Junction on the east. The city has a total area of 131.3 square miles, of which 130.7 square miles is land and 0.6 square miles is water.
The city is located in the Sonoran Desert, and the climate is hot and dry. Summers are hot and dry, with temperatures reaching up to 110°F. Winters are mild, with temperatures rarely dropping below freezing.
Economy
Mesa’s economy is largely based on tourism, manufacturing, and technology. The city is home to several major employers, including Boeing, Intel, and Motorola. The city also has a large retail sector, with several shopping malls and outlets.
Demographics
As of the 2010 census, the population of Mesa was 439,041. The racial makeup of the city was 73.3% White, 4.7% African American, 1.3% Native American, 2.2% Asian, 0.2% Pacific Islander, 15.2% from other races, and 3.2% from two or more races. Hispanic or Latino of any race were 30.8% of the population.
The median income for a household in the city was $45,744, and the median income for a family was $51,817. The per capita income for the city was $21,845. About 11.2% of families and 14.9% of the population were below the poverty line, including 19.2% of those under age 18 and 8.2% of those age 65 or over.
Mesa is a diverse city, with a variety of cultures and backgrounds. The city is home to a large Mormon population, as well as a large Hispanic population. The city also has a large Native American population, with the Salt River Pima-Maricopa Indian Community located just north of the city.
Common Questions
What is Per Capita Income in Red Mesa?
Per Capita income in Red Mesa is $23,064.
What is the Median Family Income in Red Mesa?
Median Family Income in Red Mesa is $69,934.
What is the Median Household income in Red Mesa?
Median Household Income in Red Mesa is $69,659.
What is Income or Wage Gap in Red Mesa?
Income or Wage Gap in Red Mesa is 32.9%.
Women in Red Mesa earn 67.1 cents for every dollar earned by a man.
What is Inequality or Gini Index in Red Mesa?
Inequality or Gini Index in Red Mesa is 0.38.
What is the Total Population of Red Mesa?
Total Population of Red Mesa is 494.
What is the Total Male Population of Red Mesa?
Total Male Population of Red Mesa is 260.
What is the Total Female Population of Red Mesa?
Total Female Population of Red Mesa is 234.
What is the Ratio of Males per 100 Females in Red Mesa?
There are 111.11 Males per 100 Females in Red Mesa.
What is the Ratio of Females per 100 Males in Red Mesa?
There are 90.00 Females per 100 Males in Red Mesa.
What is the Median Population Age in Red Mesa?
Median Population Age in Red Mesa is 39.6 Years.
What is the Average Family Size in Red Mesa
Average Family Size in Red Mesa is 4.0 People.
What is the Average Household Size in Red Mesa
Average Household Size in Red Mesa is 3.6 People.
How Large is the Labor Force in Red Mesa?
There are 214 People in the Labor Forcein in Red Mesa.
What is the Percentage of People in the Labor Force in Red Mesa?
55.3% of People are in the Labor Force in Red Mesa.
What is the Unemployment Rate in Red Mesa?
Unemployment Rate in Red Mesa is 14.5%.