Cienega Springs, AZ Map & Demographics
Cienega Springs Map
Cienega Springs Overview
$35,401
PER CAPITA INCOME
$75,573
AVG FAMILY INCOME
$47,438
AVG HOUSEHOLD INCOME
7.3%
WAGE / INCOME GAP [ % ]
92.7¢/ $1
WAGE / INCOME GAP [ $ ]
0.42
INEQUALITY / GINI INDEX
1,441
TOTAL POPULATION
835
MALE POPULATION
606
FEMALE POPULATION
137.79
MALES / 100 FEMALES
72.57
FEMALES / 100 MALES
59.9
MEDIAN AGE
2.1
AVG FAMILY SIZE
1.6
AVG HOUSEHOLD SIZE
522
LABOR FORCE [ PEOPLE ]
41.0%
PERCENT IN LABOR FORCE
2.3%
UNEMPLOYMENT RATE
Income in Cienega Springs
Income Overview in Cienega Springs
Per Capita Income in Cienega Springs is $35,401, while median incomes of families and households are $75,573 and $47,438 respectively.
| Characteristic | Number | Measure |
| Per Capita Income | 1,441 | $35,401 |
| Median Family Income | 377 | $75,573 |
| Mean Family Income | 377 | $91,606 |
| Median Household Income | 874 | $47,438 |
| Mean Household Income | 874 | $65,013 |
| Income Deficit | 377 | $0 |
| Wage / Income Gap (%) | 1,441 | 7.33% |
| Wage / Income Gap ($) | 1,441 | 92.67¢ per $1 |
| Gini / Inequality Index | 1,441 | 0.42 |
Earnings by Sex in Cienega Springs
Average Earnings in Cienega Springs are $35,481, $37,917 for men and $35,139 for women, a difference of 7.3%.
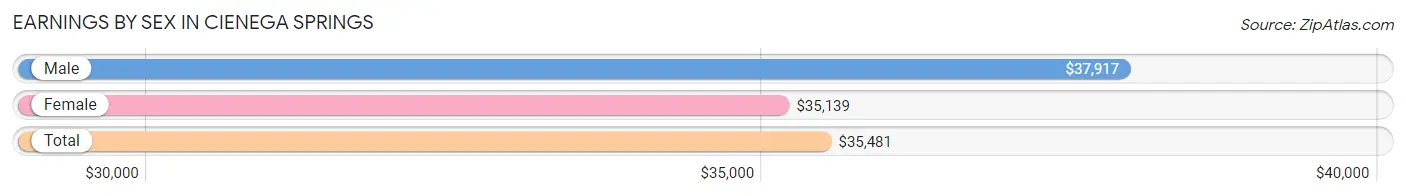
| Sex | Number | Average Earnings |
| Male | 273 (51.5%) | $37,917 |
| Female | 257 (48.5%) | $35,139 |
| Total | 530 (100.0%) | $35,481 |
Earnings by Sex by Income Bracket in Cienega Springs
The most common earnings brackets in Cienega Springs are $25,000 to $29,999 for men (59 | 21.6%) and $35,000 to $39,999 for women (57 | 22.2%).
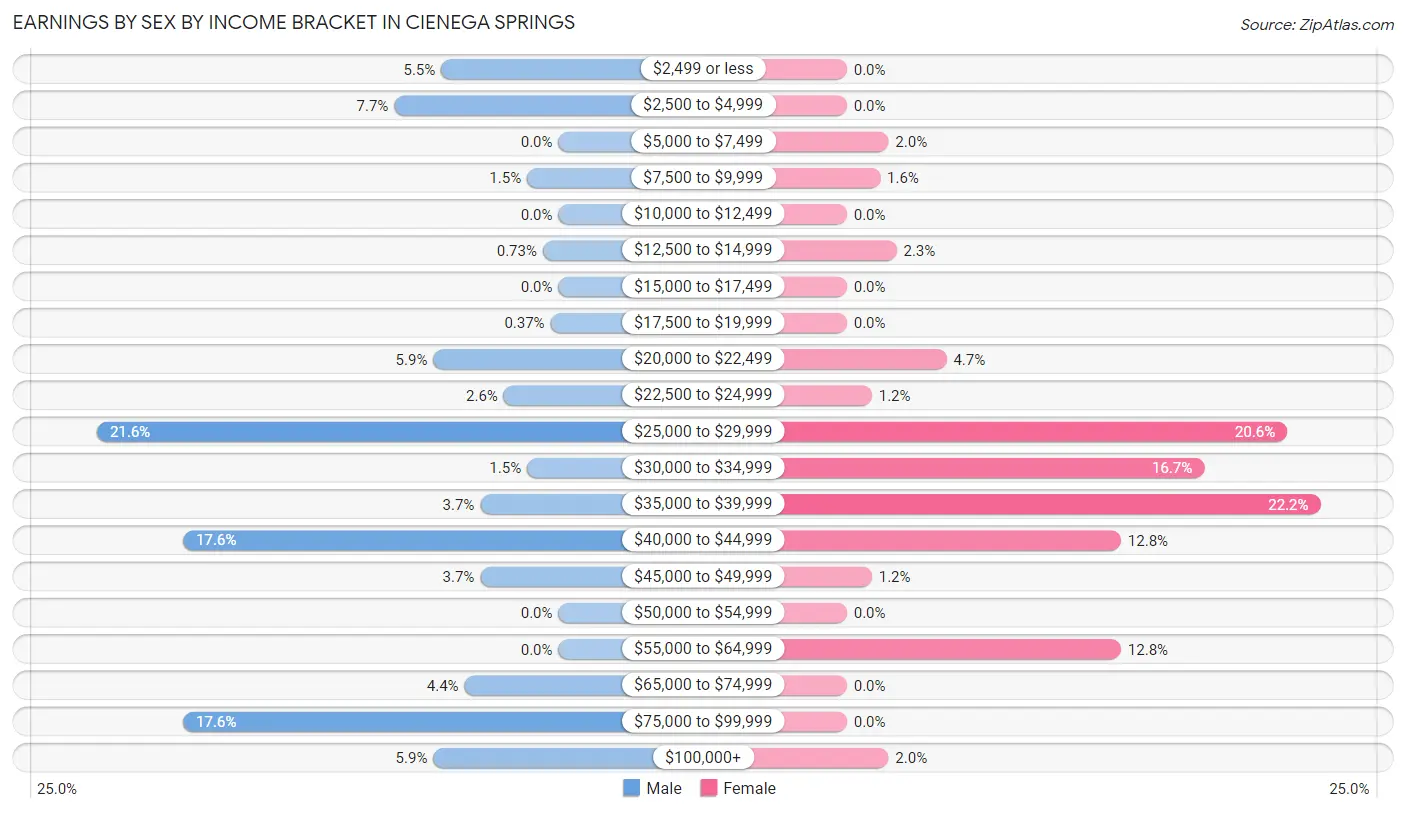
| Income | Male | Female |
| $2,499 or less | 15 (5.5%) | 0 (0.0%) |
| $2,500 to $4,999 | 21 (7.7%) | 0 (0.0%) |
| $5,000 to $7,499 | 0 (0.0%) | 5 (1.9%) |
| $7,500 to $9,999 | 4 (1.5%) | 4 (1.6%) |
| $10,000 to $12,499 | 0 (0.0%) | 0 (0.0%) |
| $12,500 to $14,999 | 2 (0.7%) | 6 (2.3%) |
| $15,000 to $17,499 | 0 (0.0%) | 0 (0.0%) |
| $17,500 to $19,999 | 1 (0.4%) | 0 (0.0%) |
| $20,000 to $22,499 | 16 (5.9%) | 12 (4.7%) |
| $22,500 to $24,999 | 7 (2.6%) | 3 (1.2%) |
| $25,000 to $29,999 | 59 (21.6%) | 53 (20.6%) |
| $30,000 to $34,999 | 4 (1.5%) | 43 (16.7%) |
| $35,000 to $39,999 | 10 (3.7%) | 57 (22.2%) |
| $40,000 to $44,999 | 48 (17.6%) | 33 (12.8%) |
| $45,000 to $49,999 | 10 (3.7%) | 3 (1.2%) |
| $50,000 to $54,999 | 0 (0.0%) | 0 (0.0%) |
| $55,000 to $64,999 | 0 (0.0%) | 33 (12.8%) |
| $65,000 to $74,999 | 12 (4.4%) | 0 (0.0%) |
| $75,000 to $99,999 | 48 (17.6%) | 0 (0.0%) |
| $100,000+ | 16 (5.9%) | 5 (1.9%) |
| Total | 273 (100.0%) | 257 (100.0%) |
Earnings by Sex by Educational Attainment in Cienega Springs
Average earnings in Cienega Springs are $40,900 for men and $35,167 for women, a difference of 14.0%. Men with an educational attainment of bachelor's degree enjoy the highest average annual earnings of $66,458, while those with high school diploma education earn the least with $28,561. Women with an educational attainment of high school diploma earn the most with the average annual earnings of $36,346, while those with college or associate's degree education have the smallest earnings of $27,500.
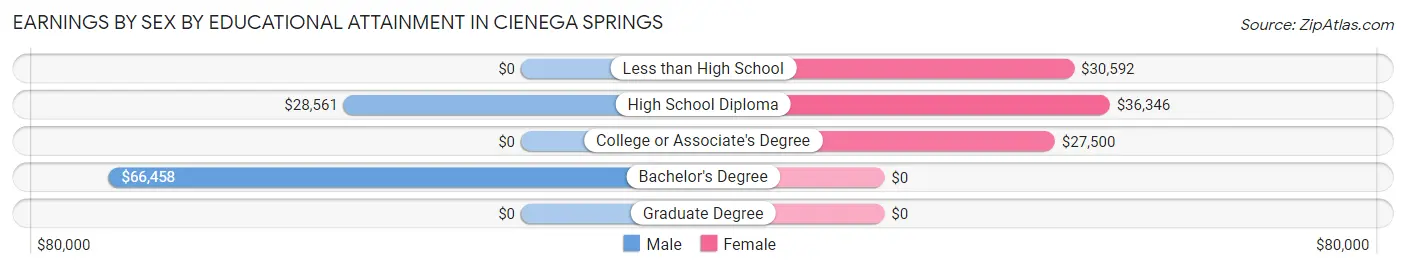
| Educational Attainment | Male Income | Female Income |
| Less than High School | - | - |
| High School Diploma | $28,561 | $36,346 |
| College or Associate's Degree | - | - |
| Bachelor's Degree | $66,458 | $0 |
| Graduate Degree | - | - |
| Total | $40,900 | $35,167 |
Family Income in Cienega Springs
Family Income Brackets in Cienega Springs
According to the Cienega Springs family income data, there are 86 families falling into the $50,000 to $74,999 income range, which is the most common income bracket and makes up 22.8% of all families.
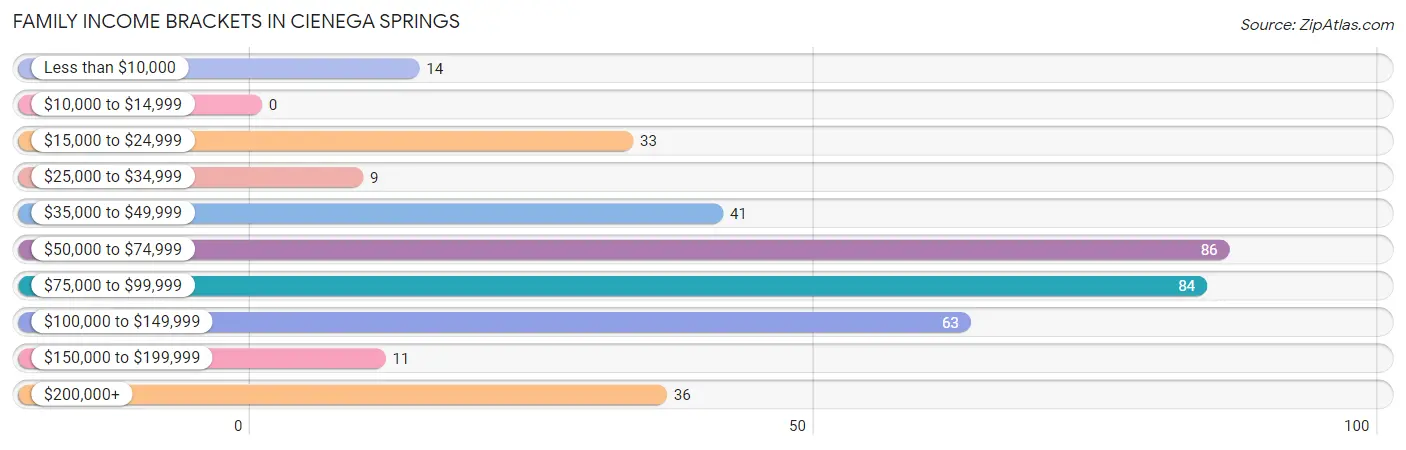
| Income Bracket | # Families | % Families |
| Less than $10,000 | 14 | 3.7% |
| $10,000 to $14,999 | 0 | 0.0% |
| $15,000 to $24,999 | 33 | 8.8% |
| $25,000 to $34,999 | 9 | 2.4% |
| $35,000 to $49,999 | 41 | 10.9% |
| $50,000 to $74,999 | 86 | 22.8% |
| $75,000 to $99,999 | 84 | 22.3% |
| $100,000 to $149,999 | 63 | 16.7% |
| $150,000 to $199,999 | 11 | 2.9% |
| $200,000+ | 36 | 9.5% |
Family Income by Famaliy Size in Cienega Springs
3-person families (55 | 14.6%) account for the highest median family income in Cienega Springs with $75,489 per family, while 2-person families (263 | 69.8%) have the highest median income of $32,467 per family member.
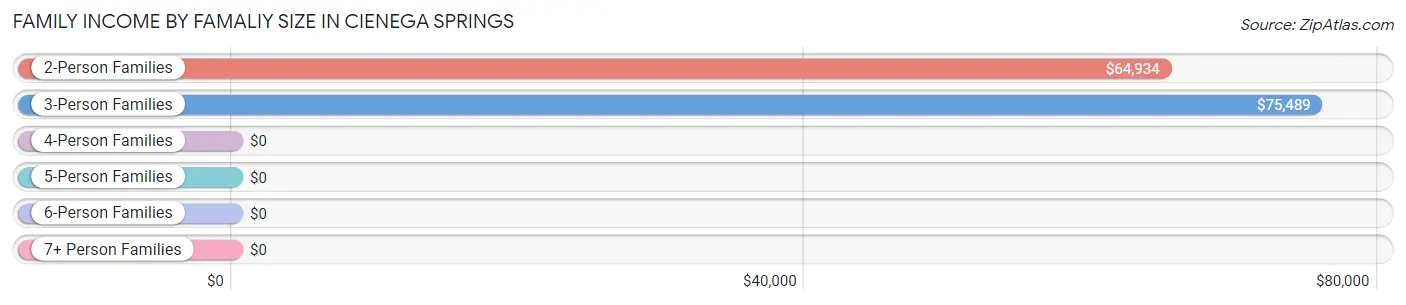
| Income Bracket | # Families | Median Income |
| 2-Person Families | 263 (69.8%) | $64,934 |
| 3-Person Families | 55 (14.6%) | $75,489 |
| 4-Person Families | 30 (8.0%) | $0 |
| 5-Person Families | 6 (1.6%) | $0 |
| 6-Person Families | 23 (6.1%) | $0 |
| 7+ Person Families | 0 (0.0%) | $0 |
| Total | 377 (100.0%) | $75,573 |
Family Income by Number of Earners in Cienega Springs
The median family income in Cienega Springs is $75,573, with families comprising 3+ earners (23) having the highest median family income of $93,839, while families with no earners (78) have the lowest median family income of $56,300, accounting for 6.1% and 20.7% of families, respectively.
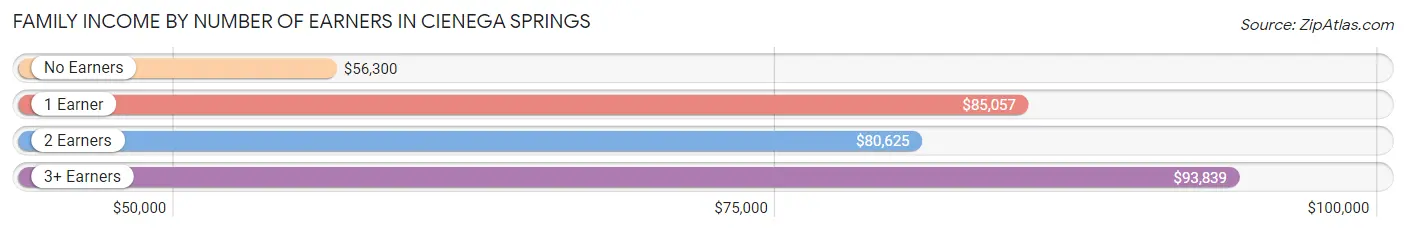
| Number of Earners | # Families | Median Income |
| No Earners | 78 (20.7%) | $56,300 |
| 1 Earner | 179 (47.5%) | $85,057 |
| 2 Earners | 97 (25.7%) | $80,625 |
| 3+ Earners | 23 (6.1%) | $93,839 |
| Total | 377 (100.0%) | $75,573 |
Household Income in Cienega Springs
Household Income Brackets in Cienega Springs
With 216 households falling in the category, the $35,000 to $49,999 income range is the most frequent in Cienega Springs, accounting for 24.7% of all households. In contrast, only 11 households (1.3%) fall into the $150,000 to $199,999 income bracket, making it the least populous group.
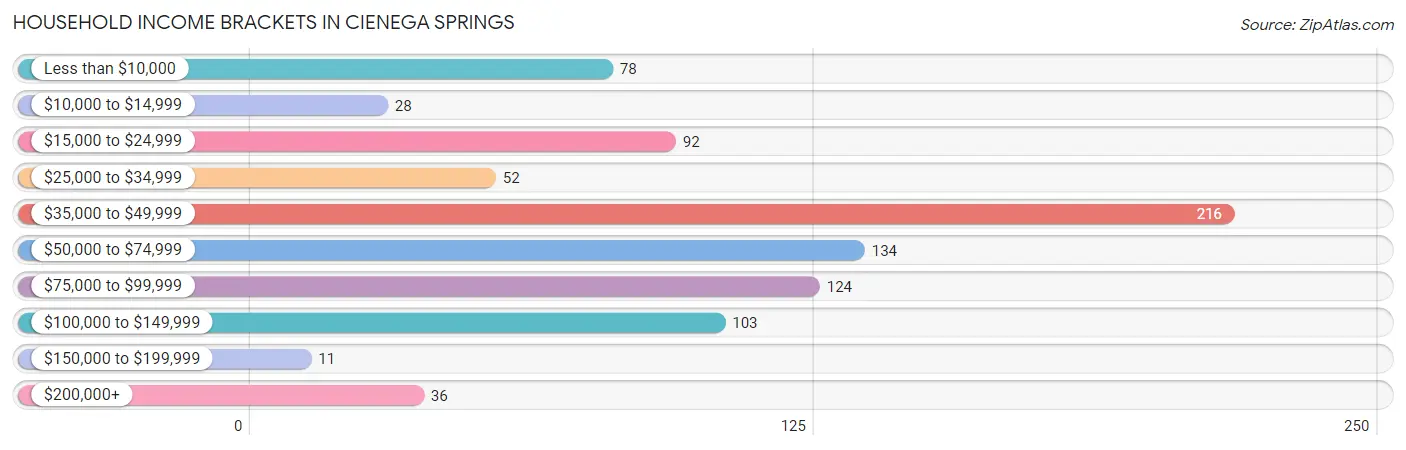
| Income Bracket | # Households | % Households |
| Less than $10,000 | 78 | 8.9% |
| $10,000 to $14,999 | 28 | 3.2% |
| $15,000 to $24,999 | 92 | 10.5% |
| $25,000 to $34,999 | 52 | 5.9% |
| $35,000 to $49,999 | 216 | 24.7% |
| $50,000 to $74,999 | 134 | 15.3% |
| $75,000 to $99,999 | 124 | 14.2% |
| $100,000 to $149,999 | 103 | 11.8% |
| $150,000 to $199,999 | 11 | 1.3% |
| $200,000+ | 36 | 4.1% |
Household Income by Householder Age in Cienega Springs
The median household income in Cienega Springs is $47,438, with the highest median household income of $78,900 found in the 45 to 64 years age bracket for the primary householder. A total of 284 households (32.5%) fall into this category. Meanwhile, the 15 to 24 years age bracket for the primary householder has the lowest median household income of $0, with 16 households (1.8%) in this group.
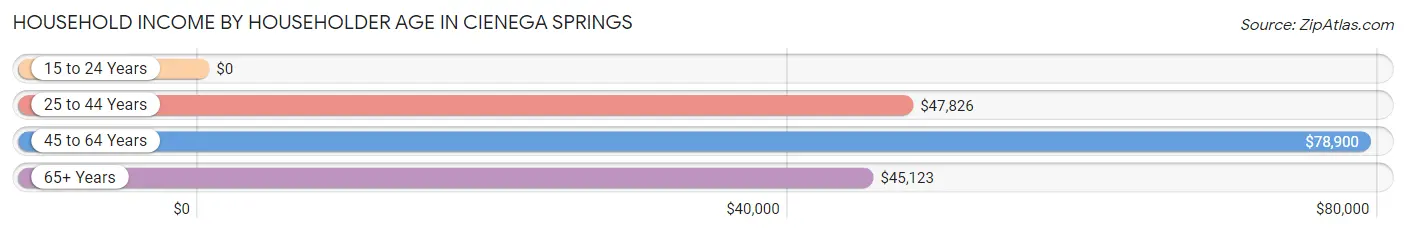
| Income Bracket | # Households | Median Income |
| 15 to 24 Years | 16 (1.8%) | $0 |
| 25 to 44 Years | 128 (14.6%) | $47,826 |
| 45 to 64 Years | 284 (32.5%) | $78,900 |
| 65+ Years | 446 (51.0%) | $45,123 |
| Total | 874 (100.0%) | $47,438 |
Poverty in Cienega Springs
Income Below Poverty by Sex and Age in Cienega Springs
With 17.7% poverty level for males and 19.0% for females among the residents of Cienega Springs, 15 year old males and 6 to 11 year old females are the most vulnerable to poverty, with 67 males (87.0%) and 12 females (100.0%) in their respective age groups living below the poverty level.
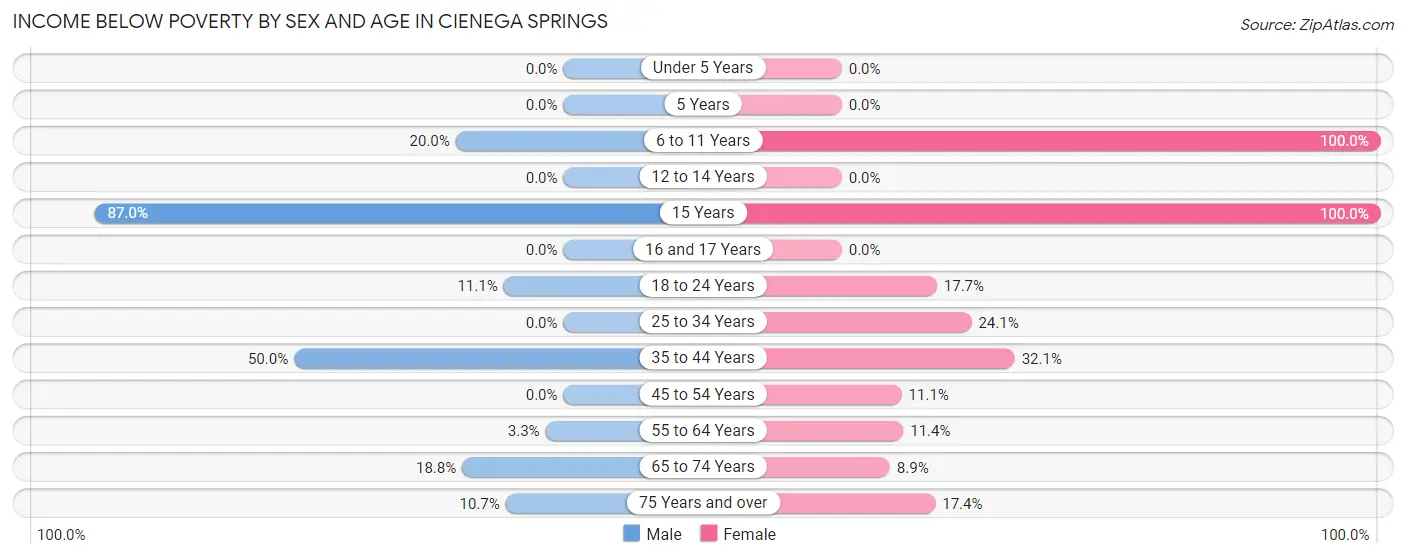
| Age Bracket | Male | Female |
| Under 5 Years | 0 (0.0%) | 0 (0.0%) |
| 5 Years | 0 (0.0%) | 0 (0.0%) |
| 6 to 11 Years | 6 (20.0%) | 12 (100.0%) |
| 12 to 14 Years | 0 (0.0%) | 0 (0.0%) |
| 15 Years | 67 (87.0%) | 9 (100.0%) |
| 16 and 17 Years | 0 (0.0%) | 0 (0.0%) |
| 18 to 24 Years | 2 (11.1%) | 3 (17.6%) |
| 25 to 34 Years | 0 (0.0%) | 13 (24.1%) |
| 35 to 44 Years | 20 (50.0%) | 26 (32.1%) |
| 45 to 54 Years | 0 (0.0%) | 9 (11.1%) |
| 55 to 64 Years | 6 (3.3%) | 21 (11.4%) |
| 65 to 74 Years | 19 (18.8%) | 5 (8.9%) |
| 75 Years and over | 28 (10.7%) | 17 (17.3%) |
| Total | 148 (17.7%) | 115 (19.0%) |
Income Above Poverty by Sex and Age in Cienega Springs
According to the poverty statistics in Cienega Springs, males aged under 5 years and females aged 12 to 14 years are the age groups that are most secure financially, with 100.0% of males and 100.0% of females in these age groups living above the poverty line.
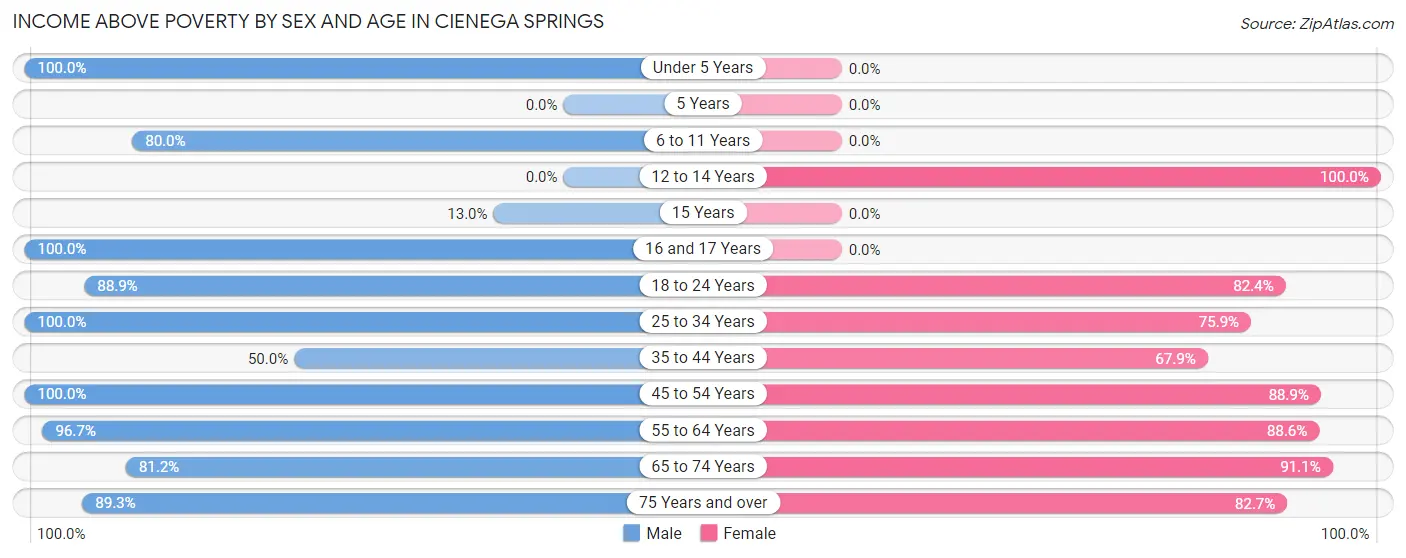
| Age Bracket | Male | Female |
| Under 5 Years | 25 (100.0%) | 0 (0.0%) |
| 5 Years | 0 (0.0%) | 0 (0.0%) |
| 6 to 11 Years | 24 (80.0%) | 0 (0.0%) |
| 12 to 14 Years | 0 (0.0%) | 14 (100.0%) |
| 15 Years | 10 (13.0%) | 0 (0.0%) |
| 16 and 17 Years | 5 (100.0%) | 0 (0.0%) |
| 18 to 24 Years | 16 (88.9%) | 14 (82.4%) |
| 25 to 34 Years | 45 (100.0%) | 41 (75.9%) |
| 35 to 44 Years | 20 (50.0%) | 55 (67.9%) |
| 45 to 54 Years | 53 (100.0%) | 72 (88.9%) |
| 55 to 64 Years | 174 (96.7%) | 163 (88.6%) |
| 65 to 74 Years | 82 (81.2%) | 51 (91.1%) |
| 75 Years and over | 233 (89.3%) | 81 (82.7%) |
| Total | 687 (82.3%) | 491 (81.0%) |
Income Below Poverty Among Married-Couple Families in Cienega Springs
The poverty statistics for married-couple families in Cienega Springs show that 4.0% or 9 of the total 227 families live below the poverty line. Families with no children have the highest poverty rate of 4.9%, comprising of 9 families. On the other hand, families with 1 or 2 children have the lowest poverty rate of 0.0%, which includes 0 families.
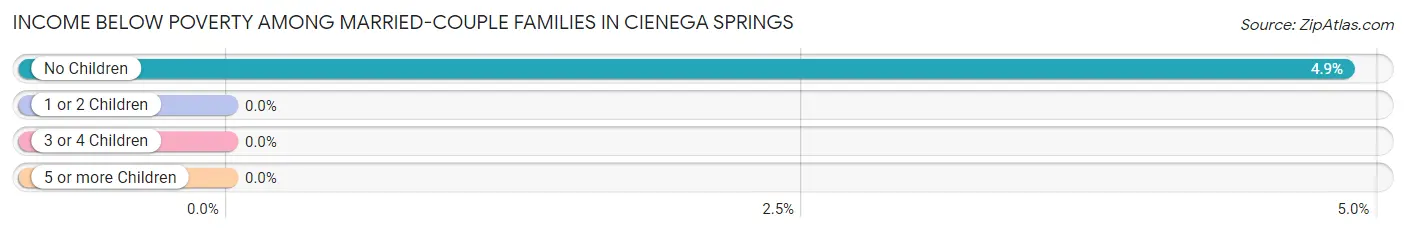
| Children | Above Poverty | Below Poverty |
| No Children | 176 (95.1%) | 9 (4.9%) |
| 1 or 2 Children | 42 (100.0%) | 0 (0.0%) |
| 3 or 4 Children | 0 (0.0%) | 0 (0.0%) |
| 5 or more Children | 0 (0.0%) | 0 (0.0%) |
| Total | 218 (96.0%) | 9 (4.0%) |
Income Below Poverty Among Single-Parent Households in Cienega Springs
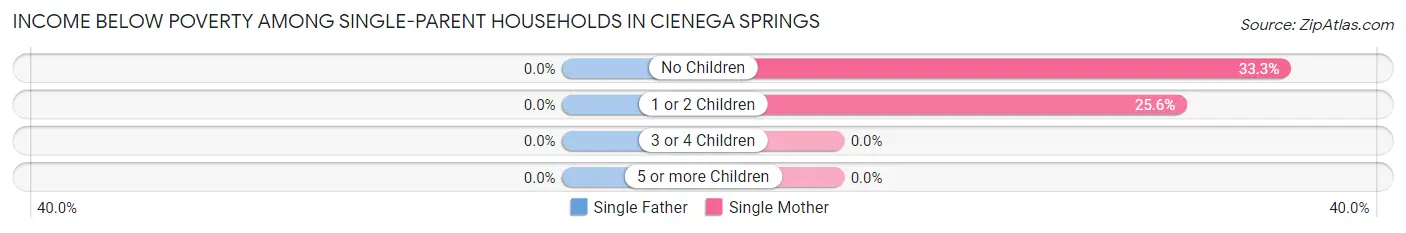
| Children | Single Father | Single Mother |
| No Children | 0 (0.0%) | 23 (33.3%) |
| 1 or 2 Children | 0 (0.0%) | 11 (25.6%) |
| 3 or 4 Children | 0 (0.0%) | 0 (0.0%) |
| 5 or more Children | 0 (0.0%) | 0 (0.0%) |
| Total | 0 (0.0%) | 34 (30.4%) |
Income Below Poverty Among Married-Couple vs Single-Parent Households in Cienega Springs
The poverty data for Cienega Springs shows that 9 of the married-couple family households (4.0%) and 34 of the single-parent households (22.7%) are living below the poverty level. Within the married-couple family households, those with no children have the highest poverty rate, with 9 households (4.9%) falling below the poverty line. Among the single-parent households, those with no children have the highest poverty rate, with 23 household (25.8%) living below poverty.
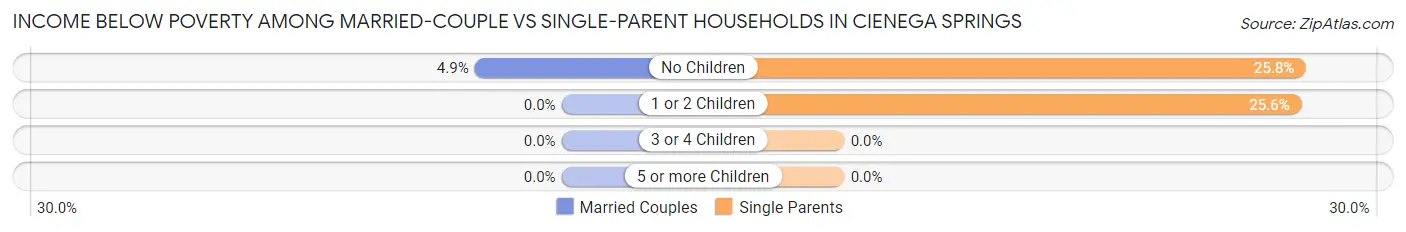
| Children | Married-Couple Families | Single-Parent Households |
| No Children | 9 (4.9%) | 23 (25.8%) |
| 1 or 2 Children | 0 (0.0%) | 11 (25.6%) |
| 3 or 4 Children | 0 (0.0%) | 0 (0.0%) |
| 5 or more Children | 0 (0.0%) | 0 (0.0%) |
| Total | 9 (4.0%) | 34 (22.7%) |
Race in Cienega Springs
The most populous races in Cienega Springs are White / Caucasian (1,219 | 84.6%), Hispanic or Latino (239 | 16.6%), and Some other Race (102 | 7.1%).
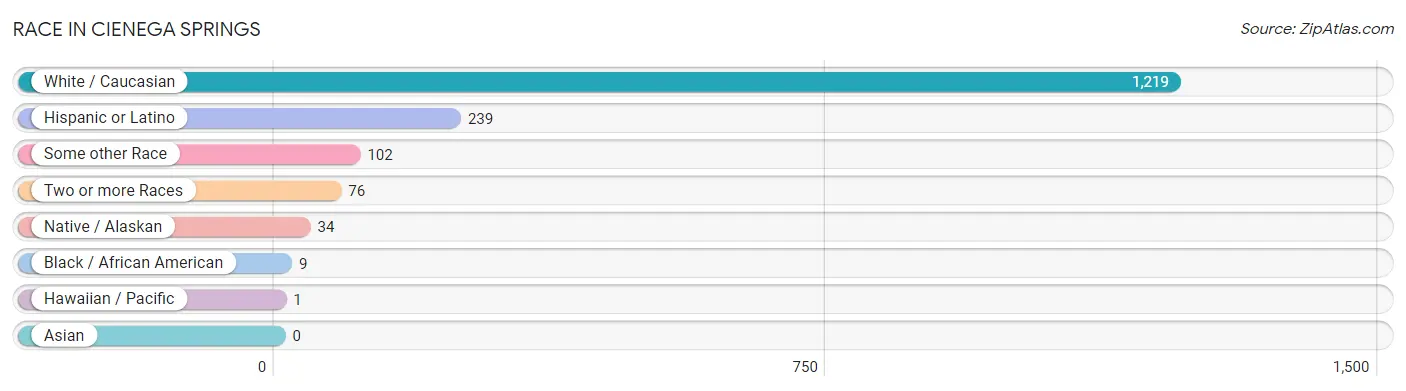
| Race | # Population | % Population |
| Asian | 0 | 0.0% |
| Black / African American | 9 | 0.6% |
| Hawaiian / Pacific | 1 | 0.1% |
| Hispanic or Latino | 239 | 16.6% |
| Native / Alaskan | 34 | 2.4% |
| White / Caucasian | 1,219 | 84.6% |
| Two or more Races | 76 | 5.3% |
| Some other Race | 102 | 7.1% |
| Total | 1,441 | 100.0% |
Ancestry in Cienega Springs
The most populous ancestries reported in Cienega Springs are German (313 | 21.7%), Irish (219 | 15.2%), English (172 | 11.9%), Mexican (158 | 11.0%), and American (88 | 6.1%), together accounting for 65.9% of all Cienega Springs residents.
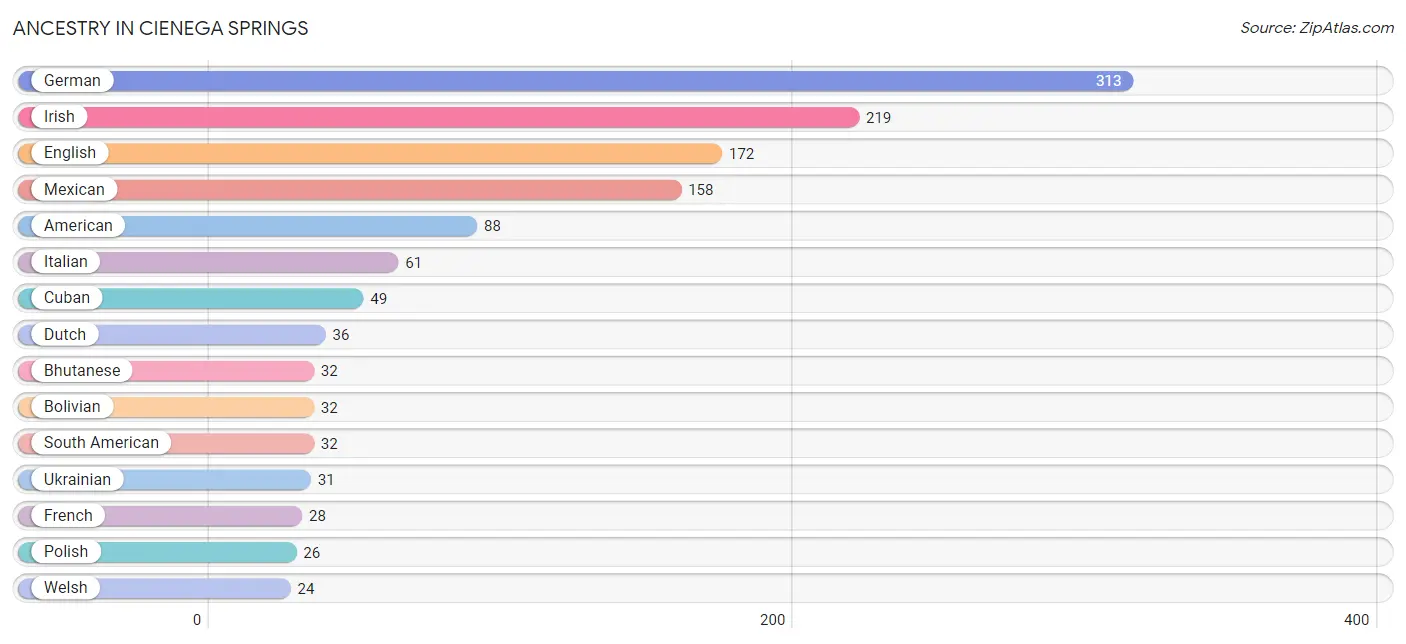
| Ancestry | # Population | % Population |
| American | 88 | 6.1% |
| Belgian | 2 | 0.1% |
| Bhutanese | 32 | 2.2% |
| Bolivian | 32 | 2.2% |
| Cajun | 4 | 0.3% |
| Cuban | 49 | 3.4% |
| Czech | 9 | 0.6% |
| Danish | 3 | 0.2% |
| Dutch | 36 | 2.5% |
| English | 172 | 11.9% |
| European | 11 | 0.8% |
| French | 28 | 1.9% |
| French Canadian | 7 | 0.5% |
| German | 313 | 21.7% |
| Guamanian / Chamorro | 1 | 0.1% |
| Hungarian | 22 | 1.5% |
| Irish | 219 | 15.2% |
| Italian | 61 | 4.2% |
| Mexican | 158 | 11.0% |
| Norwegian | 11 | 0.8% |
| Polish | 26 | 1.8% |
| Russian | 7 | 0.5% |
| Scotch-Irish | 2 | 0.1% |
| Scottish | 19 | 1.3% |
| South American | 32 | 2.2% |
| Swedish | 3 | 0.2% |
| Swiss | 8 | 0.6% |
| Ukrainian | 31 | 2.1% |
| Welsh | 24 | 1.7% | View All 29 Rows |
Immigrants in Cienega Springs
The most numerous immigrant groups reported in Cienega Springs came from Canada (38 | 2.6%), Europe (25 | 1.7%), Germany (20 | 1.4%), Western Europe (20 | 1.4%), and Central America (9 | 0.6%), together accounting for 7.8% of all Cienega Springs residents.
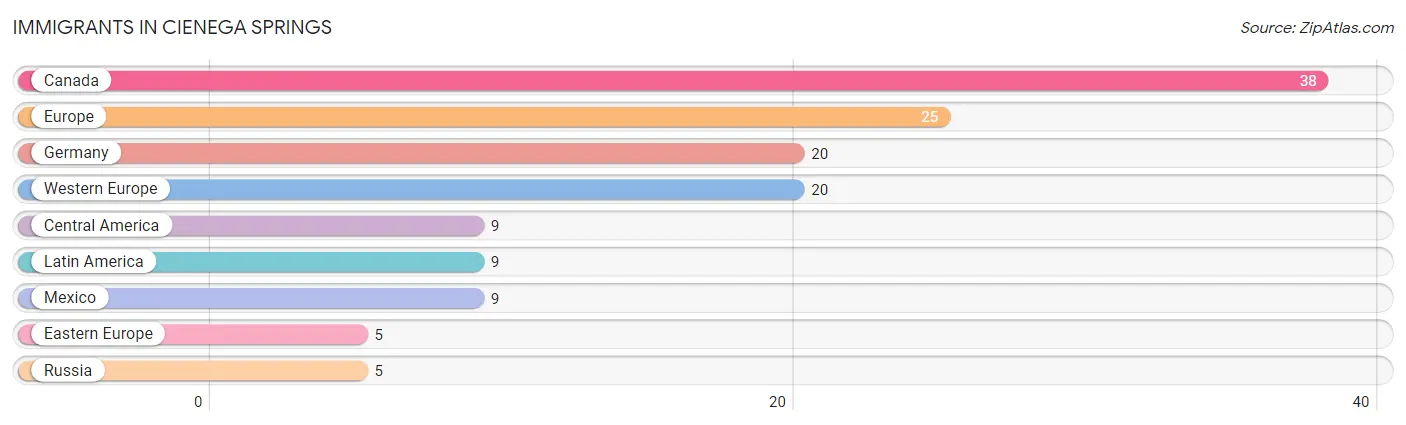
| Immigration Origin | # Population | % Population |
| Canada | 38 | 2.6% |
| Central America | 9 | 0.6% |
| Eastern Europe | 5 | 0.4% |
| Europe | 25 | 1.7% |
| Germany | 20 | 1.4% |
| Latin America | 9 | 0.6% |
| Mexico | 9 | 0.6% |
| Russia | 5 | 0.4% |
| Western Europe | 20 | 1.4% | View All 9 Rows |
Sex and Age in Cienega Springs
Sex and Age in Cienega Springs
The most populous age groups in Cienega Springs are 80 to 84 Years (150 | 18.0%) for men and 60 to 64 Years (139 | 22.9%) for women.
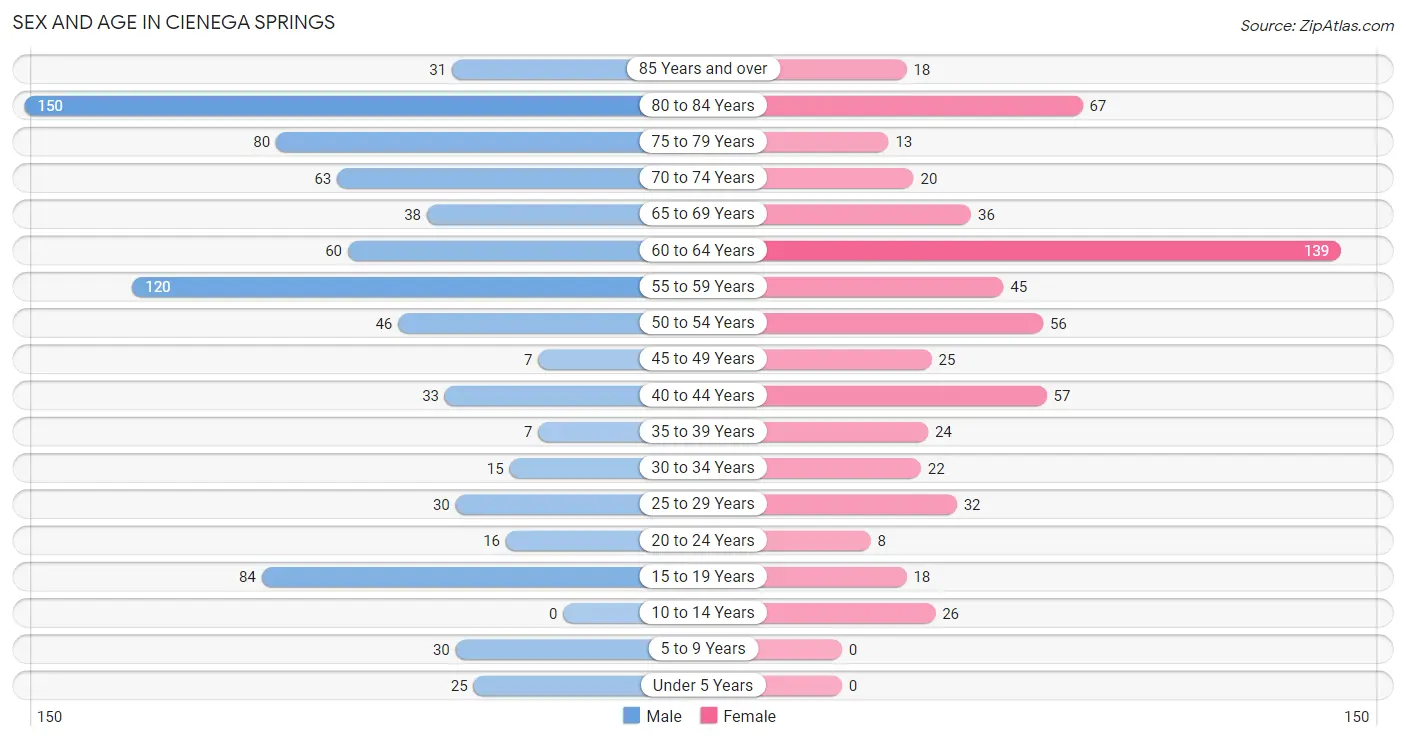
| Age Bracket | Male | Female |
| Under 5 Years | 25 (3.0%) | 0 (0.0%) |
| 5 to 9 Years | 30 (3.6%) | 0 (0.0%) |
| 10 to 14 Years | 0 (0.0%) | 26 (4.3%) |
| 15 to 19 Years | 84 (10.1%) | 18 (3.0%) |
| 20 to 24 Years | 16 (1.9%) | 8 (1.3%) |
| 25 to 29 Years | 30 (3.6%) | 32 (5.3%) |
| 30 to 34 Years | 15 (1.8%) | 22 (3.6%) |
| 35 to 39 Years | 7 (0.8%) | 24 (4.0%) |
| 40 to 44 Years | 33 (4.0%) | 57 (9.4%) |
| 45 to 49 Years | 7 (0.8%) | 25 (4.1%) |
| 50 to 54 Years | 46 (5.5%) | 56 (9.2%) |
| 55 to 59 Years | 120 (14.4%) | 45 (7.4%) |
| 60 to 64 Years | 60 (7.2%) | 139 (22.9%) |
| 65 to 69 Years | 38 (4.5%) | 36 (5.9%) |
| 70 to 74 Years | 63 (7.5%) | 20 (3.3%) |
| 75 to 79 Years | 80 (9.6%) | 13 (2.1%) |
| 80 to 84 Years | 150 (18.0%) | 67 (11.1%) |
| 85 Years and over | 31 (3.7%) | 18 (3.0%) |
| Total | 835 (100.0%) | 606 (100.0%) |
Families and Households in Cienega Springs
Median Family Size in Cienega Springs
The median family size in Cienega Springs is 2.12 persons per family, with married-couple families (227 | 60.2%) accounting for the largest median family size of 2.38 persons per family. On the other hand, single female/mother families (112 | 29.7%) represent the smallest median family size with 1.59 persons per family.
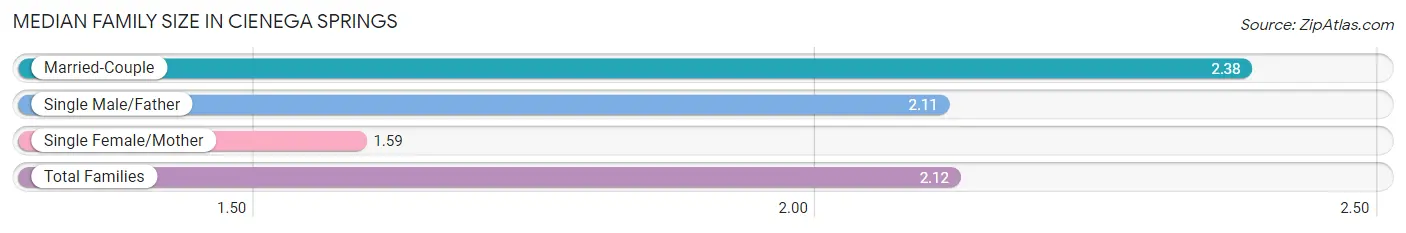
| Family Type | # Families | Family Size |
| Married-Couple | 227 (60.2%) | 2.38 |
| Single Male/Father | 38 (10.1%) | 2.11 |
| Single Female/Mother | 112 (29.7%) | 1.59 |
| Total Families | 377 (100.0%) | 2.12 |
Median Household Size in Cienega Springs
The median household size in Cienega Springs is 1.65 persons per household, with married-couple households (227 | 26.0%) accounting for the largest median household size of 2.38 persons per household. non-family households (497 | 56.9%) represent the smallest median household size with 1.27 persons per household.
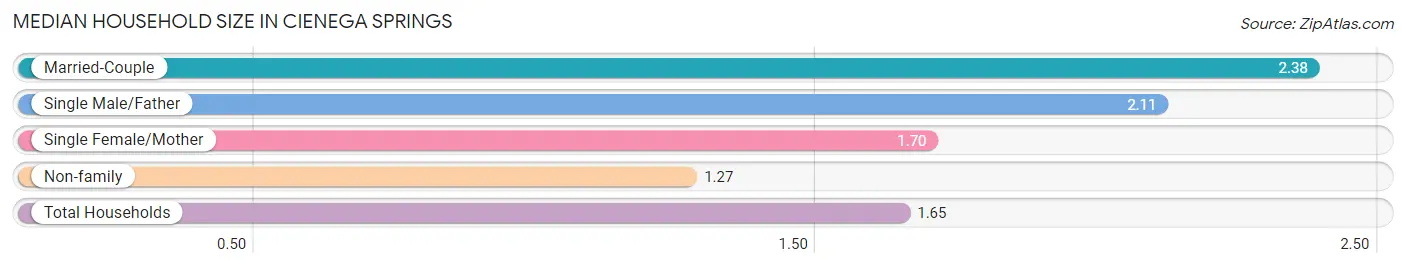
| Household Type | # Households | Household Size |
| Married-Couple | 227 (26.0%) | 2.38 |
| Single Male/Father | 38 (4.3%) | 2.11 |
| Single Female/Mother | 112 (12.8%) | 1.70 |
| Non-family | 497 (56.9%) | 1.27 |
| Total Households | 874 (100.0%) | 1.65 |
Household Size by Marriage Status in Cienega Springs
Out of a total of 874 households in Cienega Springs, 377 (43.1%) are family households, while 497 (56.9%) are nonfamily households. The most numerous type of family households are 2-person households, comprising 240, and the most common type of nonfamily households are 1-person households, comprising 436.
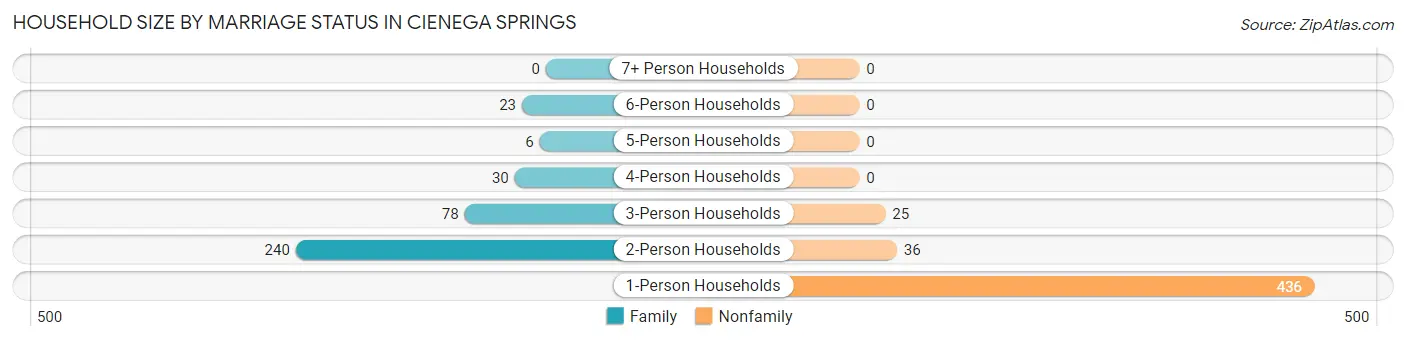
| Household Size | Family Households | Nonfamily Households |
| 1-Person Households | - | 436 (49.9%) |
| 2-Person Households | 240 (27.5%) | 36 (4.1%) |
| 3-Person Households | 78 (8.9%) | 25 (2.9%) |
| 4-Person Households | 30 (3.4%) | 0 (0.0%) |
| 5-Person Households | 6 (0.7%) | 0 (0.0%) |
| 6-Person Households | 23 (2.6%) | 0 (0.0%) |
| 7+ Person Households | 0 (0.0%) | 0 (0.0%) |
| Total | 377 (43.1%) | 497 (56.9%) |
Female Fertility in Cienega Springs
Fertility by Age in Cienega Springs
| Age Bracket | Women with Births | Births / 1,000 Women |
| 15 to 19 years | 0 (0.0%) | 0.0 |
| 20 to 34 years | 0 (0.0%) | 0.0 |
| 35 to 50 years | 0 (0.0%) | 0.0 |
| Total | 0 (0.0%) | 0.0 |
Fertility by Age by Marriage Status in Cienega Springs
| Age Bracket | Married | Unmarried |
| 15 to 19 years | 0 (0.0%) | 0 (0.0%) |
| 20 to 34 years | 0 (0.0%) | 0 (0.0%) |
| 35 to 50 years | 0 (0.0%) | 0 (0.0%) |
| Total | 0 (0.0%) | 0 (0.0%) |
Fertility by Education in Cienega Springs
| Educational Attainment | Women with Births | Births / 1,000 Women |
| Less than High School | 0 (0.0%) | 0.0 |
| High School Diploma | 0 (0.0%) | 0.0 |
| College or Associate's Degree | 0 (0.0%) | 0.0 |
| Bachelor's Degree | 0 (0.0%) | 0.0 |
| Graduate Degree | 0 (0.0%) | 0.0 |
| Total | 0 (0.0%) | 0.0 |
Fertility by Education by Marriage Status in Cienega Springs
| Educational Attainment | Married | Unmarried |
| Less than High School | 0 (0.0%) | 0 (0.0%) |
| High School Diploma | 0 (0.0%) | 0 (0.0%) |
| College or Associate's Degree | 0 (0.0%) | 0 (0.0%) |
| Bachelor's Degree | 0 (0.0%) | 0 (0.0%) |
| Graduate Degree | 0 (0.0%) | 0 (0.0%) |
| Total | 0 (0.0%) | 0 (0.0%) |
Employment Characteristics in Cienega Springs
Employment by Class of Employer in Cienega Springs
Among the 506 employed individuals in Cienega Springs, private company employees (233 | 46.1%), local government employees (145 | 28.7%), and state government employees (63 | 12.4%) make up the most common classes of employment.
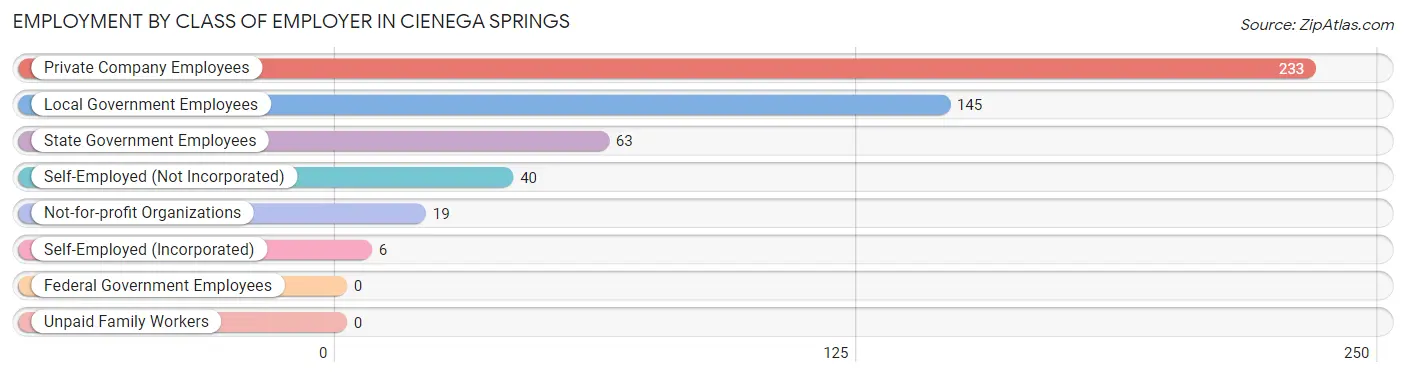
| Employer Class | # Employees | % Employees |
| Private Company Employees | 233 | 46.1% |
| Self-Employed (Incorporated) | 6 | 1.2% |
| Self-Employed (Not Incorporated) | 40 | 7.9% |
| Not-for-profit Organizations | 19 | 3.7% |
| Local Government Employees | 145 | 28.7% |
| State Government Employees | 63 | 12.4% |
| Federal Government Employees | 0 | 0.0% |
| Unpaid Family Workers | 0 | 0.0% |
| Total | 506 | 100.0% |
Employment Status by Age in Cienega Springs
According to the labor force statistics for Cienega Springs, out of the total population over 16 years of age (1,274), 41.0% or 522 individuals are in the labor force, with 2.3% or 12 of them unemployed. The age group with the highest labor force participation rate is 25 to 29 years, with 91.9% or 57 individuals in the labor force. Within the labor force, the 30 to 34 years age range has the highest percentage of unemployed individuals, with 10.3% or 3 of them being unemployed.
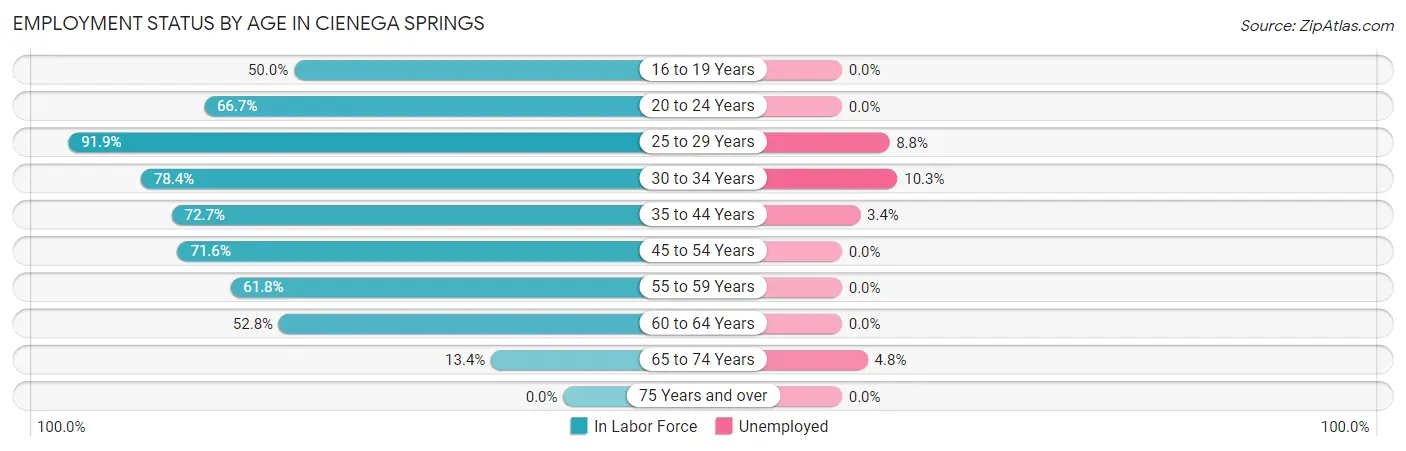
| Age Bracket | In Labor Force | Unemployed |
| 16 to 19 Years | 8 (50.0%) | 0 (0.0%) |
| 20 to 24 Years | 16 (66.7%) | 0 (0.0%) |
| 25 to 29 Years | 57 (91.9%) | 5 (8.8%) |
| 30 to 34 Years | 29 (78.4%) | 3 (10.3%) |
| 35 to 44 Years | 88 (72.7%) | 3 (3.4%) |
| 45 to 54 Years | 96 (71.6%) | 0 (0.0%) |
| 55 to 59 Years | 102 (61.8%) | 0 (0.0%) |
| 60 to 64 Years | 105 (52.8%) | 0 (0.0%) |
| 65 to 74 Years | 21 (13.4%) | 1 (4.8%) |
| 75 Years and over | 0 (0.0%) | 0 (0.0%) |
| Total | 522 (41.0%) | 12 (2.3%) |
Employment Status by Educational Attainment in Cienega Springs
According to labor force statistics for Cienega Springs, 66.4% of individuals (477) out of the total population between 25 and 64 years of age (718) are in the labor force, with 2.3% or 11 of them being unemployed. The group with the highest labor force participation rate are those with the educational attainment of high school diploma, with 79.1% or 189 individuals in the labor force. Within the labor force, individuals with bachelor's degree or higher education have the highest percentage of unemployment, with 7.3% or 3 of them being unemployed.
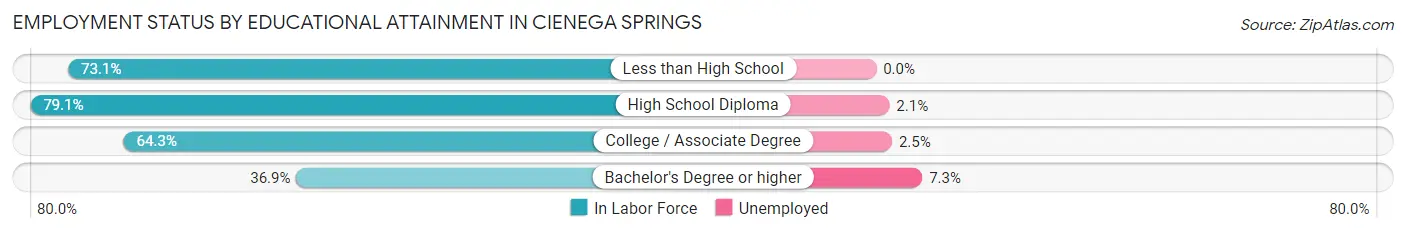
| Educational Attainment | In Labor Force | Unemployed |
| Less than High School | 87 (73.1%) | 0 (0.0%) |
| High School Diploma | 189 (79.1%) | 5 (2.1%) |
| College / Associate Degree | 160 (64.3%) | 6 (2.5%) |
| Bachelor's Degree or higher | 41 (36.9%) | 8 (7.3%) |
| Total | 477 (66.4%) | 17 (2.3%) |
Employment Occupations by Sex in Cienega Springs
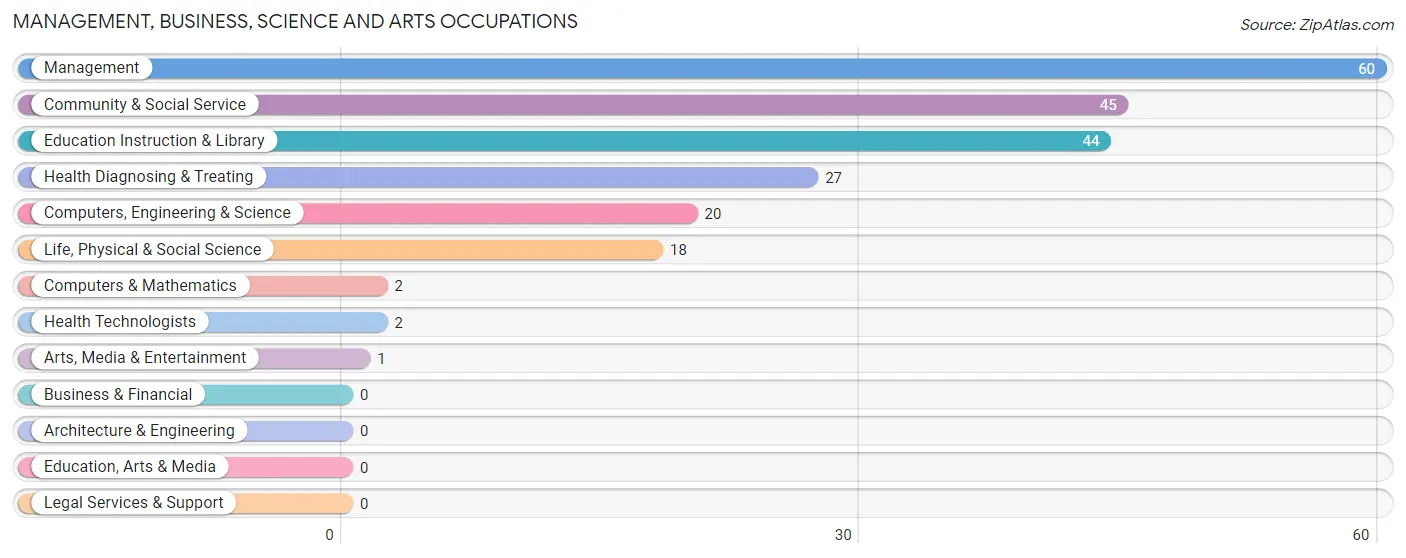
Management, Business, Science and Arts Occupations
The most common Management, Business, Science and Arts occupations in Cienega Springs are Management (60 | 11.8%), Community & Social Service (45 | 8.8%), Education Instruction & Library (44 | 8.6%), Health Diagnosing & Treating (27 | 5.3%), and Computers, Engineering & Science (20 | 3.9%).
Management, Business, Science and Arts Occupations by Sex
Within the Management, Business, Science and Arts occupations in Cienega Springs, the most male-oriented occupations are Computers, Engineering & Science (100.0%), Computers & Mathematics (100.0%), and Life, Physical & Social Science (100.0%), while the most female-oriented occupations are Health Diagnosing & Treating (100.0%), Health Technologists (100.0%), and Management (85.0%).
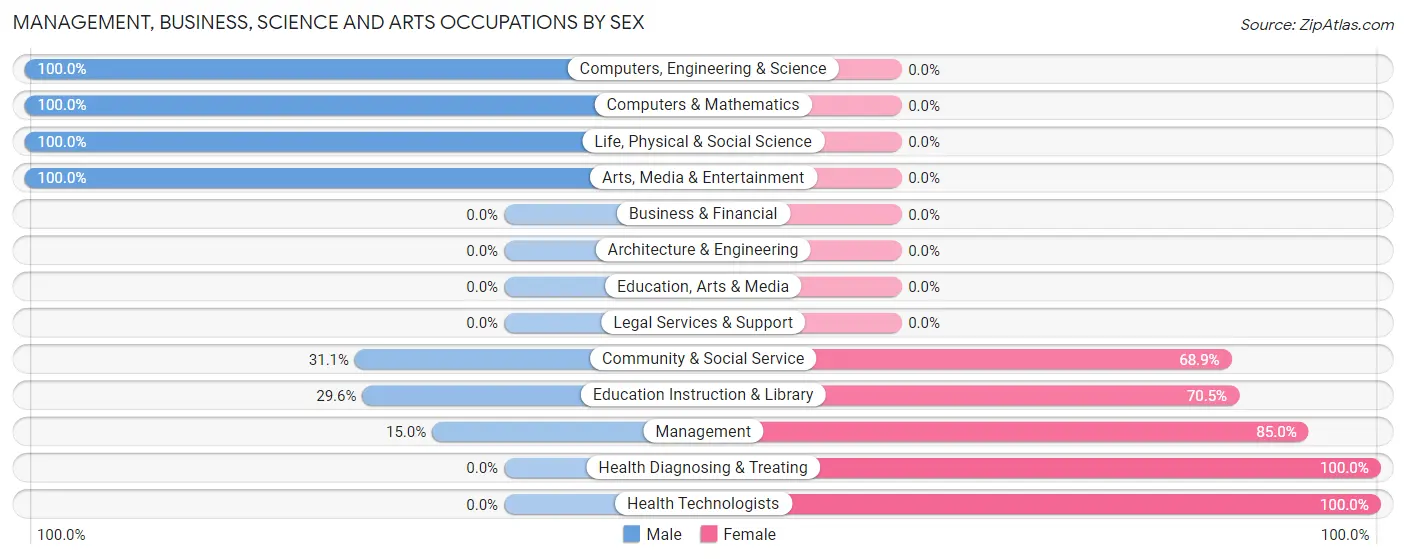
| Occupation | Male | Female |
| Management | 9 (15.0%) | 51 (85.0%) |
| Business & Financial | 0 (0.0%) | 0 (0.0%) |
| Computers, Engineering & Science | 20 (100.0%) | 0 (0.0%) |
| Computers & Mathematics | 2 (100.0%) | 0 (0.0%) |
| Architecture & Engineering | 0 (0.0%) | 0 (0.0%) |
| Life, Physical & Social Science | 18 (100.0%) | 0 (0.0%) |
| Community & Social Service | 14 (31.1%) | 31 (68.9%) |
| Education, Arts & Media | 0 (0.0%) | 0 (0.0%) |
| Legal Services & Support | 0 (0.0%) | 0 (0.0%) |
| Education Instruction & Library | 13 (29.5%) | 31 (70.5%) |
| Arts, Media & Entertainment | 1 (100.0%) | 0 (0.0%) |
| Health Diagnosing & Treating | 0 (0.0%) | 27 (100.0%) |
| Health Technologists | 0 (0.0%) | 2 (100.0%) |
| Total (Category) | 43 (28.3%) | 109 (71.7%) |
| Total (Overall) | 262 (51.4%) | 248 (48.6%) |
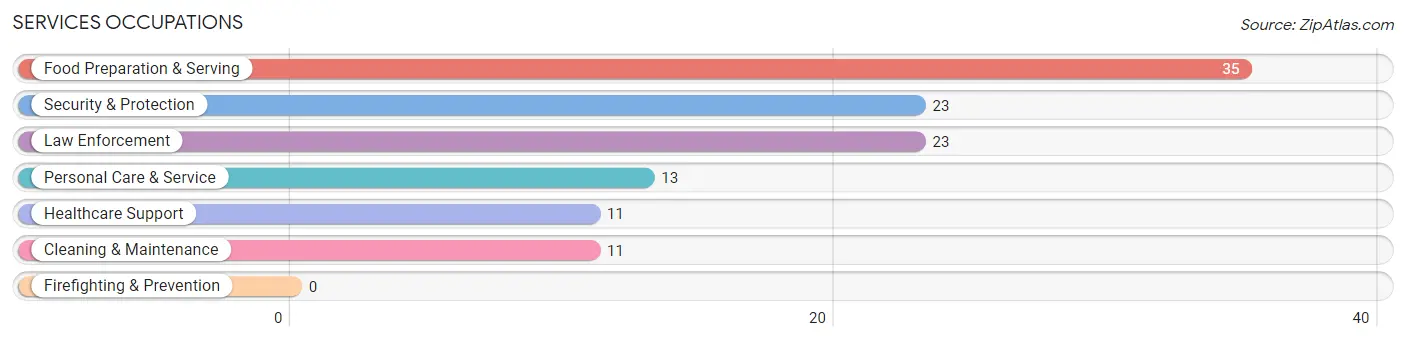
Services Occupations
The most common Services occupations in Cienega Springs are Food Preparation & Serving (35 | 6.9%), Security & Protection (23 | 4.5%), Law Enforcement (23 | 4.5%), Personal Care & Service (13 | 2.5%), and Healthcare Support (11 | 2.2%).
Services Occupations by Sex
Within the Services occupations in Cienega Springs, the most male-oriented occupations are Security & Protection (100.0%), Law Enforcement (100.0%), and Cleaning & Maintenance (63.6%), while the most female-oriented occupations are Healthcare Support (100.0%), Personal Care & Service (100.0%), and Food Preparation & Serving (80.0%).
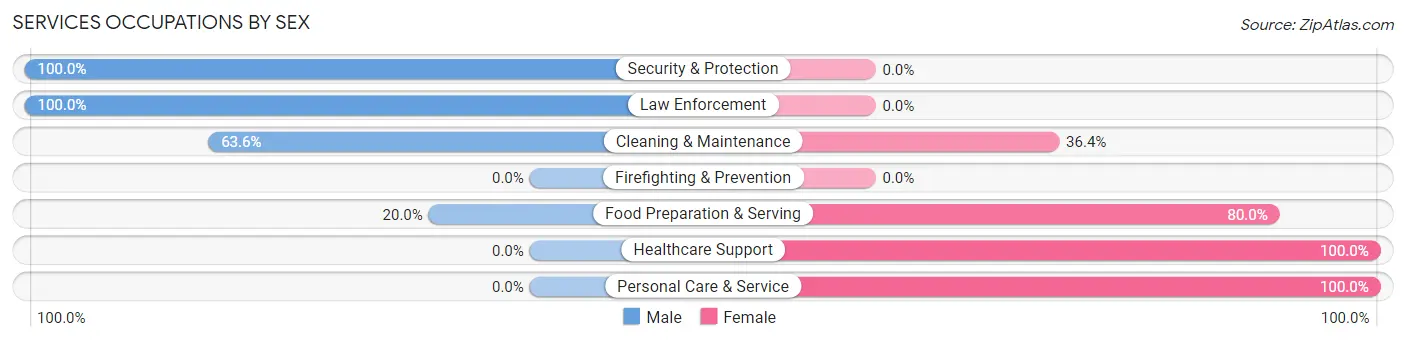
| Occupation | Male | Female |
| Healthcare Support | 0 (0.0%) | 11 (100.0%) |
| Security & Protection | 23 (100.0%) | 0 (0.0%) |
| Firefighting & Prevention | 0 (0.0%) | 0 (0.0%) |
| Law Enforcement | 23 (100.0%) | 0 (0.0%) |
| Food Preparation & Serving | 7 (20.0%) | 28 (80.0%) |
| Cleaning & Maintenance | 7 (63.6%) | 4 (36.4%) |
| Personal Care & Service | 0 (0.0%) | 13 (100.0%) |
| Total (Category) | 37 (39.8%) | 56 (60.2%) |
| Total (Overall) | 262 (51.4%) | 248 (48.6%) |
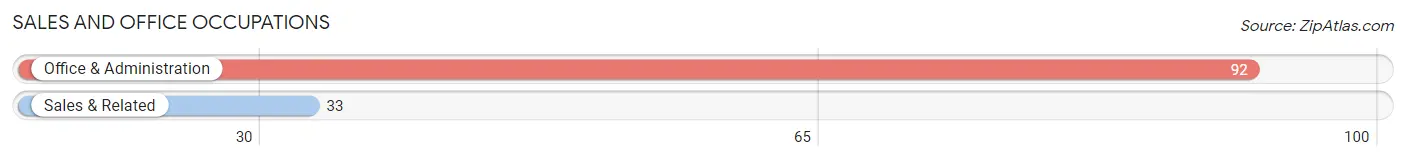
Sales and Office Occupations
The most common Sales and Office occupations in Cienega Springs are Office & Administration (92 | 18.0%), and Sales & Related (33 | 6.5%).
Sales and Office Occupations by Sex
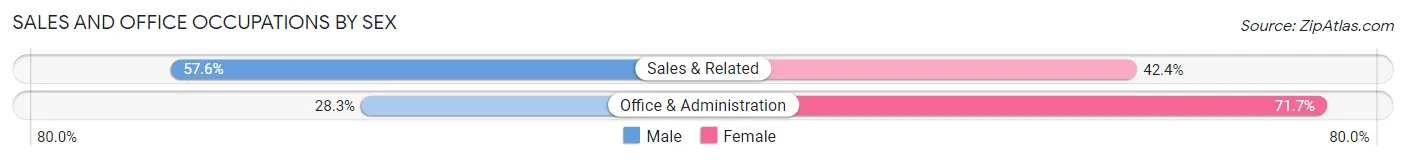
| Occupation | Male | Female |
| Sales & Related | 19 (57.6%) | 14 (42.4%) |
| Office & Administration | 26 (28.3%) | 66 (71.7%) |
| Total (Category) | 45 (36.0%) | 80 (64.0%) |
| Total (Overall) | 262 (51.4%) | 248 (48.6%) |
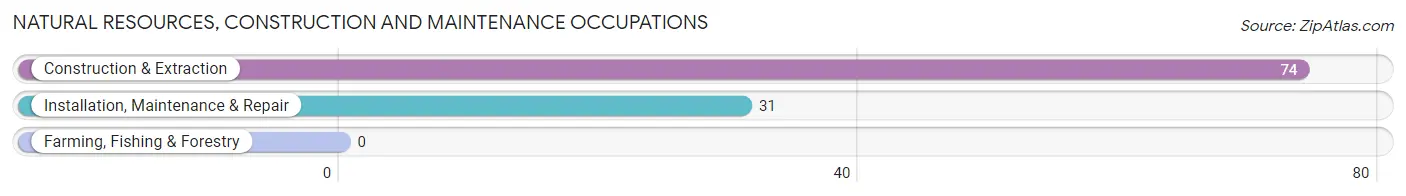
Natural Resources, Construction and Maintenance Occupations
The most common Natural Resources, Construction and Maintenance occupations in Cienega Springs are Construction & Extraction (74 | 14.5%), and Installation, Maintenance & Repair (31 | 6.1%).
Natural Resources, Construction and Maintenance Occupations by Sex
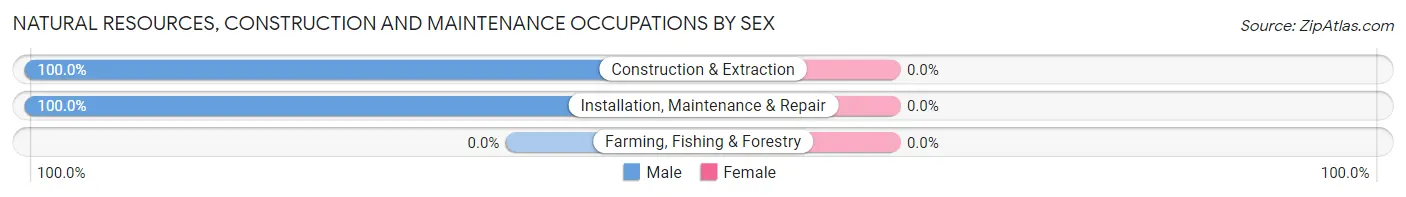
| Occupation | Male | Female |
| Farming, Fishing & Forestry | 0 (0.0%) | 0 (0.0%) |
| Construction & Extraction | 74 (100.0%) | 0 (0.0%) |
| Installation, Maintenance & Repair | 31 (100.0%) | 0 (0.0%) |
| Total (Category) | 105 (100.0%) | 0 (0.0%) |
| Total (Overall) | 262 (51.4%) | 248 (48.6%) |
Production, Transportation and Moving Occupations
The most common Production, Transportation and Moving occupations in Cienega Springs are Production (25 | 4.9%), Transportation (7 | 1.4%), and Material Moving (3 | 0.6%).
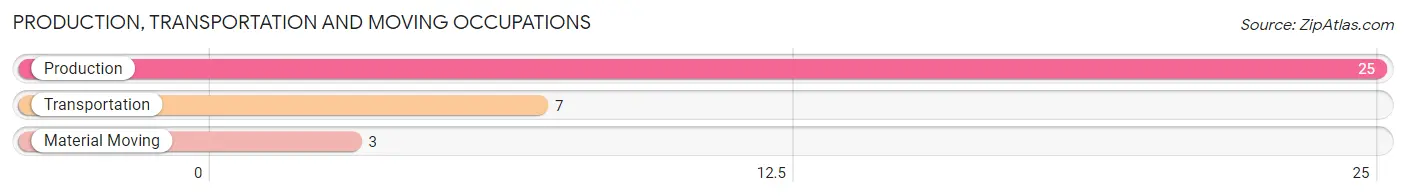
Production, Transportation and Moving Occupations by Sex
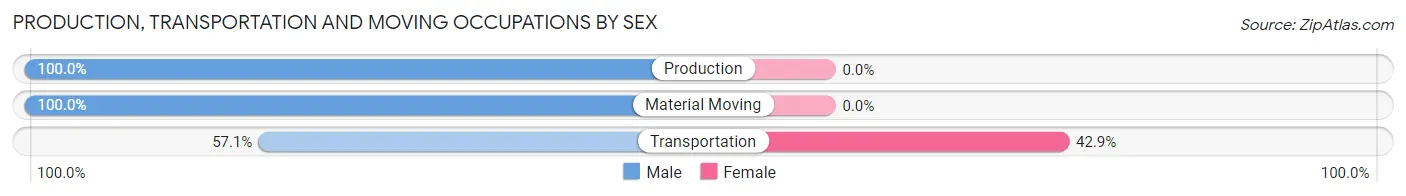
| Occupation | Male | Female |
| Production | 25 (100.0%) | 0 (0.0%) |
| Transportation | 4 (57.1%) | 3 (42.9%) |
| Material Moving | 3 (100.0%) | 0 (0.0%) |
| Total (Category) | 32 (91.4%) | 3 (8.6%) |
| Total (Overall) | 262 (51.4%) | 248 (48.6%) |
Employment Industries by Sex in Cienega Springs
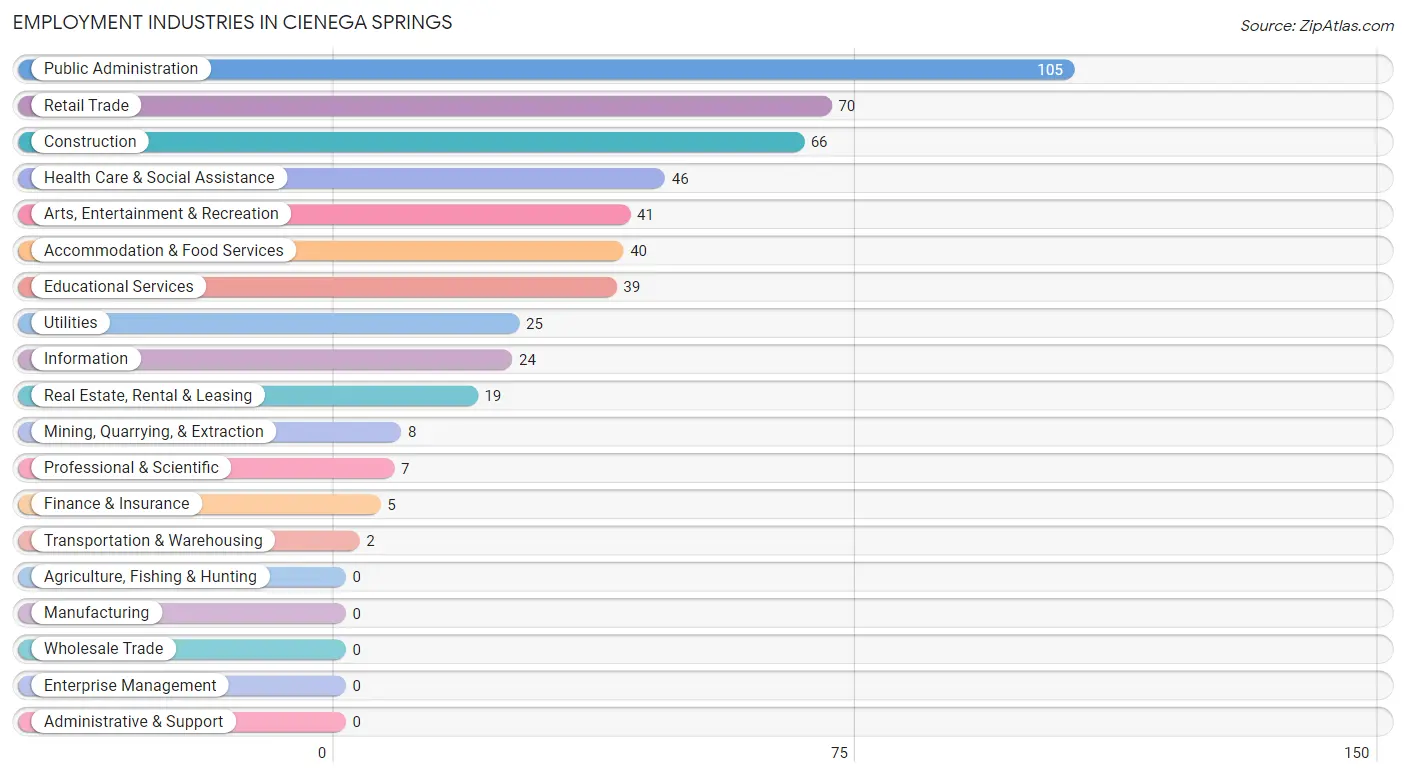
Employment Industries in Cienega Springs
The major employment industries in Cienega Springs include Public Administration (105 | 20.6%), Retail Trade (70 | 13.7%), Construction (66 | 12.9%), Health Care & Social Assistance (46 | 9.0%), and Arts, Entertainment & Recreation (41 | 8.0%).
Employment Industries by Sex in Cienega Springs
The Cienega Springs industries that see more men than women are Mining, Quarrying, & Extraction (100.0%), Construction (100.0%), and Transportation & Warehousing (100.0%), whereas the industries that tend to have a higher number of women are Information (100.0%), Finance & Insurance (100.0%), and Real Estate, Rental & Leasing (100.0%).
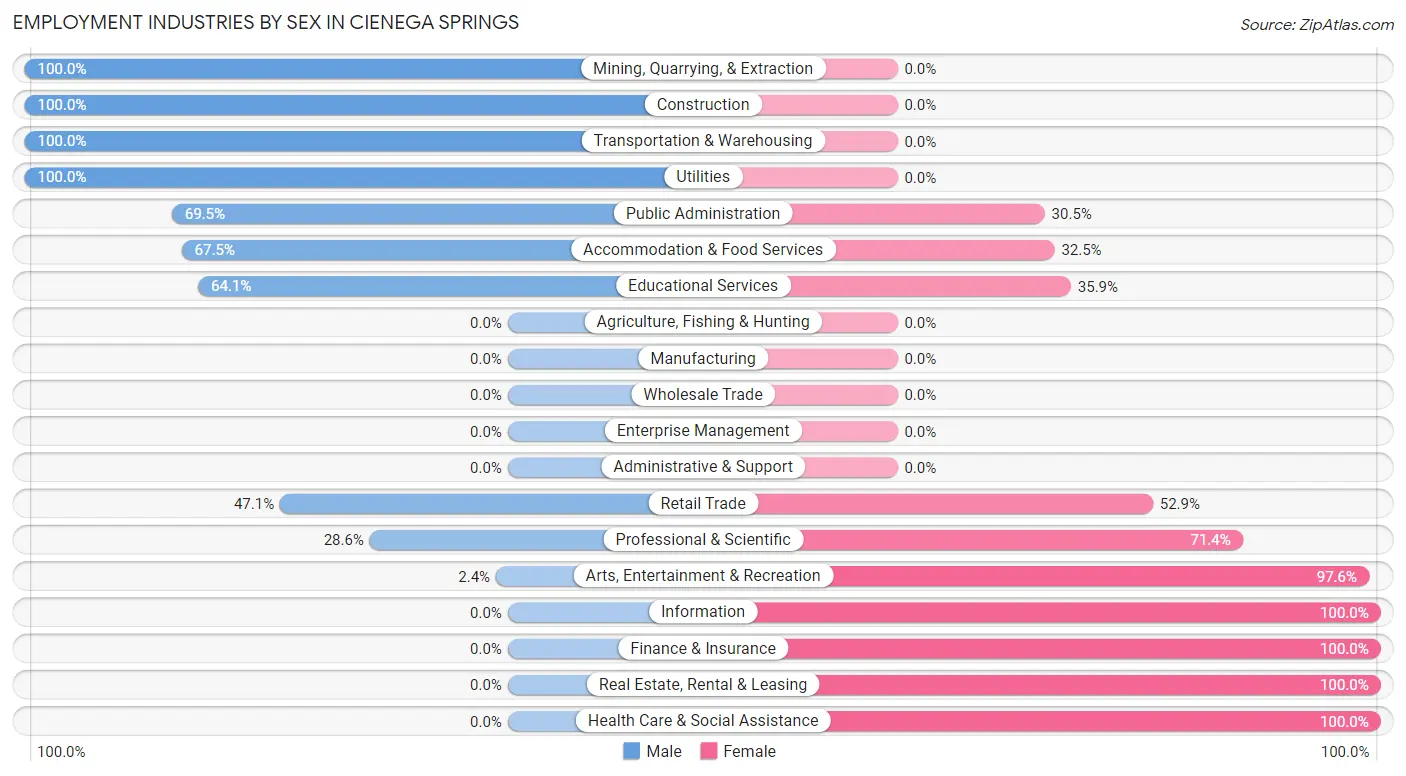
| Industry | Male | Female |
| Agriculture, Fishing & Hunting | 0 (0.0%) | 0 (0.0%) |
| Mining, Quarrying, & Extraction | 8 (100.0%) | 0 (0.0%) |
| Construction | 66 (100.0%) | 0 (0.0%) |
| Manufacturing | 0 (0.0%) | 0 (0.0%) |
| Wholesale Trade | 0 (0.0%) | 0 (0.0%) |
| Retail Trade | 33 (47.1%) | 37 (52.9%) |
| Transportation & Warehousing | 2 (100.0%) | 0 (0.0%) |
| Utilities | 25 (100.0%) | 0 (0.0%) |
| Information | 0 (0.0%) | 24 (100.0%) |
| Finance & Insurance | 0 (0.0%) | 5 (100.0%) |
| Real Estate, Rental & Leasing | 0 (0.0%) | 19 (100.0%) |
| Professional & Scientific | 2 (28.6%) | 5 (71.4%) |
| Enterprise Management | 0 (0.0%) | 0 (0.0%) |
| Administrative & Support | 0 (0.0%) | 0 (0.0%) |
| Educational Services | 25 (64.1%) | 14 (35.9%) |
| Health Care & Social Assistance | 0 (0.0%) | 46 (100.0%) |
| Arts, Entertainment & Recreation | 1 (2.4%) | 40 (97.6%) |
| Accommodation & Food Services | 27 (67.5%) | 13 (32.5%) |
| Public Administration | 73 (69.5%) | 32 (30.5%) |
| Total | 262 (51.4%) | 248 (48.6%) |
Education in Cienega Springs
School Enrollment in Cienega Springs
The most common levels of schooling among the 199 students in Cienega Springs are high school (96 | 48.2%), college / undergraduate (46 | 23.1%), and elementary school (30 | 15.1%).
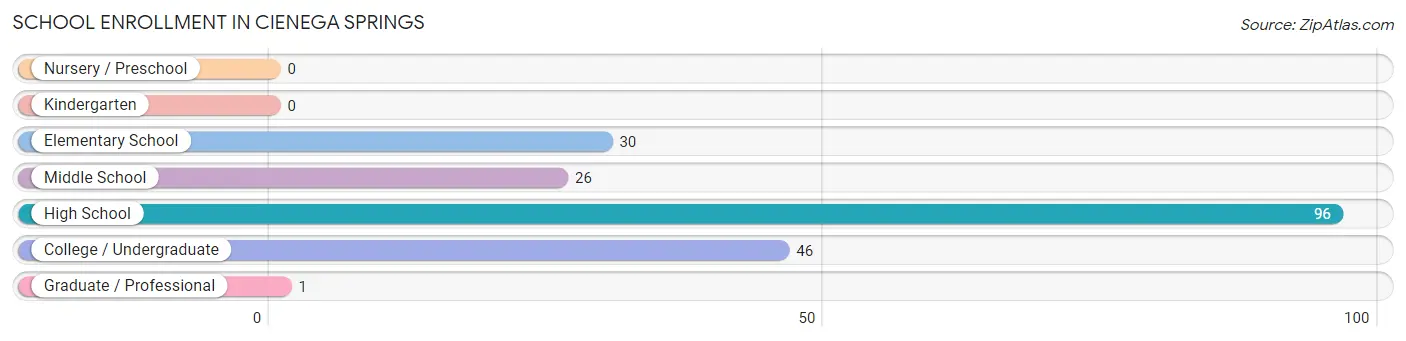
| School Level | # Students | % Students |
| Nursery / Preschool | 0 | 0.0% |
| Kindergarten | 0 | 0.0% |
| Elementary School | 30 | 15.1% |
| Middle School | 26 | 13.1% |
| High School | 96 | 48.2% |
| College / Undergraduate | 46 | 23.1% |
| Graduate / Professional | 1 | 0.5% |
| Total | 199 | 100.0% |
School Enrollment by Age by Funding Source in Cienega Springs
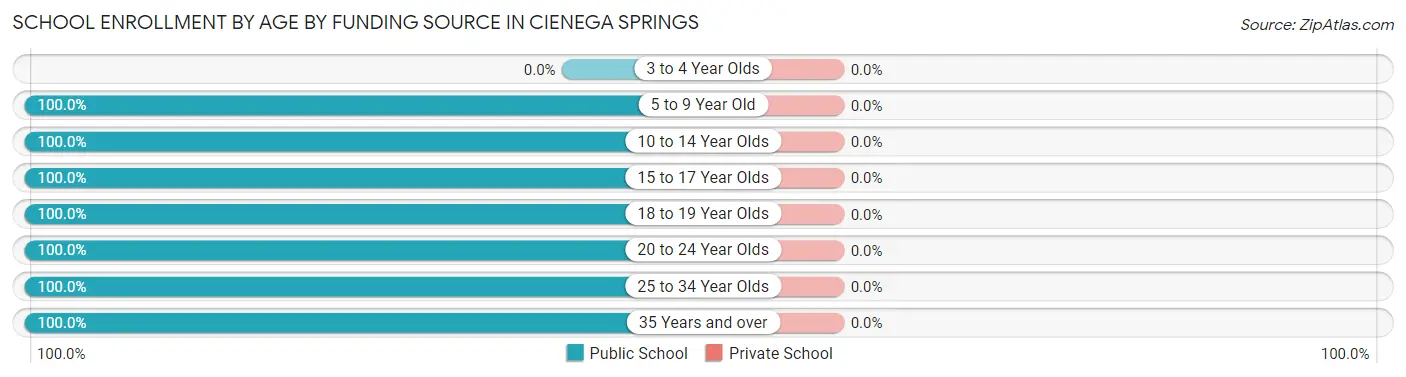
| Age Bracket | Public School | Private School |
| 3 to 4 Year Olds | 0 (0.0%) | 0 (0.0%) |
| 5 to 9 Year Old | 30 (100.0%) | 0 (0.0%) |
| 10 to 14 Year Olds | 26 (100.0%) | 0 (0.0%) |
| 15 to 17 Year Olds | 91 (100.0%) | 0 (0.0%) |
| 18 to 19 Year Olds | 8 (100.0%) | 0 (0.0%) |
| 20 to 24 Year Olds | 8 (100.0%) | 0 (0.0%) |
| 25 to 34 Year Olds | 24 (100.0%) | 0 (0.0%) |
| 35 Years and over | 12 (100.0%) | 0 (0.0%) |
| Total | 199 (100.0%) | 0 (0.0%) |
Educational Attainment by Field of Study in Cienega Springs
Science & technology (59 | 36.2%), business (43 | 26.4%), engineering (25 | 15.3%), education (19 | 11.7%), and social sciences (5 | 3.1%) are the most common fields of study among 163 individuals in Cienega Springs who have obtained a bachelor's degree or higher.
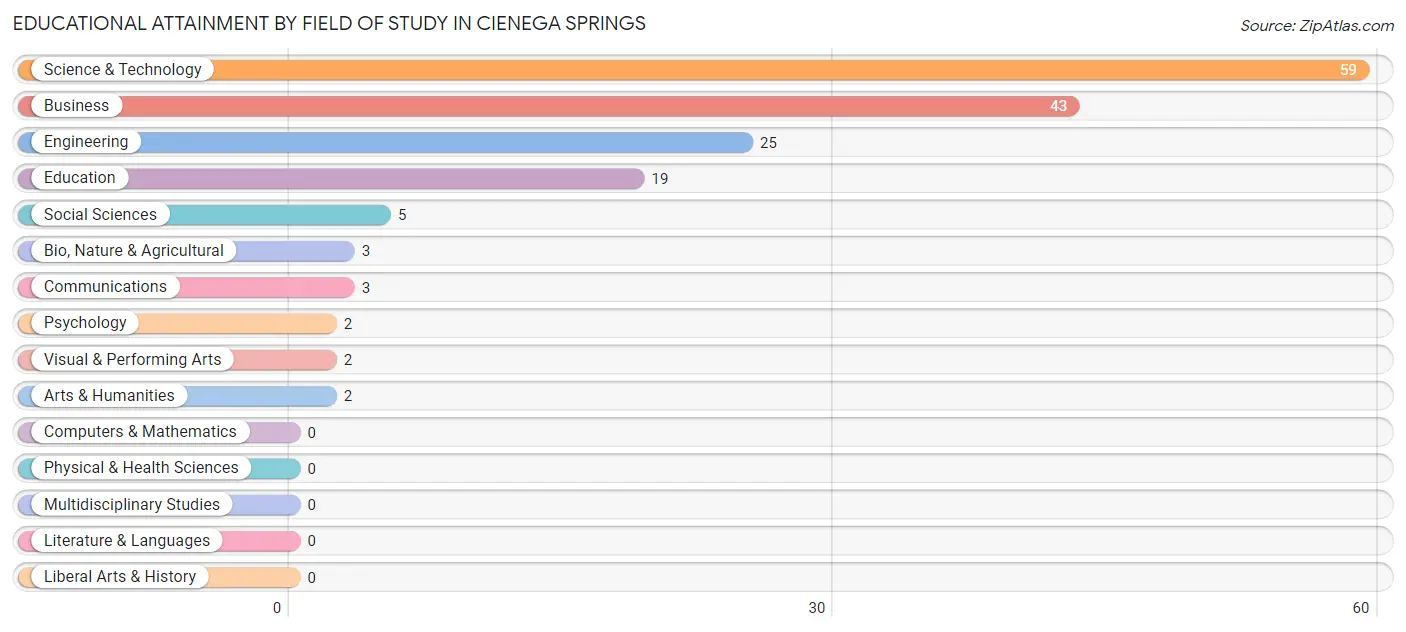
| Field of Study | # Graduates | % Graduates |
| Computers & Mathematics | 0 | 0.0% |
| Bio, Nature & Agricultural | 3 | 1.8% |
| Physical & Health Sciences | 0 | 0.0% |
| Psychology | 2 | 1.2% |
| Social Sciences | 5 | 3.1% |
| Engineering | 25 | 15.3% |
| Multidisciplinary Studies | 0 | 0.0% |
| Science & Technology | 59 | 36.2% |
| Business | 43 | 26.4% |
| Education | 19 | 11.7% |
| Literature & Languages | 0 | 0.0% |
| Liberal Arts & History | 0 | 0.0% |
| Visual & Performing Arts | 2 | 1.2% |
| Communications | 3 | 1.8% |
| Arts & Humanities | 2 | 1.2% |
| Total | 163 | 100.0% |
Transportation & Commute in Cienega Springs
Vehicle Availability by Sex in Cienega Springs
The most prevalent vehicle ownership categories in Cienega Springs are males with 3 vehicles (104, accounting for 39.7%) and females with 3 vehicles (14, making up 42.6%).
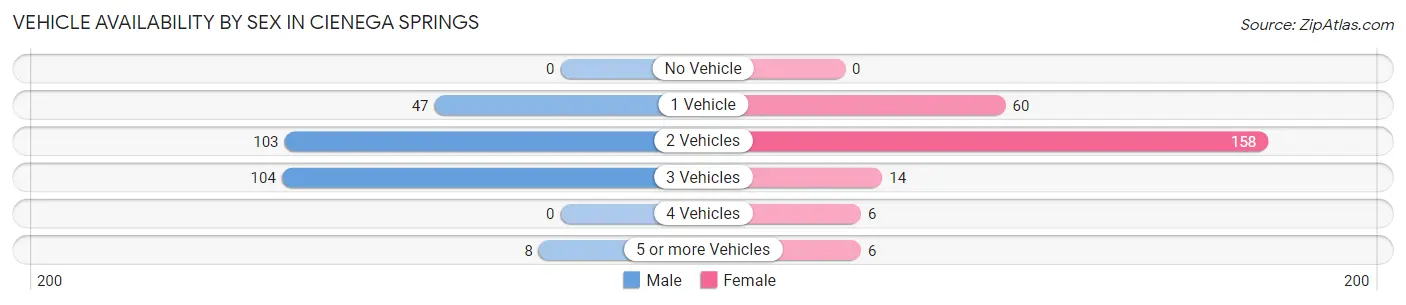
| Vehicles Available | Male | Female |
| No Vehicle | 0 (0.0%) | 0 (0.0%) |
| 1 Vehicle | 47 (17.9%) | 60 (24.6%) |
| 2 Vehicles | 103 (39.3%) | 158 (64.7%) |
| 3 Vehicles | 104 (39.7%) | 14 (5.7%) |
| 4 Vehicles | 0 (0.0%) | 6 (2.5%) |
| 5 or more Vehicles | 8 (3.0%) | 6 (2.5%) |
| Total | 262 (100.0%) | 244 (100.0%) |
Commute Time in Cienega Springs
The most frequently occuring commute durations in Cienega Springs are 5 to 9 minutes (215 commuters, 43.3%), 10 to 14 minutes (145 commuters, 29.2%), and 15 to 19 minutes (49 commuters, 9.9%).
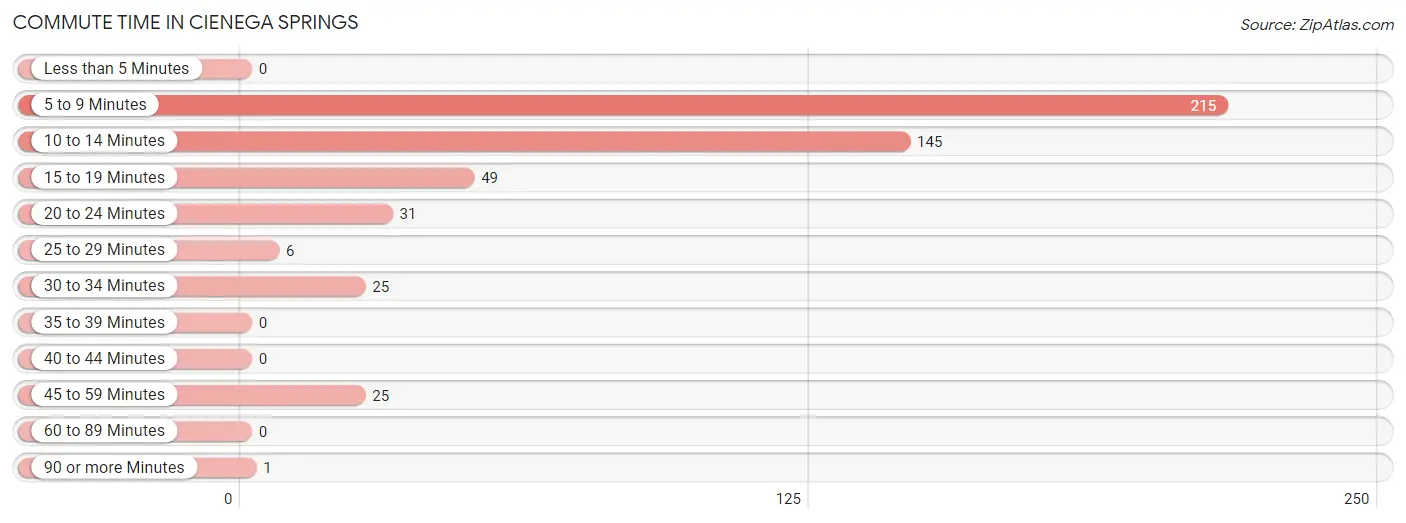
| Commute Time | # Commuters | % Commuters |
| Less than 5 Minutes | 0 | 0.0% |
| 5 to 9 Minutes | 215 | 43.3% |
| 10 to 14 Minutes | 145 | 29.2% |
| 15 to 19 Minutes | 49 | 9.9% |
| 20 to 24 Minutes | 31 | 6.2% |
| 25 to 29 Minutes | 6 | 1.2% |
| 30 to 34 Minutes | 25 | 5.0% |
| 35 to 39 Minutes | 0 | 0.0% |
| 40 to 44 Minutes | 0 | 0.0% |
| 45 to 59 Minutes | 25 | 5.0% |
| 60 to 89 Minutes | 0 | 0.0% |
| 90 or more Minutes | 1 | 0.2% |
Commute Time by Sex in Cienega Springs
The most common commute times in Cienega Springs are 10 to 14 minutes (96 commuters, 37.2%) for males and 5 to 9 minutes (143 commuters, 59.8%) for females.
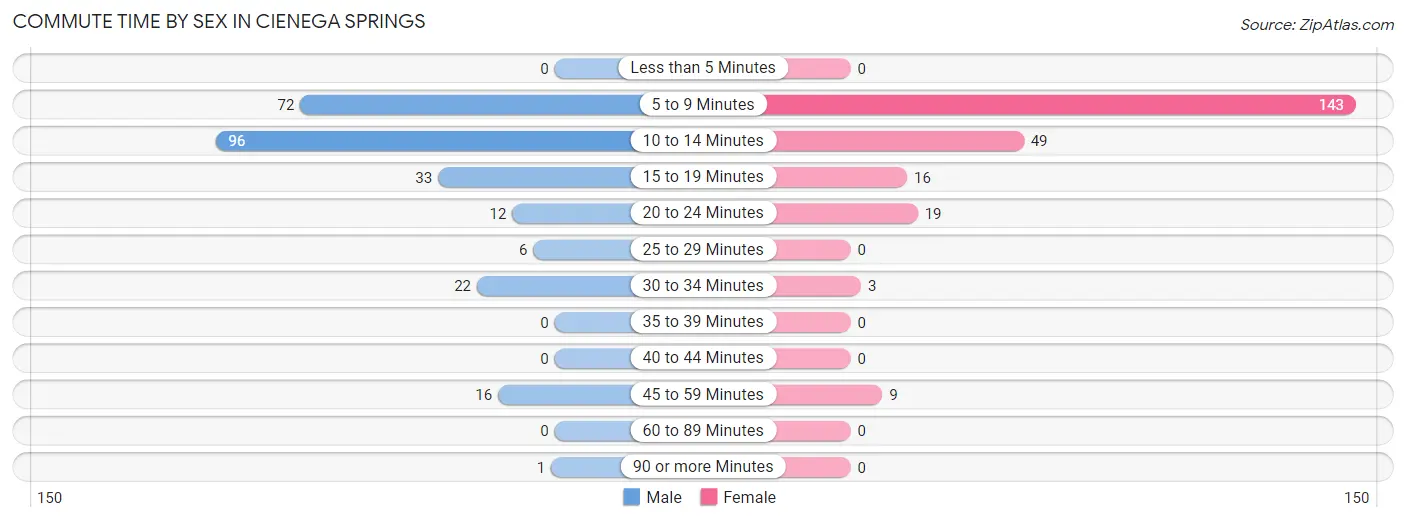
| Commute Time | Male | Female |
| Less than 5 Minutes | 0 (0.0%) | 0 (0.0%) |
| 5 to 9 Minutes | 72 (27.9%) | 143 (59.8%) |
| 10 to 14 Minutes | 96 (37.2%) | 49 (20.5%) |
| 15 to 19 Minutes | 33 (12.8%) | 16 (6.7%) |
| 20 to 24 Minutes | 12 (4.6%) | 19 (8.0%) |
| 25 to 29 Minutes | 6 (2.3%) | 0 (0.0%) |
| 30 to 34 Minutes | 22 (8.5%) | 3 (1.3%) |
| 35 to 39 Minutes | 0 (0.0%) | 0 (0.0%) |
| 40 to 44 Minutes | 0 (0.0%) | 0 (0.0%) |
| 45 to 59 Minutes | 16 (6.2%) | 9 (3.8%) |
| 60 to 89 Minutes | 0 (0.0%) | 0 (0.0%) |
| 90 or more Minutes | 1 (0.4%) | 0 (0.0%) |
Time of Departure to Work by Sex in Cienega Springs
The most frequent times of departure to work in Cienega Springs are 7:00 AM to 7:29 AM (63, 24.4%) for males and 8:00 AM to 8:29 AM (67, 28.0%) for females.
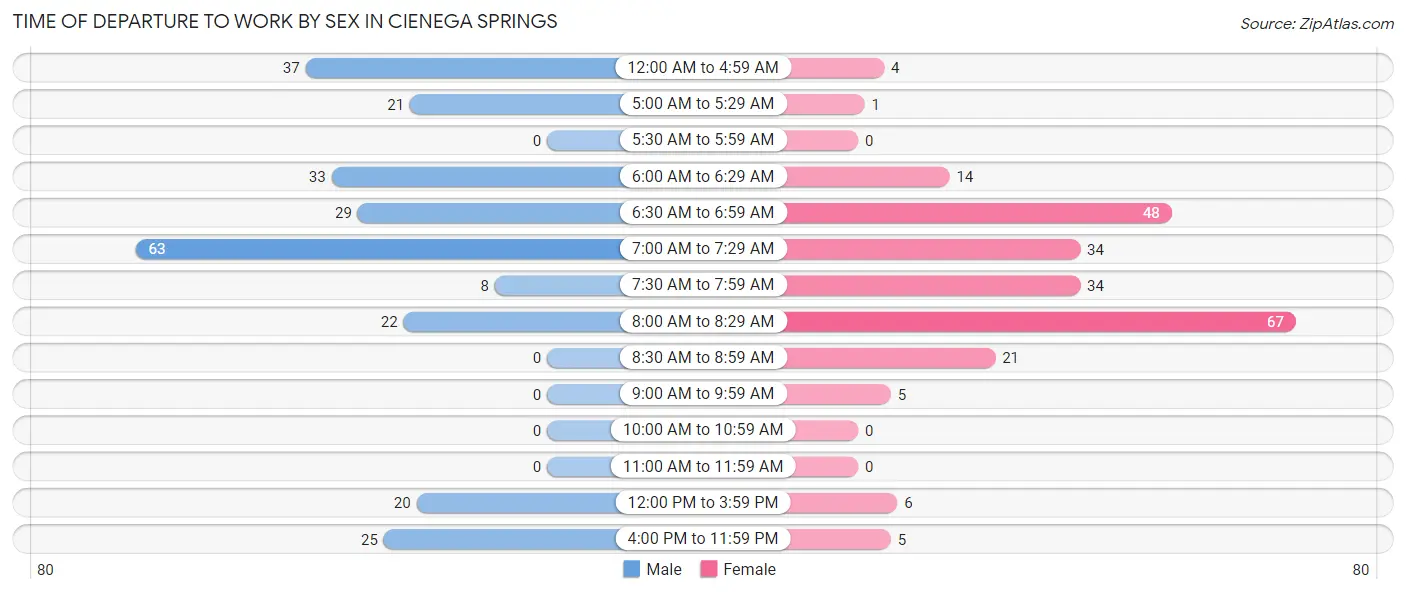
| Time of Departure | Male | Female |
| 12:00 AM to 4:59 AM | 37 (14.3%) | 4 (1.7%) |
| 5:00 AM to 5:29 AM | 21 (8.1%) | 1 (0.4%) |
| 5:30 AM to 5:59 AM | 0 (0.0%) | 0 (0.0%) |
| 6:00 AM to 6:29 AM | 33 (12.8%) | 14 (5.9%) |
| 6:30 AM to 6:59 AM | 29 (11.2%) | 48 (20.1%) |
| 7:00 AM to 7:29 AM | 63 (24.4%) | 34 (14.2%) |
| 7:30 AM to 7:59 AM | 8 (3.1%) | 34 (14.2%) |
| 8:00 AM to 8:29 AM | 22 (8.5%) | 67 (28.0%) |
| 8:30 AM to 8:59 AM | 0 (0.0%) | 21 (8.8%) |
| 9:00 AM to 9:59 AM | 0 (0.0%) | 5 (2.1%) |
| 10:00 AM to 10:59 AM | 0 (0.0%) | 0 (0.0%) |
| 11:00 AM to 11:59 AM | 0 (0.0%) | 0 (0.0%) |
| 12:00 PM to 3:59 PM | 20 (7.7%) | 6 (2.5%) |
| 4:00 PM to 11:59 PM | 25 (9.7%) | 5 (2.1%) |
| Total | 258 (100.0%) | 239 (100.0%) |
Housing Occupancy in Cienega Springs
Occupancy by Ownership in Cienega Springs
Of the total 874 dwellings in Cienega Springs, owner-occupied units account for 611 (69.9%), while renter-occupied units make up 263 (30.1%).
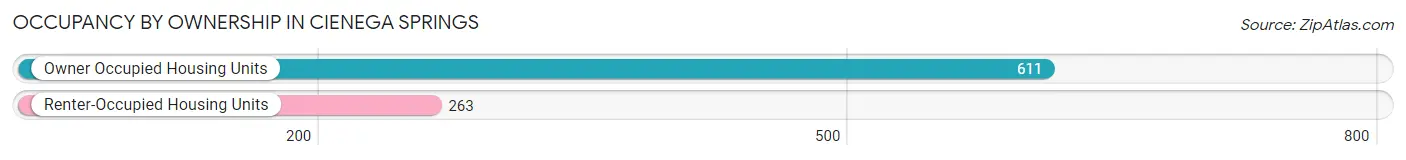
| Occupancy | # Housing Units | % Housing Units |
| Owner Occupied Housing Units | 611 | 69.9% |
| Renter-Occupied Housing Units | 263 | 30.1% |
| Total Occupied Housing Units | 874 | 100.0% |
Occupancy by Household Size in Cienega Springs
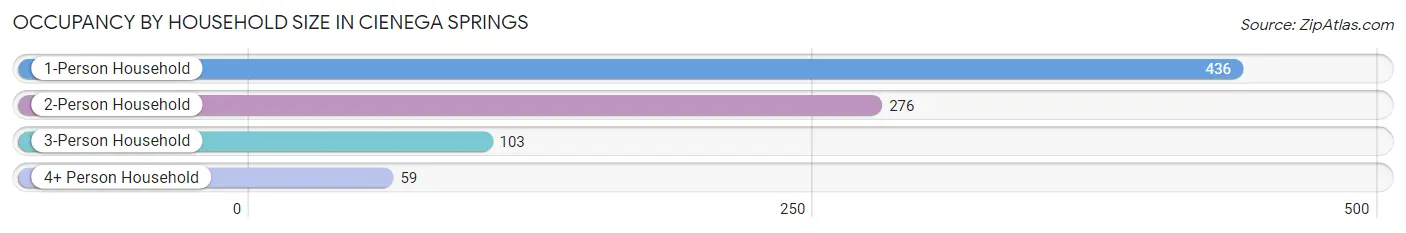
| Household Size | # Housing Units | % Housing Units |
| 1-Person Household | 436 | 49.9% |
| 2-Person Household | 276 | 31.6% |
| 3-Person Household | 103 | 11.8% |
| 4+ Person Household | 59 | 6.8% |
| Total Housing Units | 874 | 100.0% |
Occupancy by Ownership by Household Size in Cienega Springs
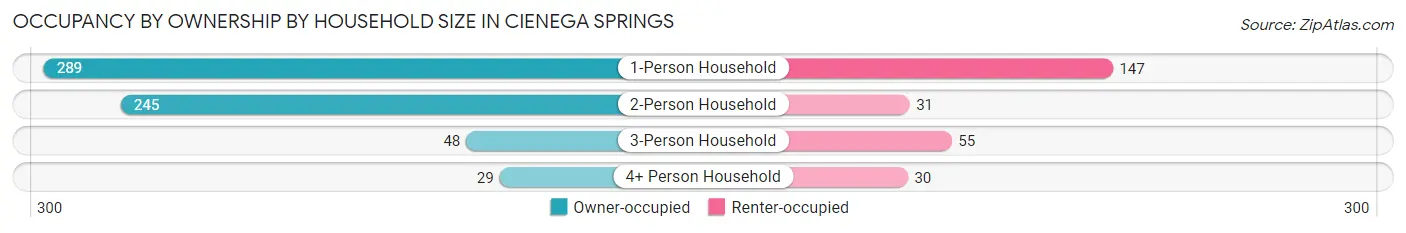
| Household Size | Owner-occupied | Renter-occupied |
| 1-Person Household | 289 (66.3%) | 147 (33.7%) |
| 2-Person Household | 245 (88.8%) | 31 (11.2%) |
| 3-Person Household | 48 (46.6%) | 55 (53.4%) |
| 4+ Person Household | 29 (49.1%) | 30 (50.8%) |
| Total Housing Units | 611 (69.9%) | 263 (30.1%) |
Occupancy by Educational Attainment in Cienega Springs
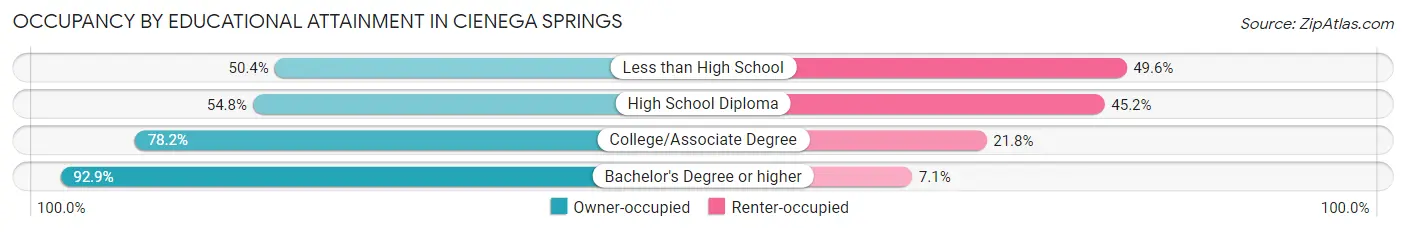
| Household Size | Owner-occupied | Renter-occupied |
| Less than High School | 58 (50.4%) | 57 (49.6%) |
| High School Diploma | 138 (54.8%) | 114 (45.2%) |
| College/Associate Degree | 297 (78.2%) | 83 (21.8%) |
| Bachelor's Degree or higher | 118 (92.9%) | 9 (7.1%) |
Occupancy by Age of Householder in Cienega Springs
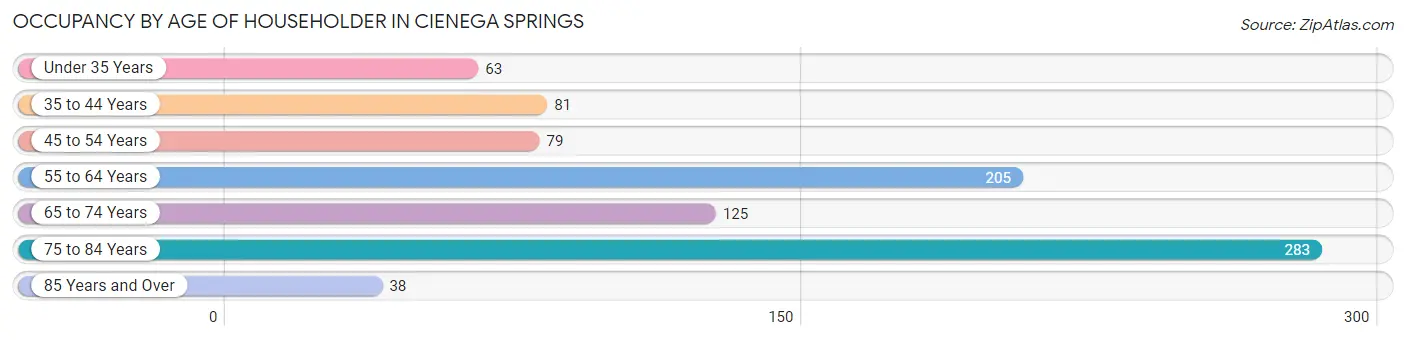
| Age Bracket | # Households | % Households |
| Under 35 Years | 63 | 7.2% |
| 35 to 44 Years | 81 | 9.3% |
| 45 to 54 Years | 79 | 9.0% |
| 55 to 64 Years | 205 | 23.5% |
| 65 to 74 Years | 125 | 14.3% |
| 75 to 84 Years | 283 | 32.4% |
| 85 Years and Over | 38 | 4.3% |
| Total | 874 | 100.0% |
Housing Finances in Cienega Springs
Median Income by Occupancy in Cienega Springs
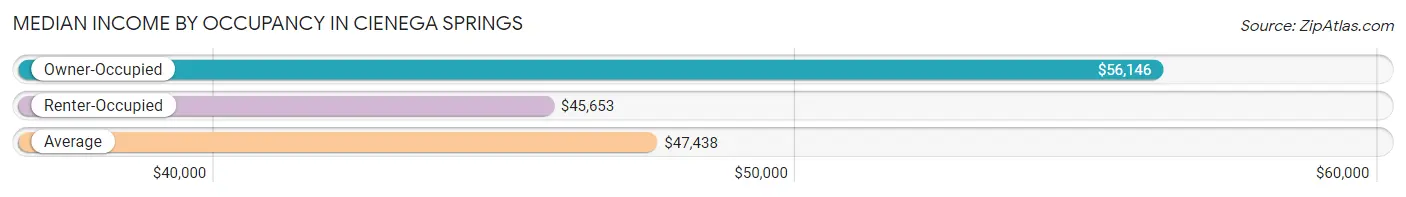
| Occupancy Type | # Households | Median Income |
| Owner-Occupied | 611 (69.9%) | $56,146 |
| Renter-Occupied | 263 (30.1%) | $45,653 |
| Average | 874 (100.0%) | $47,438 |
Occupancy by Householder Income Bracket in Cienega Springs
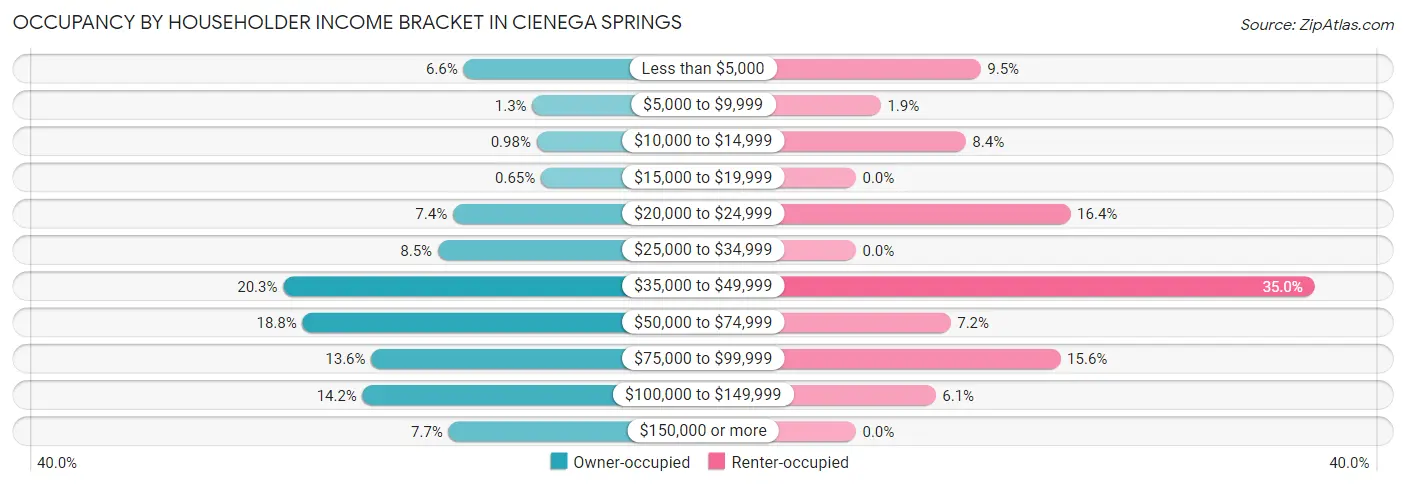
| Income Bracket | Owner-occupied | Renter-occupied |
| Less than $5,000 | 40 (6.6%) | 25 (9.5%) |
| $5,000 to $9,999 | 8 (1.3%) | 5 (1.9%) |
| $10,000 to $14,999 | 6 (1.0%) | 22 (8.4%) |
| $15,000 to $19,999 | 4 (0.6%) | 0 (0.0%) |
| $20,000 to $24,999 | 45 (7.4%) | 43 (16.4%) |
| $25,000 to $34,999 | 52 (8.5%) | 0 (0.0%) |
| $35,000 to $49,999 | 124 (20.3%) | 92 (35.0%) |
| $50,000 to $74,999 | 115 (18.8%) | 19 (7.2%) |
| $75,000 to $99,999 | 83 (13.6%) | 41 (15.6%) |
| $100,000 to $149,999 | 87 (14.2%) | 16 (6.1%) |
| $150,000 or more | 47 (7.7%) | 0 (0.0%) |
| Total | 611 (100.0%) | 263 (100.0%) |
Monthly Housing Cost Tiers in Cienega Springs
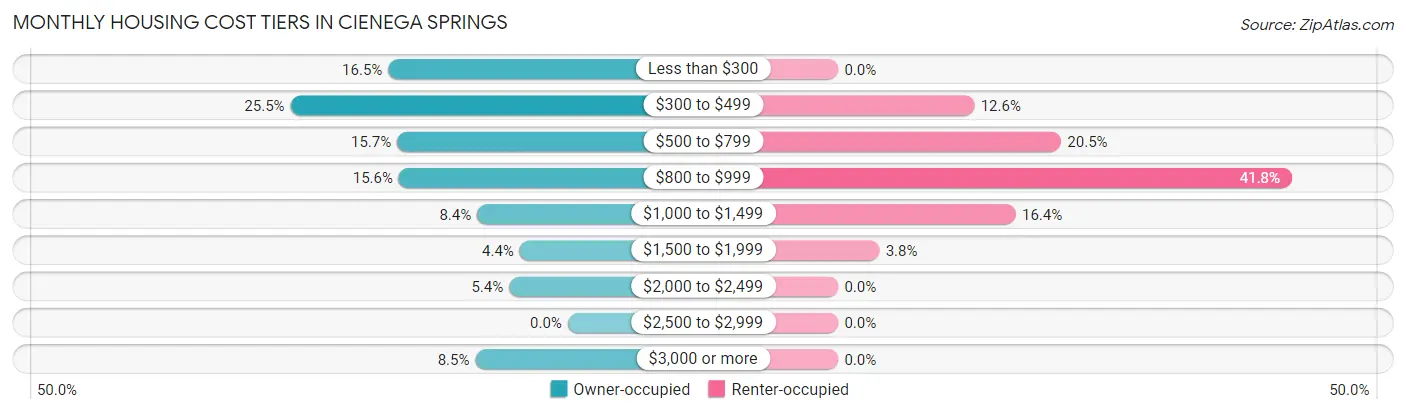
| Monthly Cost | Owner-occupied | Renter-occupied |
| Less than $300 | 101 (16.5%) | 0 (0.0%) |
| $300 to $499 | 156 (25.5%) | 33 (12.6%) |
| $500 to $799 | 96 (15.7%) | 54 (20.5%) |
| $800 to $999 | 95 (15.5%) | 110 (41.8%) |
| $1,000 to $1,499 | 51 (8.4%) | 43 (16.4%) |
| $1,500 to $1,999 | 27 (4.4%) | 10 (3.8%) |
| $2,000 to $2,499 | 33 (5.4%) | 0 (0.0%) |
| $2,500 to $2,999 | 0 (0.0%) | 0 (0.0%) |
| $3,000 or more | 52 (8.5%) | 0 (0.0%) |
| Total | 611 (100.0%) | 263 (100.0%) |
Physical Housing Characteristics in Cienega Springs
Housing Structures in Cienega Springs
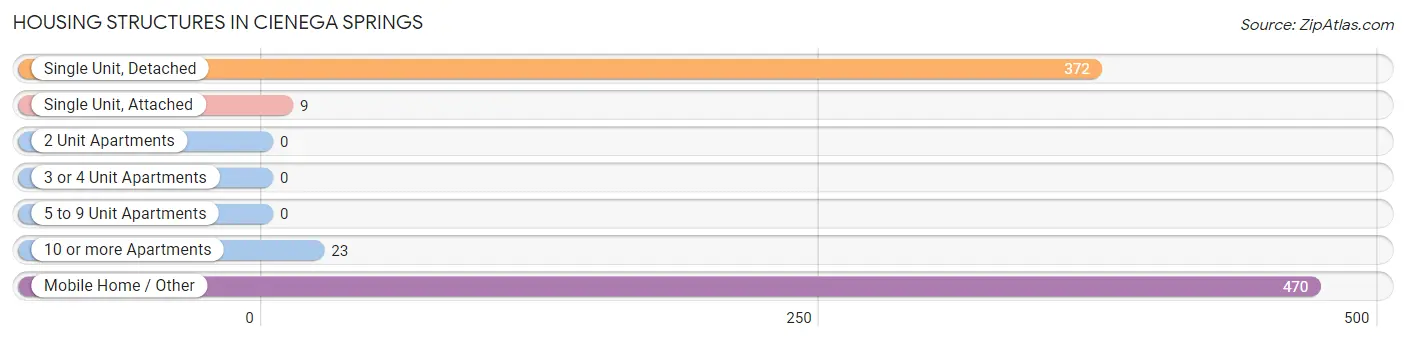
| Structure Type | # Housing Units | % Housing Units |
| Single Unit, Detached | 372 | 42.6% |
| Single Unit, Attached | 9 | 1.0% |
| 2 Unit Apartments | 0 | 0.0% |
| 3 or 4 Unit Apartments | 0 | 0.0% |
| 5 to 9 Unit Apartments | 0 | 0.0% |
| 10 or more Apartments | 23 | 2.6% |
| Mobile Home / Other | 470 | 53.8% |
| Total | 874 | 100.0% |
Housing Structures by Occupancy in Cienega Springs
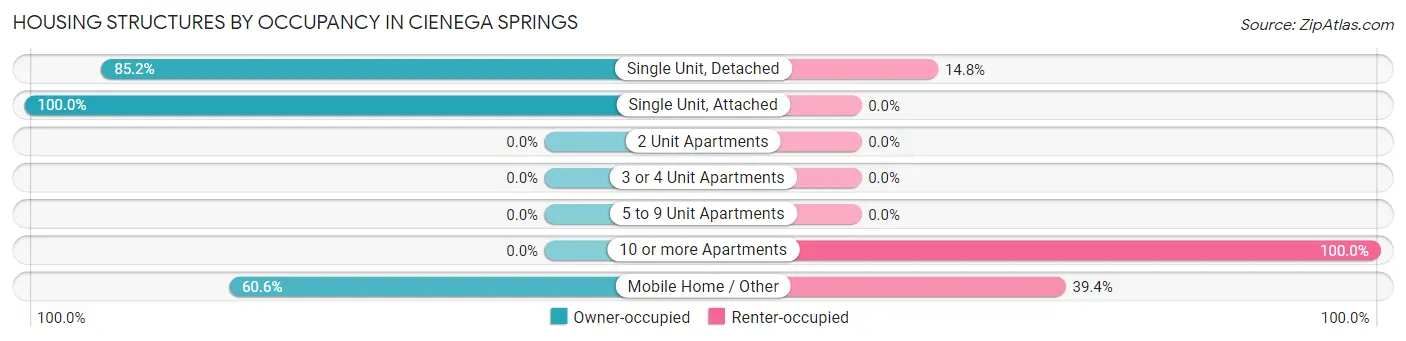
| Structure Type | Owner-occupied | Renter-occupied |
| Single Unit, Detached | 317 (85.2%) | 55 (14.8%) |
| Single Unit, Attached | 9 (100.0%) | 0 (0.0%) |
| 2 Unit Apartments | 0 (0.0%) | 0 (0.0%) |
| 3 or 4 Unit Apartments | 0 (0.0%) | 0 (0.0%) |
| 5 to 9 Unit Apartments | 0 (0.0%) | 0 (0.0%) |
| 10 or more Apartments | 0 (0.0%) | 23 (100.0%) |
| Mobile Home / Other | 285 (60.6%) | 185 (39.4%) |
| Total | 611 (69.9%) | 263 (30.1%) |
Housing Structures by Number of Rooms in Cienega Springs
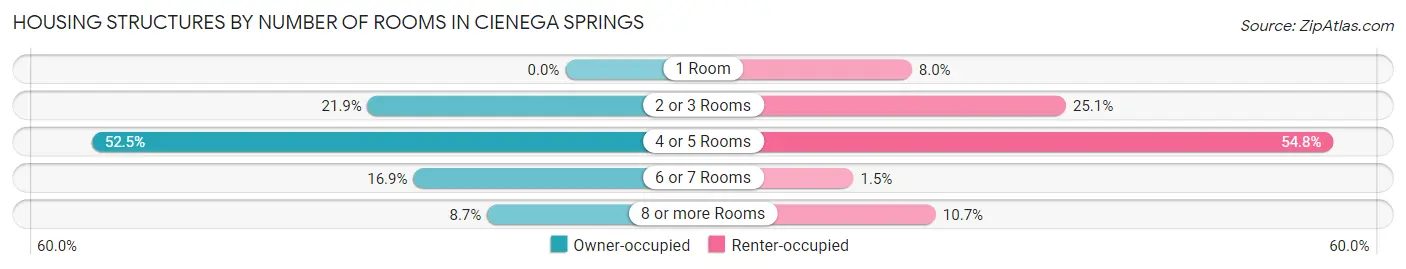
| Number of Rooms | Owner-occupied | Renter-occupied |
| 1 Room | 0 (0.0%) | 21 (8.0%) |
| 2 or 3 Rooms | 134 (21.9%) | 66 (25.1%) |
| 4 or 5 Rooms | 321 (52.5%) | 144 (54.7%) |
| 6 or 7 Rooms | 103 (16.9%) | 4 (1.5%) |
| 8 or more Rooms | 53 (8.7%) | 28 (10.6%) |
| Total | 611 (100.0%) | 263 (100.0%) |
Housing Structure by Heating Type in Cienega Springs
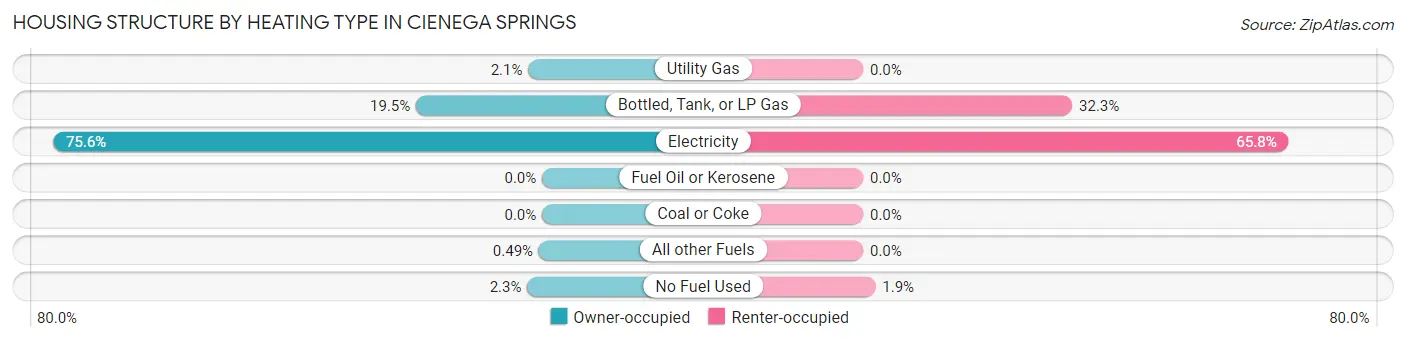
| Heating Type | Owner-occupied | Renter-occupied |
| Utility Gas | 13 (2.1%) | 0 (0.0%) |
| Bottled, Tank, or LP Gas | 119 (19.5%) | 85 (32.3%) |
| Electricity | 462 (75.6%) | 173 (65.8%) |
| Fuel Oil or Kerosene | 0 (0.0%) | 0 (0.0%) |
| Coal or Coke | 0 (0.0%) | 0 (0.0%) |
| All other Fuels | 3 (0.5%) | 0 (0.0%) |
| No Fuel Used | 14 (2.3%) | 5 (1.9%) |
| Total | 611 (100.0%) | 263 (100.0%) |
Household Vehicle Usage in Cienega Springs
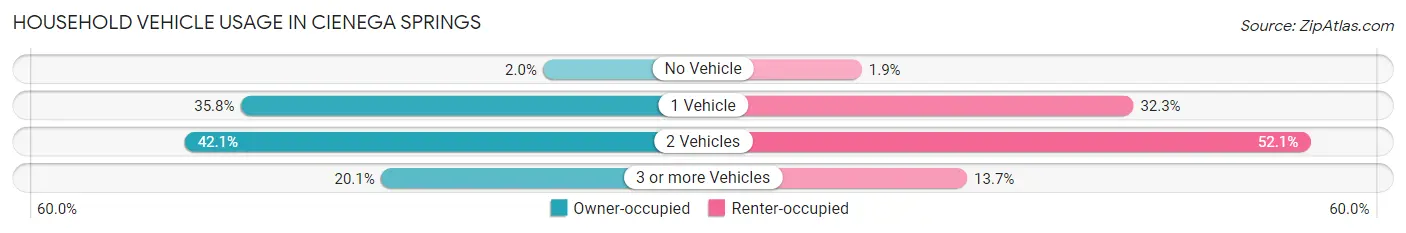
| Vehicles per Household | Owner-occupied | Renter-occupied |
| No Vehicle | 12 (2.0%) | 5 (1.9%) |
| 1 Vehicle | 219 (35.8%) | 85 (32.3%) |
| 2 Vehicles | 257 (42.1%) | 137 (52.1%) |
| 3 or more Vehicles | 123 (20.1%) | 36 (13.7%) |
| Total | 611 (100.0%) | 263 (100.0%) |
Real Estate & Mortgages in Cienega Springs
Real Estate and Mortgage Overview in Cienega Springs
| Characteristic | Without Mortgage | With Mortgage |
| Housing Units | 409 | 202 |
| Median Property Value | $171,900 | $0 |
| Median Household Income | $42,270 | $38 |
| Monthly Housing Costs | $456 | $52 |
| Real Estate Taxes | $1,227 | $25 |
Property Value by Mortgage Status in Cienega Springs
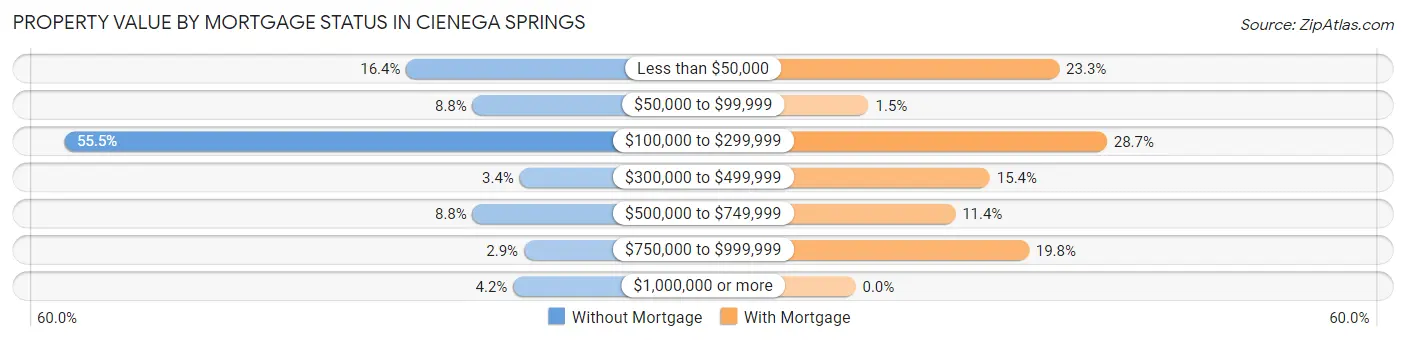
| Property Value | Without Mortgage | With Mortgage |
| Less than $50,000 | 67 (16.4%) | 47 (23.3%) |
| $50,000 to $99,999 | 36 (8.8%) | 3 (1.5%) |
| $100,000 to $299,999 | 227 (55.5%) | 58 (28.7%) |
| $300,000 to $499,999 | 14 (3.4%) | 31 (15.3%) |
| $500,000 to $749,999 | 36 (8.8%) | 23 (11.4%) |
| $750,000 to $999,999 | 12 (2.9%) | 40 (19.8%) |
| $1,000,000 or more | 17 (4.2%) | 0 (0.0%) |
| Total | 409 (100.0%) | 202 (100.0%) |
Household Income by Mortgage Status in Cienega Springs
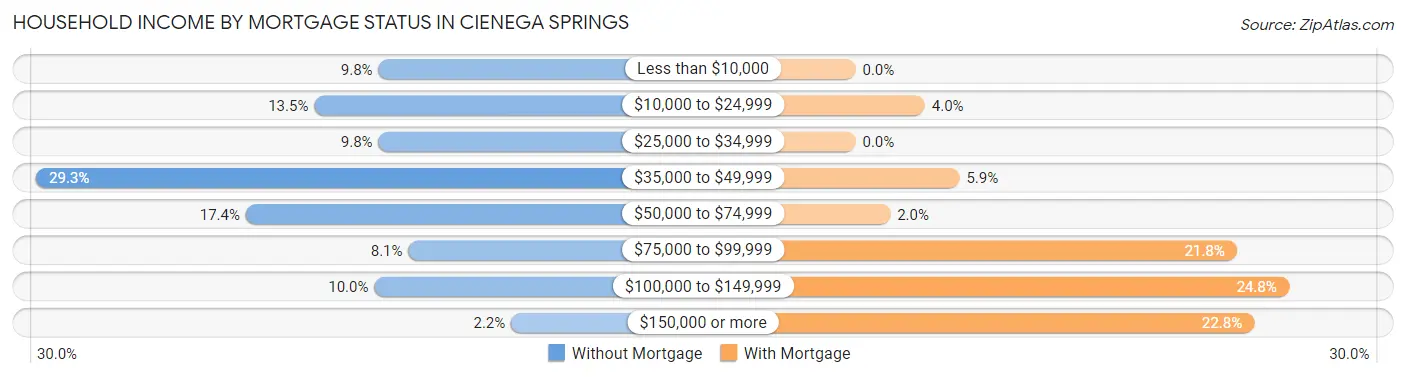
| Household Income | Without Mortgage | With Mortgage |
| Less than $10,000 | 40 (9.8%) | 0 (0.0%) |
| $10,000 to $24,999 | 55 (13.5%) | 8 (4.0%) |
| $25,000 to $34,999 | 40 (9.8%) | 0 (0.0%) |
| $35,000 to $49,999 | 120 (29.3%) | 12 (5.9%) |
| $50,000 to $74,999 | 71 (17.4%) | 4 (2.0%) |
| $75,000 to $99,999 | 33 (8.1%) | 44 (21.8%) |
| $100,000 to $149,999 | 41 (10.0%) | 50 (24.7%) |
| $150,000 or more | 9 (2.2%) | 46 (22.8%) |
| Total | 409 (100.0%) | 202 (100.0%) |
Property Value to Household Income Ratio in Cienega Springs
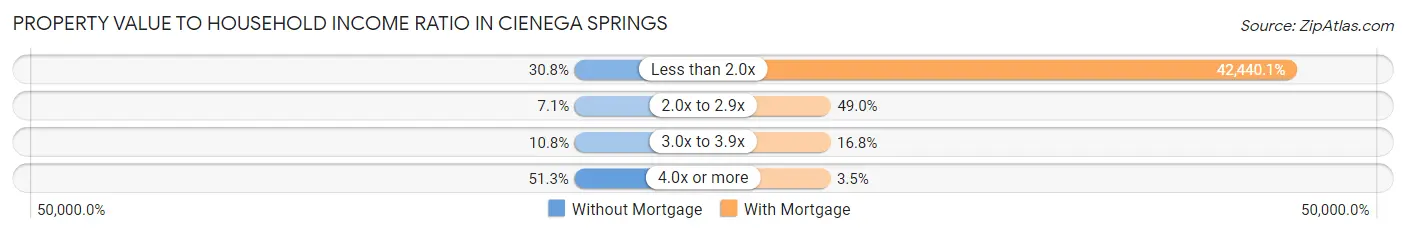
| Value-to-Income Ratio | Without Mortgage | With Mortgage |
| Less than 2.0x | 126 (30.8%) | 85,729 (42,440.1%) |
| 2.0x to 2.9x | 29 (7.1%) | 99 (49.0%) |
| 3.0x to 3.9x | 44 (10.8%) | 34 (16.8%) |
| 4.0x or more | 210 (51.3%) | 7 (3.5%) |
| Total | 409 (100.0%) | 202 (100.0%) |
Real Estate Taxes by Mortgage Status in Cienega Springs
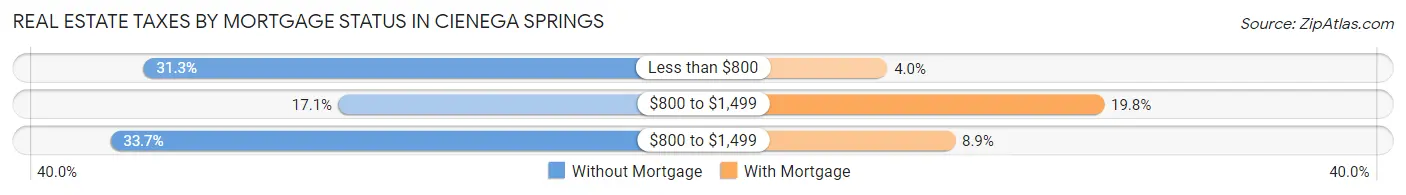
| Property Taxes | Without Mortgage | With Mortgage |
| Less than $800 | 128 (31.3%) | 8 (4.0%) |
| $800 to $1,499 | 70 (17.1%) | 40 (19.8%) |
| $800 to $1,499 | 138 (33.7%) | 18 (8.9%) |
| Total | 409 (100.0%) | 202 (100.0%) |
Health & Disability in Cienega Springs
Health Insurance Coverage by Age in Cienega Springs
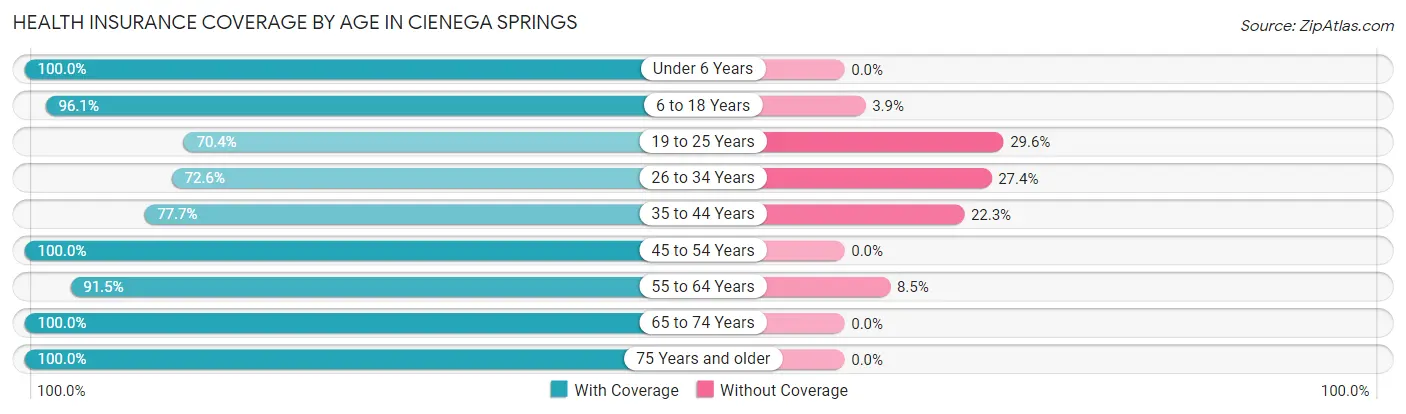
| Age Bracket | With Coverage | Without Coverage |
| Under 6 Years | 25 (100.0%) | 0 (0.0%) |
| 6 to 18 Years | 148 (96.1%) | 6 (3.9%) |
| 19 to 25 Years | 38 (70.4%) | 16 (29.6%) |
| 26 to 34 Years | 53 (72.6%) | 20 (27.4%) |
| 35 to 44 Years | 94 (77.7%) | 27 (22.3%) |
| 45 to 54 Years | 134 (100.0%) | 0 (0.0%) |
| 55 to 64 Years | 333 (91.5%) | 31 (8.5%) |
| 65 to 74 Years | 157 (100.0%) | 0 (0.0%) |
| 75 Years and older | 359 (100.0%) | 0 (0.0%) |
| Total | 1,341 (93.1%) | 100 (6.9%) |
Health Insurance Coverage by Citizenship Status in Cienega Springs
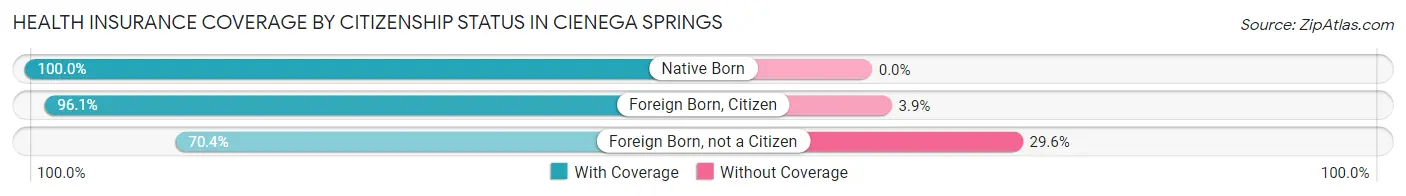
| Citizenship Status | With Coverage | Without Coverage |
| Native Born | 25 (100.0%) | 0 (0.0%) |
| Foreign Born, Citizen | 148 (96.1%) | 6 (3.9%) |
| Foreign Born, not a Citizen | 38 (70.4%) | 16 (29.6%) |
Health Insurance Coverage by Household Income in Cienega Springs
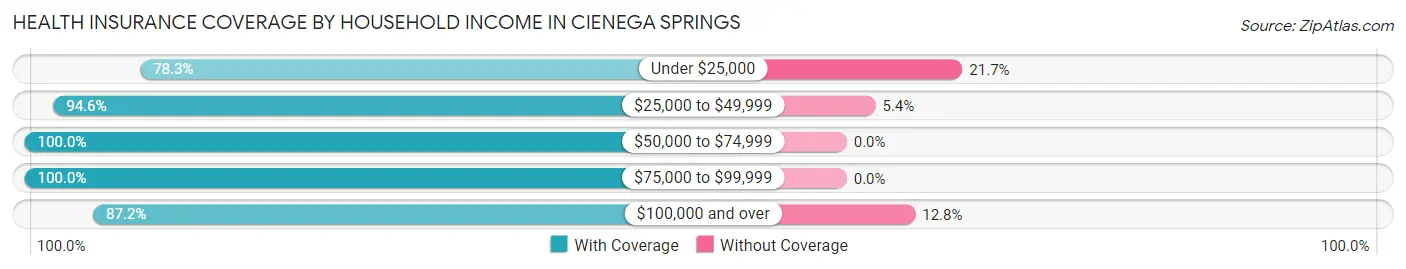
| Household Income | With Coverage | Without Coverage |
| Under $25,000 | 170 (78.3%) | 47 (21.7%) |
| $25,000 to $49,999 | 334 (94.6%) | 19 (5.4%) |
| $50,000 to $74,999 | 250 (100.0%) | 0 (0.0%) |
| $75,000 to $99,999 | 356 (100.0%) | 0 (0.0%) |
| $100,000 and over | 231 (87.2%) | 34 (12.8%) |
Public vs Private Health Insurance Coverage by Age in Cienega Springs
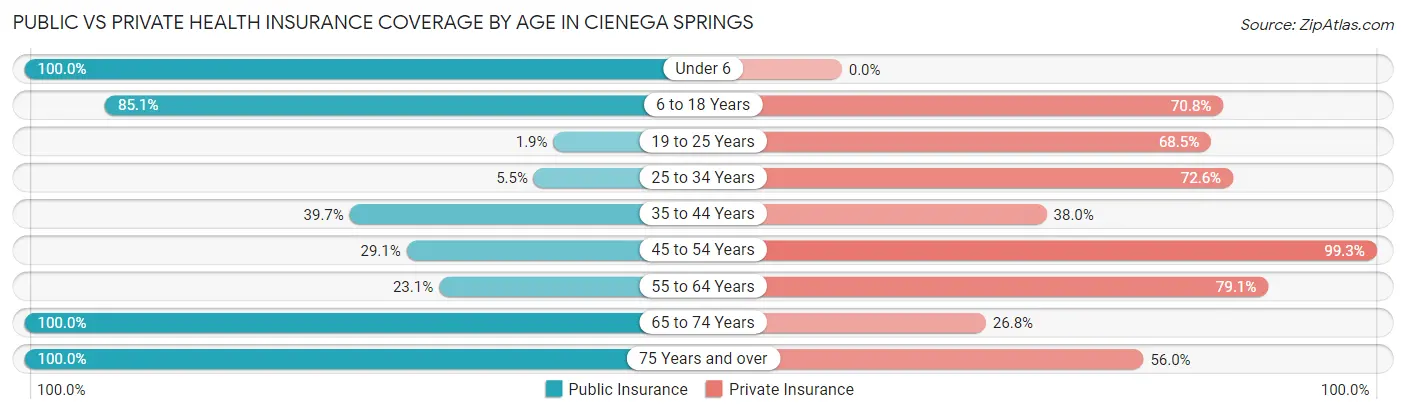
| Age Bracket | Public Insurance | Private Insurance |
| Under 6 | 25 (100.0%) | 0 (0.0%) |
| 6 to 18 Years | 131 (85.1%) | 109 (70.8%) |
| 19 to 25 Years | 1 (1.8%) | 37 (68.5%) |
| 25 to 34 Years | 4 (5.5%) | 53 (72.6%) |
| 35 to 44 Years | 48 (39.7%) | 46 (38.0%) |
| 45 to 54 Years | 39 (29.1%) | 133 (99.3%) |
| 55 to 64 Years | 84 (23.1%) | 288 (79.1%) |
| 65 to 74 Years | 157 (100.0%) | 42 (26.8%) |
| 75 Years and over | 359 (100.0%) | 201 (56.0%) |
| Total | 848 (58.9%) | 909 (63.1%) |
Disability Status by Sex by Age in Cienega Springs
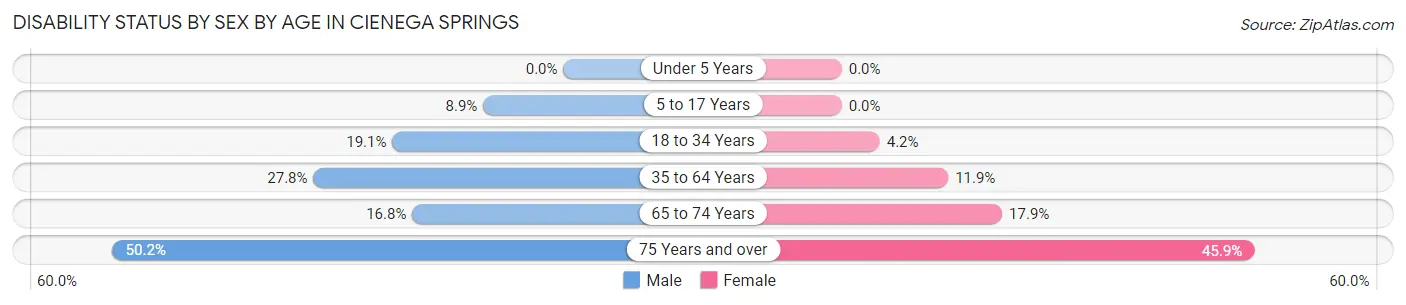
| Age Bracket | Male | Female |
| Under 5 Years | 0 (0.0%) | 0 (0.0%) |
| 5 to 17 Years | 10 (8.9%) | 0 (0.0%) |
| 18 to 34 Years | 12 (19.1%) | 3 (4.2%) |
| 35 to 64 Years | 76 (27.8%) | 41 (11.8%) |
| 65 to 74 Years | 17 (16.8%) | 10 (17.9%) |
| 75 Years and over | 131 (50.2%) | 45 (45.9%) |
Disability Class by Sex by Age in Cienega Springs
Disability Class: Hearing Difficulty
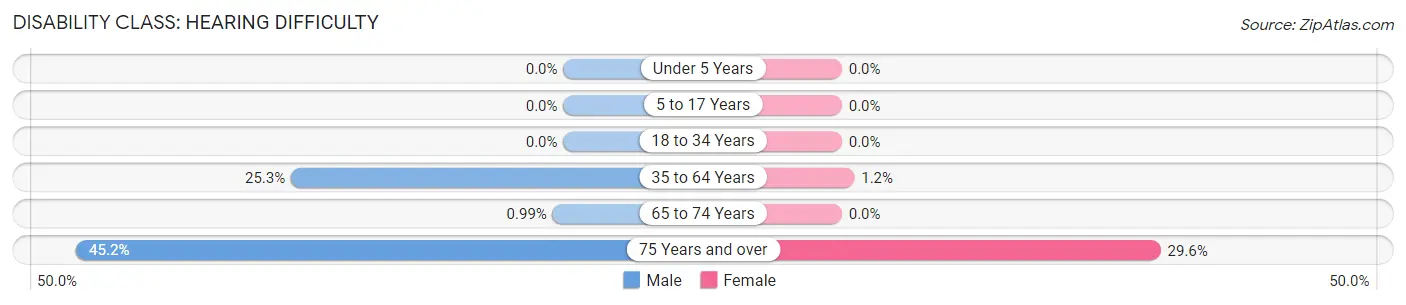
| Age Bracket | Male | Female |
| Under 5 Years | 0 (0.0%) | 0 (0.0%) |
| 5 to 17 Years | 0 (0.0%) | 0 (0.0%) |
| 18 to 34 Years | 0 (0.0%) | 0 (0.0%) |
| 35 to 64 Years | 69 (25.3%) | 4 (1.2%) |
| 65 to 74 Years | 1 (1.0%) | 0 (0.0%) |
| 75 Years and over | 118 (45.2%) | 29 (29.6%) |
Disability Class: Vision Difficulty
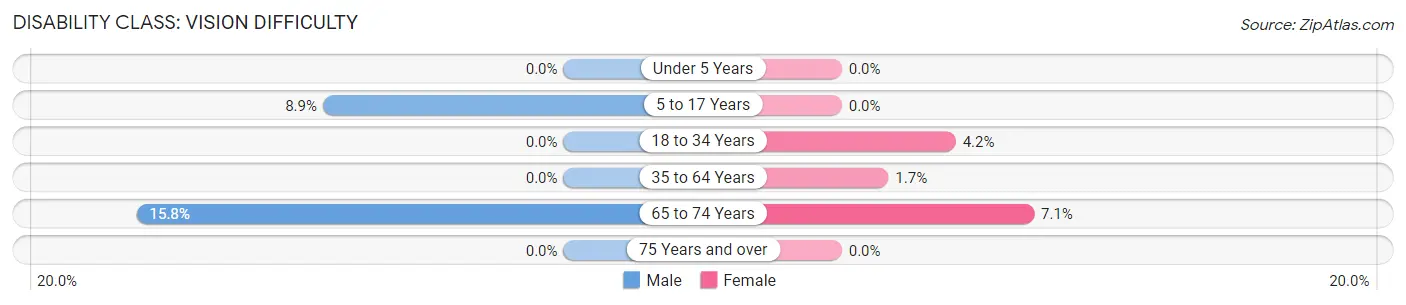
| Age Bracket | Male | Female |
| Under 5 Years | 0 (0.0%) | 0 (0.0%) |
| 5 to 17 Years | 10 (8.9%) | 0 (0.0%) |
| 18 to 34 Years | 0 (0.0%) | 3 (4.2%) |
| 35 to 64 Years | 0 (0.0%) | 6 (1.7%) |
| 65 to 74 Years | 16 (15.8%) | 4 (7.1%) |
| 75 Years and over | 0 (0.0%) | 0 (0.0%) |
Disability Class: Cognitive Difficulty
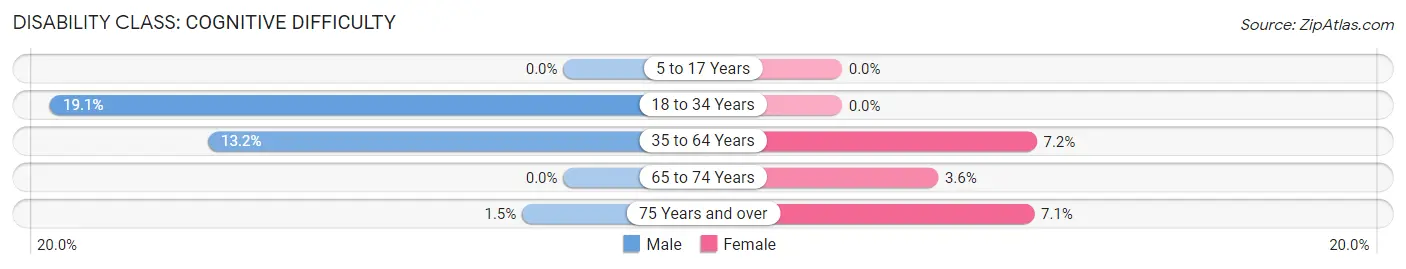
| Age Bracket | Male | Female |
| 5 to 17 Years | 0 (0.0%) | 0 (0.0%) |
| 18 to 34 Years | 12 (19.1%) | 0 (0.0%) |
| 35 to 64 Years | 36 (13.2%) | 25 (7.2%) |
| 65 to 74 Years | 0 (0.0%) | 2 (3.6%) |
| 75 Years and over | 4 (1.5%) | 7 (7.1%) |
Disability Class: Ambulatory Difficulty
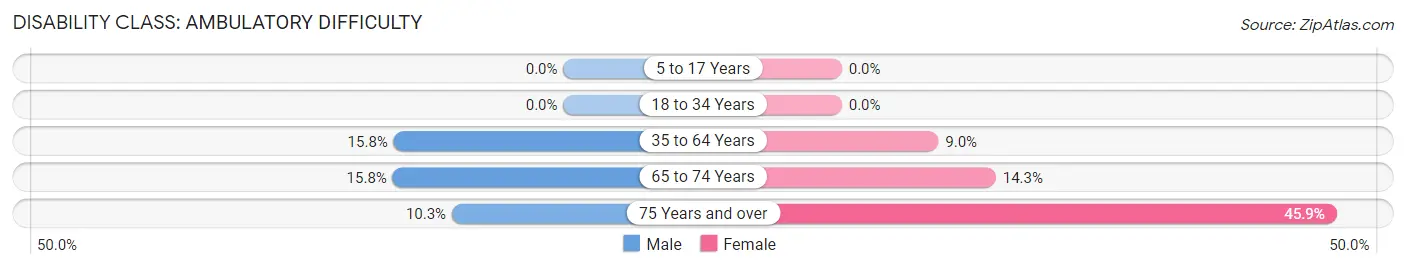
| Age Bracket | Male | Female |
| 5 to 17 Years | 0 (0.0%) | 0 (0.0%) |
| 18 to 34 Years | 0 (0.0%) | 0 (0.0%) |
| 35 to 64 Years | 43 (15.8%) | 31 (9.0%) |
| 65 to 74 Years | 16 (15.8%) | 8 (14.3%) |
| 75 Years and over | 27 (10.3%) | 45 (45.9%) |
Disability Class: Self-Care Difficulty
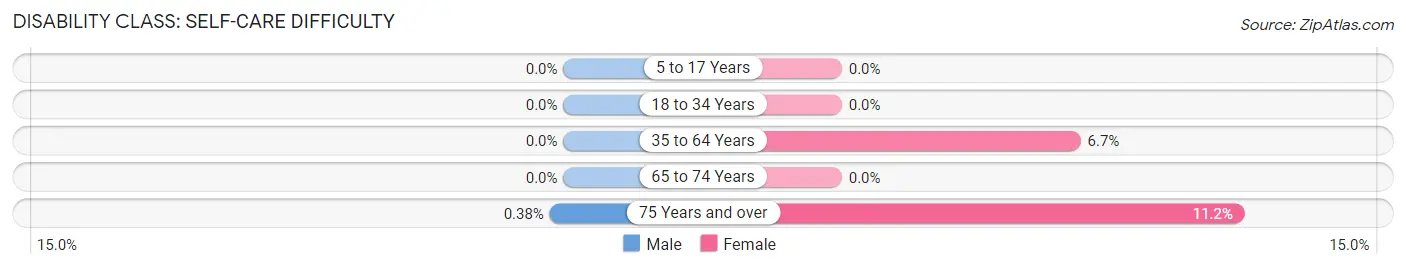
| Age Bracket | Male | Female |
| 5 to 17 Years | 0 (0.0%) | 0 (0.0%) |
| 18 to 34 Years | 0 (0.0%) | 0 (0.0%) |
| 35 to 64 Years | 0 (0.0%) | 23 (6.7%) |
| 65 to 74 Years | 0 (0.0%) | 0 (0.0%) |
| 75 Years and over | 1 (0.4%) | 11 (11.2%) |
Technology Access in Cienega Springs
Computing Device Access in Cienega Springs
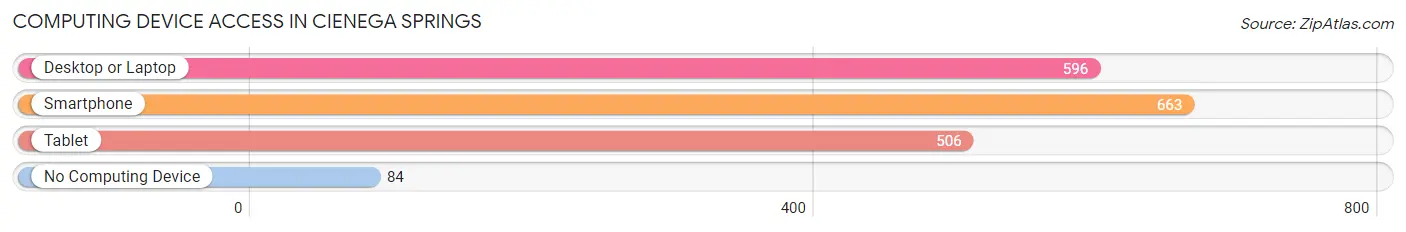
| Device Type | # Households | % Households |
| Desktop or Laptop | 596 | 68.2% |
| Smartphone | 663 | 75.9% |
| Tablet | 506 | 57.9% |
| No Computing Device | 84 | 9.6% |
| Total | 874 | 100.0% |
Internet Access in Cienega Springs
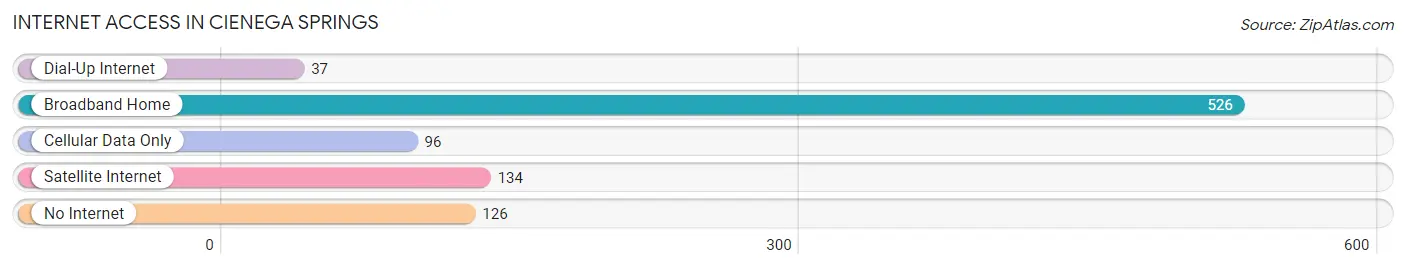
| Internet Type | # Households | % Households |
| Dial-Up Internet | 37 | 4.2% |
| Broadband Home | 526 | 60.2% |
| Cellular Data Only | 96 | 11.0% |
| Satellite Internet | 134 | 15.3% |
| No Internet | 126 | 14.4% |
| Total | 874 | 100.0% |
Cienega Springs Summary
Cienega Springs, Arizona is a small unincorporated community located in Cochise County, Arizona. It is situated in the San Pedro Valley, approximately 25 miles southeast of Sierra Vista and about 50 miles southeast of Tucson. The population of Cienega Springs was estimated to be around 1,000 in 2020.
History
Cienega Springs was originally established in the late 1800s as a stagecoach stop and watering hole for travelers. The area was known for its natural springs, which provided a reliable source of water for the travelers. The springs were also used by the local Apache Indians for centuries.
In the early 1900s, the area was developed as a resort town, with a hotel, a general store, and a post office. The town was named after the nearby Cienega Creek, which was named for the Spanish word for “marsh”.
In the 1950s, the town began to decline as the railroad bypassed it and the highway was built. The hotel and post office closed, and the population dwindled. In the 1970s, the town was revitalized when a new highway was built, connecting it to Sierra Vista and Tucson.
Geography
Cienega Springs is located in the San Pedro Valley, which is part of the Basin and Range Province. The valley is surrounded by the Huachuca Mountains to the west and the Chiricahua Mountains to the east. The valley is characterized by rolling hills and grasslands, with occasional stands of juniper and oak trees.
The climate in Cienega Springs is semi-arid, with hot summers and mild winters. The average annual temperature is around 70°F, with an average high of 90°F in the summer and an average low of 50°F in the winter. The average annual precipitation is around 12 inches.
Economy
The economy of Cienega Springs is largely based on agriculture and tourism. The area is known for its cattle ranching and farming, with crops such as alfalfa, cotton, and wheat. The town is also home to several wineries and vineyards, which attract tourists from around the region.
In addition, Cienega Springs is home to several small businesses, including restaurants, shops, and galleries. The town is also home to a number of bed and breakfasts, which attract visitors from around the world.
Demographics
As of 2020, the population of Cienega Springs was estimated to be around 1,000. The population is largely white (90%), with a small Hispanic population (7%) and a small Native American population (3%). The median household income is around $50,000, and the median home value is around $200,000.
Cienega Springs is a small, rural community with a strong sense of community and a rich history. The town is known for its natural beauty, its agricultural heritage, and its friendly people. It is a great place to live, work, and visit.
Common Questions
What is Per Capita Income in Cienega Springs?
Per Capita income in Cienega Springs is $35,401.
What is the Median Family Income in Cienega Springs?
Median Family Income in Cienega Springs is $75,573.
What is the Median Household income in Cienega Springs?
Median Household Income in Cienega Springs is $47,438.
What is Income or Wage Gap in Cienega Springs?
Income or Wage Gap in Cienega Springs is 7.3%.
Women in Cienega Springs earn 92.7 cents for every dollar earned by a man.
What is Inequality or Gini Index in Cienega Springs?
Inequality or Gini Index in Cienega Springs is 0.42.
What is the Total Population of Cienega Springs?
Total Population of Cienega Springs is 1,441.
What is the Total Male Population of Cienega Springs?
Total Male Population of Cienega Springs is 835.
What is the Total Female Population of Cienega Springs?
Total Female Population of Cienega Springs is 606.
What is the Ratio of Males per 100 Females in Cienega Springs?
There are 137.79 Males per 100 Females in Cienega Springs.
What is the Ratio of Females per 100 Males in Cienega Springs?
There are 72.57 Females per 100 Males in Cienega Springs.
What is the Median Population Age in Cienega Springs?
Median Population Age in Cienega Springs is 59.9 Years.
What is the Average Family Size in Cienega Springs
Average Family Size in Cienega Springs is 2.1 People.
What is the Average Household Size in Cienega Springs
Average Household Size in Cienega Springs is 1.6 People.
How Large is the Labor Force in Cienega Springs?
There are 522 People in the Labor Forcein in Cienega Springs.
What is the Percentage of People in the Labor Force in Cienega Springs?
41.0% of People are in the Labor Force in Cienega Springs.
What is the Unemployment Rate in Cienega Springs?
Unemployment Rate in Cienega Springs is 2.3%.