Bagdad, AZ Map & Demographics
Bagdad Map
Bagdad Overview
$22,996
PER CAPITA INCOME
$86,513
AVG FAMILY INCOME
$81,417
AVG HOUSEHOLD INCOME
56.8%
WAGE / INCOME GAP [ % ]
43.2¢/ $1
WAGE / INCOME GAP [ $ ]
0.25
INEQUALITY / GINI INDEX
2,661
TOTAL POPULATION
1,326
MALE POPULATION
1,335
FEMALE POPULATION
99.33
MALES / 100 FEMALES
100.68
FEMALES / 100 MALES
22.0
MEDIAN AGE
3.6
AVG FAMILY SIZE
3.5
AVG HOUSEHOLD SIZE
1,096
LABOR FORCE [ PEOPLE ]
67.3%
PERCENT IN LABOR FORCE
Bagdad Zip Codes
Bagdad Area Codes
Income in Bagdad
Income Overview in Bagdad
Per Capita Income in Bagdad is $22,996, while median incomes of families and households are $86,513 and $81,417 respectively.
| Characteristic | Number | Measure |
| Per Capita Income | 2,661 | $22,996 |
| Median Family Income | 641 | $86,513 |
| Mean Family Income | 641 | $79,929 |
| Median Household Income | 753 | $81,417 |
| Mean Household Income | 753 | $86,770 |
| Income Deficit | 641 | $0 |
| Wage / Income Gap (%) | 2,661 | 56.76% |
| Wage / Income Gap ($) | 2,661 | 43.24¢ per $1 |
| Gini / Inequality Index | 2,661 | 0.25 |
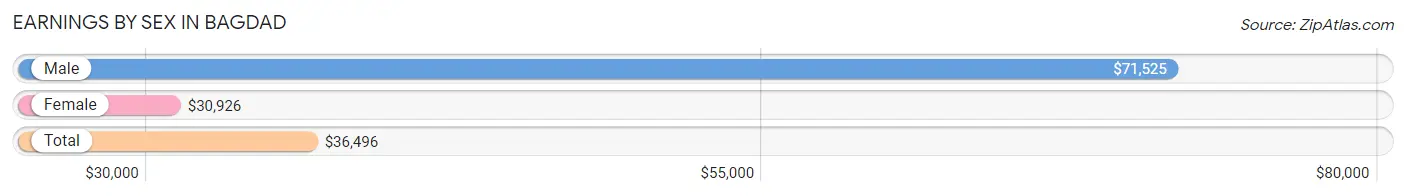
Earnings by Sex in Bagdad
Average Earnings in Bagdad are $36,496, $71,525 for men and $30,926 for women, a difference of 56.8%.
| Sex | Number | Average Earnings |
| Male | 656 (58.7%) | $71,525 |
| Female | 462 (41.3%) | $30,926 |
| Total | 1,118 (100.0%) | $36,496 |
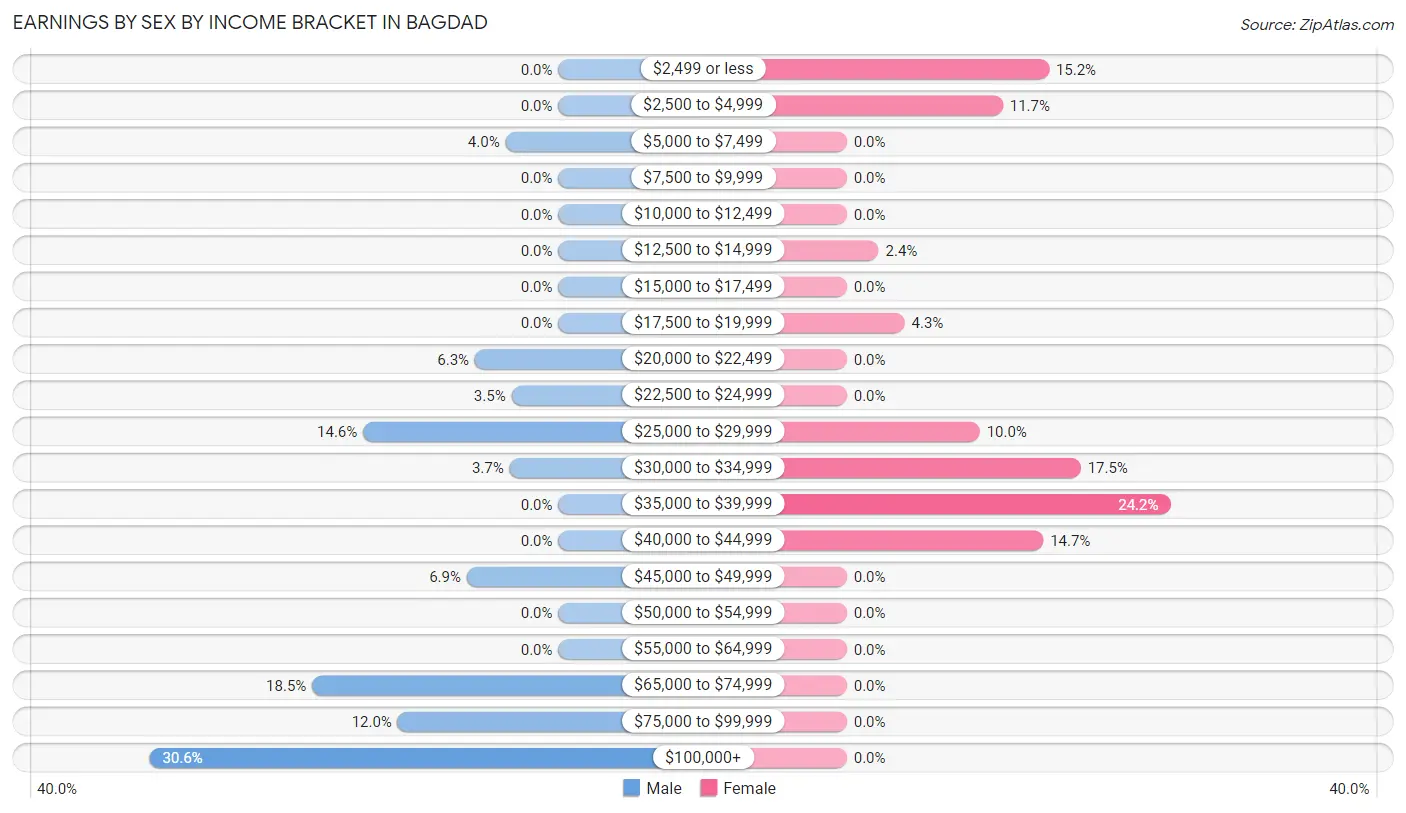
Earnings by Sex by Income Bracket in Bagdad
The most common earnings brackets in Bagdad are $100,000+ for men (201 | 30.6%) and $35,000 to $39,999 for women (112 | 24.2%).
| Income | Male | Female |
| $2,499 or less | 0 (0.0%) | 70 (15.1%) |
| $2,500 to $4,999 | 0 (0.0%) | 54 (11.7%) |
| $5,000 to $7,499 | 26 (4.0%) | 0 (0.0%) |
| $7,500 to $9,999 | 0 (0.0%) | 0 (0.0%) |
| $10,000 to $12,499 | 0 (0.0%) | 0 (0.0%) |
| $12,500 to $14,999 | 0 (0.0%) | 11 (2.4%) |
| $15,000 to $17,499 | 0 (0.0%) | 0 (0.0%) |
| $17,500 to $19,999 | 0 (0.0%) | 20 (4.3%) |
| $20,000 to $22,499 | 41 (6.2%) | 0 (0.0%) |
| $22,500 to $24,999 | 23 (3.5%) | 0 (0.0%) |
| $25,000 to $29,999 | 96 (14.6%) | 46 (10.0%) |
| $30,000 to $34,999 | 24 (3.7%) | 81 (17.5%) |
| $35,000 to $39,999 | 0 (0.0%) | 112 (24.2%) |
| $40,000 to $44,999 | 0 (0.0%) | 68 (14.7%) |
| $45,000 to $49,999 | 45 (6.9%) | 0 (0.0%) |
| $50,000 to $54,999 | 0 (0.0%) | 0 (0.0%) |
| $55,000 to $64,999 | 0 (0.0%) | 0 (0.0%) |
| $65,000 to $74,999 | 121 (18.4%) | 0 (0.0%) |
| $75,000 to $99,999 | 79 (12.0%) | 0 (0.0%) |
| $100,000+ | 201 (30.6%) | 0 (0.0%) |
| Total | 656 (100.0%) | 462 (100.0%) |
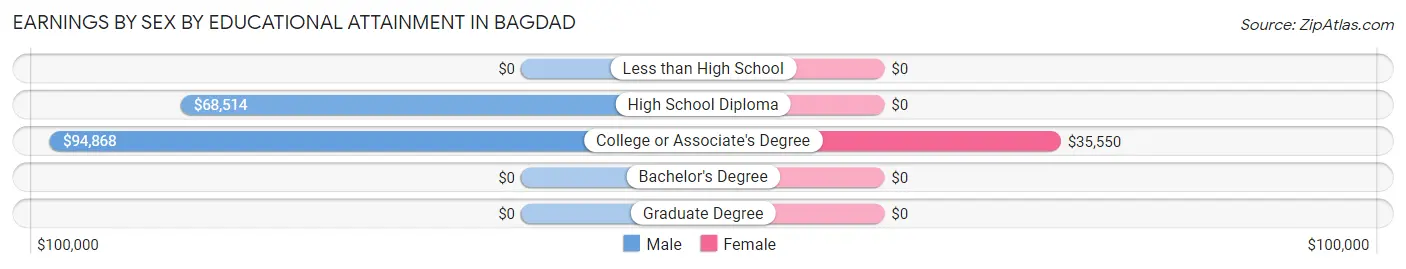
Earnings by Sex by Educational Attainment in Bagdad
Average earnings in Bagdad are $86,912 for men and $35,513 for women, a difference of 59.1%. Men with an educational attainment of college or associate's degree enjoy the highest average annual earnings of $94,868, while those with high school diploma education earn the least with $68,514. Women with an educational attainment of college or associate's degree earn the most with the average annual earnings of $35,550, while those with college or associate's degree education have the smallest earnings of $35,550.
| Educational Attainment | Male Income | Female Income |
| Less than High School | - | - |
| High School Diploma | $68,514 | $0 |
| College or Associate's Degree | $94,868 | $35,550 |
| Bachelor's Degree | - | - |
| Graduate Degree | - | - |
| Total | $86,912 | $35,513 |
Family Income in Bagdad
Family Income Brackets in Bagdad
According to the Bagdad family income data, there are 224 families falling into the $100,000 to $149,999 income range, which is the most common income bracket and makes up 34.9% of all families.
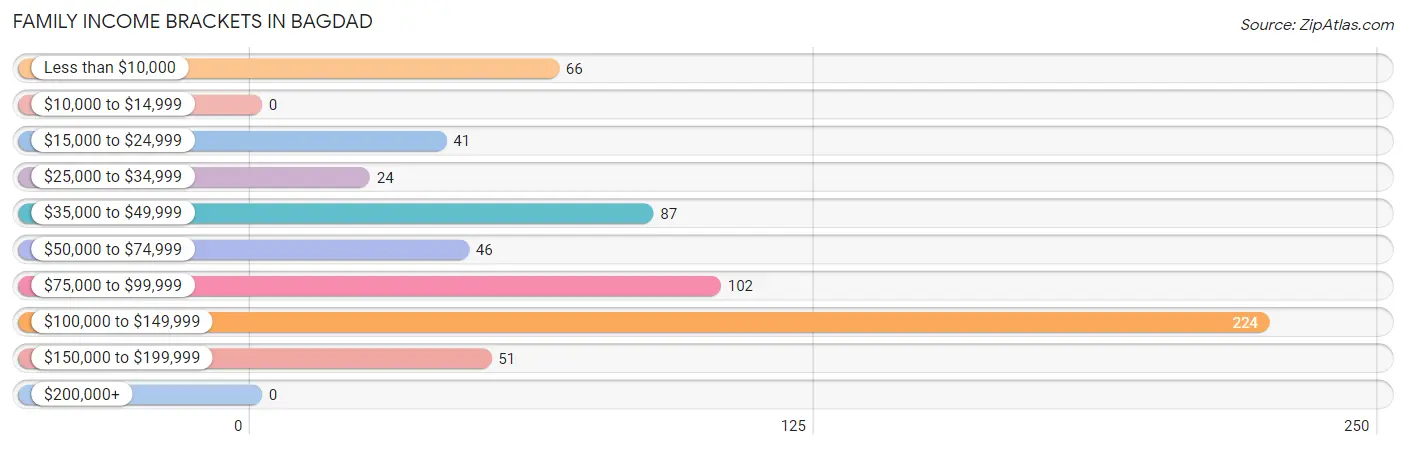
| Income Bracket | # Families | % Families |
| Less than $10,000 | 66 | 10.3% |
| $10,000 to $14,999 | 0 | 0.0% |
| $15,000 to $24,999 | 41 | 6.4% |
| $25,000 to $34,999 | 24 | 3.7% |
| $35,000 to $49,999 | 87 | 13.6% |
| $50,000 to $74,999 | 46 | 7.2% |
| $75,000 to $99,999 | 102 | 15.9% |
| $100,000 to $149,999 | 224 | 34.9% |
| $150,000 to $199,999 | 51 | 8.0% |
| $200,000+ | 0 | 0.0% |
Family Income by Famaliy Size in Bagdad
5-person families (141 | 22.0%) account for the highest median family income in Bagdad with $104,792 per family, while 5-person families (141 | 22.0%) have the highest median income of $20,958 per family member.
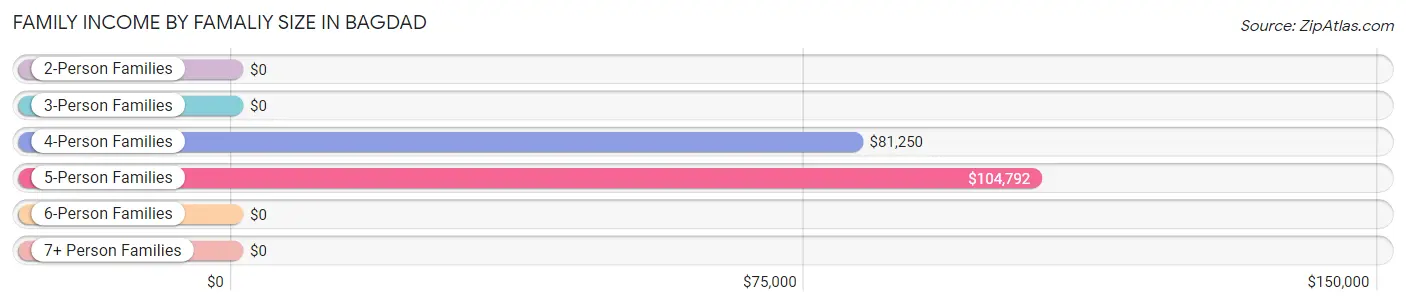
| Income Bracket | # Families | Median Income |
| 2-Person Families | 66 (10.3%) | $0 |
| 3-Person Families | 219 (34.2%) | $0 |
| 4-Person Families | 137 (21.4%) | $81,250 |
| 5-Person Families | 141 (22.0%) | $104,792 |
| 6-Person Families | 28 (4.4%) | $0 |
| 7+ Person Families | 50 (7.8%) | $0 |
| Total | 641 (100.0%) | $86,513 |
Family Income by Number of Earners in Bagdad
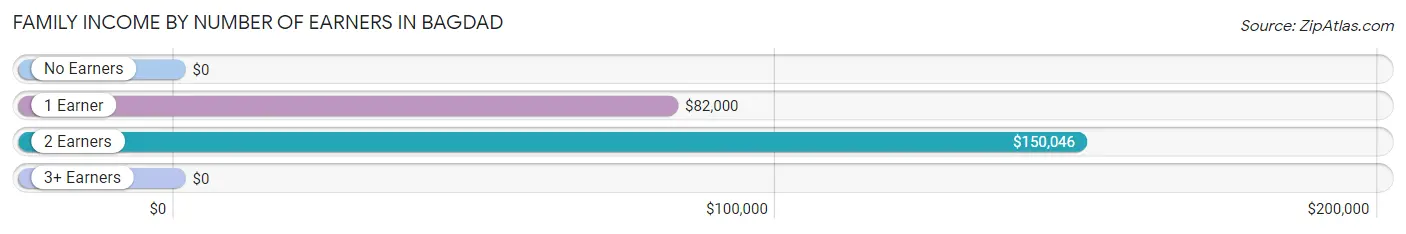
| Number of Earners | # Families | Median Income |
| No Earners | 66 (10.3%) | $0 |
| 1 Earner | 376 (58.7%) | $82,000 |
| 2 Earners | 101 (15.8%) | $150,046 |
| 3+ Earners | 98 (15.3%) | $0 |
| Total | 641 (100.0%) | $86,513 |
Household Income in Bagdad
Household Income Brackets in Bagdad
With 262 households falling in the category, the $100,000 to $149,999 income range is the most frequent in Bagdad, accounting for 34.8% of all households.
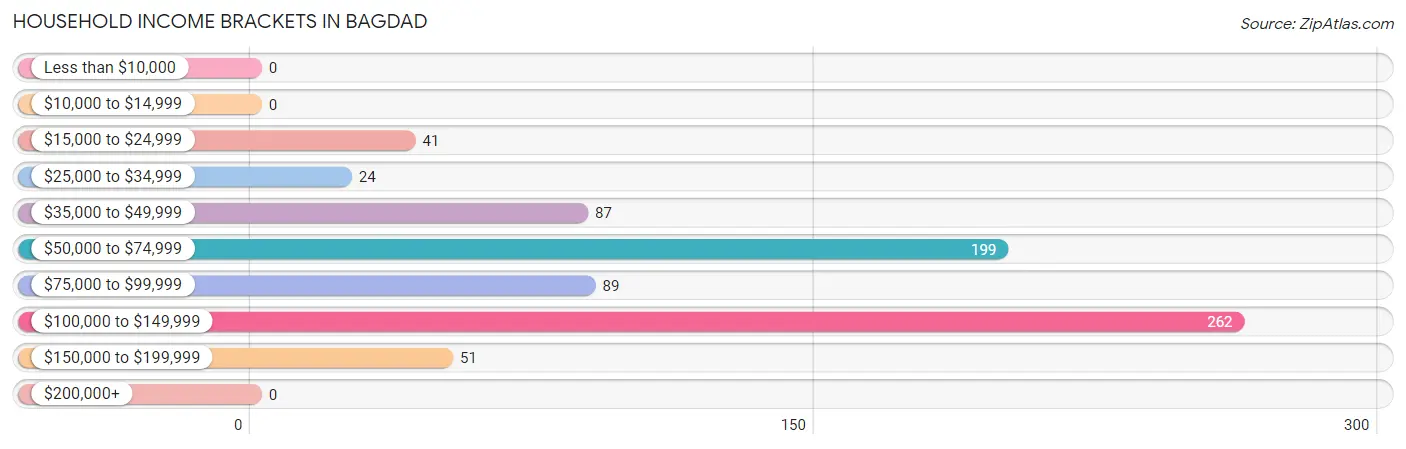
| Income Bracket | # Households | % Households |
| Less than $10,000 | 0 | 0.0% |
| $10,000 to $14,999 | 0 | 0.0% |
| $15,000 to $24,999 | 41 | 5.4% |
| $25,000 to $34,999 | 24 | 3.2% |
| $35,000 to $49,999 | 87 | 11.6% |
| $50,000 to $74,999 | 199 | 26.4% |
| $75,000 to $99,999 | 89 | 11.8% |
| $100,000 to $149,999 | 262 | 34.8% |
| $150,000 to $199,999 | 51 | 6.8% |
| $200,000+ | 0 | 0.0% |
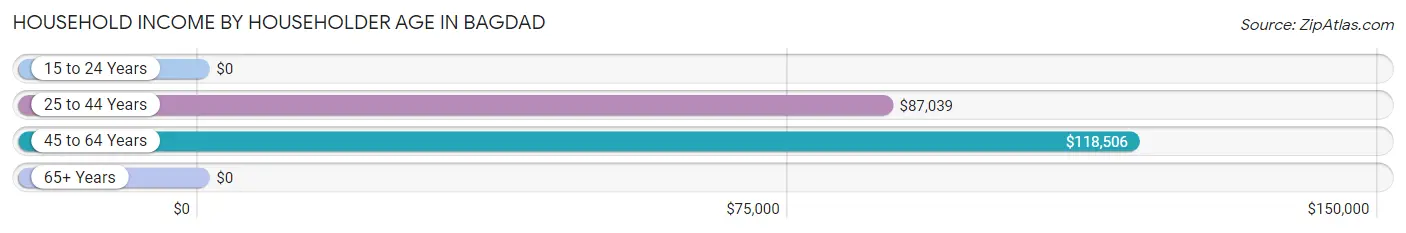
Household Income by Householder Age in Bagdad
The median household income in Bagdad is $81,417, with the highest median household income of $118,506 found in the 45 to 64 years age bracket for the primary householder. A total of 125 households (16.6%) fall into this category. Meanwhile, the 15 to 24 years age bracket for the primary householder has the lowest median household income of $0, with 90 households (11.9%) in this group.
| Income Bracket | # Households | Median Income |
| 15 to 24 Years | 90 (11.9%) | $0 |
| 25 to 44 Years | 475 (63.1%) | $87,039 |
| 45 to 64 Years | 125 (16.6%) | $118,506 |
| 65+ Years | 63 (8.4%) | $0 |
| Total | 753 (100.0%) | $81,417 |
Poverty in Bagdad
Income Below Poverty by Sex and Age in Bagdad
With 17.6% poverty level for males and 16.3% for females among the residents of Bagdad, 5 year old males and under 5 year old females are the most vulnerable to poverty, with 41 males (53.2%) and 74 females (37.6%) in their respective age groups living below the poverty level.
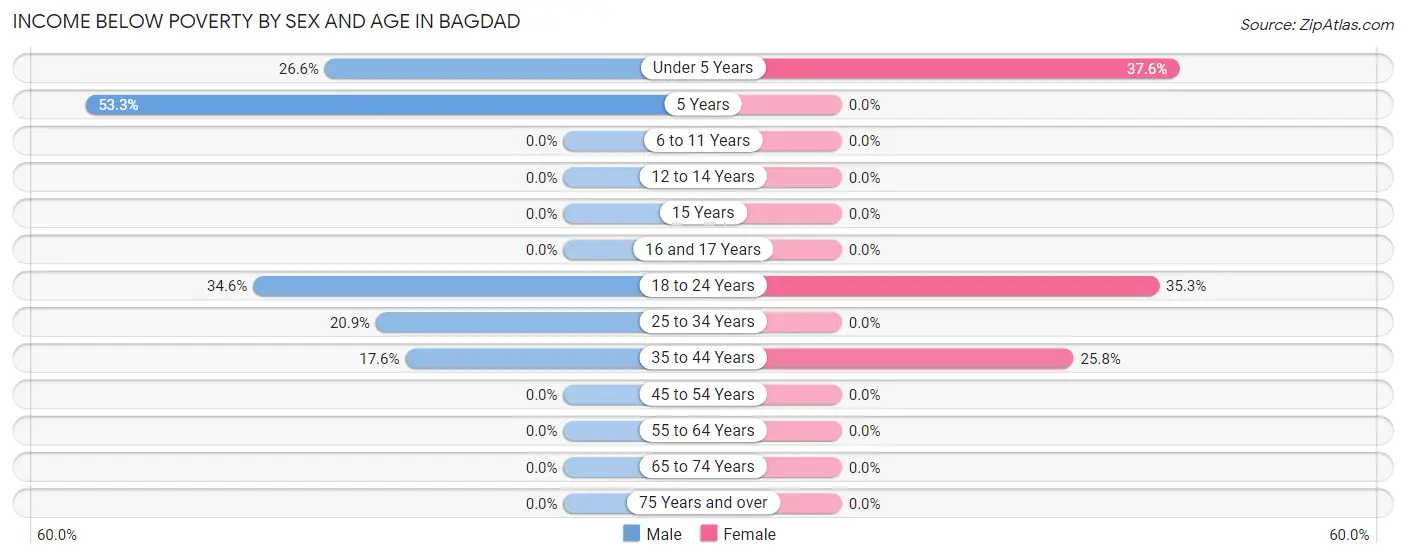
| Age Bracket | Male | Female |
| Under 5 Years | 51 (26.6%) | 74 (37.6%) |
| 5 Years | 41 (53.2%) | 0 (0.0%) |
| 6 to 11 Years | 0 (0.0%) | 0 (0.0%) |
| 12 to 14 Years | 0 (0.0%) | 0 (0.0%) |
| 15 Years | 0 (0.0%) | 0 (0.0%) |
| 16 and 17 Years | 0 (0.0%) | 0 (0.0%) |
| 18 to 24 Years | 76 (34.5%) | 88 (35.3%) |
| 25 to 34 Years | 24 (20.9%) | 0 (0.0%) |
| 35 to 44 Years | 41 (17.6%) | 55 (25.8%) |
| 45 to 54 Years | 0 (0.0%) | 0 (0.0%) |
| 55 to 64 Years | 0 (0.0%) | 0 (0.0%) |
| 65 to 74 Years | 0 (0.0%) | 0 (0.0%) |
| 75 Years and over | 0 (0.0%) | 0 (0.0%) |
| Total | 233 (17.6%) | 217 (16.3%) |
Income Above Poverty by Sex and Age in Bagdad
According to the poverty statistics in Bagdad, males aged 6 to 11 years and females aged 6 to 11 years are the age groups that are most secure financially, with 100.0% of males and 100.0% of females in these age groups living above the poverty line.
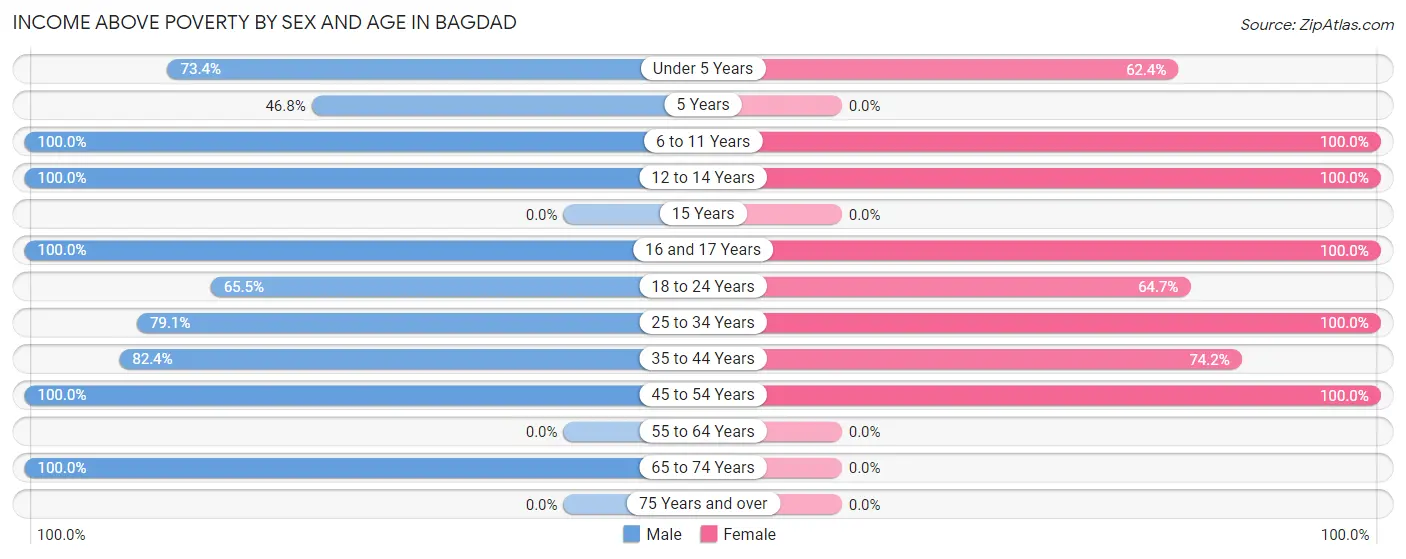
| Age Bracket | Male | Female |
| Under 5 Years | 141 (73.4%) | 123 (62.4%) |
| 5 Years | 36 (46.8%) | 0 (0.0%) |
| 6 to 11 Years | 229 (100.0%) | 158 (100.0%) |
| 12 to 14 Years | 55 (100.0%) | 125 (100.0%) |
| 15 Years | 0 (0.0%) | 0 (0.0%) |
| 16 and 17 Years | 29 (100.0%) | 61 (100.0%) |
| 18 to 24 Years | 144 (65.4%) | 161 (64.7%) |
| 25 to 34 Years | 91 (79.1%) | 213 (100.0%) |
| 35 to 44 Years | 192 (82.4%) | 158 (74.2%) |
| 45 to 54 Years | 113 (100.0%) | 119 (100.0%) |
| 55 to 64 Years | 0 (0.0%) | 0 (0.0%) |
| 65 to 74 Years | 63 (100.0%) | 0 (0.0%) |
| 75 Years and over | 0 (0.0%) | 0 (0.0%) |
| Total | 1,093 (82.4%) | 1,118 (83.8%) |
Income Below Poverty Among Married-Couple Families in Bagdad
The poverty statistics for married-couple families in Bagdad show that 14.4% or 65 of the total 450 families live below the poverty line. Families with 3 or 4 children have the highest poverty rate of 18.8%, comprising of 24 families. On the other hand, families with no children have the lowest poverty rate of 0.0%, which includes 0 families.
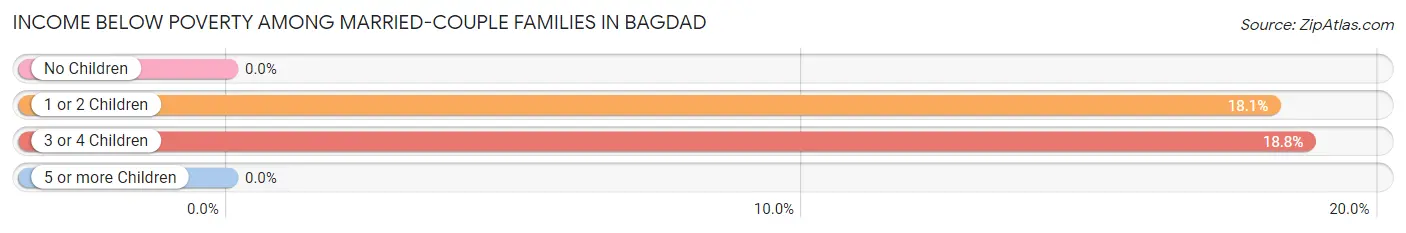
| Children | Above Poverty | Below Poverty |
| No Children | 46 (100.0%) | 0 (0.0%) |
| 1 or 2 Children | 185 (81.9%) | 41 (18.1%) |
| 3 or 4 Children | 104 (81.2%) | 24 (18.8%) |
| 5 or more Children | 50 (100.0%) | 0 (0.0%) |
| Total | 385 (85.6%) | 65 (14.4%) |
Income Below Poverty Among Single-Parent Households in Bagdad
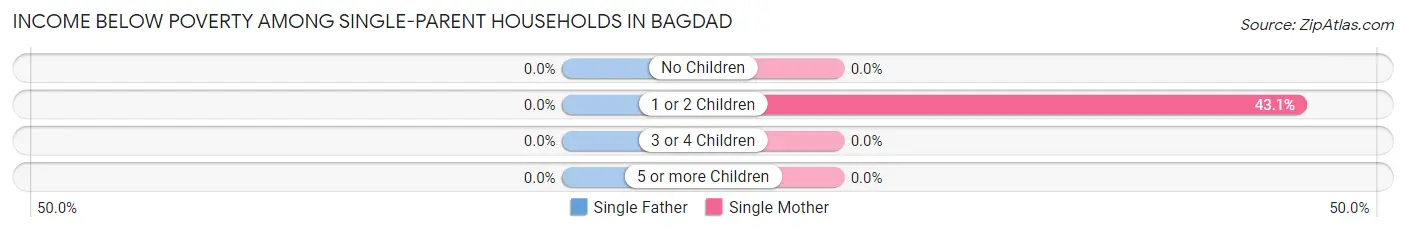
| Children | Single Father | Single Mother |
| No Children | 0 (0.0%) | 0 (0.0%) |
| 1 or 2 Children | 0 (0.0%) | 66 (43.1%) |
| 3 or 4 Children | 0 (0.0%) | 0 (0.0%) |
| 5 or more Children | 0 (0.0%) | 0 (0.0%) |
| Total | 0 (0.0%) | 66 (43.1%) |
Income Below Poverty Among Married-Couple vs Single-Parent Households in Bagdad
The poverty data for Bagdad shows that 65 of the married-couple family households (14.4%) and 66 of the single-parent households (34.5%) are living below the poverty level. Within the married-couple family households, those with 3 or 4 children have the highest poverty rate, with 24 households (18.8%) falling below the poverty line. Among the single-parent households, those with 1 or 2 children have the highest poverty rate, with 66 household (34.5%) living below poverty.
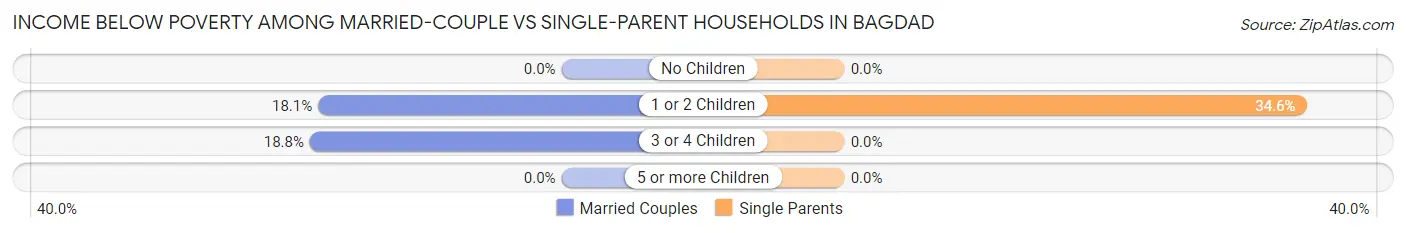
| Children | Married-Couple Families | Single-Parent Households |
| No Children | 0 (0.0%) | 0 (0.0%) |
| 1 or 2 Children | 41 (18.1%) | 66 (34.5%) |
| 3 or 4 Children | 24 (18.8%) | 0 (0.0%) |
| 5 or more Children | 0 (0.0%) | 0 (0.0%) |
| Total | 65 (14.4%) | 66 (34.5%) |
Race in Bagdad
The most populous races in Bagdad are White / Caucasian (1,711 | 64.3%), Hispanic or Latino (1,465 | 55.0%), and Two or more Races (925 | 34.8%).
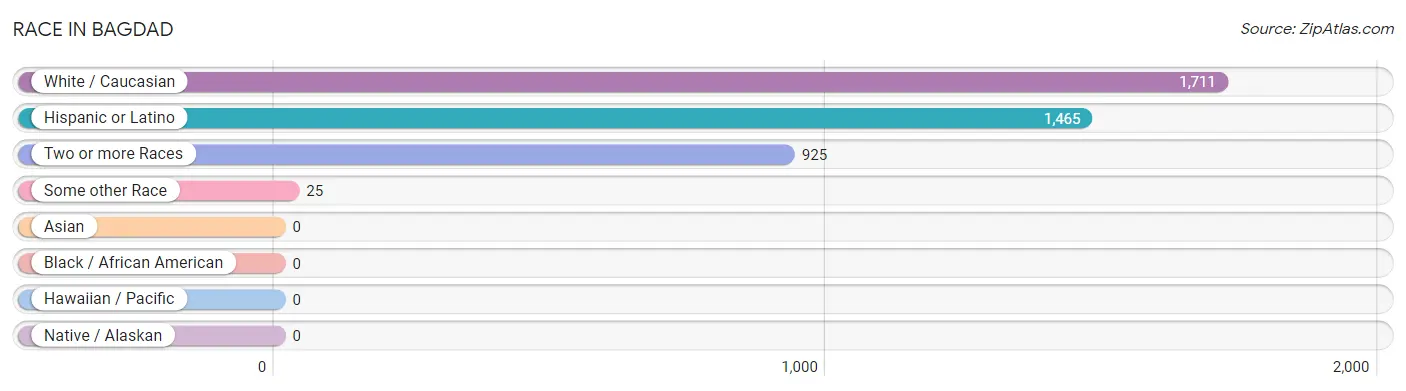
| Race | # Population | % Population |
| Asian | 0 | 0.0% |
| Black / African American | 0 | 0.0% |
| Hawaiian / Pacific | 0 | 0.0% |
| Hispanic or Latino | 1,465 | 55.0% |
| Native / Alaskan | 0 | 0.0% |
| White / Caucasian | 1,711 | 64.3% |
| Two or more Races | 925 | 34.8% |
| Some other Race | 25 | 0.9% |
| Total | 2,661 | 100.0% |
Ancestry in Bagdad
The most populous ancestries reported in Bagdad are Mexican (1,083 | 40.7%), Irish (317 | 11.9%), English (303 | 11.4%), German (261 | 9.8%), and Central American (230 | 8.6%), together accounting for 82.5% of all Bagdad residents.
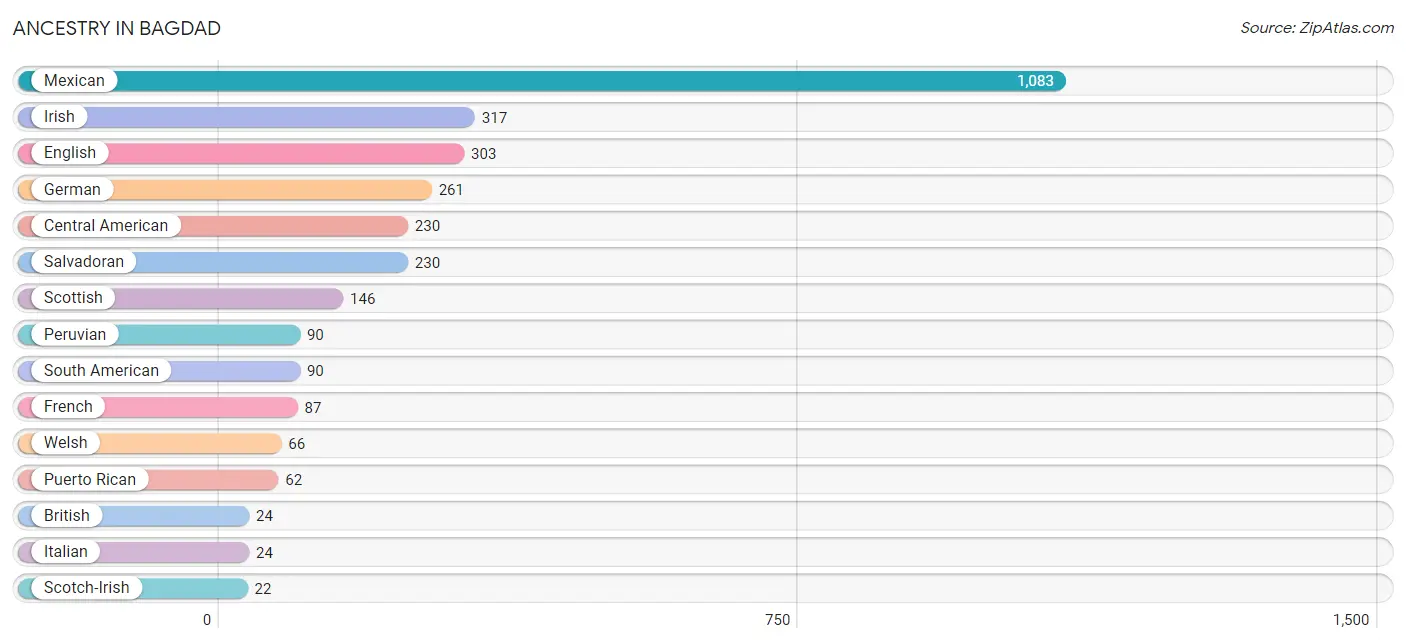
| Ancestry | # Population | % Population |
| British | 24 | 0.9% |
| Central American | 230 | 8.6% |
| English | 303 | 11.4% |
| French | 87 | 3.3% |
| German | 261 | 9.8% |
| Irish | 317 | 11.9% |
| Italian | 24 | 0.9% |
| Mexican | 1,083 | 40.7% |
| Peruvian | 90 | 3.4% |
| Puerto Rican | 62 | 2.3% |
| Salvadoran | 230 | 8.6% |
| Scotch-Irish | 22 | 0.8% |
| Scottish | 146 | 5.5% |
| South American | 90 | 3.4% |
| Welsh | 66 | 2.5% | View All 15 Rows |
Immigrants in Bagdad
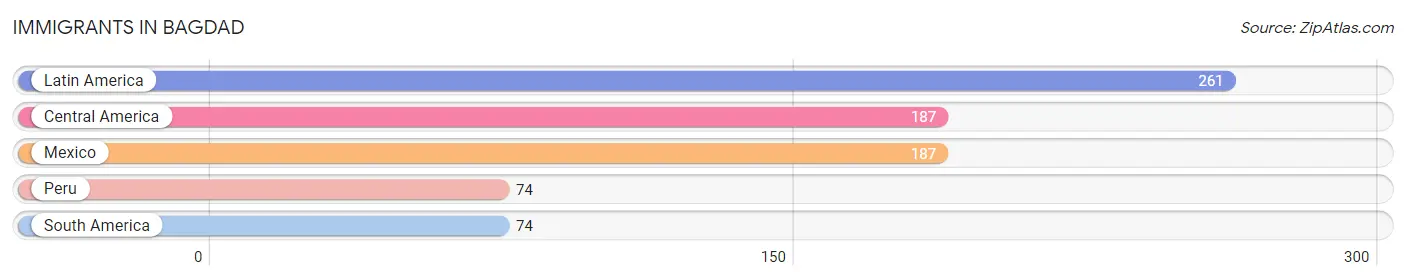
The most numerous immigrant groups reported in Bagdad came from Latin America (261 | 9.8%), Central America (187 | 7.0%), Mexico (187 | 7.0%), Peru (74 | 2.8%), and South America (74 | 2.8%), together accounting for 29.4% of all Bagdad residents.
| Immigration Origin | # Population | % Population |
| Central America | 187 | 7.0% |
| Latin America | 261 | 9.8% |
| Mexico | 187 | 7.0% |
| Peru | 74 | 2.8% |
| South America | 74 | 2.8% | View All 5 Rows |
Sex and Age in Bagdad
Sex and Age in Bagdad
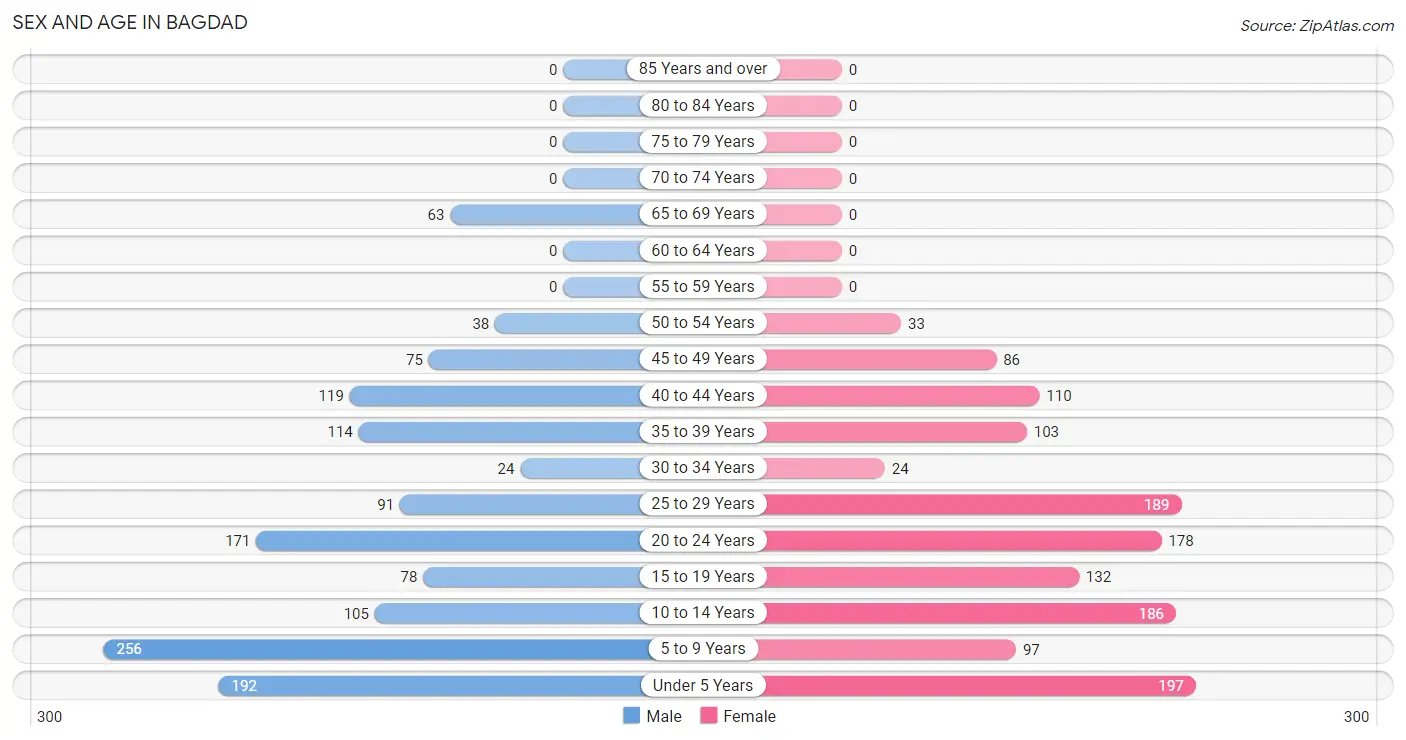
The most populous age groups in Bagdad are 5 to 9 Years (256 | 19.3%) for men and Under 5 Years (197 | 14.8%) for women.
| Age Bracket | Male | Female |
| Under 5 Years | 192 (14.5%) | 197 (14.8%) |
| 5 to 9 Years | 256 (19.3%) | 97 (7.3%) |
| 10 to 14 Years | 105 (7.9%) | 186 (13.9%) |
| 15 to 19 Years | 78 (5.9%) | 132 (9.9%) |
| 20 to 24 Years | 171 (12.9%) | 178 (13.3%) |
| 25 to 29 Years | 91 (6.9%) | 189 (14.2%) |
| 30 to 34 Years | 24 (1.8%) | 24 (1.8%) |
| 35 to 39 Years | 114 (8.6%) | 103 (7.7%) |
| 40 to 44 Years | 119 (9.0%) | 110 (8.2%) |
| 45 to 49 Years | 75 (5.7%) | 86 (6.4%) |
| 50 to 54 Years | 38 (2.9%) | 33 (2.5%) |
| 55 to 59 Years | 0 (0.0%) | 0 (0.0%) |
| 60 to 64 Years | 0 (0.0%) | 0 (0.0%) |
| 65 to 69 Years | 63 (4.8%) | 0 (0.0%) |
| 70 to 74 Years | 0 (0.0%) | 0 (0.0%) |
| 75 to 79 Years | 0 (0.0%) | 0 (0.0%) |
| 80 to 84 Years | 0 (0.0%) | 0 (0.0%) |
| 85 Years and over | 0 (0.0%) | 0 (0.0%) |
| Total | 1,326 (100.0%) | 1,335 (100.0%) |
Families and Households in Bagdad
Median Family Size in Bagdad
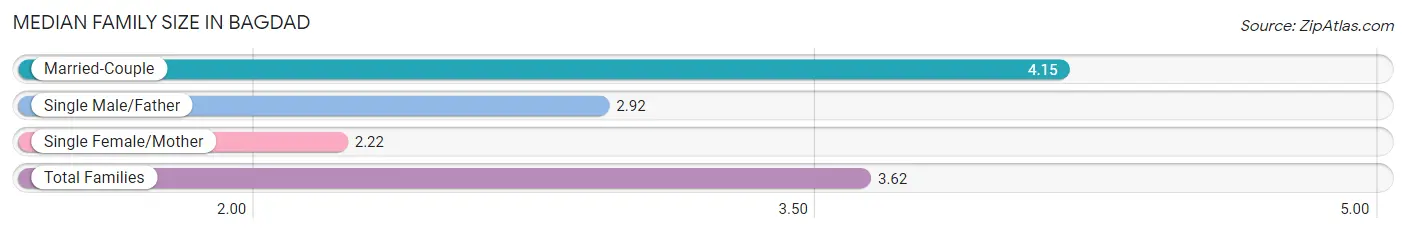
The median family size in Bagdad is 3.62 persons per family, with married-couple families (450 | 70.2%) accounting for the largest median family size of 4.15 persons per family. On the other hand, single female/mother families (153 | 23.9%) represent the smallest median family size with 2.22 persons per family.
| Family Type | # Families | Family Size |
| Married-Couple | 450 (70.2%) | 4.15 |
| Single Male/Father | 38 (5.9%) | 2.92 |
| Single Female/Mother | 153 (23.9%) | 2.22 |
| Total Families | 641 (100.0%) | 3.62 |
Median Household Size in Bagdad
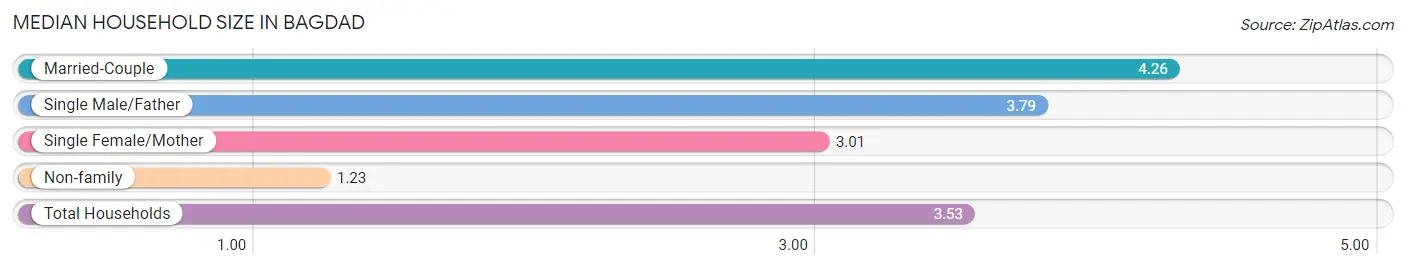
The median household size in Bagdad is 3.53 persons per household, with married-couple households (450 | 59.8%) accounting for the largest median household size of 4.26 persons per household. non-family households (112 | 14.9%) represent the smallest median household size with 1.23 persons per household.
| Household Type | # Households | Household Size |
| Married-Couple | 450 (59.8%) | 4.26 |
| Single Male/Father | 38 (5.1%) | 3.79 |
| Single Female/Mother | 153 (20.3%) | 3.01 |
| Non-family | 112 (14.9%) | 1.23 |
| Total Households | 753 (100.0%) | 3.53 |
Household Size by Marriage Status in Bagdad
Out of a total of 753 households in Bagdad, 641 (85.1%) are family households, while 112 (14.9%) are nonfamily households. The most numerous type of family households are 4-person households, comprising 216, and the most common type of nonfamily households are 1-person households, comprising 88.
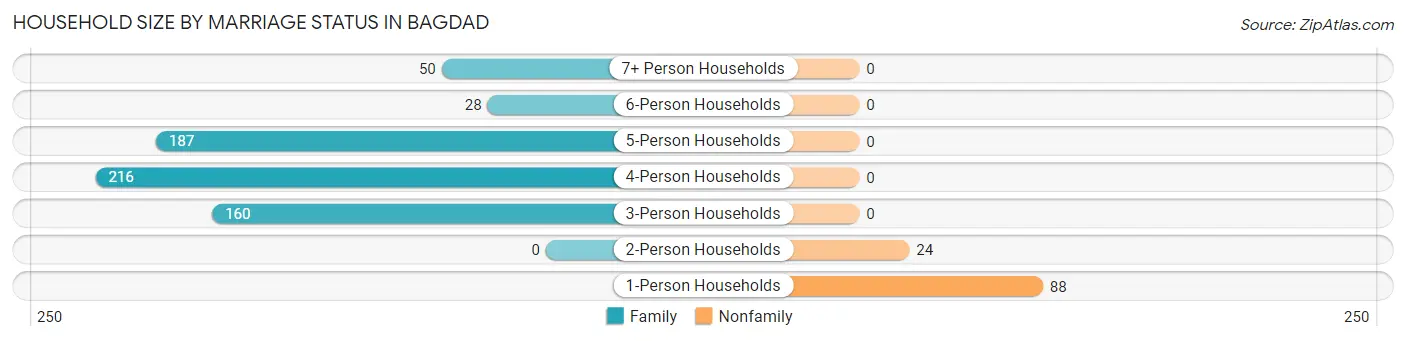
| Household Size | Family Households | Nonfamily Households |
| 1-Person Households | - | 88 (11.7%) |
| 2-Person Households | 0 (0.0%) | 24 (3.2%) |
| 3-Person Households | 160 (21.2%) | 0 (0.0%) |
| 4-Person Households | 216 (28.7%) | 0 (0.0%) |
| 5-Person Households | 187 (24.8%) | 0 (0.0%) |
| 6-Person Households | 28 (3.7%) | 0 (0.0%) |
| 7+ Person Households | 50 (6.6%) | 0 (0.0%) |
| Total | 641 (85.1%) | 112 (14.9%) |
Female Fertility in Bagdad
Fertility by Age in Bagdad
Average fertility rate in Bagdad is 79.0 births per 1,000 women. Women in the age bracket of 20 to 34 years have the highest fertility rate with 166.0 births per 1,000 women. Women in the age bracket of 20 to 34 years acount for 100.0% of all women with births.
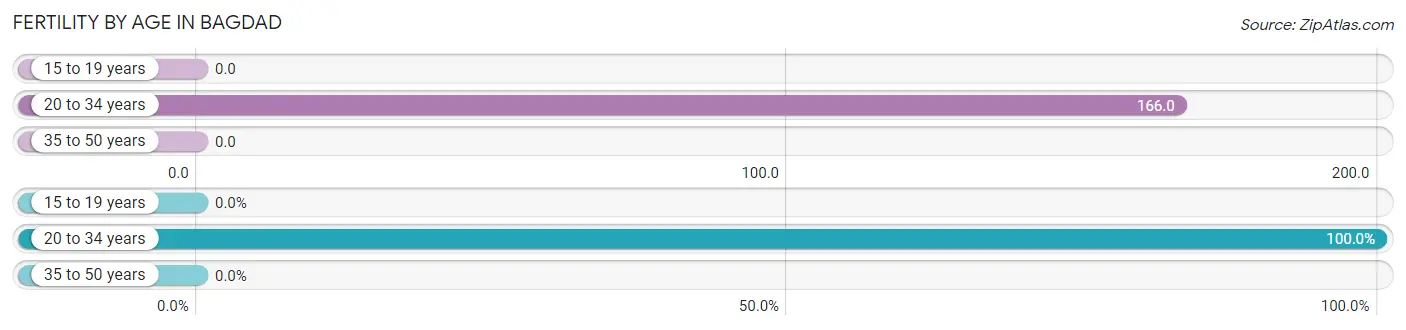
| Age Bracket | Women with Births | Births / 1,000 Women |
| 15 to 19 years | 0 (0.0%) | 0.0 |
| 20 to 34 years | 65 (100.0%) | 166.0 |
| 35 to 50 years | 0 (0.0%) | 0.0 |
| Total | 65 (100.0%) | 79.0 |
Fertility by Age by Marriage Status in Bagdad
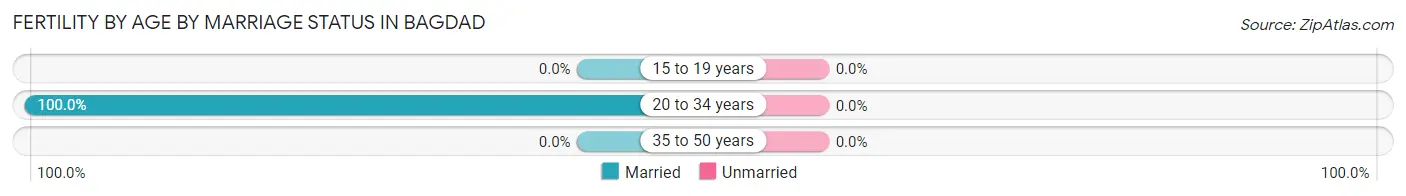
| Age Bracket | Married | Unmarried |
| 15 to 19 years | 0 (0.0%) | 0 (0.0%) |
| 20 to 34 years | 65 (100.0%) | 0 (0.0%) |
| 35 to 50 years | 0 (0.0%) | 0 (0.0%) |
| Total | 65 (100.0%) | 0 (0.0%) |
Fertility by Education in Bagdad
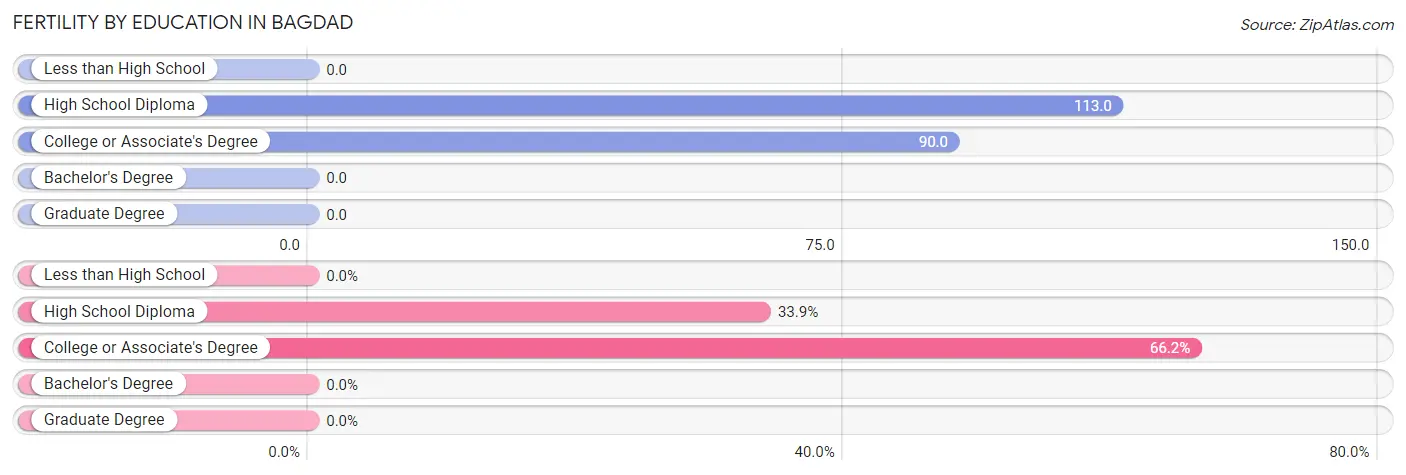
| Educational Attainment | Women with Births | Births / 1,000 Women |
| Less than High School | 0 (0.0%) | 0.0 |
| High School Diploma | 22 (33.9%) | 113.0 |
| College or Associate's Degree | 43 (66.1%) | 90.0 |
| Bachelor's Degree | 0 (0.0%) | 0.0 |
| Graduate Degree | 0 (0.0%) | 0.0 |
| Total | 65 (100.0%) | 79.0 |
Fertility by Education by Marriage Status in Bagdad
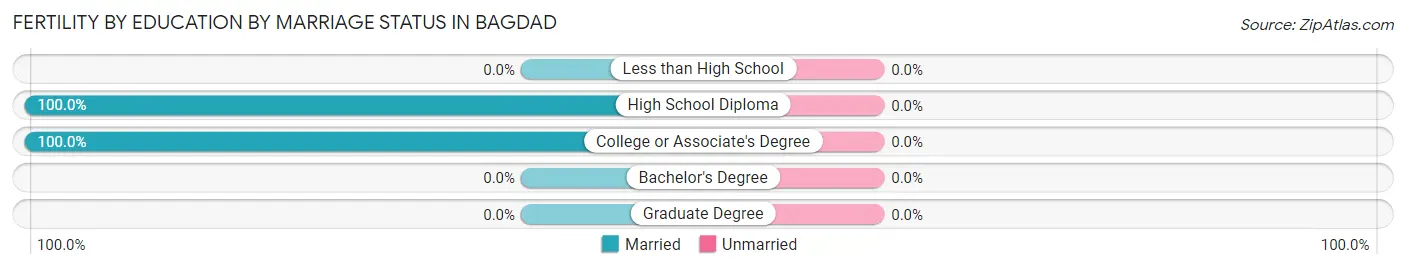
| Educational Attainment | Married | Unmarried |
| Less than High School | 0 (0.0%) | 0 (0.0%) |
| High School Diploma | 22 (100.0%) | 0 (0.0%) |
| College or Associate's Degree | 43 (100.0%) | 0 (0.0%) |
| Bachelor's Degree | 0 (0.0%) | 0 (0.0%) |
| Graduate Degree | 0 (0.0%) | 0 (0.0%) |
| Total | 65 (100.0%) | 0 (0.0%) |
Employment Characteristics in Bagdad
Employment by Class of Employer in Bagdad
Among the 1,095 employed individuals in Bagdad, private company employees (921 | 84.1%), local government employees (125 | 11.4%), and state government employees (49 | 4.5%) make up the most common classes of employment.
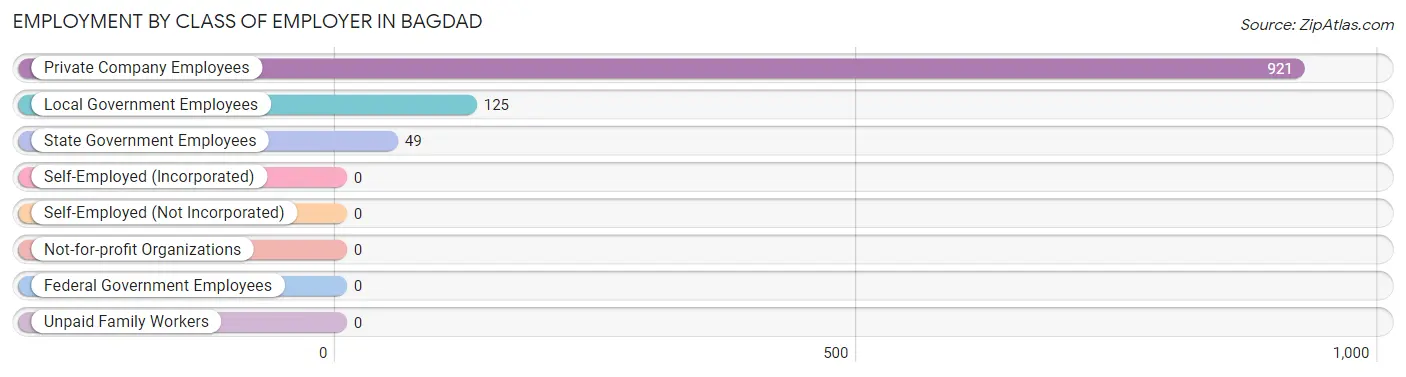
| Employer Class | # Employees | % Employees |
| Private Company Employees | 921 | 84.1% |
| Self-Employed (Incorporated) | 0 | 0.0% |
| Self-Employed (Not Incorporated) | 0 | 0.0% |
| Not-for-profit Organizations | 0 | 0.0% |
| Local Government Employees | 125 | 11.4% |
| State Government Employees | 49 | 4.5% |
| Federal Government Employees | 0 | 0.0% |
| Unpaid Family Workers | 0 | 0.0% |
| Total | 1,095 | 100.0% |
Employment Status by Age in Bagdad
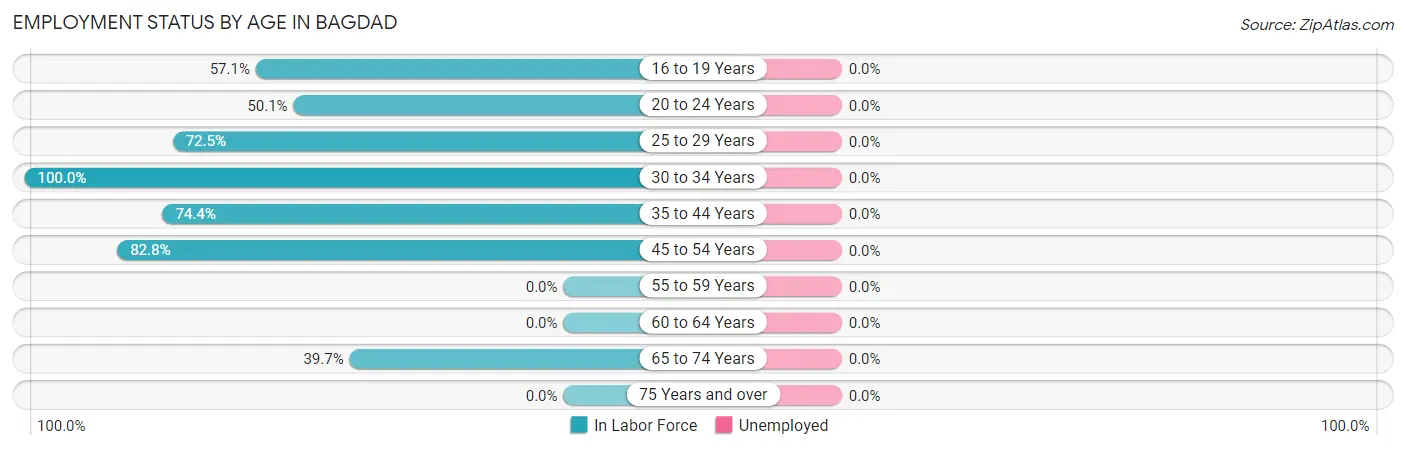
| Age Bracket | In Labor Force | Unemployed |
| 16 to 19 Years | 120 (57.1%) | 0 (0.0%) |
| 20 to 24 Years | 175 (50.1%) | 0 (0.0%) |
| 25 to 29 Years | 203 (72.5%) | 0 (0.0%) |
| 30 to 34 Years | 48 (100.0%) | 0 (0.0%) |
| 35 to 44 Years | 332 (74.4%) | 0 (0.0%) |
| 45 to 54 Years | 192 (82.8%) | 0 (0.0%) |
| 55 to 59 Years | 0 (0.0%) | 0 (0.0%) |
| 60 to 64 Years | 0 (0.0%) | 0 (0.0%) |
| 65 to 74 Years | 25 (39.7%) | 0 (0.0%) |
| 75 Years and over | 0 (0.0%) | 0 (0.0%) |
| Total | 1,096 (67.3%) | 0 (0.0%) |
Employment Status by Educational Attainment in Bagdad
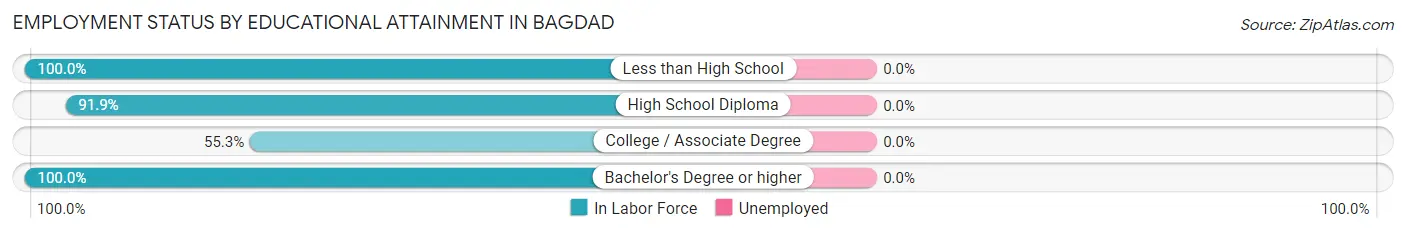
| Educational Attainment | In Labor Force | Unemployed |
| Less than High School | 24 (100.0%) | 0 (0.0%) |
| High School Diploma | 451 (91.9%) | 0 (0.0%) |
| College / Associate Degree | 236 (55.3%) | 0 (0.0%) |
| Bachelor's Degree or higher | 64 (100.0%) | 0 (0.0%) |
| Total | 775 (77.0%) | 0 (0.0%) |
Employment Occupations by Sex in Bagdad
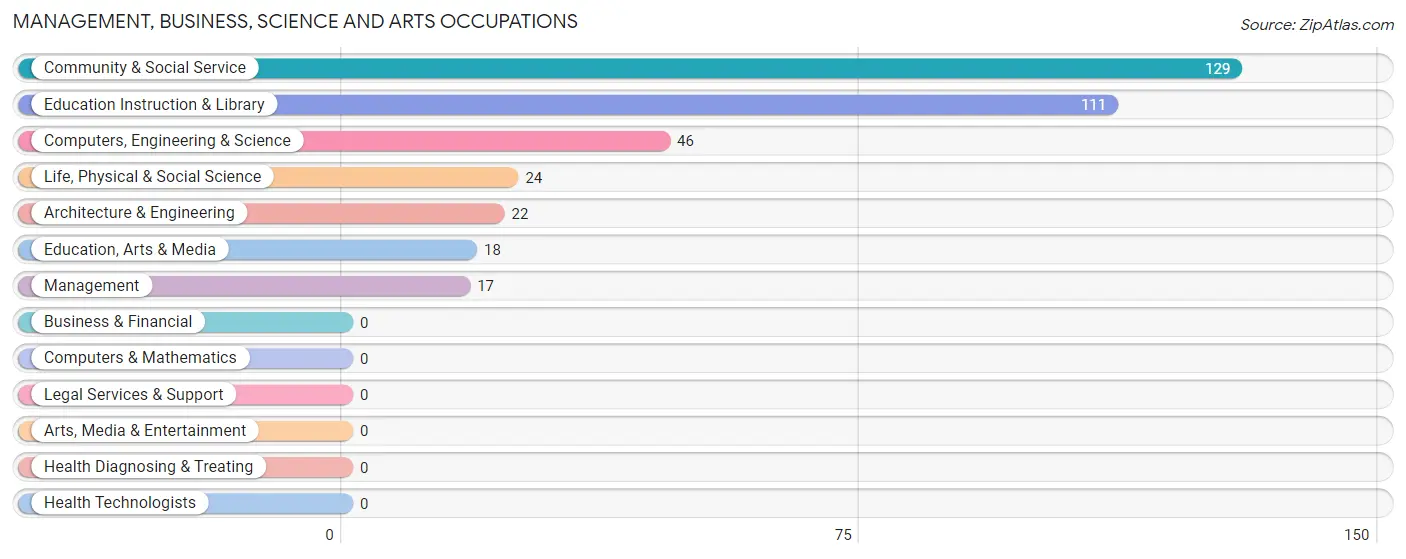
Management, Business, Science and Arts Occupations
The most common Management, Business, Science and Arts occupations in Bagdad are Community & Social Service (129 | 11.8%), Education Instruction & Library (111 | 10.1%), Computers, Engineering & Science (46 | 4.2%), Life, Physical & Social Science (24 | 2.2%), and Architecture & Engineering (22 | 2.0%).
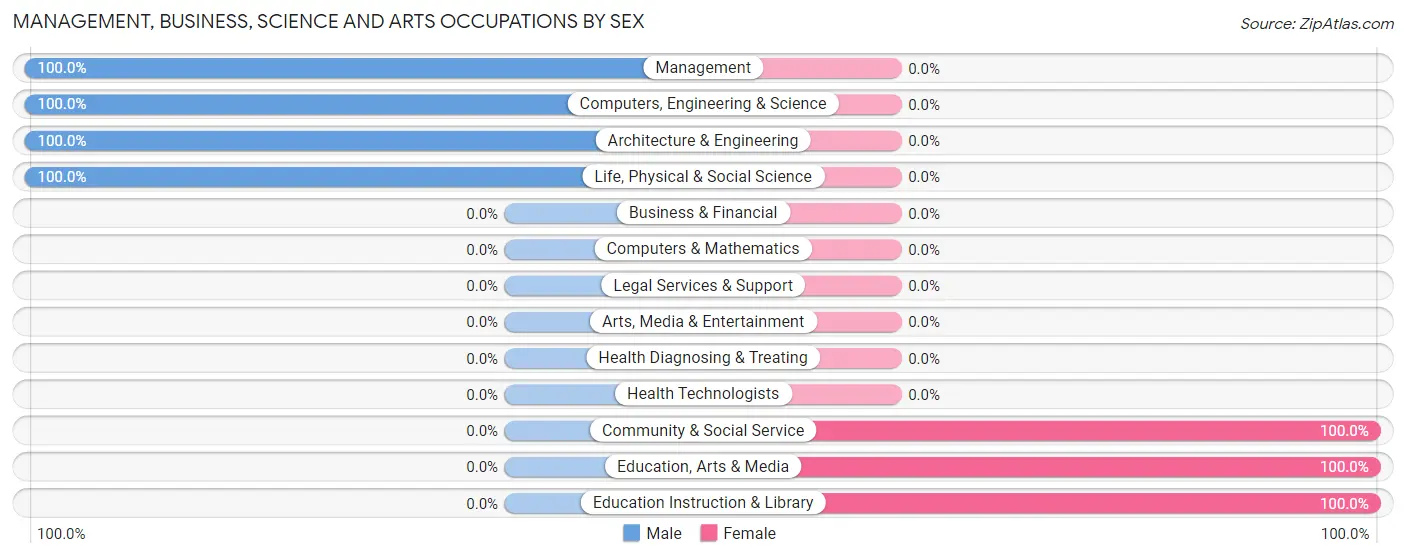
Management, Business, Science and Arts Occupations by Sex
Within the Management, Business, Science and Arts occupations in Bagdad, the most male-oriented occupations are Management (100.0%), Computers, Engineering & Science (100.0%), and Architecture & Engineering (100.0%), while the most female-oriented occupations are Community & Social Service (100.0%), Education, Arts & Media (100.0%), and Education Instruction & Library (100.0%).
| Occupation | Male | Female |
| Management | 17 (100.0%) | 0 (0.0%) |
| Business & Financial | 0 (0.0%) | 0 (0.0%) |
| Computers, Engineering & Science | 46 (100.0%) | 0 (0.0%) |
| Computers & Mathematics | 0 (0.0%) | 0 (0.0%) |
| Architecture & Engineering | 22 (100.0%) | 0 (0.0%) |
| Life, Physical & Social Science | 24 (100.0%) | 0 (0.0%) |
| Community & Social Service | 0 (0.0%) | 129 (100.0%) |
| Education, Arts & Media | 0 (0.0%) | 18 (100.0%) |
| Legal Services & Support | 0 (0.0%) | 0 (0.0%) |
| Education Instruction & Library | 0 (0.0%) | 111 (100.0%) |
| Arts, Media & Entertainment | 0 (0.0%) | 0 (0.0%) |
| Health Diagnosing & Treating | 0 (0.0%) | 0 (0.0%) |
| Health Technologists | 0 (0.0%) | 0 (0.0%) |
| Total (Category) | 63 (32.8%) | 129 (67.2%) |
| Total (Overall) | 656 (59.9%) | 439 (40.1%) |
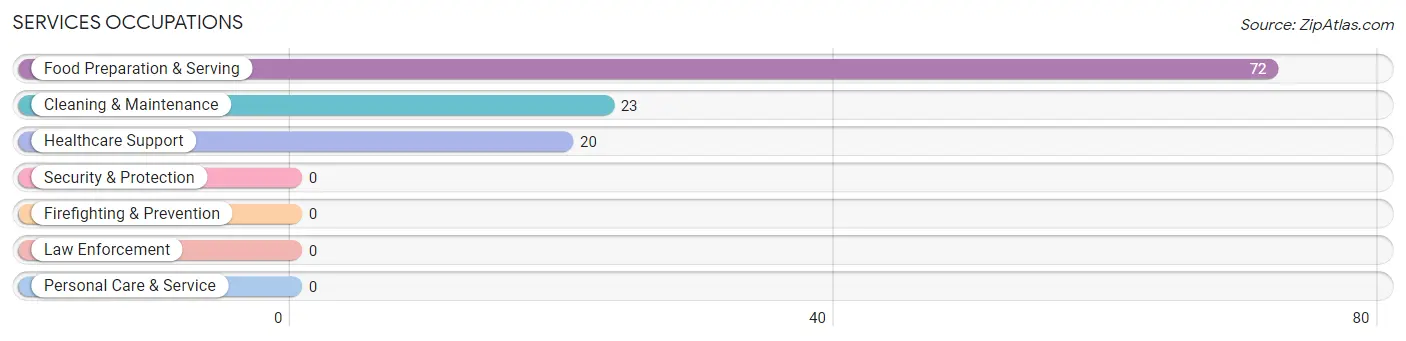
Services Occupations
The most common Services occupations in Bagdad are Food Preparation & Serving (72 | 6.6%), Cleaning & Maintenance (23 | 2.1%), and Healthcare Support (20 | 1.8%).
Services Occupations by Sex
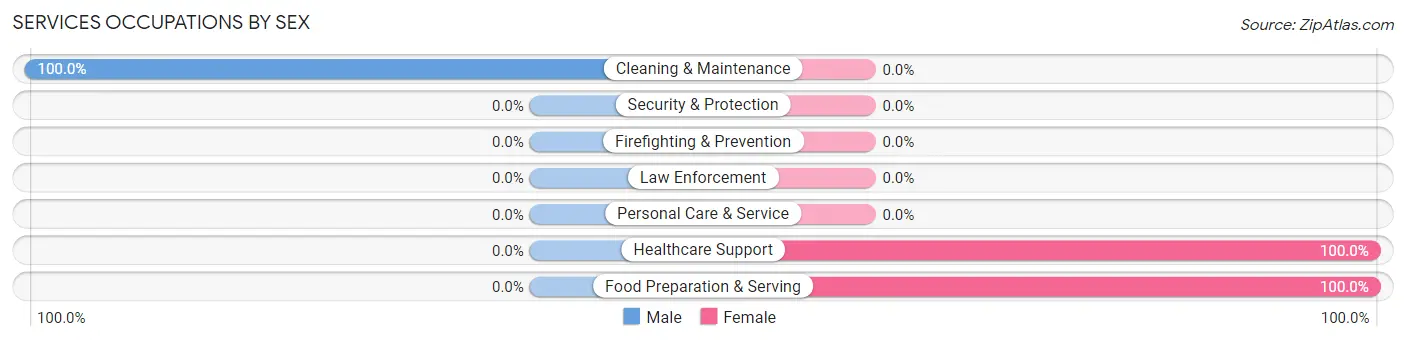
| Occupation | Male | Female |
| Healthcare Support | 0 (0.0%) | 20 (100.0%) |
| Security & Protection | 0 (0.0%) | 0 (0.0%) |
| Firefighting & Prevention | 0 (0.0%) | 0 (0.0%) |
| Law Enforcement | 0 (0.0%) | 0 (0.0%) |
| Food Preparation & Serving | 0 (0.0%) | 72 (100.0%) |
| Cleaning & Maintenance | 23 (100.0%) | 0 (0.0%) |
| Personal Care & Service | 0 (0.0%) | 0 (0.0%) |
| Total (Category) | 23 (20.0%) | 92 (80.0%) |
| Total (Overall) | 656 (59.9%) | 439 (40.1%) |
Sales and Office Occupations
The most common Sales and Office occupations in Bagdad are Sales & Related (33 | 3.0%), and Office & Administration (30 | 2.7%).
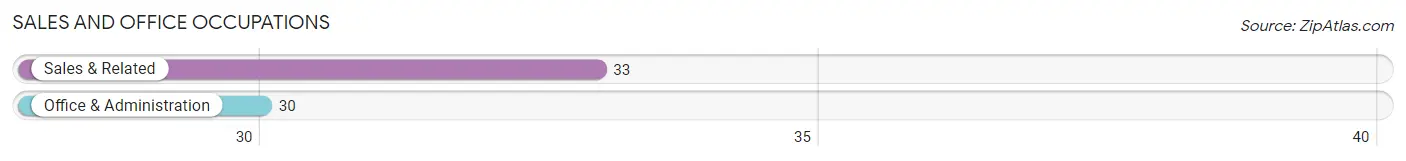
Sales and Office Occupations by Sex

| Occupation | Male | Female |
| Sales & Related | 0 (0.0%) | 33 (100.0%) |
| Office & Administration | 30 (100.0%) | 0 (0.0%) |
| Total (Category) | 30 (47.6%) | 33 (52.4%) |
| Total (Overall) | 656 (59.9%) | 439 (40.1%) |
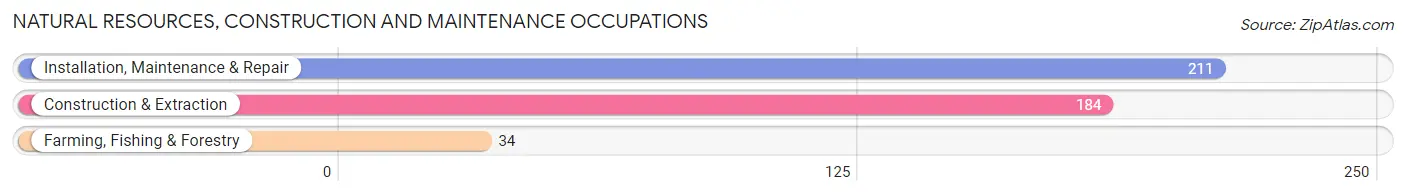
Natural Resources, Construction and Maintenance Occupations
The most common Natural Resources, Construction and Maintenance occupations in Bagdad are Installation, Maintenance & Repair (211 | 19.3%), Construction & Extraction (184 | 16.8%), and Farming, Fishing & Forestry (34 | 3.1%).
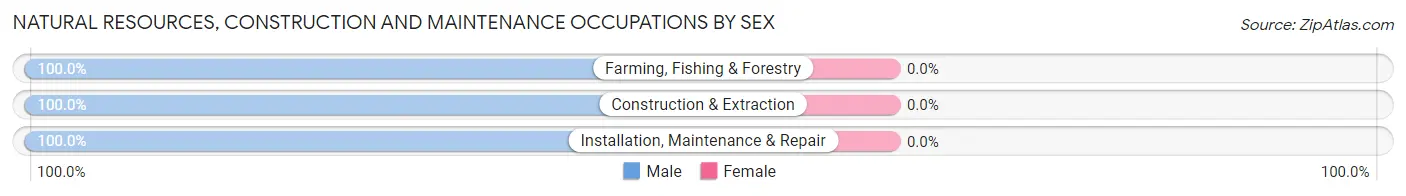
Natural Resources, Construction and Maintenance Occupations by Sex
| Occupation | Male | Female |
| Farming, Fishing & Forestry | 34 (100.0%) | 0 (0.0%) |
| Construction & Extraction | 184 (100.0%) | 0 (0.0%) |
| Installation, Maintenance & Repair | 211 (100.0%) | 0 (0.0%) |
| Total (Category) | 429 (100.0%) | 0 (0.0%) |
| Total (Overall) | 656 (59.9%) | 439 (40.1%) |
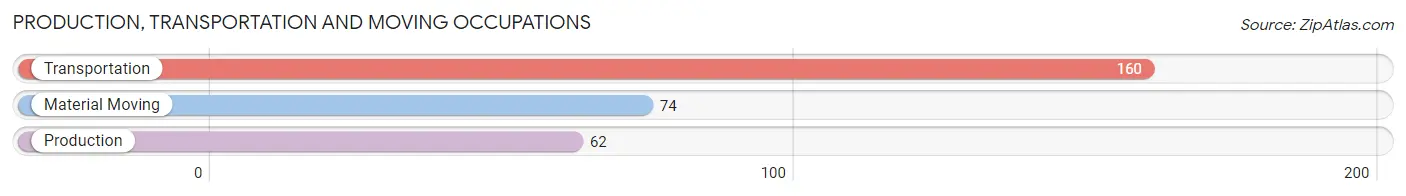
Production, Transportation and Moving Occupations
The most common Production, Transportation and Moving occupations in Bagdad are Transportation (160 | 14.6%), Material Moving (74 | 6.8%), and Production (62 | 5.7%).
Production, Transportation and Moving Occupations by Sex
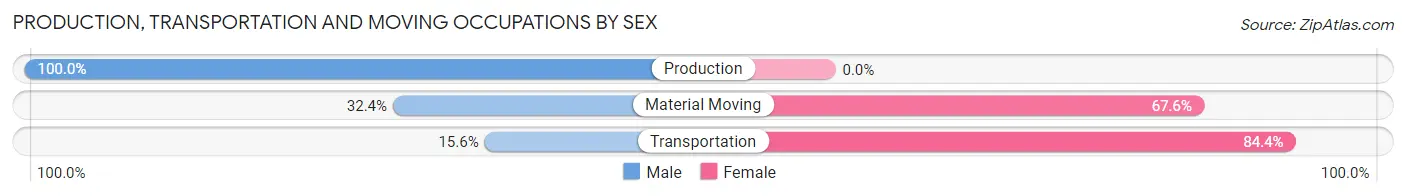
| Occupation | Male | Female |
| Production | 62 (100.0%) | 0 (0.0%) |
| Transportation | 25 (15.6%) | 135 (84.4%) |
| Material Moving | 24 (32.4%) | 50 (67.6%) |
| Total (Category) | 111 (37.5%) | 185 (62.5%) |
| Total (Overall) | 656 (59.9%) | 439 (40.1%) |
Employment Industries by Sex in Bagdad
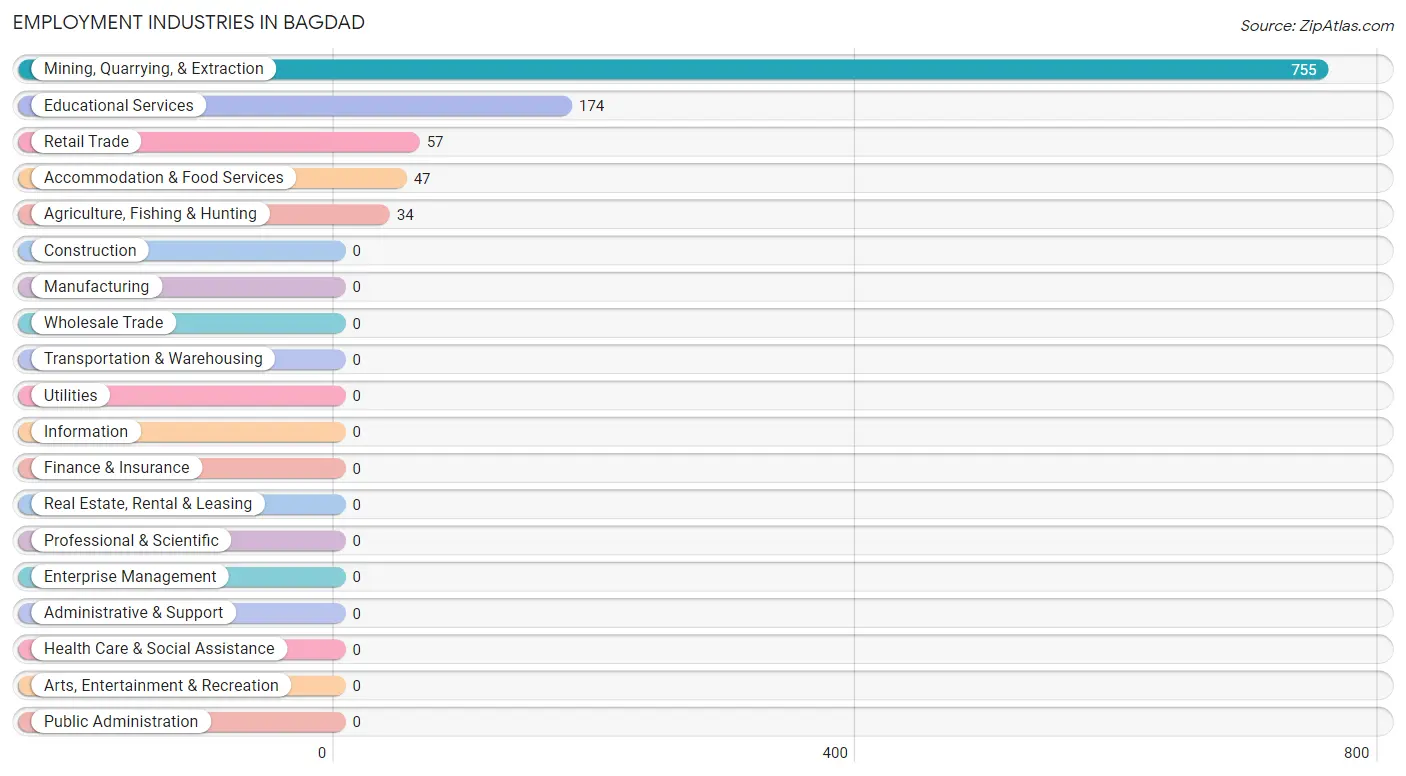
Employment Industries in Bagdad
The major employment industries in Bagdad include Mining, Quarrying, & Extraction (755 | 69.0%), Educational Services (174 | 15.9%), Retail Trade (57 | 5.2%), Accommodation & Food Services (47 | 4.3%), and Agriculture, Fishing & Hunting (34 | 3.1%).
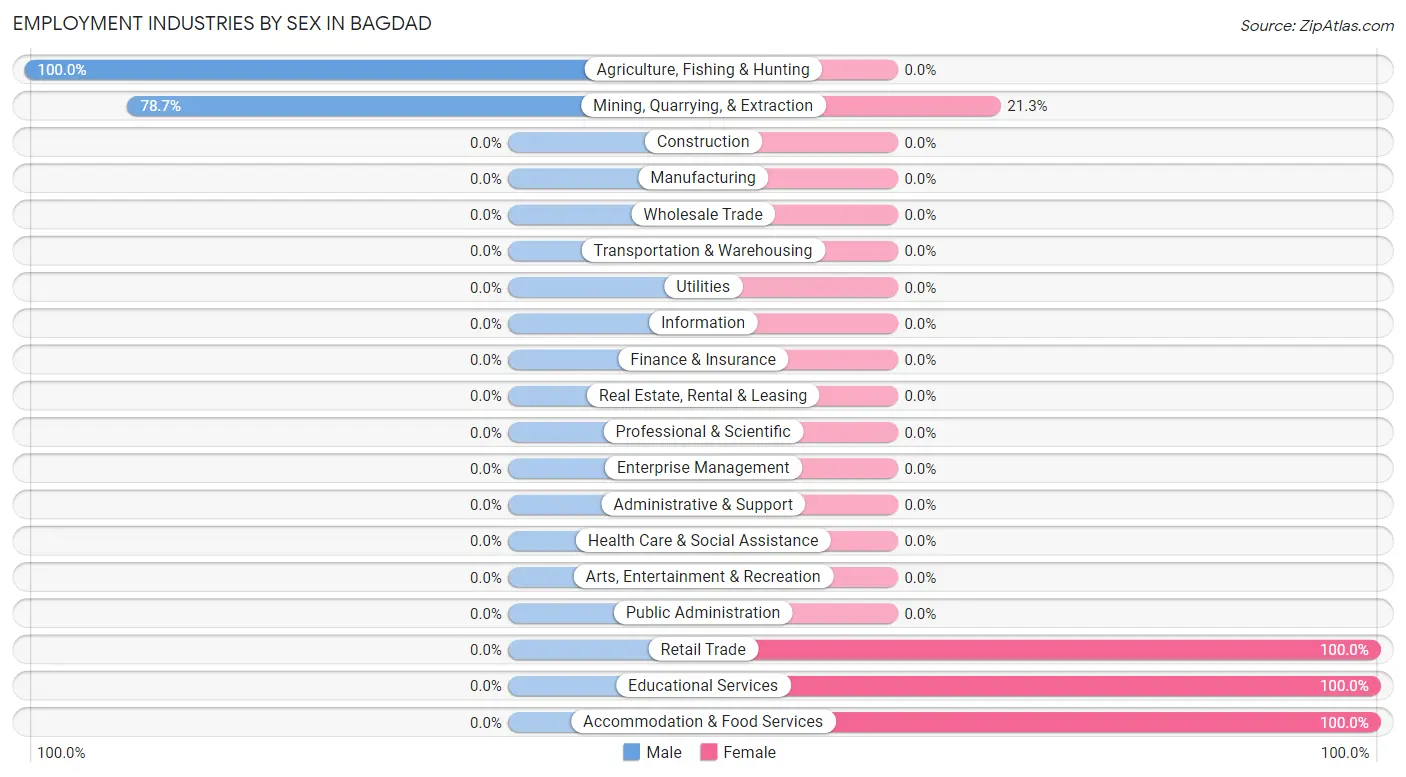
Employment Industries by Sex in Bagdad
The Bagdad industries that see more men than women are Agriculture, Fishing & Hunting (100.0%), and Mining, Quarrying, & Extraction (78.7%), whereas the industries that tend to have a higher number of women are Retail Trade (100.0%), Educational Services (100.0%), and Accommodation & Food Services (100.0%).
| Industry | Male | Female |
| Agriculture, Fishing & Hunting | 34 (100.0%) | 0 (0.0%) |
| Mining, Quarrying, & Extraction | 594 (78.7%) | 161 (21.3%) |
| Construction | 0 (0.0%) | 0 (0.0%) |
| Manufacturing | 0 (0.0%) | 0 (0.0%) |
| Wholesale Trade | 0 (0.0%) | 0 (0.0%) |
| Retail Trade | 0 (0.0%) | 57 (100.0%) |
| Transportation & Warehousing | 0 (0.0%) | 0 (0.0%) |
| Utilities | 0 (0.0%) | 0 (0.0%) |
| Information | 0 (0.0%) | 0 (0.0%) |
| Finance & Insurance | 0 (0.0%) | 0 (0.0%) |
| Real Estate, Rental & Leasing | 0 (0.0%) | 0 (0.0%) |
| Professional & Scientific | 0 (0.0%) | 0 (0.0%) |
| Enterprise Management | 0 (0.0%) | 0 (0.0%) |
| Administrative & Support | 0 (0.0%) | 0 (0.0%) |
| Educational Services | 0 (0.0%) | 174 (100.0%) |
| Health Care & Social Assistance | 0 (0.0%) | 0 (0.0%) |
| Arts, Entertainment & Recreation | 0 (0.0%) | 0 (0.0%) |
| Accommodation & Food Services | 0 (0.0%) | 47 (100.0%) |
| Public Administration | 0 (0.0%) | 0 (0.0%) |
| Total | 656 (59.9%) | 439 (40.1%) |
Education in Bagdad
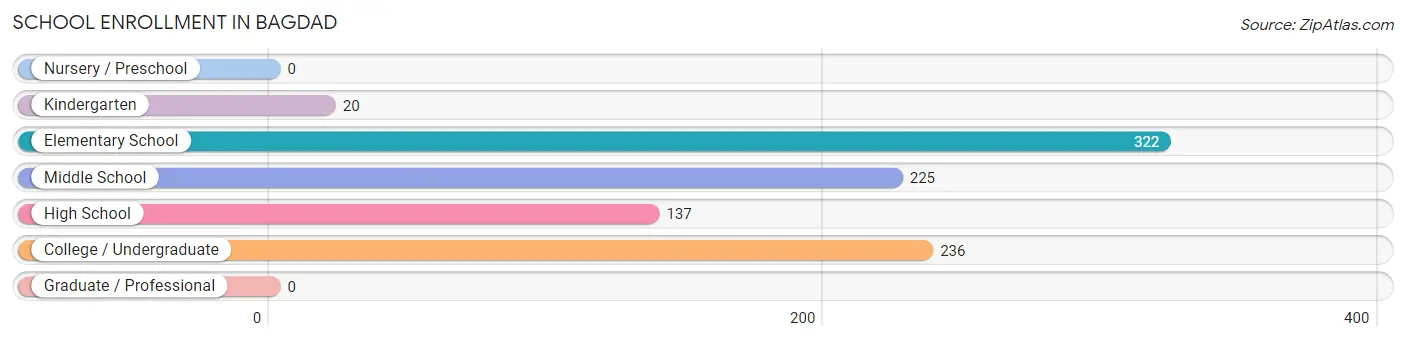
School Enrollment in Bagdad
The most common levels of schooling among the 940 students in Bagdad are elementary school (322 | 34.3%), college / undergraduate (236 | 25.1%), and middle school (225 | 23.9%).
| School Level | # Students | % Students |
| Nursery / Preschool | 0 | 0.0% |
| Kindergarten | 20 | 2.1% |
| Elementary School | 322 | 34.3% |
| Middle School | 225 | 23.9% |
| High School | 137 | 14.6% |
| College / Undergraduate | 236 | 25.1% |
| Graduate / Professional | 0 | 0.0% |
| Total | 940 | 100.0% |
School Enrollment by Age by Funding Source in Bagdad
Out of a total of 940 students who are enrolled in schools in Bagdad, 50 (5.3%) attend a private institution, while the remaining 890 (94.7%) are enrolled in public schools. The age group of 20 to 24 year olds has the highest likelihood of being enrolled in private schools, with 50 (30.7% in the age bracket) enrolled. Conversely, the age group of 5 to 9 year old has the lowest likelihood of being enrolled in a private school, with 276 (100.0% in the age bracket) attending a public institution.
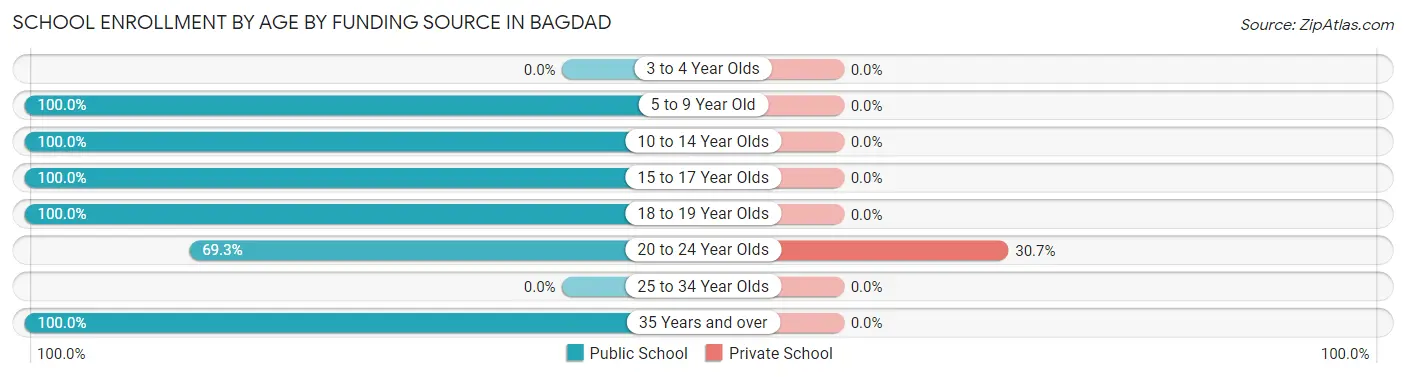
| Age Bracket | Public School | Private School |
| 3 to 4 Year Olds | 0 (0.0%) | 0 (0.0%) |
| 5 to 9 Year Old | 276 (100.0%) | 0 (0.0%) |
| 10 to 14 Year Olds | 291 (100.0%) | 0 (0.0%) |
| 15 to 17 Year Olds | 90 (100.0%) | 0 (0.0%) |
| 18 to 19 Year Olds | 70 (100.0%) | 0 (0.0%) |
| 20 to 24 Year Olds | 113 (69.3%) | 50 (30.7%) |
| 25 to 34 Year Olds | 0 (0.0%) | 0 (0.0%) |
| 35 Years and over | 50 (100.0%) | 0 (0.0%) |
| Total | 890 (94.7%) | 50 (5.3%) |
Educational Attainment by Field of Study in Bagdad
Physical & health sciences (24 | 37.5%), engineering (22 | 34.4%), and psychology (18 | 28.1%) are the most common fields of study among 64 individuals in Bagdad who have obtained a bachelor's degree or higher.
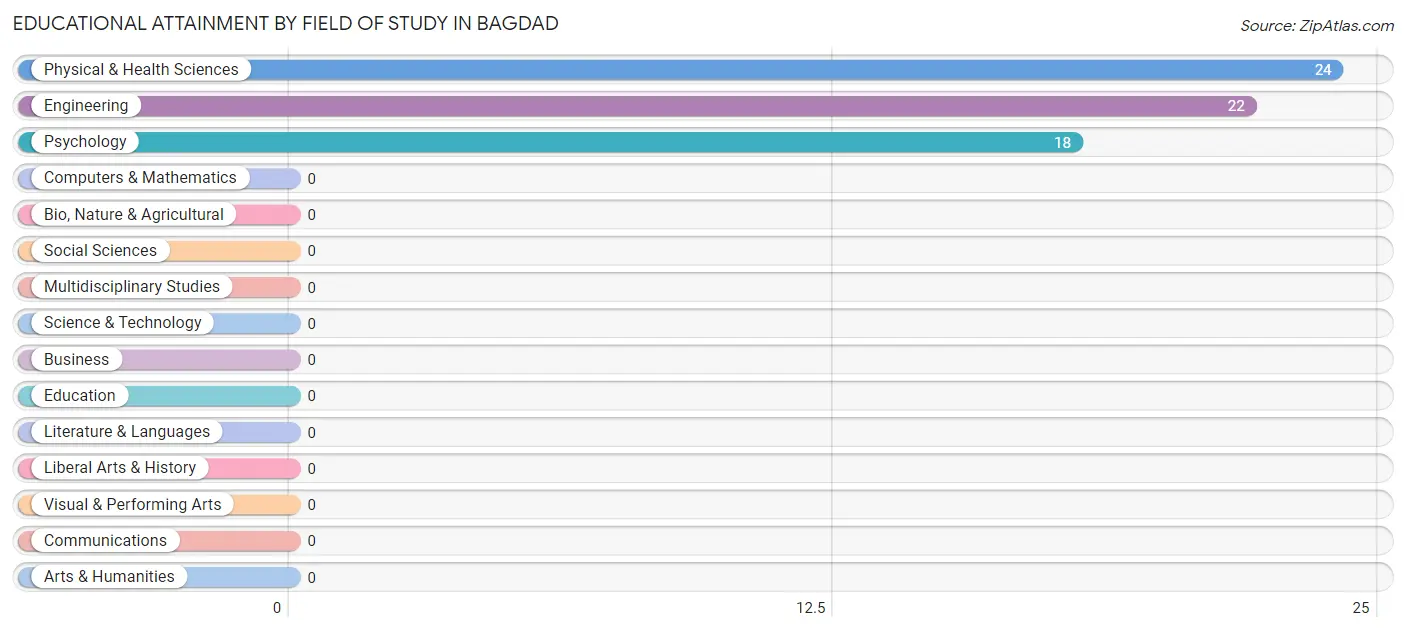
| Field of Study | # Graduates | % Graduates |
| Computers & Mathematics | 0 | 0.0% |
| Bio, Nature & Agricultural | 0 | 0.0% |
| Physical & Health Sciences | 24 | 37.5% |
| Psychology | 18 | 28.1% |
| Social Sciences | 0 | 0.0% |
| Engineering | 22 | 34.4% |
| Multidisciplinary Studies | 0 | 0.0% |
| Science & Technology | 0 | 0.0% |
| Business | 0 | 0.0% |
| Education | 0 | 0.0% |
| Literature & Languages | 0 | 0.0% |
| Liberal Arts & History | 0 | 0.0% |
| Visual & Performing Arts | 0 | 0.0% |
| Communications | 0 | 0.0% |
| Arts & Humanities | 0 | 0.0% |
| Total | 64 | 100.0% |
Transportation & Commute in Bagdad
Vehicle Availability by Sex in Bagdad
The most prevalent vehicle ownership categories in Bagdad are males with 2 vehicles (188, accounting for 28.7%) and females with 2 vehicles (42, making up 42.8%).
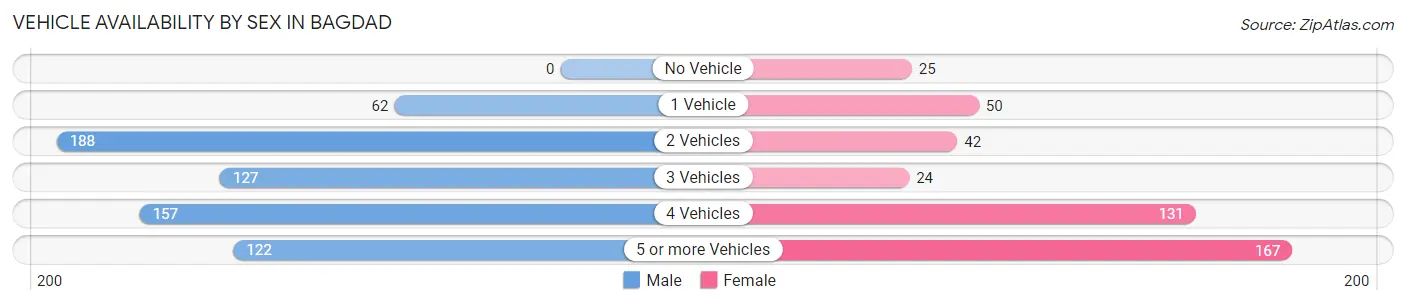
| Vehicles Available | Male | Female |
| No Vehicle | 0 (0.0%) | 25 (5.7%) |
| 1 Vehicle | 62 (9.5%) | 50 (11.4%) |
| 2 Vehicles | 188 (28.7%) | 42 (9.6%) |
| 3 Vehicles | 127 (19.4%) | 24 (5.5%) |
| 4 Vehicles | 157 (23.9%) | 131 (29.8%) |
| 5 or more Vehicles | 122 (18.6%) | 167 (38.0%) |
| Total | 656 (100.0%) | 439 (100.0%) |
Commute Time in Bagdad
The most frequently occuring commute durations in Bagdad are less than 5 minutes (436 commuters, 39.8%), 15 to 19 minutes (219 commuters, 20.0%), and 30 to 34 minutes (158 commuters, 14.4%).
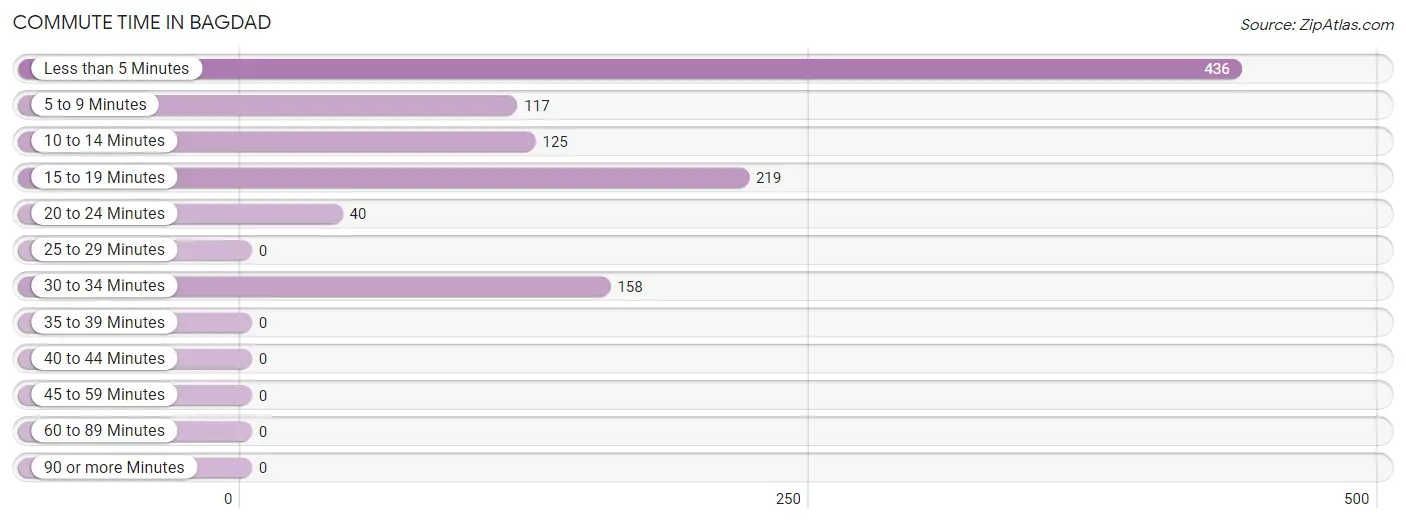
| Commute Time | # Commuters | % Commuters |
| Less than 5 Minutes | 436 | 39.8% |
| 5 to 9 Minutes | 117 | 10.7% |
| 10 to 14 Minutes | 125 | 11.4% |
| 15 to 19 Minutes | 219 | 20.0% |
| 20 to 24 Minutes | 40 | 3.6% |
| 25 to 29 Minutes | 0 | 0.0% |
| 30 to 34 Minutes | 158 | 14.4% |
| 35 to 39 Minutes | 0 | 0.0% |
| 40 to 44 Minutes | 0 | 0.0% |
| 45 to 59 Minutes | 0 | 0.0% |
| 60 to 89 Minutes | 0 | 0.0% |
| 90 or more Minutes | 0 | 0.0% |
Commute Time by Sex in Bagdad
The most common commute times in Bagdad are 15 to 19 minutes (169 commuters, 25.8%) for males and less than 5 minutes (302 commuters, 68.8%) for females.
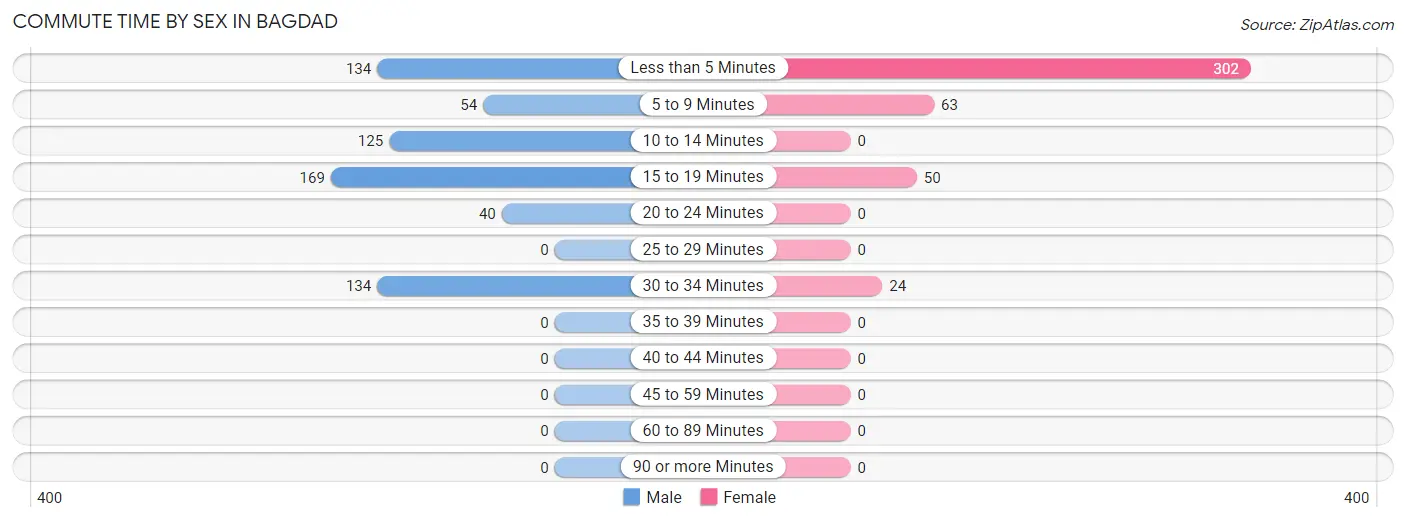
| Commute Time | Male | Female |
| Less than 5 Minutes | 134 (20.4%) | 302 (68.8%) |
| 5 to 9 Minutes | 54 (8.2%) | 63 (14.3%) |
| 10 to 14 Minutes | 125 (19.1%) | 0 (0.0%) |
| 15 to 19 Minutes | 169 (25.8%) | 50 (11.4%) |
| 20 to 24 Minutes | 40 (6.1%) | 0 (0.0%) |
| 25 to 29 Minutes | 0 (0.0%) | 0 (0.0%) |
| 30 to 34 Minutes | 134 (20.4%) | 24 (5.5%) |
| 35 to 39 Minutes | 0 (0.0%) | 0 (0.0%) |
| 40 to 44 Minutes | 0 (0.0%) | 0 (0.0%) |
| 45 to 59 Minutes | 0 (0.0%) | 0 (0.0%) |
| 60 to 89 Minutes | 0 (0.0%) | 0 (0.0%) |
| 90 or more Minutes | 0 (0.0%) | 0 (0.0%) |
Time of Departure to Work by Sex in Bagdad
The most frequent times of departure to work in Bagdad are 5:30 AM to 5:59 AM (252, 38.4%) for males and 7:00 AM to 7:29 AM (178, 40.6%) for females.
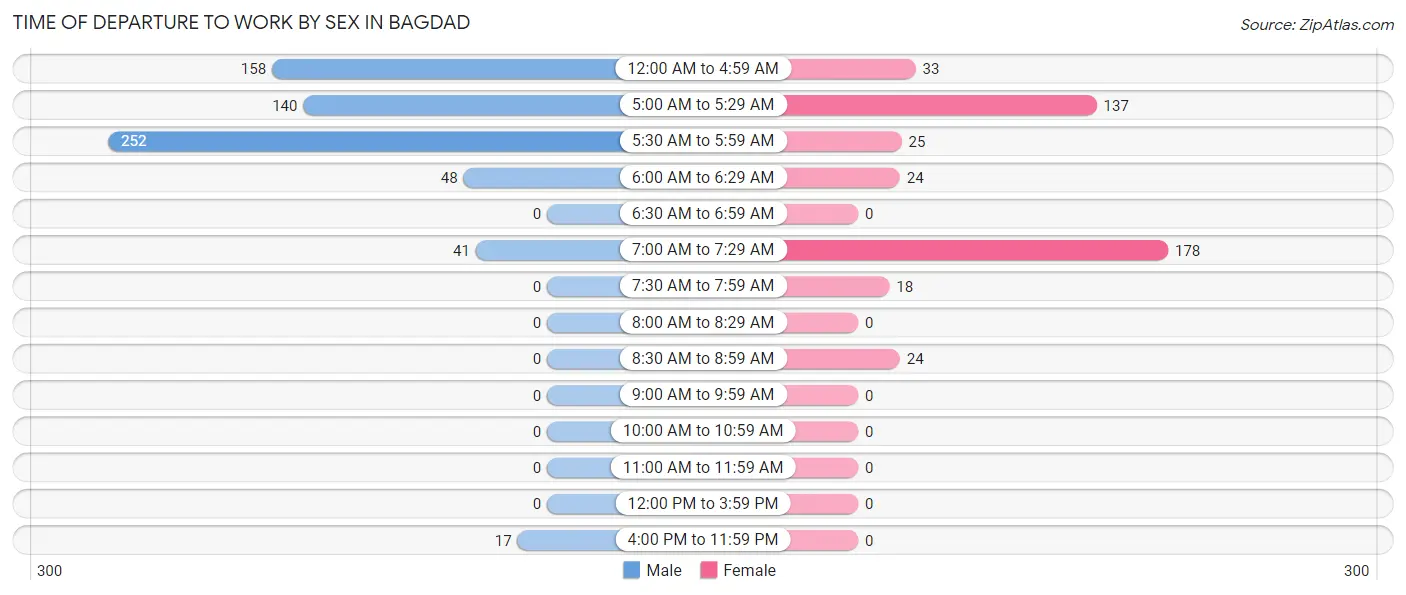
| Time of Departure | Male | Female |
| 12:00 AM to 4:59 AM | 158 (24.1%) | 33 (7.5%) |
| 5:00 AM to 5:29 AM | 140 (21.3%) | 137 (31.2%) |
| 5:30 AM to 5:59 AM | 252 (38.4%) | 25 (5.7%) |
| 6:00 AM to 6:29 AM | 48 (7.3%) | 24 (5.5%) |
| 6:30 AM to 6:59 AM | 0 (0.0%) | 0 (0.0%) |
| 7:00 AM to 7:29 AM | 41 (6.2%) | 178 (40.6%) |
| 7:30 AM to 7:59 AM | 0 (0.0%) | 18 (4.1%) |
| 8:00 AM to 8:29 AM | 0 (0.0%) | 0 (0.0%) |
| 8:30 AM to 8:59 AM | 0 (0.0%) | 24 (5.5%) |
| 9:00 AM to 9:59 AM | 0 (0.0%) | 0 (0.0%) |
| 10:00 AM to 10:59 AM | 0 (0.0%) | 0 (0.0%) |
| 11:00 AM to 11:59 AM | 0 (0.0%) | 0 (0.0%) |
| 12:00 PM to 3:59 PM | 0 (0.0%) | 0 (0.0%) |
| 4:00 PM to 11:59 PM | 17 (2.6%) | 0 (0.0%) |
| Total | 656 (100.0%) | 439 (100.0%) |
Housing Occupancy in Bagdad
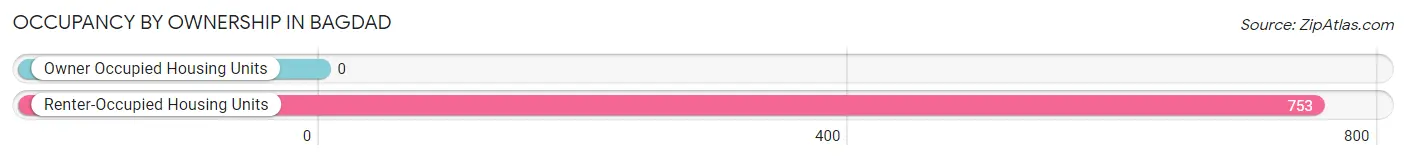
Occupancy by Ownership in Bagdad
Of the total 753 dwellings in Bagdad, owner-occupied units account for 0 (0.0%), while renter-occupied units make up 753 (100.0%).
| Occupancy | # Housing Units | % Housing Units |
| Owner Occupied Housing Units | 0 | 0.0% |
| Renter-Occupied Housing Units | 753 | 100.0% |
| Total Occupied Housing Units | 753 | 100.0% |
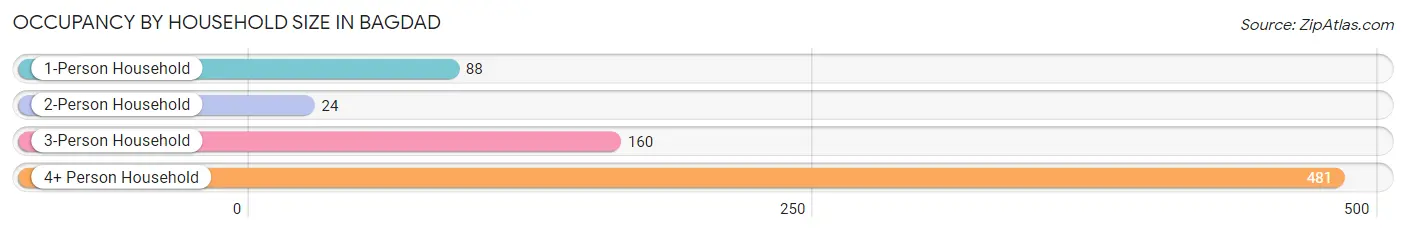
Occupancy by Household Size in Bagdad
| Household Size | # Housing Units | % Housing Units |
| 1-Person Household | 88 | 11.7% |
| 2-Person Household | 24 | 3.2% |
| 3-Person Household | 160 | 21.2% |
| 4+ Person Household | 481 | 63.9% |
| Total Housing Units | 753 | 100.0% |
Occupancy by Ownership by Household Size in Bagdad
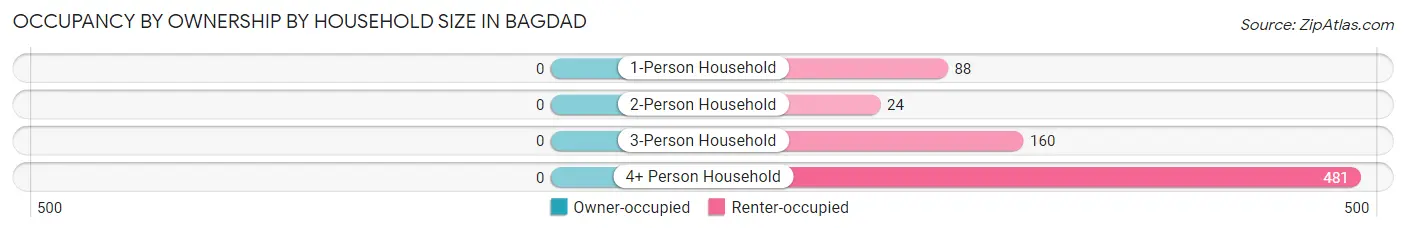
| Household Size | Owner-occupied | Renter-occupied |
| 1-Person Household | 0 (0.0%) | 88 (100.0%) |
| 2-Person Household | 0 (0.0%) | 24 (100.0%) |
| 3-Person Household | 0 (0.0%) | 160 (100.0%) |
| 4+ Person Household | 0 (0.0%) | 481 (100.0%) |
| Total Housing Units | 0 (0.0%) | 753 (100.0%) |
Occupancy by Educational Attainment in Bagdad
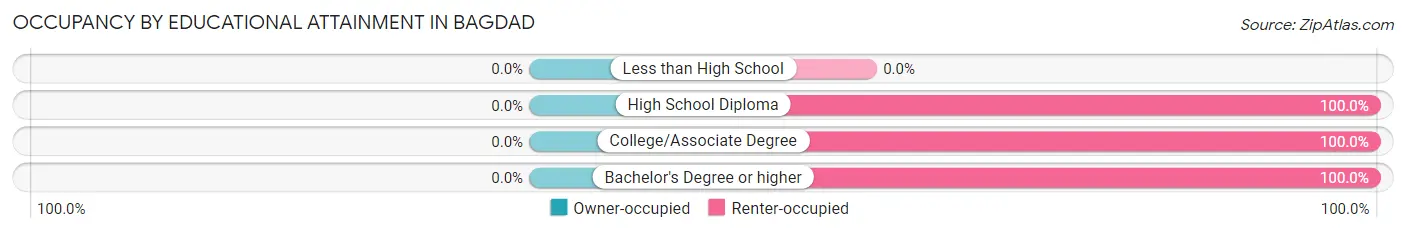
| Household Size | Owner-occupied | Renter-occupied |
| Less than High School | 0 (0.0%) | 0 (0.0%) |
| High School Diploma | 0 (0.0%) | 363 (100.0%) |
| College/Associate Degree | 0 (0.0%) | 344 (100.0%) |
| Bachelor's Degree or higher | 0 (0.0%) | 46 (100.0%) |
Occupancy by Age of Householder in Bagdad
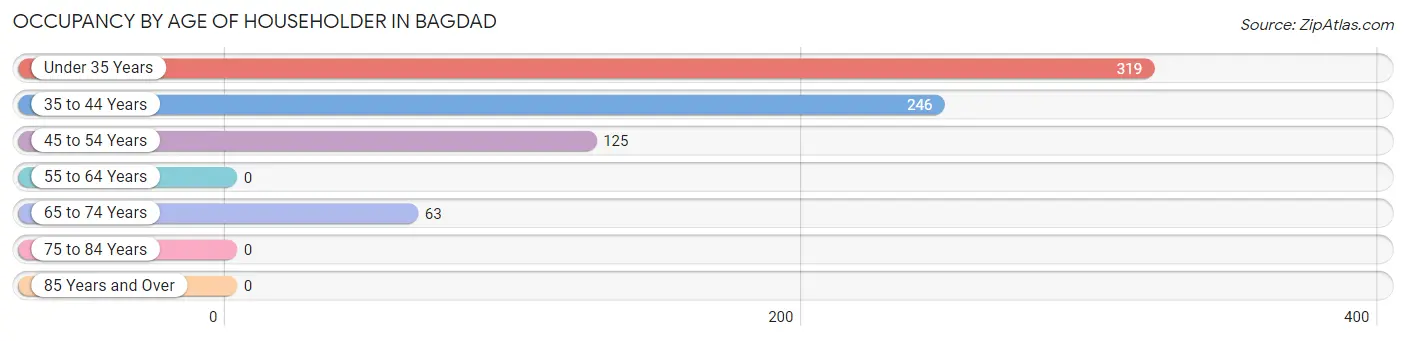
| Age Bracket | # Households | % Households |
| Under 35 Years | 319 | 42.4% |
| 35 to 44 Years | 246 | 32.7% |
| 45 to 54 Years | 125 | 16.6% |
| 55 to 64 Years | 0 | 0.0% |
| 65 to 74 Years | 63 | 8.4% |
| 75 to 84 Years | 0 | 0.0% |
| 85 Years and Over | 0 | 0.0% |
| Total | 753 | 100.0% |
Housing Finances in Bagdad
Median Income by Occupancy in Bagdad
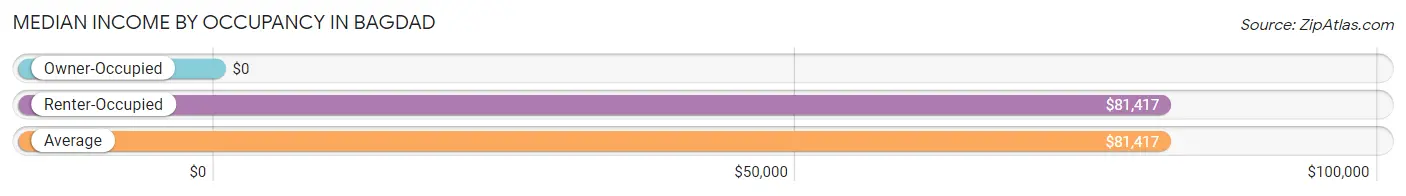
| Occupancy Type | # Households | Median Income |
| Owner-Occupied | 0 (0.0%) | $0 |
| Renter-Occupied | 753 (100.0%) | $81,417 |
| Average | 753 (100.0%) | $81,417 |
Occupancy by Householder Income Bracket in Bagdad
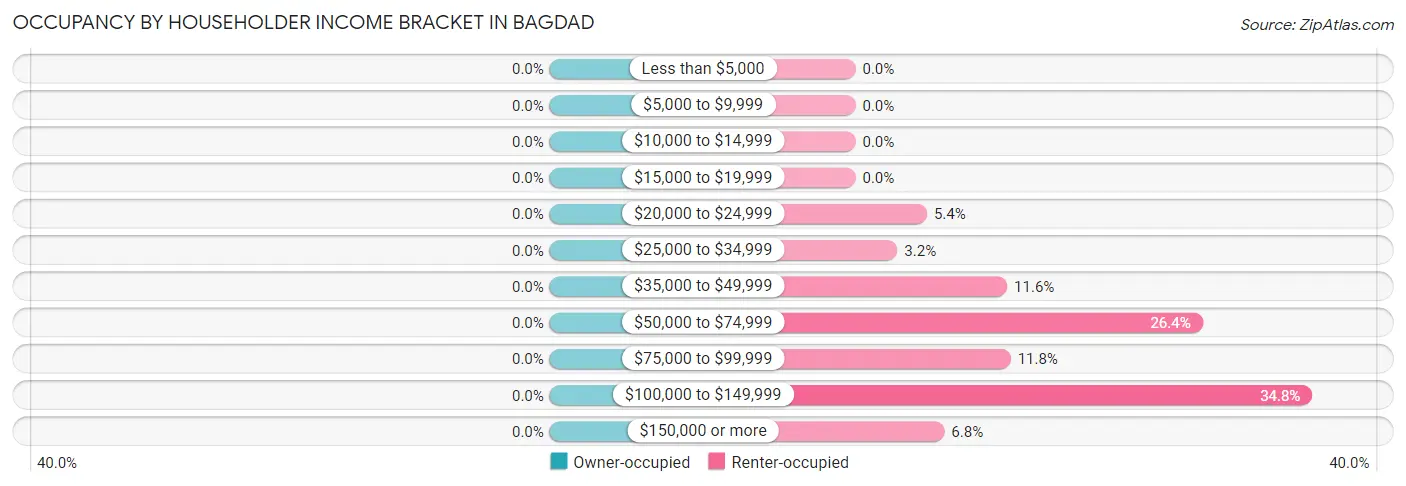
| Income Bracket | Owner-occupied | Renter-occupied |
| Less than $5,000 | 0 (0.0%) | 0 (0.0%) |
| $5,000 to $9,999 | 0 (0.0%) | 0 (0.0%) |
| $10,000 to $14,999 | 0 (0.0%) | 0 (0.0%) |
| $15,000 to $19,999 | 0 (0.0%) | 0 (0.0%) |
| $20,000 to $24,999 | 0 (0.0%) | 41 (5.4%) |
| $25,000 to $34,999 | 0 (0.0%) | 24 (3.2%) |
| $35,000 to $49,999 | 0 (0.0%) | 87 (11.6%) |
| $50,000 to $74,999 | 0 (0.0%) | 199 (26.4%) |
| $75,000 to $99,999 | 0 (0.0%) | 89 (11.8%) |
| $100,000 to $149,999 | 0 (0.0%) | 262 (34.8%) |
| $150,000 or more | 0 (0.0%) | 51 (6.8%) |
| Total | 0 (0.0%) | 753 (100.0%) |
Monthly Housing Cost Tiers in Bagdad
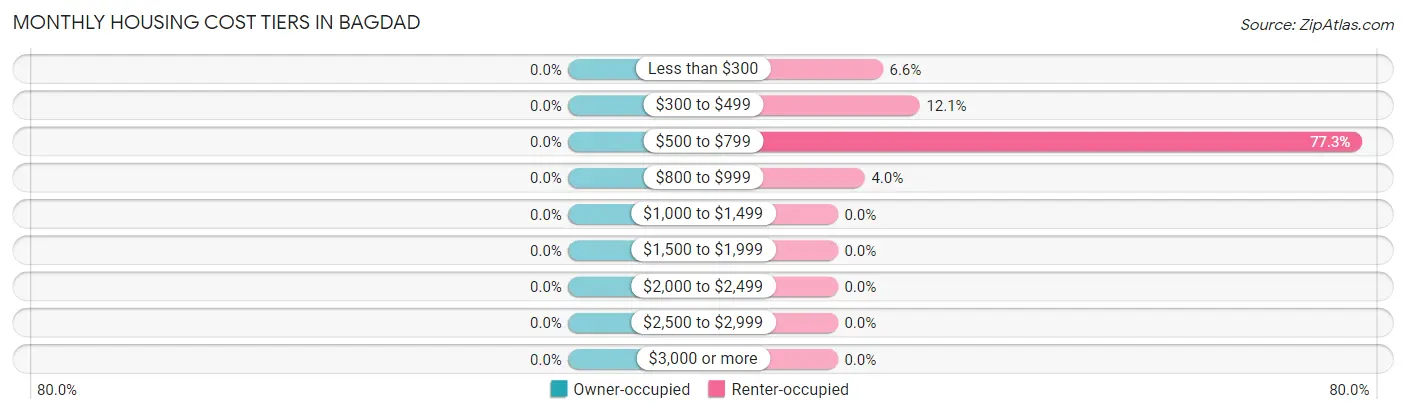
| Monthly Cost | Owner-occupied | Renter-occupied |
| Less than $300 | 0 (0.0%) | 50 (6.6%) |
| $300 to $499 | 0 (0.0%) | 91 (12.1%) |
| $500 to $799 | 0 (0.0%) | 582 (77.3%) |
| $800 to $999 | 0 (0.0%) | 30 (4.0%) |
| $1,000 to $1,499 | 0 (0.0%) | 0 (0.0%) |
| $1,500 to $1,999 | 0 (0.0%) | 0 (0.0%) |
| $2,000 to $2,499 | 0 (0.0%) | 0 (0.0%) |
| $2,500 to $2,999 | 0 (0.0%) | 0 (0.0%) |
| $3,000 or more | 0 (0.0%) | 0 (0.0%) |
| Total | 0 (0.0%) | 753 (100.0%) |
Physical Housing Characteristics in Bagdad
Housing Structures in Bagdad
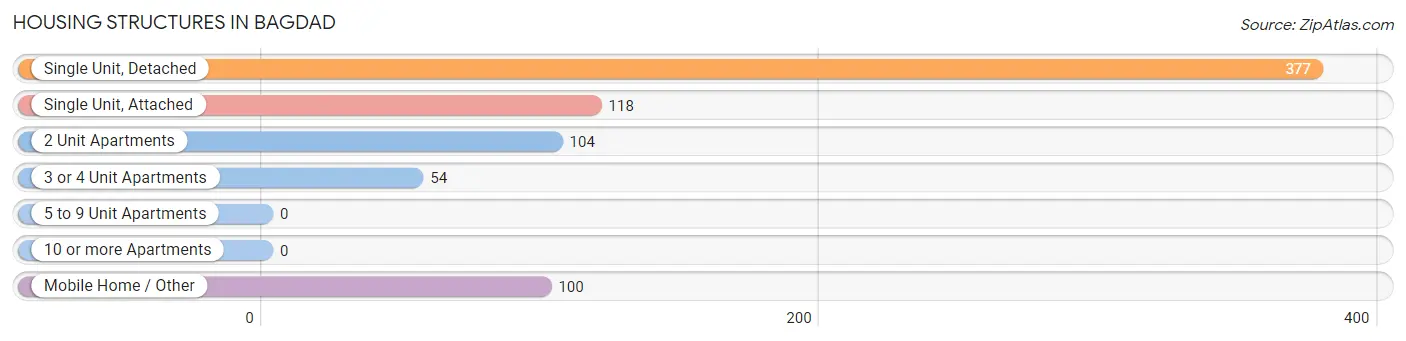
| Structure Type | # Housing Units | % Housing Units |
| Single Unit, Detached | 377 | 50.1% |
| Single Unit, Attached | 118 | 15.7% |
| 2 Unit Apartments | 104 | 13.8% |
| 3 or 4 Unit Apartments | 54 | 7.2% |
| 5 to 9 Unit Apartments | 0 | 0.0% |
| 10 or more Apartments | 0 | 0.0% |
| Mobile Home / Other | 100 | 13.3% |
| Total | 753 | 100.0% |
Housing Structures by Occupancy in Bagdad
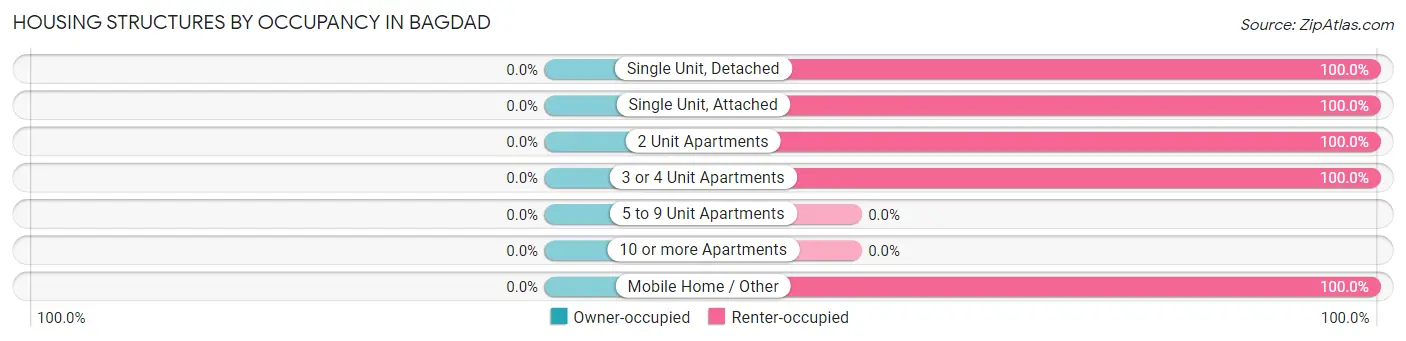
| Structure Type | Owner-occupied | Renter-occupied |
| Single Unit, Detached | 0 (0.0%) | 377 (100.0%) |
| Single Unit, Attached | 0 (0.0%) | 118 (100.0%) |
| 2 Unit Apartments | 0 (0.0%) | 104 (100.0%) |
| 3 or 4 Unit Apartments | 0 (0.0%) | 54 (100.0%) |
| 5 to 9 Unit Apartments | 0 (0.0%) | 0 (0.0%) |
| 10 or more Apartments | 0 (0.0%) | 0 (0.0%) |
| Mobile Home / Other | 0 (0.0%) | 100 (100.0%) |
| Total | 0 (0.0%) | 753 (100.0%) |
Housing Structures by Number of Rooms in Bagdad
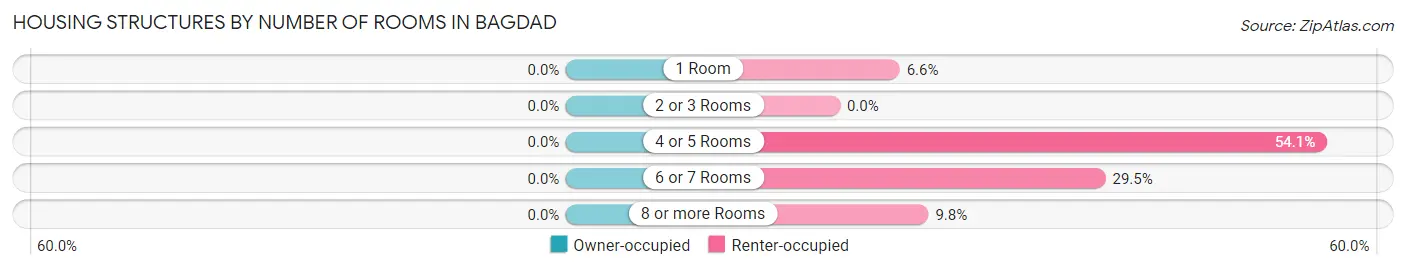
| Number of Rooms | Owner-occupied | Renter-occupied |
| 1 Room | 0 (0.0%) | 50 (6.6%) |
| 2 or 3 Rooms | 0 (0.0%) | 0 (0.0%) |
| 4 or 5 Rooms | 0 (0.0%) | 407 (54.0%) |
| 6 or 7 Rooms | 0 (0.0%) | 222 (29.5%) |
| 8 or more Rooms | 0 (0.0%) | 74 (9.8%) |
| Total | 0 (0.0%) | 753 (100.0%) |
Housing Structure by Heating Type in Bagdad
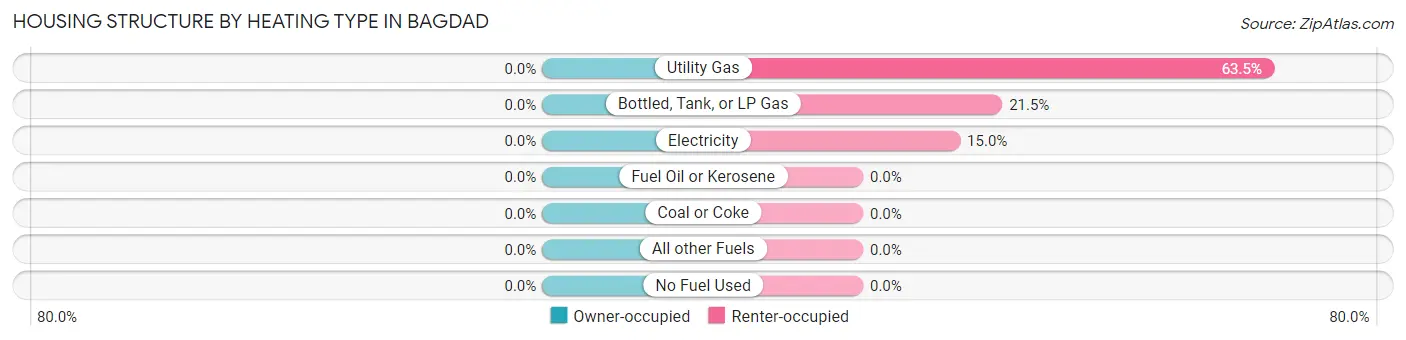
| Heating Type | Owner-occupied | Renter-occupied |
| Utility Gas | 0 (0.0%) | 478 (63.5%) |
| Bottled, Tank, or LP Gas | 0 (0.0%) | 162 (21.5%) |
| Electricity | 0 (0.0%) | 113 (15.0%) |
| Fuel Oil or Kerosene | 0 (0.0%) | 0 (0.0%) |
| Coal or Coke | 0 (0.0%) | 0 (0.0%) |
| All other Fuels | 0 (0.0%) | 0 (0.0%) |
| No Fuel Used | 0 (0.0%) | 0 (0.0%) |
| Total | 0 (0.0%) | 753 (100.0%) |
Household Vehicle Usage in Bagdad
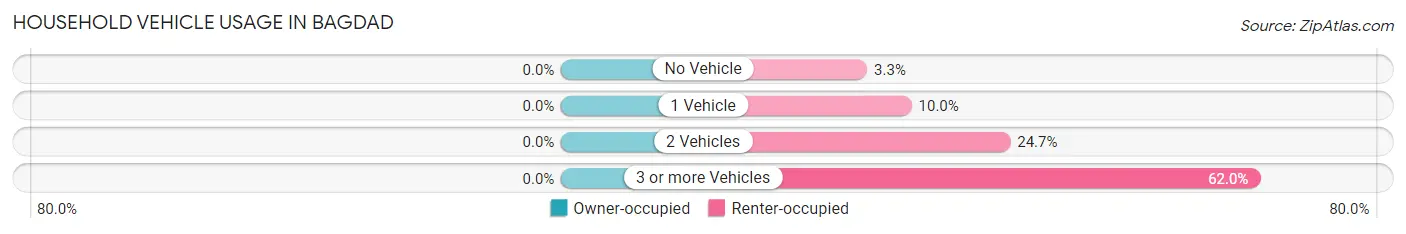
| Vehicles per Household | Owner-occupied | Renter-occupied |
| No Vehicle | 0 (0.0%) | 25 (3.3%) |
| 1 Vehicle | 0 (0.0%) | 75 (10.0%) |
| 2 Vehicles | 0 (0.0%) | 186 (24.7%) |
| 3 or more Vehicles | 0 (0.0%) | 467 (62.0%) |
| Total | 0 (0.0%) | 753 (100.0%) |
Real Estate & Mortgages in Bagdad
Real Estate and Mortgage Overview in Bagdad
| Characteristic | Without Mortgage | With Mortgage |
| Housing Units | 0 | 0 |
| Median Property Value | - | - |
| Median Household Income | - | - |
| Monthly Housing Costs | - | - |
| Real Estate Taxes | - | - |
Property Value by Mortgage Status in Bagdad
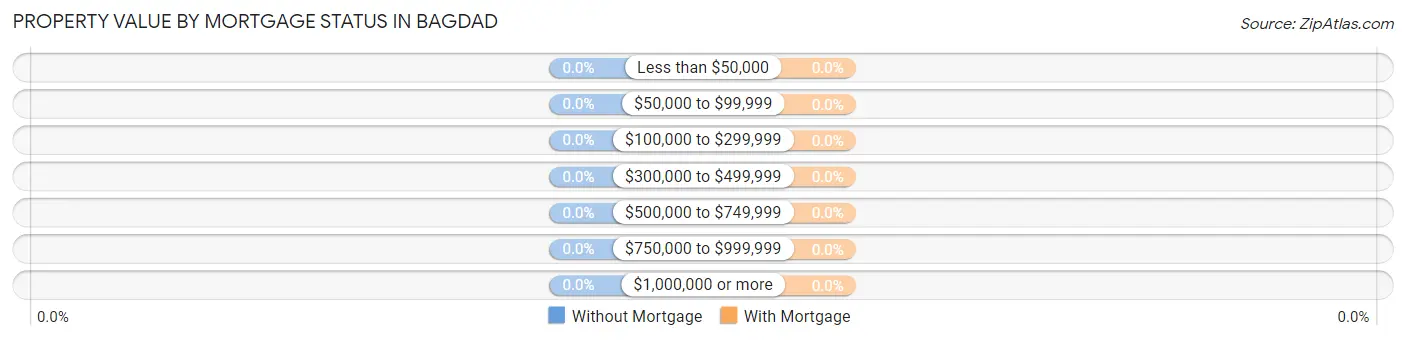
| Property Value | Without Mortgage | With Mortgage |
| Less than $50,000 | 0 (0.0%) | 0 (0.0%) |
| $50,000 to $99,999 | 0 (0.0%) | 0 (0.0%) |
| $100,000 to $299,999 | 0 (0.0%) | 0 (0.0%) |
| $300,000 to $499,999 | 0 (0.0%) | 0 (0.0%) |
| $500,000 to $749,999 | 0 (0.0%) | 0 (0.0%) |
| $750,000 to $999,999 | 0 (0.0%) | 0 (0.0%) |
| $1,000,000 or more | 0 (0.0%) | 0 (0.0%) |
| Total | 0 (0.0%) | 0 (0.0%) |
Household Income by Mortgage Status in Bagdad
| Household Income | Without Mortgage | With Mortgage |
| Less than $10,000 | 0 (0.0%) | 0 (0.0%) |
| $10,000 to $24,999 | 0 (0.0%) | 0 (0.0%) |
| $25,000 to $34,999 | 0 (0.0%) | 0 (0.0%) |
| $35,000 to $49,999 | 0 (0.0%) | 0 (0.0%) |
| $50,000 to $74,999 | 0 (0.0%) | 0 (0.0%) |
| $75,000 to $99,999 | 0 (0.0%) | 0 (0.0%) |
| $100,000 to $149,999 | 0 (0.0%) | 0 (0.0%) |
| $150,000 or more | 0 (0.0%) | 0 (0.0%) |
| Total | 0 (0.0%) | 0 (0.0%) |
Property Value to Household Income Ratio in Bagdad
| Value-to-Income Ratio | Without Mortgage | With Mortgage |
| Less than 2.0x | 0 (0.0%) | 0 (0.0%) |
| 2.0x to 2.9x | 0 (0.0%) | 0 (0.0%) |
| 3.0x to 3.9x | 0 (0.0%) | 0 (0.0%) |
| 4.0x or more | 0 (0.0%) | 0 (0.0%) |
| Total | 0 (0.0%) | 0 (0.0%) |
Real Estate Taxes by Mortgage Status in Bagdad
| Property Taxes | Without Mortgage | With Mortgage |
| Less than $800 | 0 (0.0%) | 0 (0.0%) |
| $800 to $1,499 | 0 (0.0%) | 0 (0.0%) |
| $800 to $1,499 | 0 (0.0%) | 0 (0.0%) |
| Total | 0 (0.0%) | 0 (0.0%) |
Health & Disability in Bagdad
Health Insurance Coverage by Age in Bagdad
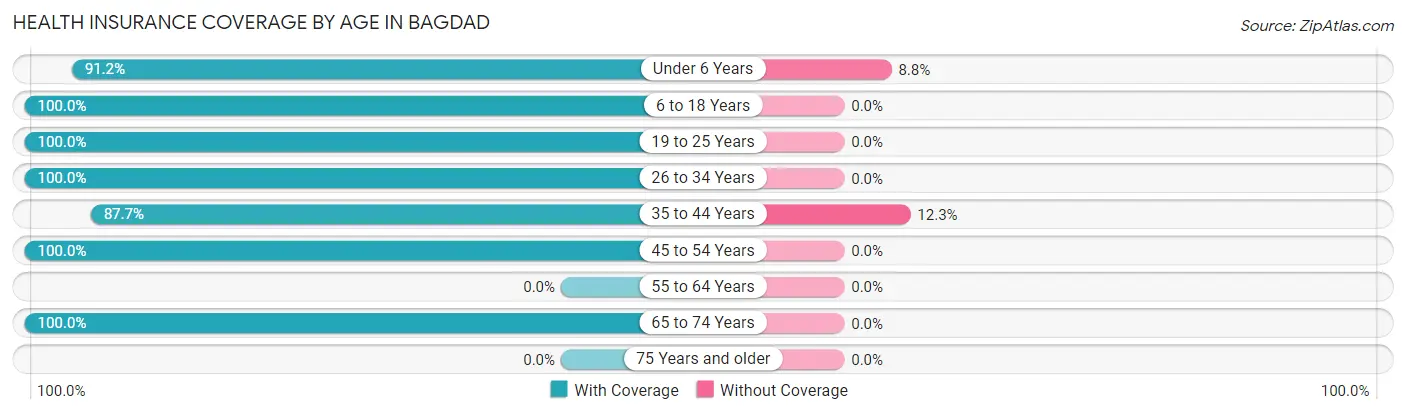
| Age Bracket | With Coverage | Without Coverage |
| Under 6 Years | 425 (91.2%) | 41 (8.8%) |
| 6 to 18 Years | 728 (100.0%) | 0 (0.0%) |
| 19 to 25 Years | 451 (100.0%) | 0 (0.0%) |
| 26 to 34 Years | 275 (100.0%) | 0 (0.0%) |
| 35 to 44 Years | 391 (87.7%) | 55 (12.3%) |
| 45 to 54 Years | 232 (100.0%) | 0 (0.0%) |
| 55 to 64 Years | 0 (0.0%) | 0 (0.0%) |
| 65 to 74 Years | 63 (100.0%) | 0 (0.0%) |
| 75 Years and older | 0 (0.0%) | 0 (0.0%) |
| Total | 2,565 (96.4%) | 96 (3.6%) |
Health Insurance Coverage by Citizenship Status in Bagdad
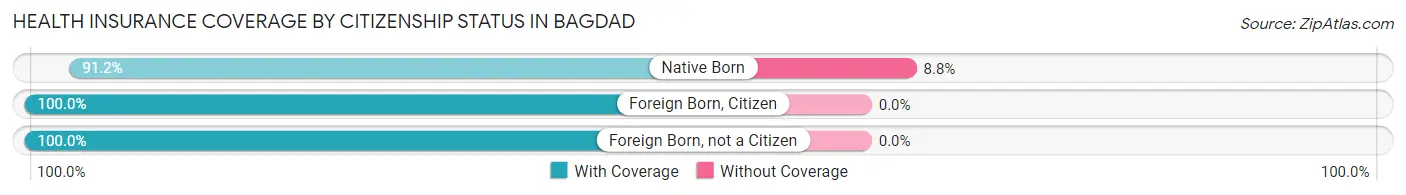
| Citizenship Status | With Coverage | Without Coverage |
| Native Born | 425 (91.2%) | 41 (8.8%) |
| Foreign Born, Citizen | 728 (100.0%) | 0 (0.0%) |
| Foreign Born, not a Citizen | 451 (100.0%) | 0 (0.0%) |
Health Insurance Coverage by Household Income in Bagdad
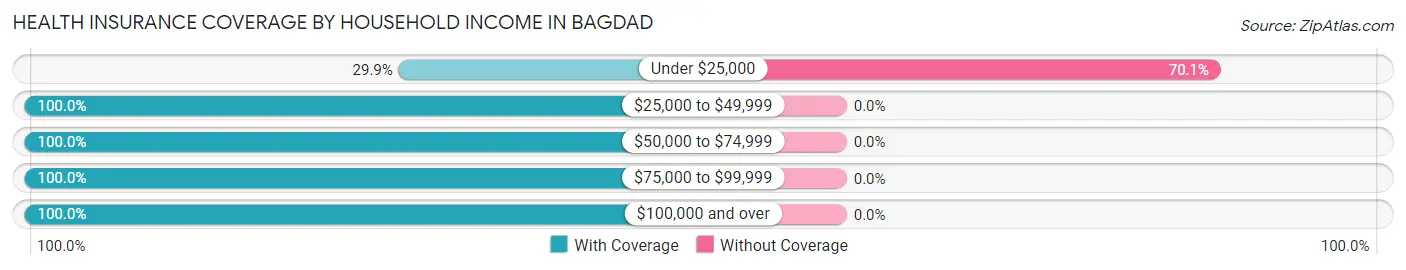
| Household Income | With Coverage | Without Coverage |
| Under $25,000 | 41 (29.9%) | 96 (70.1%) |
| $25,000 to $49,999 | 235 (100.0%) | 0 (0.0%) |
| $50,000 to $74,999 | 692 (100.0%) | 0 (0.0%) |
| $75,000 to $99,999 | 261 (100.0%) | 0 (0.0%) |
| $100,000 and over | 1,336 (100.0%) | 0 (0.0%) |
Public vs Private Health Insurance Coverage by Age in Bagdad
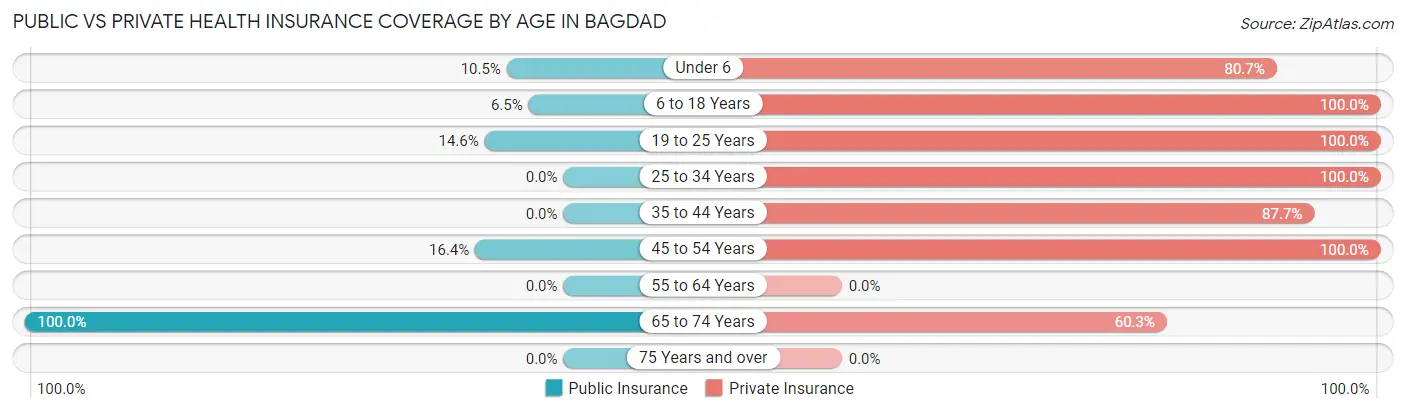
| Age Bracket | Public Insurance | Private Insurance |
| Under 6 | 49 (10.5%) | 376 (80.7%) |
| 6 to 18 Years | 47 (6.5%) | 728 (100.0%) |
| 19 to 25 Years | 66 (14.6%) | 451 (100.0%) |
| 25 to 34 Years | 0 (0.0%) | 275 (100.0%) |
| 35 to 44 Years | 0 (0.0%) | 391 (87.7%) |
| 45 to 54 Years | 38 (16.4%) | 232 (100.0%) |
| 55 to 64 Years | 0 (0.0%) | 0 (0.0%) |
| 65 to 74 Years | 63 (100.0%) | 38 (60.3%) |
| 75 Years and over | 0 (0.0%) | 0 (0.0%) |
| Total | 263 (9.9%) | 2,491 (93.6%) |
Disability Status by Sex by Age in Bagdad
| Age Bracket | Male | Female |
| Under 5 Years | 0 (0.0%) | 0 (0.0%) |
| 5 to 17 Years | 0 (0.0%) | 0 (0.0%) |
| 18 to 34 Years | 0 (0.0%) | 0 (0.0%) |
| 35 to 64 Years | 0 (0.0%) | 0 (0.0%) |
| 65 to 74 Years | 0 (0.0%) | 0 (0.0%) |
| 75 Years and over | 0 (0.0%) | 0 (0.0%) |
Disability Class by Sex by Age in Bagdad
Disability Class: Hearing Difficulty
| Age Bracket | Male | Female |
| Under 5 Years | 0 (0.0%) | 0 (0.0%) |
| 5 to 17 Years | 0 (0.0%) | 0 (0.0%) |
| 18 to 34 Years | 0 (0.0%) | 0 (0.0%) |
| 35 to 64 Years | 0 (0.0%) | 0 (0.0%) |
| 65 to 74 Years | 0 (0.0%) | 0 (0.0%) |
| 75 Years and over | 0 (0.0%) | 0 (0.0%) |
Disability Class: Vision Difficulty
| Age Bracket | Male | Female |
| Under 5 Years | 0 (0.0%) | 0 (0.0%) |
| 5 to 17 Years | 0 (0.0%) | 0 (0.0%) |
| 18 to 34 Years | 0 (0.0%) | 0 (0.0%) |
| 35 to 64 Years | 0 (0.0%) | 0 (0.0%) |
| 65 to 74 Years | 0 (0.0%) | 0 (0.0%) |
| 75 Years and over | 0 (0.0%) | 0 (0.0%) |
Disability Class: Cognitive Difficulty
| Age Bracket | Male | Female |
| 5 to 17 Years | 0 (0.0%) | 0 (0.0%) |
| 18 to 34 Years | 0 (0.0%) | 0 (0.0%) |
| 35 to 64 Years | 0 (0.0%) | 0 (0.0%) |
| 65 to 74 Years | 0 (0.0%) | 0 (0.0%) |
| 75 Years and over | 0 (0.0%) | 0 (0.0%) |
Disability Class: Ambulatory Difficulty
| Age Bracket | Male | Female |
| 5 to 17 Years | 0 (0.0%) | 0 (0.0%) |
| 18 to 34 Years | 0 (0.0%) | 0 (0.0%) |
| 35 to 64 Years | 0 (0.0%) | 0 (0.0%) |
| 65 to 74 Years | 0 (0.0%) | 0 (0.0%) |
| 75 Years and over | 0 (0.0%) | 0 (0.0%) |
Disability Class: Self-Care Difficulty
| Age Bracket | Male | Female |
| 5 to 17 Years | 0 (0.0%) | 0 (0.0%) |
| 18 to 34 Years | 0 (0.0%) | 0 (0.0%) |
| 35 to 64 Years | 0 (0.0%) | 0 (0.0%) |
| 65 to 74 Years | 0 (0.0%) | 0 (0.0%) |
| 75 Years and over | 0 (0.0%) | 0 (0.0%) |
Technology Access in Bagdad
Computing Device Access in Bagdad
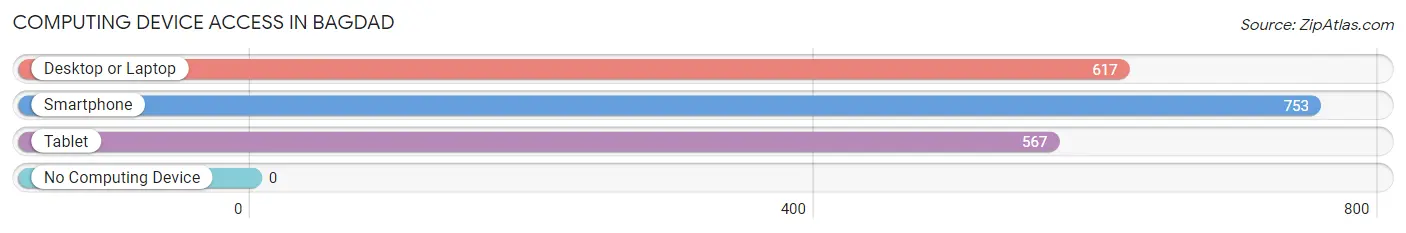
| Device Type | # Households | % Households |
| Desktop or Laptop | 617 | 81.9% |
| Smartphone | 753 | 100.0% |
| Tablet | 567 | 75.3% |
| No Computing Device | 0 | 0.0% |
| Total | 753 | 100.0% |
Internet Access in Bagdad
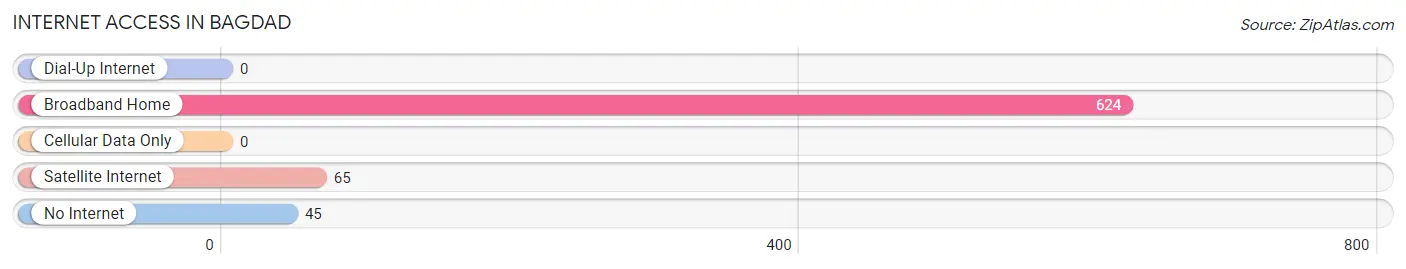
| Internet Type | # Households | % Households |
| Dial-Up Internet | 0 | 0.0% |
| Broadband Home | 624 | 82.9% |
| Cellular Data Only | 0 | 0.0% |
| Satellite Internet | 65 | 8.6% |
| No Internet | 45 | 6.0% |
| Total | 753 | 100.0% |
Bagdad Summary
Bagdad, Arizona is a small town located in Yavapai County, Arizona. It is situated in the western part of the state, approximately 100 miles northwest of Phoenix. The town was founded in 1882 and is named after the city of Baghdad in Iraq. Bagdad is known for its copper mining industry, which has been a major source of employment and economic activity in the area for over a century.
Geography
Bagdad is located in the western part of Arizona, in Yavapai County. It is situated in the foothills of the Bradshaw Mountains, at an elevation of 3,890 feet. The town is located on the banks of the Santa Maria River, which flows through the area. The climate in Bagdad is arid and semi-arid, with hot summers and mild winters. The average annual precipitation is approximately 11 inches.
Demographics
As of the 2010 census, the population of Bagdad was 1,876. The racial makeup of the town was 94.3% White, 0.3% African American, 0.7% Native American, 0.2% Asian, 0.1% Pacific Islander, 2.3% from other races, and 2.3% from two or more races. Hispanic or Latino of any race were 6.3% of the population.
Economy
The economy of Bagdad is largely based on copper mining. The town is home to the Bagdad Mine, which is one of the largest copper mines in the United States. The mine has been in operation since 1882 and is owned by Freeport-McMoRan, one of the world’s largest copper producers. The mine employs over 1,000 people and is a major source of employment and economic activity in the area.
In addition to copper mining, Bagdad is also home to a number of other businesses, including a lumber mill, a sawmill, a feed store, a hardware store, and a number of restaurants and bars. The town also has a small airport, which is used for recreational and business purposes.
History
Bagdad was founded in 1882 by a group of prospectors who were searching for copper. The town was named after the city of Baghdad in Iraq, and the name was chosen because of the similarity between the two cities. The town quickly grew as the copper mining industry flourished, and by the early 1900s, Bagdad was a thriving community.
In the early 1900s, the town was home to a number of saloons, hotels, and other businesses. The town also had a school, a post office, and a number of churches. In the 1920s, the town was connected to the rest of Arizona by the Santa Fe Railroad, which allowed for increased economic activity and growth.
In the 1950s, the copper mining industry began to decline, and the town’s population began to decline as well. In the 1970s, the town was designated as a Superfund site due to the environmental damage caused by the copper mining. In the 1980s, the town began to recover, and the population began to increase again. Today, Bagdad is a small but vibrant community, with a population of just over 1,800 people.
Common Questions
What is Per Capita Income in Bagdad?
Per Capita income in Bagdad is $22,996.
What is the Median Family Income in Bagdad?
Median Family Income in Bagdad is $86,513.
What is the Median Household income in Bagdad?
Median Household Income in Bagdad is $81,417.
What is Income or Wage Gap in Bagdad?
Income or Wage Gap in Bagdad is 56.8%.
Women in Bagdad earn 43.2 cents for every dollar earned by a man.
What is Inequality or Gini Index in Bagdad?
Inequality or Gini Index in Bagdad is 0.25.
What is the Total Population of Bagdad?
Total Population of Bagdad is 2,661.
What is the Total Male Population of Bagdad?
Total Male Population of Bagdad is 1,326.
What is the Total Female Population of Bagdad?
Total Female Population of Bagdad is 1,335.
What is the Ratio of Males per 100 Females in Bagdad?
There are 99.33 Males per 100 Females in Bagdad.
What is the Ratio of Females per 100 Males in Bagdad?
There are 100.68 Females per 100 Males in Bagdad.
What is the Median Population Age in Bagdad?
Median Population Age in Bagdad is 22.0 Years.
What is the Average Family Size in Bagdad
Average Family Size in Bagdad is 3.6 People.
What is the Average Household Size in Bagdad
Average Household Size in Bagdad is 3.5 People.
How Large is the Labor Force in Bagdad?
There are 1,096 People in the Labor Forcein in Bagdad.
What is the Percentage of People in the Labor Force in Bagdad?
67.3% of People are in the Labor Force in Bagdad.