Whiteriver, AZ Map & Demographics
Whiteriver Map
Whiteriver Overview
$13,433
PER CAPITA INCOME
$39,263
AVG FAMILY INCOME
$37,165
AVG HOUSEHOLD INCOME
3.9%
WAGE / INCOME GAP [ % ]
96.1¢/ $1
WAGE / INCOME GAP [ $ ]
$12,733
FAMILY INCOME DEFICIT
0.47
INEQUALITY / GINI INDEX
4,284
TOTAL POPULATION
2,216
MALE POPULATION
2,068
FEMALE POPULATION
107.16
MALES / 100 FEMALES
93.32
FEMALES / 100 MALES
32.2
MEDIAN AGE
3.7
AVG FAMILY SIZE
3.3
AVG HOUSEHOLD SIZE
1,140
LABOR FORCE [ PEOPLE ]
37.4%
PERCENT IN LABOR FORCE
9.3%
UNEMPLOYMENT RATE
Whiteriver Zip Codes
Whiteriver Area Codes
Income in Whiteriver
Income Overview in Whiteriver
Per Capita Income in Whiteriver is $13,433, while median incomes of families and households are $39,263 and $37,165 respectively.
| Characteristic | Number | Measure |
| Per Capita Income | 4,284 | $13,433 |
| Median Family Income | 1,042 | $39,263 |
| Mean Family Income | 1,042 | $48,527 |
| Median Household Income | 1,267 | $37,165 |
| Mean Household Income | 1,267 | $44,151 |
| Income Deficit | 1,042 | $12,733 |
| Wage / Income Gap (%) | 4,284 | 3.91% |
| Wage / Income Gap ($) | 4,284 | 96.09¢ per $1 |
| Gini / Inequality Index | 4,284 | 0.47 |
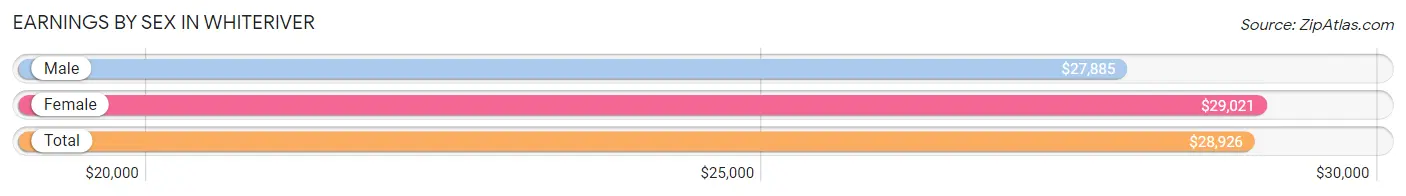
Earnings by Sex in Whiteriver
Average Earnings in Whiteriver are $28,926, $27,885 for men and $29,021 for women, a difference of 3.9%.
| Sex | Number | Average Earnings |
| Male | 526 (42.2%) | $27,885 |
| Female | 720 (57.8%) | $29,021 |
| Total | 1,246 (100.0%) | $28,926 |
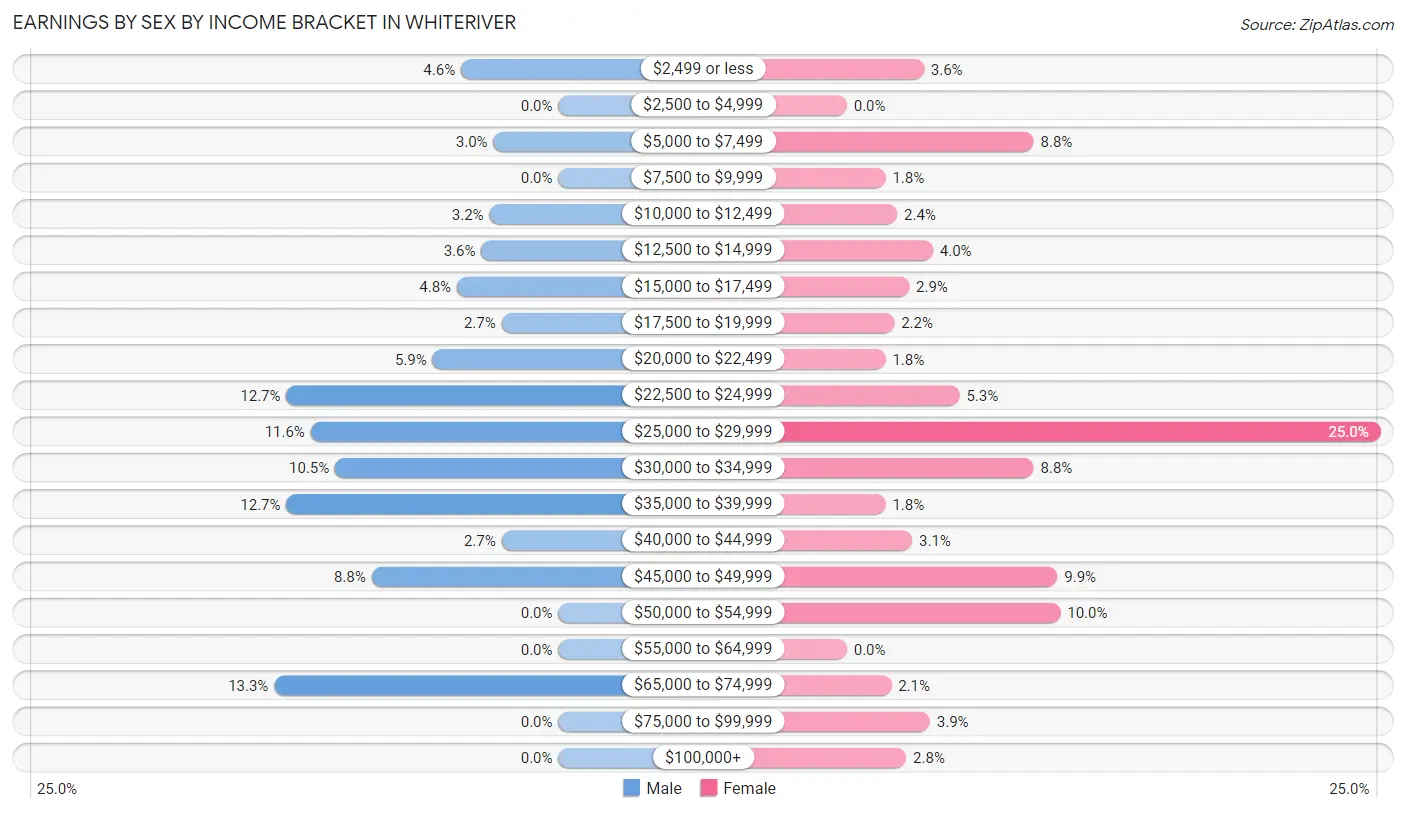
Earnings by Sex by Income Bracket in Whiteriver
The most common earnings brackets in Whiteriver are $65,000 to $74,999 for men (70 | 13.3%) and $25,000 to $29,999 for women (180 | 25.0%).
| Income | Male | Female |
| $2,499 or less | 24 (4.6%) | 26 (3.6%) |
| $2,500 to $4,999 | 0 (0.0%) | 0 (0.0%) |
| $5,000 to $7,499 | 16 (3.0%) | 63 (8.7%) |
| $7,500 to $9,999 | 0 (0.0%) | 13 (1.8%) |
| $10,000 to $12,499 | 17 (3.2%) | 17 (2.4%) |
| $12,500 to $14,999 | 19 (3.6%) | 29 (4.0%) |
| $15,000 to $17,499 | 25 (4.8%) | 21 (2.9%) |
| $17,500 to $19,999 | 14 (2.7%) | 16 (2.2%) |
| $20,000 to $22,499 | 31 (5.9%) | 13 (1.8%) |
| $22,500 to $24,999 | 67 (12.7%) | 38 (5.3%) |
| $25,000 to $29,999 | 61 (11.6%) | 180 (25.0%) |
| $30,000 to $34,999 | 55 (10.5%) | 63 (8.7%) |
| $35,000 to $39,999 | 67 (12.7%) | 13 (1.8%) |
| $40,000 to $44,999 | 14 (2.7%) | 22 (3.1%) |
| $45,000 to $49,999 | 46 (8.7%) | 71 (9.9%) |
| $50,000 to $54,999 | 0 (0.0%) | 72 (10.0%) |
| $55,000 to $64,999 | 0 (0.0%) | 0 (0.0%) |
| $65,000 to $74,999 | 70 (13.3%) | 15 (2.1%) |
| $75,000 to $99,999 | 0 (0.0%) | 28 (3.9%) |
| $100,000+ | 0 (0.0%) | 20 (2.8%) |
| Total | 526 (100.0%) | 720 (100.0%) |
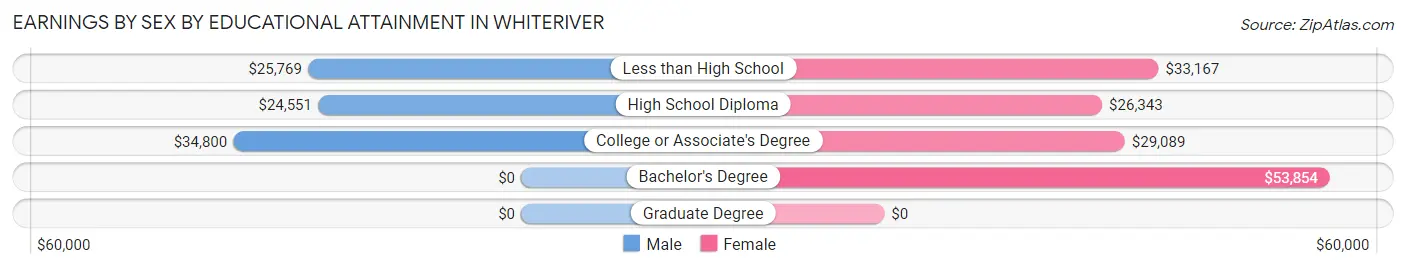
Earnings by Sex by Educational Attainment in Whiteriver
Average earnings in Whiteriver are $29,038 for men and $29,650 for women, a difference of 2.1%. Men with an educational attainment of college or associate's degree enjoy the highest average annual earnings of $34,800, while those with high school diploma education earn the least with $24,551. Women with an educational attainment of bachelor's degree earn the most with the average annual earnings of $53,854, while those with high school diploma education have the smallest earnings of $26,343.
| Educational Attainment | Male Income | Female Income |
| Less than High School | $25,769 | $33,167 |
| High School Diploma | $24,551 | $26,343 |
| College or Associate's Degree | $34,800 | $29,089 |
| Bachelor's Degree | - | - |
| Graduate Degree | - | - |
| Total | $29,038 | $29,650 |
Family Income in Whiteriver
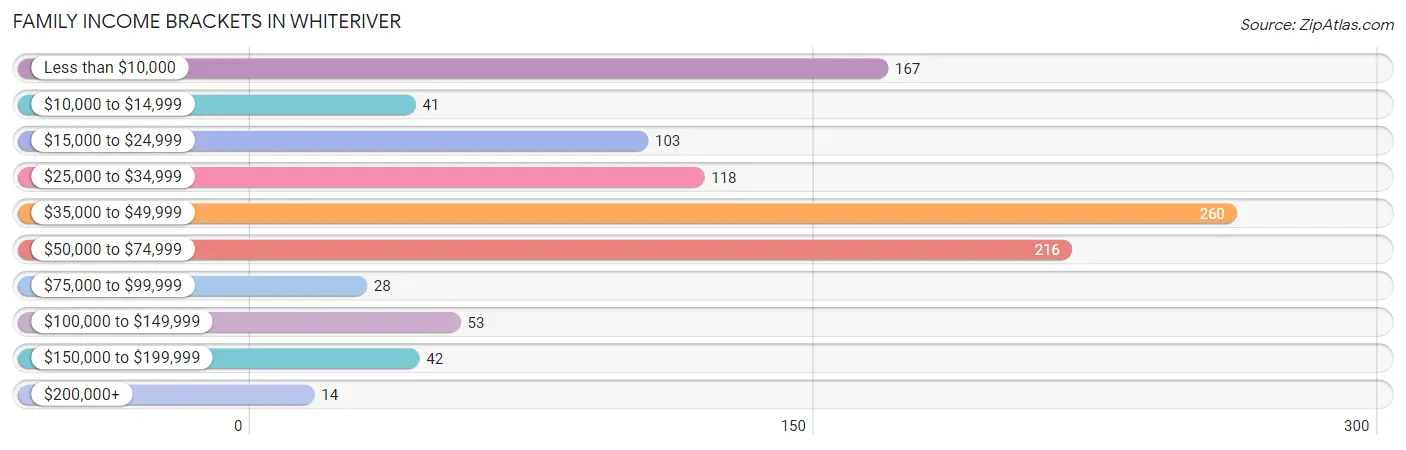
Family Income Brackets in Whiteriver
According to the Whiteriver family income data, there are 260 families falling into the $35,000 to $49,999 income range, which is the most common income bracket and makes up 24.9% of all families. Conversely, the $200,000+ income bracket is the least frequent group with only 14 families (1.3%) belonging to this category.
| Income Bracket | # Families | % Families |
| Less than $10,000 | 167 | 16.0% |
| $10,000 to $14,999 | 41 | 3.9% |
| $15,000 to $24,999 | 103 | 9.9% |
| $25,000 to $34,999 | 118 | 11.3% |
| $35,000 to $49,999 | 260 | 25.0% |
| $50,000 to $74,999 | 216 | 20.7% |
| $75,000 to $99,999 | 28 | 2.7% |
| $100,000 to $149,999 | 53 | 5.1% |
| $150,000 to $199,999 | 42 | 4.0% |
| $200,000+ | 14 | 1.3% |
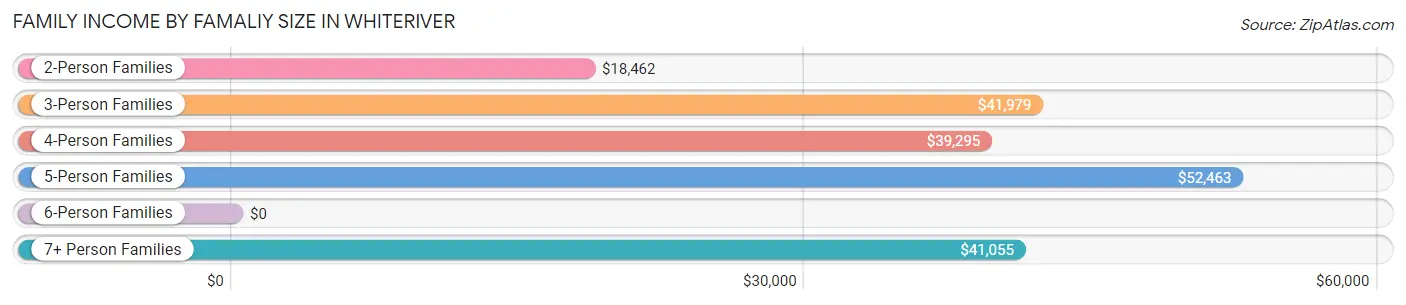
Family Income by Famaliy Size in Whiteriver
5-person families (177 | 17.0%) account for the highest median family income in Whiteriver with $52,463 per family, while 3-person families (206 | 19.8%) have the highest median income of $13,993 per family member.
| Income Bracket | # Families | Median Income |
| 2-Person Families | 290 (27.8%) | $18,462 |
| 3-Person Families | 206 (19.8%) | $41,979 |
| 4-Person Families | 216 (20.7%) | $39,295 |
| 5-Person Families | 177 (17.0%) | $52,463 |
| 6-Person Families | 48 (4.6%) | $0 |
| 7+ Person Families | 105 (10.1%) | $41,055 |
| Total | 1,042 (100.0%) | $39,263 |
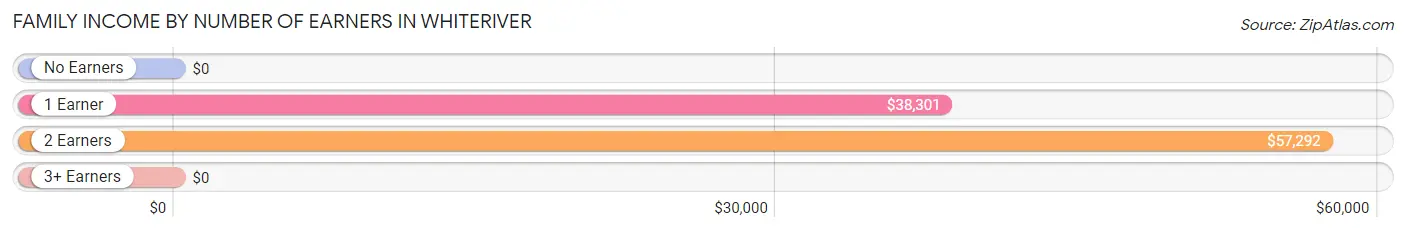
Family Income by Number of Earners in Whiteriver
| Number of Earners | # Families | Median Income |
| No Earners | 282 (27.1%) | $0 |
| 1 Earner | 460 (44.2%) | $38,301 |
| 2 Earners | 276 (26.5%) | $57,292 |
| 3+ Earners | 24 (2.3%) | $0 |
| Total | 1,042 (100.0%) | $39,263 |
Household Income in Whiteriver
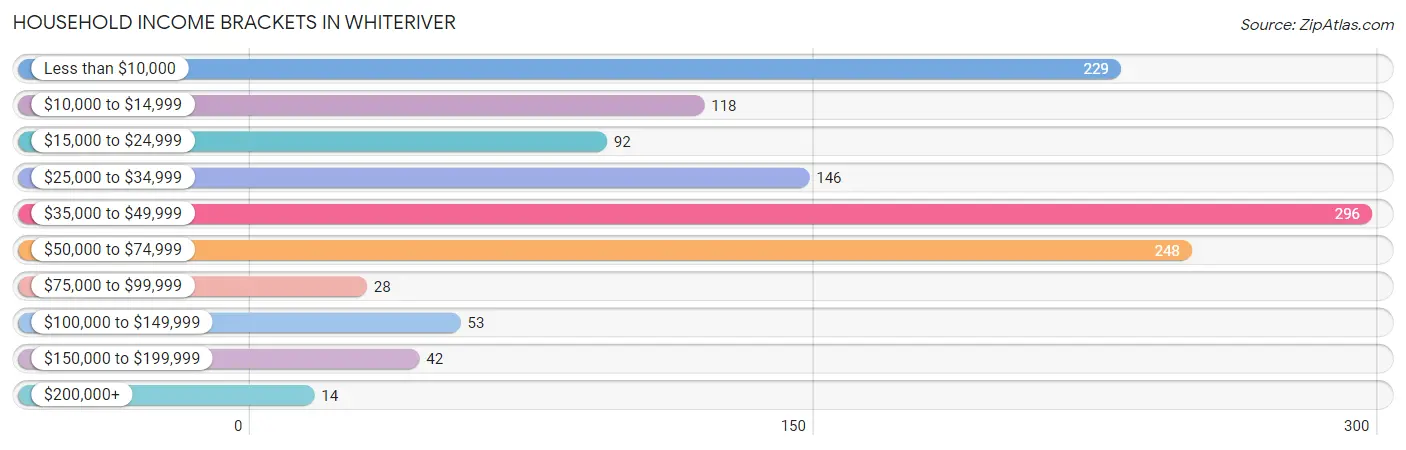
Household Income Brackets in Whiteriver
With 296 households falling in the category, the $35,000 to $49,999 income range is the most frequent in Whiteriver, accounting for 23.4% of all households. In contrast, only 14 households (1.1%) fall into the $200,000+ income bracket, making it the least populous group.
| Income Bracket | # Households | % Households |
| Less than $10,000 | 229 | 18.1% |
| $10,000 to $14,999 | 118 | 9.3% |
| $15,000 to $24,999 | 92 | 7.3% |
| $25,000 to $34,999 | 146 | 11.5% |
| $35,000 to $49,999 | 296 | 23.4% |
| $50,000 to $74,999 | 248 | 19.6% |
| $75,000 to $99,999 | 28 | 2.2% |
| $100,000 to $149,999 | 53 | 4.2% |
| $150,000 to $199,999 | 42 | 3.3% |
| $200,000+ | 14 | 1.1% |
Household Income by Householder Age in Whiteriver
The median household income in Whiteriver is $37,165, with the highest median household income of $47,933 found in the 65+ years age bracket for the primary householder. A total of 287 households (22.7%) fall into this category. Meanwhile, the 15 to 24 years age bracket for the primary householder has the lowest median household income of $0, with 38 households (3.0%) in this group.
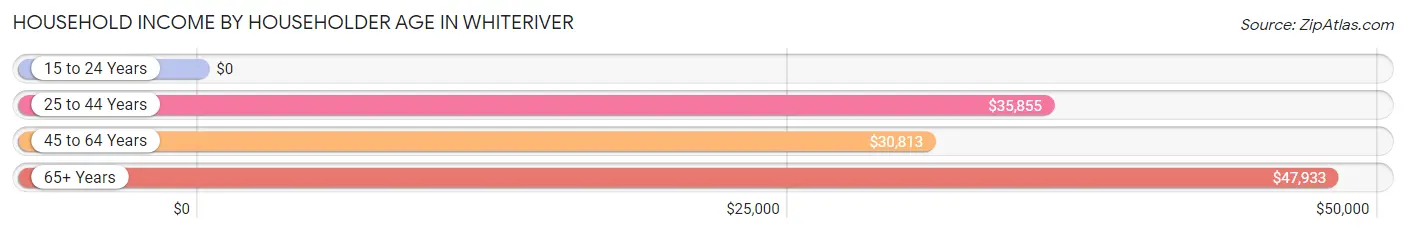
| Income Bracket | # Households | Median Income |
| 15 to 24 Years | 38 (3.0%) | $0 |
| 25 to 44 Years | 433 (34.2%) | $35,855 |
| 45 to 64 Years | 509 (40.2%) | $30,813 |
| 65+ Years | 287 (22.7%) | $47,933 |
| Total | 1,267 (100.0%) | $37,165 |
Poverty in Whiteriver
Income Below Poverty by Sex and Age in Whiteriver
With 44.5% poverty level for males and 32.2% for females among the residents of Whiteriver, 55 to 64 year old males and 6 to 11 year old females are the most vulnerable to poverty, with 145 males (78.0%) and 89 females (55.3%) in their respective age groups living below the poverty level.
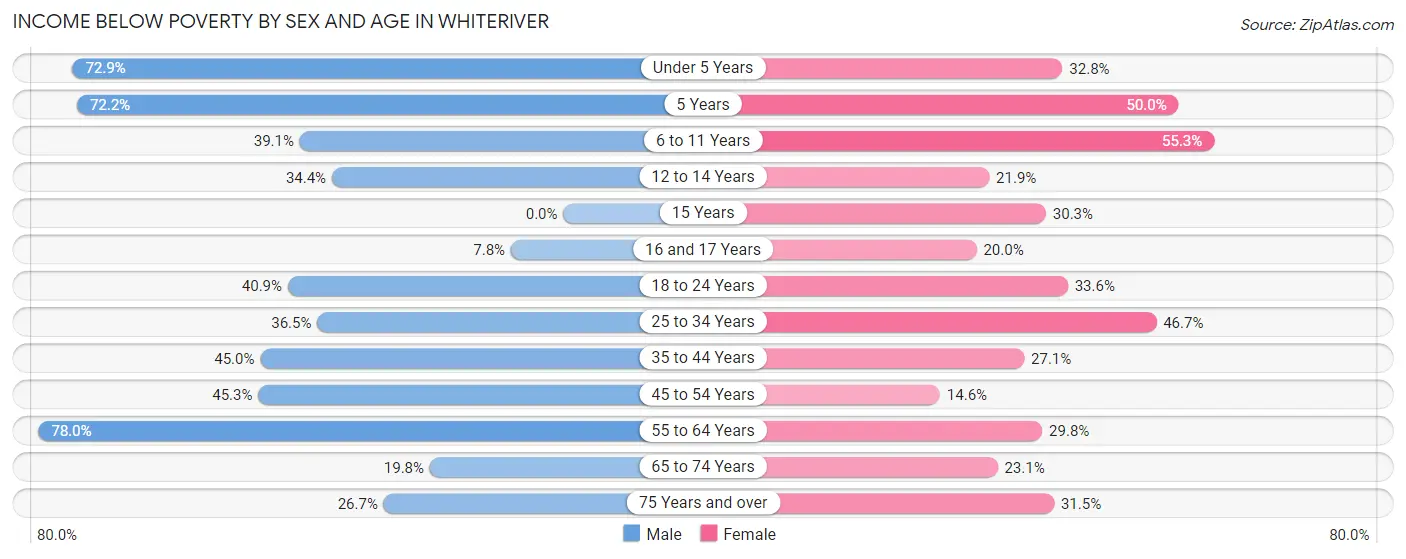
| Age Bracket | Male | Female |
| Under 5 Years | 121 (72.9%) | 38 (32.8%) |
| 5 Years | 39 (72.2%) | 16 (50.0%) |
| 6 to 11 Years | 90 (39.1%) | 89 (55.3%) |
| 12 to 14 Years | 67 (34.4%) | 35 (21.9%) |
| 15 Years | 0 (0.0%) | 20 (30.3%) |
| 16 and 17 Years | 7 (7.8%) | 8 (20.0%) |
| 18 to 24 Years | 117 (40.9%) | 51 (33.6%) |
| 25 to 34 Years | 57 (36.5%) | 155 (46.7%) |
| 35 to 44 Years | 180 (45.0%) | 72 (27.1%) |
| 45 to 54 Years | 106 (45.3%) | 29 (14.6%) |
| 55 to 64 Years | 145 (78.0%) | 72 (29.7%) |
| 65 to 74 Years | 22 (19.8%) | 43 (23.1%) |
| 75 Years and over | 8 (26.7%) | 23 (31.5%) |
| Total | 959 (44.5%) | 651 (32.2%) |
Income Above Poverty by Sex and Age in Whiteriver
According to the poverty statistics in Whiteriver, males aged 15 years and females aged 45 to 54 years are the age groups that are most secure financially, with 100.0% of males and 85.4% of females in these age groups living above the poverty line.
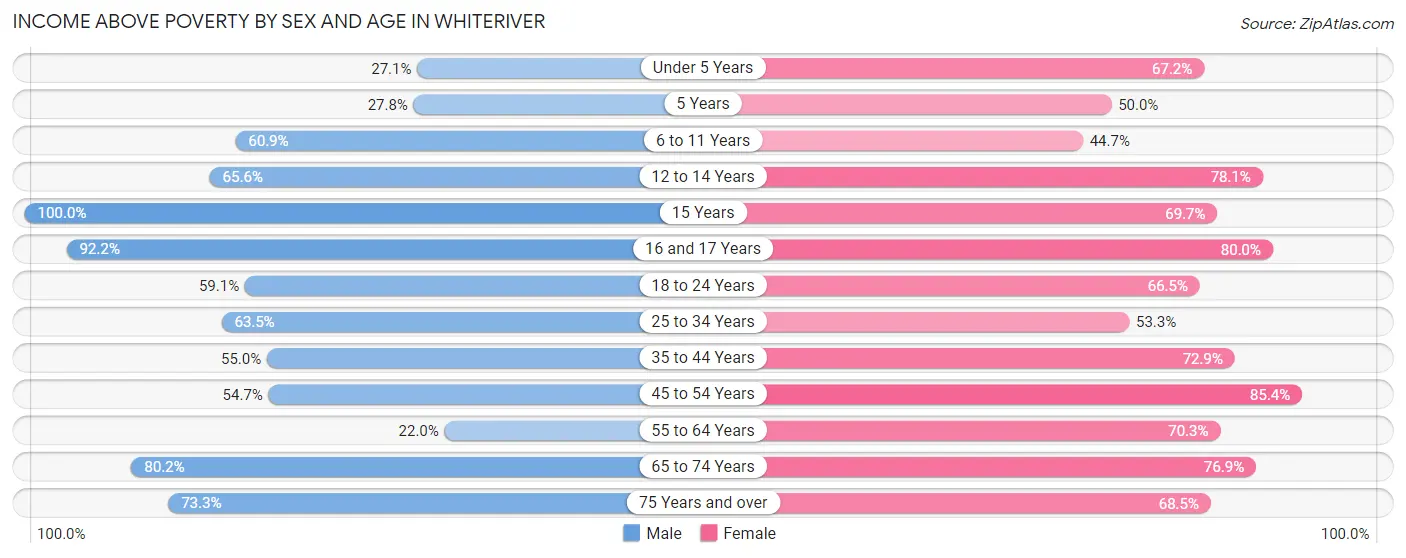
| Age Bracket | Male | Female |
| Under 5 Years | 45 (27.1%) | 78 (67.2%) |
| 5 Years | 15 (27.8%) | 16 (50.0%) |
| 6 to 11 Years | 140 (60.9%) | 72 (44.7%) |
| 12 to 14 Years | 128 (65.6%) | 125 (78.1%) |
| 15 Years | 15 (100.0%) | 46 (69.7%) |
| 16 and 17 Years | 83 (92.2%) | 32 (80.0%) |
| 18 to 24 Years | 169 (59.1%) | 101 (66.4%) |
| 25 to 34 Years | 99 (63.5%) | 177 (53.3%) |
| 35 to 44 Years | 220 (55.0%) | 194 (72.9%) |
| 45 to 54 Years | 128 (54.7%) | 170 (85.4%) |
| 55 to 64 Years | 41 (22.0%) | 170 (70.3%) |
| 65 to 74 Years | 89 (80.2%) | 143 (76.9%) |
| 75 Years and over | 22 (73.3%) | 50 (68.5%) |
| Total | 1,194 (55.5%) | 1,374 (67.8%) |
Income Below Poverty Among Married-Couple Families in Whiteriver
The poverty statistics for married-couple families in Whiteriver show that 28.4% or 150 of the total 528 families live below the poverty line. Families with 5 or more children have the highest poverty rate of 65.0%, comprising of 39 families. On the other hand, families with no children have the lowest poverty rate of 9.1%, which includes 13 families.
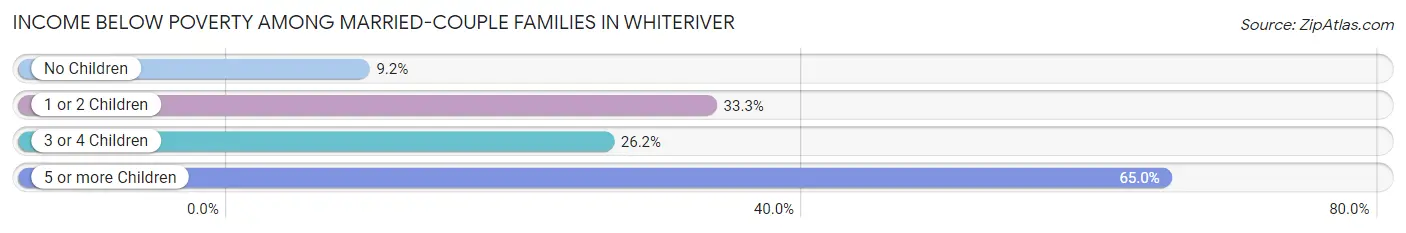
| Children | Above Poverty | Below Poverty |
| No Children | 129 (90.8%) | 13 (9.1%) |
| 1 or 2 Children | 118 (66.7%) | 59 (33.3%) |
| 3 or 4 Children | 110 (73.8%) | 39 (26.2%) |
| 5 or more Children | 21 (35.0%) | 39 (65.0%) |
| Total | 378 (71.6%) | 150 (28.4%) |
Income Below Poverty Among Single-Parent Households in Whiteriver
According to the poverty data in Whiteriver, 90.7% or 137 single-father households and 26.5% or 96 single-mother households are living below the poverty line. Among single-father households, those with 1 or 2 children have the highest poverty rate, with 19 households (100.0%) experiencing poverty. Likewise, among single-mother households, those with 3 or 4 children have the highest poverty rate, with 50 households (54.9%) falling below the poverty line.
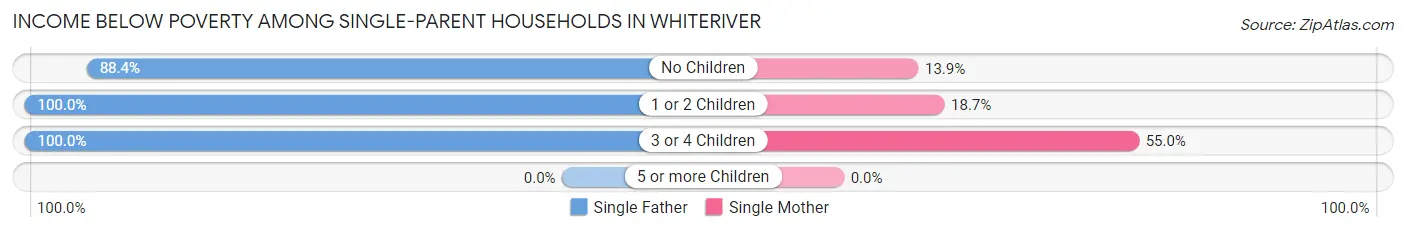
| Children | Single Father | Single Mother |
| No Children | 107 (88.4%) | 14 (13.9%) |
| 1 or 2 Children | 19 (100.0%) | 32 (18.7%) |
| 3 or 4 Children | 11 (100.0%) | 50 (54.9%) |
| 5 or more Children | 0 (0.0%) | 0 (0.0%) |
| Total | 137 (90.7%) | 96 (26.5%) |
Income Below Poverty Among Married-Couple vs Single-Parent Households in Whiteriver
The poverty data for Whiteriver shows that 150 of the married-couple family households (28.4%) and 233 of the single-parent households (45.3%) are living below the poverty level. Within the married-couple family households, those with 5 or more children have the highest poverty rate, with 39 households (65.0%) falling below the poverty line. Among the single-parent households, those with 3 or 4 children have the highest poverty rate, with 61 household (59.8%) living below poverty.
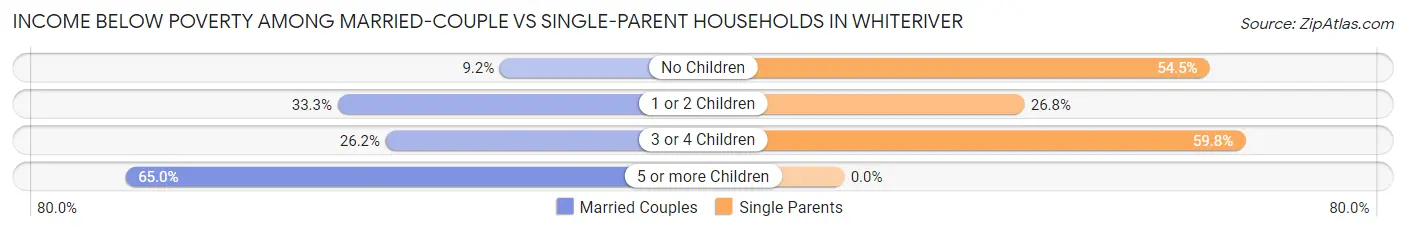
| Children | Married-Couple Families | Single-Parent Households |
| No Children | 13 (9.1%) | 121 (54.5%) |
| 1 or 2 Children | 59 (33.3%) | 51 (26.8%) |
| 3 or 4 Children | 39 (26.2%) | 61 (59.8%) |
| 5 or more Children | 39 (65.0%) | 0 (0.0%) |
| Total | 150 (28.4%) | 233 (45.3%) |
Race in Whiteriver
The most populous races in Whiteriver are Native / Alaskan (3,989 | 93.1%), Two or more Races (94 | 2.2%), and Hispanic or Latino (93 | 2.2%).
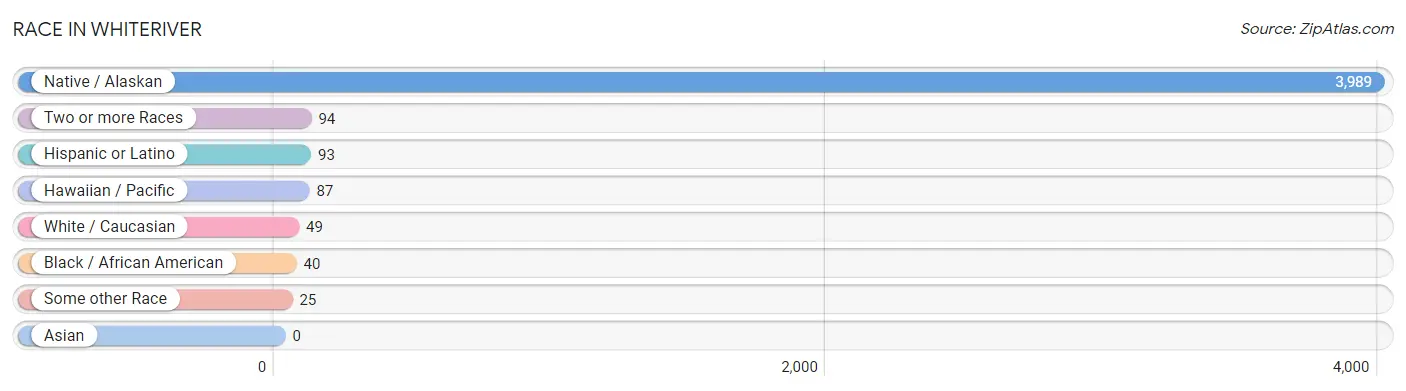
| Race | # Population | % Population |
| Asian | 0 | 0.0% |
| Black / African American | 40 | 0.9% |
| Hawaiian / Pacific | 87 | 2.0% |
| Hispanic or Latino | 93 | 2.2% |
| Native / Alaskan | 3,989 | 93.1% |
| White / Caucasian | 49 | 1.1% |
| Two or more Races | 94 | 2.2% |
| Some other Race | 25 | 0.6% |
| Total | 4,284 | 100.0% |
Ancestry in Whiteriver
The most populous ancestries reported in Whiteriver are Apache (3,876 | 90.5%), Navajo (122 | 2.9%), Tongan (87 | 2.0%), Mexican (77 | 1.8%), and Cherokee (55 | 1.3%), together accounting for 98.4% of all Whiteriver residents.
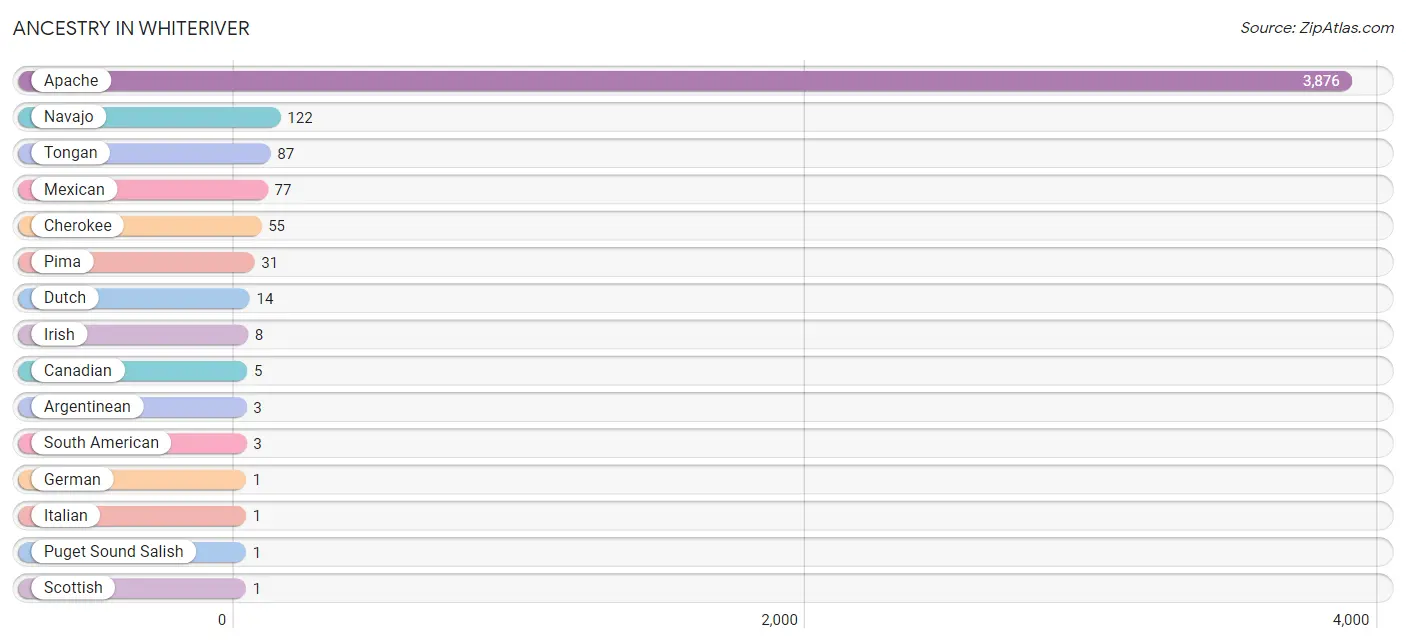
| Ancestry | # Population | % Population |
| Apache | 3,876 | 90.5% |
| Argentinean | 3 | 0.1% |
| Canadian | 5 | 0.1% |
| Cherokee | 55 | 1.3% |
| Dutch | 14 | 0.3% |
| German | 1 | 0.0% |
| Irish | 8 | 0.2% |
| Italian | 1 | 0.0% |
| Mexican | 77 | 1.8% |
| Navajo | 122 | 2.9% |
| Pima | 31 | 0.7% |
| Puget Sound Salish | 1 | 0.0% |
| Scottish | 1 | 0.0% |
| South American | 3 | 0.1% |
| Tohono O'Odham | 1 | 0.0% |
| Tongan | 87 | 2.0% | View All 16 Rows |
Immigrants in Whiteriver
The most numerous immigrant groups reported in Whiteriver came from Eastern Europe (12 | 0.3%), Europe (12 | 0.3%), Ukraine (12 | 0.3%), Latin America (4 | 0.1%), and Caribbean (3 | 0.1%), together accounting for 1.0% of all Whiteriver residents.
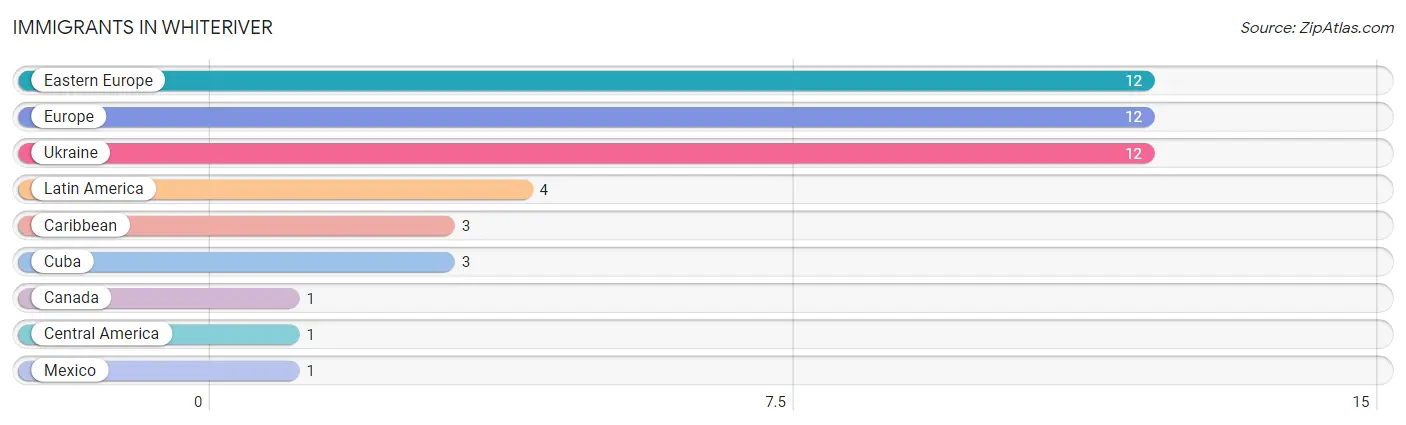
| Immigration Origin | # Population | % Population |
| Canada | 1 | 0.0% |
| Caribbean | 3 | 0.1% |
| Central America | 1 | 0.0% |
| Cuba | 3 | 0.1% |
| Eastern Europe | 12 | 0.3% |
| Europe | 12 | 0.3% |
| Latin America | 4 | 0.1% |
| Mexico | 1 | 0.0% |
| Ukraine | 12 | 0.3% | View All 9 Rows |
Sex and Age in Whiteriver
Sex and Age in Whiteriver
The most populous age groups in Whiteriver are 5 to 9 Years (255 | 11.5%) for men and 10 to 14 Years (222 | 10.7%) for women.
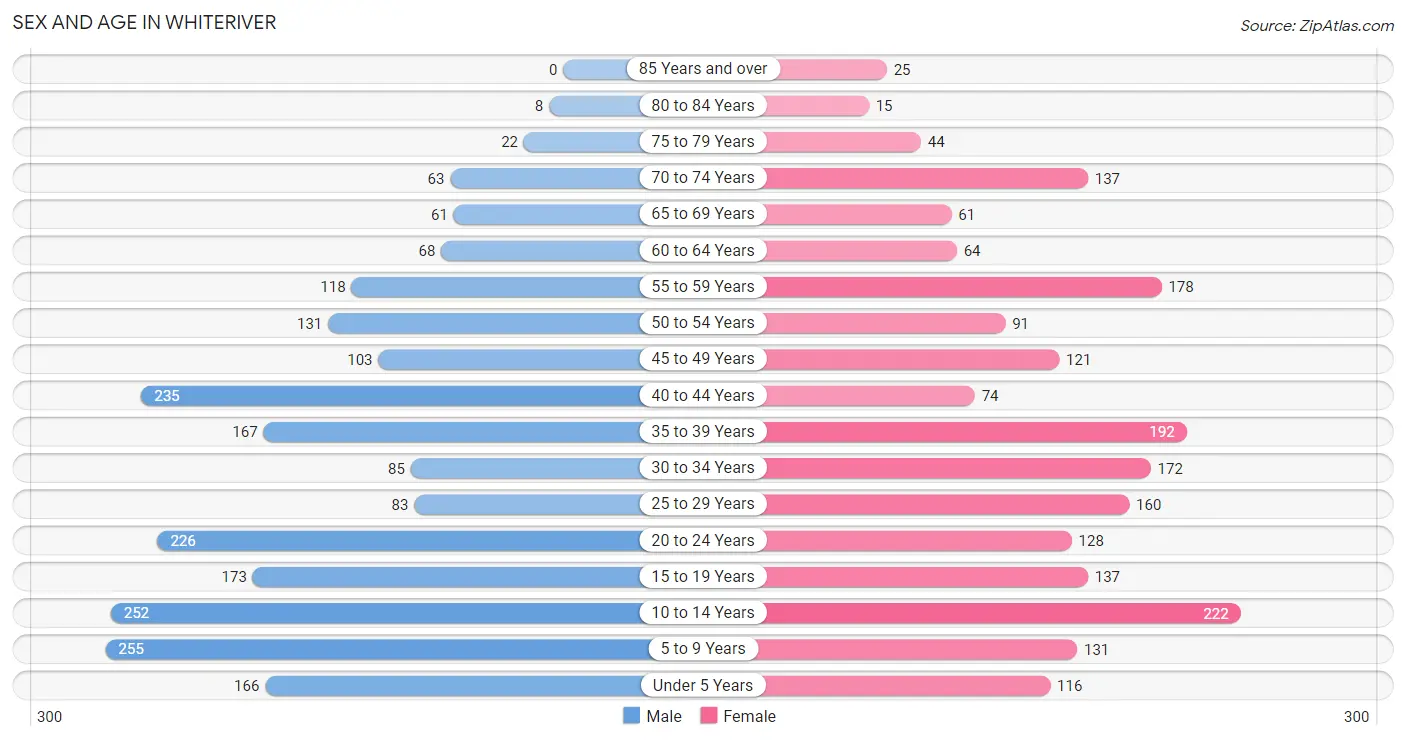
| Age Bracket | Male | Female |
| Under 5 Years | 166 (7.5%) | 116 (5.6%) |
| 5 to 9 Years | 255 (11.5%) | 131 (6.3%) |
| 10 to 14 Years | 252 (11.4%) | 222 (10.7%) |
| 15 to 19 Years | 173 (7.8%) | 137 (6.6%) |
| 20 to 24 Years | 226 (10.2%) | 128 (6.2%) |
| 25 to 29 Years | 83 (3.7%) | 160 (7.7%) |
| 30 to 34 Years | 85 (3.8%) | 172 (8.3%) |
| 35 to 39 Years | 167 (7.5%) | 192 (9.3%) |
| 40 to 44 Years | 235 (10.6%) | 74 (3.6%) |
| 45 to 49 Years | 103 (4.6%) | 121 (5.9%) |
| 50 to 54 Years | 131 (5.9%) | 91 (4.4%) |
| 55 to 59 Years | 118 (5.3%) | 178 (8.6%) |
| 60 to 64 Years | 68 (3.1%) | 64 (3.1%) |
| 65 to 69 Years | 61 (2.8%) | 61 (2.9%) |
| 70 to 74 Years | 63 (2.8%) | 137 (6.6%) |
| 75 to 79 Years | 22 (1.0%) | 44 (2.1%) |
| 80 to 84 Years | 8 (0.4%) | 15 (0.7%) |
| 85 Years and over | 0 (0.0%) | 25 (1.2%) |
| Total | 2,216 (100.0%) | 2,068 (100.0%) |
Families and Households in Whiteriver
Median Family Size in Whiteriver
The median family size in Whiteriver is 3.67 persons per family, with married-couple families (528 | 50.7%) accounting for the largest median family size of 4.39 persons per family. On the other hand, single male/father families (151 | 14.5%) represent the smallest median family size with 2.30 persons per family.
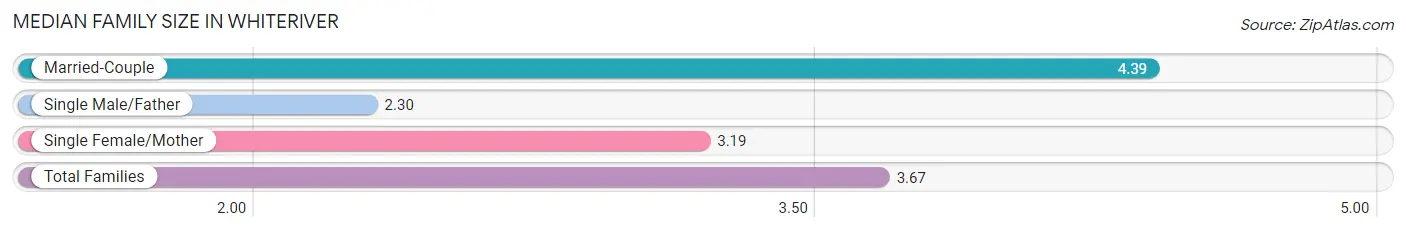
| Family Type | # Families | Family Size |
| Married-Couple | 528 (50.7%) | 4.39 |
| Single Male/Father | 151 (14.5%) | 2.30 |
| Single Female/Mother | 363 (34.8%) | 3.19 |
| Total Families | 1,042 (100.0%) | 3.67 |
Median Household Size in Whiteriver
The median household size in Whiteriver is 3.29 persons per household, with married-couple households (528 | 41.7%) accounting for the largest median household size of 4.39 persons per household. non-family households (225 | 17.8%) represent the smallest median household size with 1.17 persons per household.
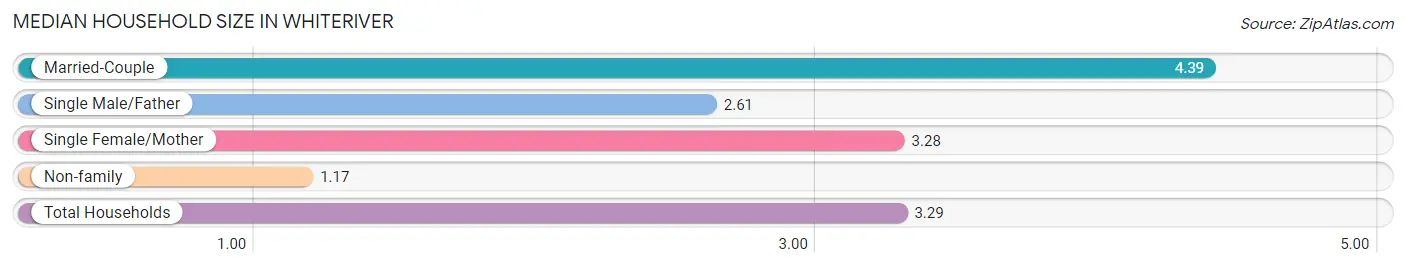
| Household Type | # Households | Household Size |
| Married-Couple | 528 (41.7%) | 4.39 |
| Single Male/Father | 151 (11.9%) | 2.61 |
| Single Female/Mother | 363 (28.6%) | 3.28 |
| Non-family | 225 (17.8%) | 1.17 |
| Total Households | 1,267 (100.0%) | 3.29 |
Household Size by Marriage Status in Whiteriver
Out of a total of 1,267 households in Whiteriver, 1,042 (82.2%) are family households, while 225 (17.8%) are nonfamily households. The most numerous type of family households are 2-person households, comprising 271, and the most common type of nonfamily households are 1-person households, comprising 189.
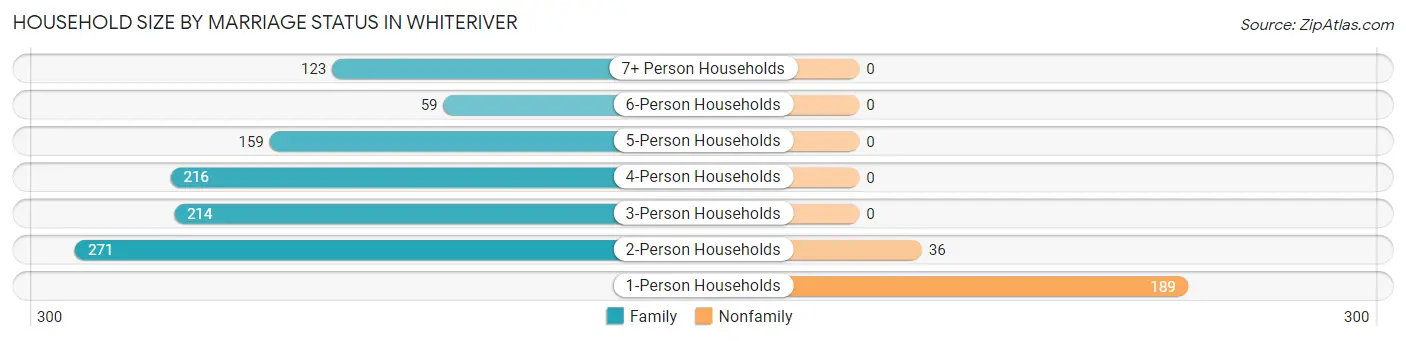
| Household Size | Family Households | Nonfamily Households |
| 1-Person Households | - | 189 (14.9%) |
| 2-Person Households | 271 (21.4%) | 36 (2.8%) |
| 3-Person Households | 214 (16.9%) | 0 (0.0%) |
| 4-Person Households | 216 (17.1%) | 0 (0.0%) |
| 5-Person Households | 159 (12.6%) | 0 (0.0%) |
| 6-Person Households | 59 (4.7%) | 0 (0.0%) |
| 7+ Person Households | 123 (9.7%) | 0 (0.0%) |
| Total | 1,042 (82.2%) | 225 (17.8%) |
Female Fertility in Whiteriver
Fertility by Age in Whiteriver
Average fertility rate in Whiteriver is 127.0 births per 1,000 women. Women in the age bracket of 20 to 34 years have the highest fertility rate with 196.0 births per 1,000 women. Women in the age bracket of 20 to 34 years acount for 68.7% of all women with births.
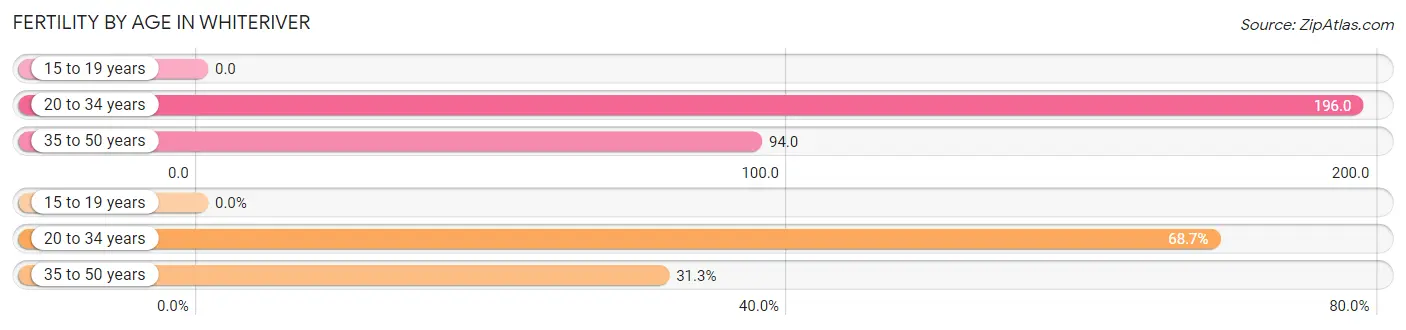
| Age Bracket | Women with Births | Births / 1,000 Women |
| 15 to 19 years | 0 (0.0%) | 0.0 |
| 20 to 34 years | 90 (68.7%) | 196.0 |
| 35 to 50 years | 41 (31.3%) | 94.0 |
| Total | 131 (100.0%) | 127.0 |
Fertility by Age by Marriage Status in Whiteriver
52.7% of women with births (131) in Whiteriver are married. The highest percentage of unmarried women with births falls into 20 to 34 years age bracket with 68.9% of them unmarried at the time of birth, while the lowest percentage of unmarried women with births belong to 35 to 50 years age bracket with 0.0% of them unmarried.
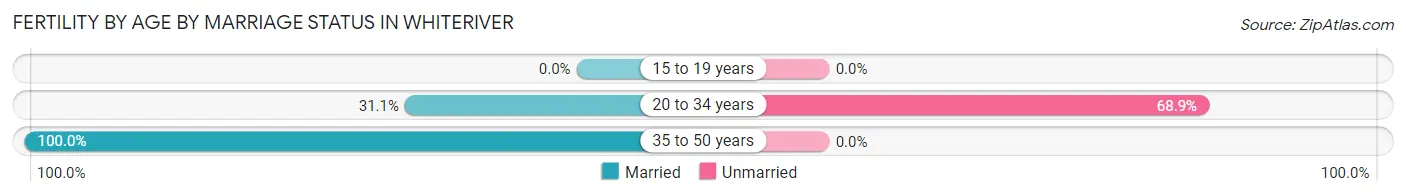
| Age Bracket | Married | Unmarried |
| 15 to 19 years | 0 (0.0%) | 0 (0.0%) |
| 20 to 34 years | 28 (31.1%) | 62 (68.9%) |
| 35 to 50 years | 41 (100.0%) | 0 (0.0%) |
| Total | 69 (52.7%) | 62 (47.3%) |
Fertility by Education in Whiteriver
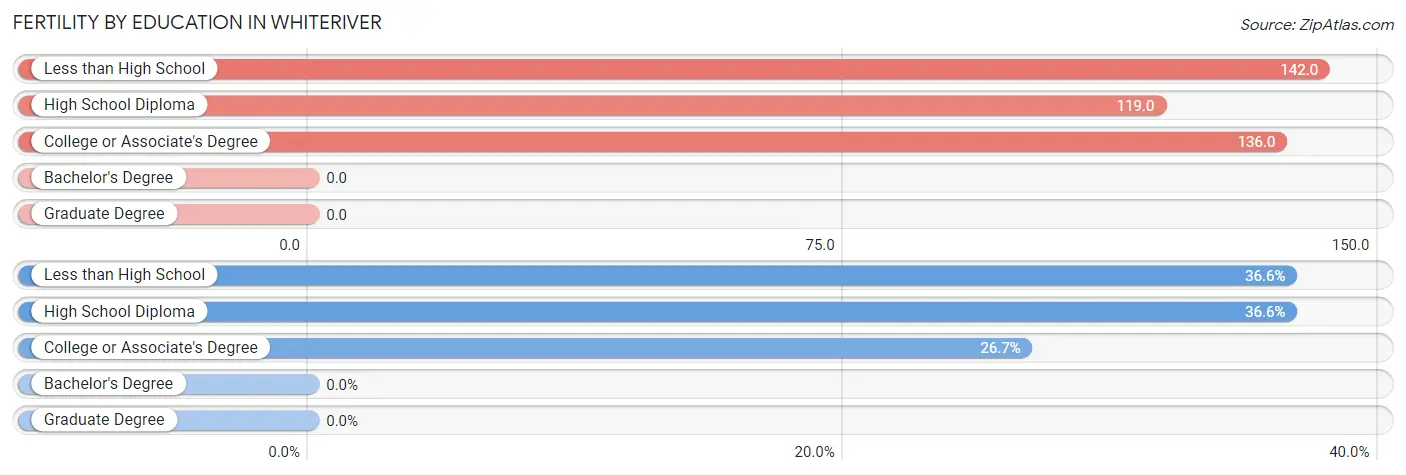
| Educational Attainment | Women with Births | Births / 1,000 Women |
| Less than High School | 48 (36.6%) | 142.0 |
| High School Diploma | 48 (36.6%) | 119.0 |
| College or Associate's Degree | 35 (26.7%) | 136.0 |
| Bachelor's Degree | 0 (0.0%) | 0.0 |
| Graduate Degree | 0 (0.0%) | 0.0 |
| Total | 131 (100.0%) | 127.0 |
Fertility by Education by Marriage Status in Whiteriver
47.3% of women with births in Whiteriver are unmarried. Women with the educational attainment of less than high school are most likely to be married with 100.0% of them married at childbirth, while women with the educational attainment of college or associate's degree are least likely to be married with 100.0% of them unmarried at childbirth.
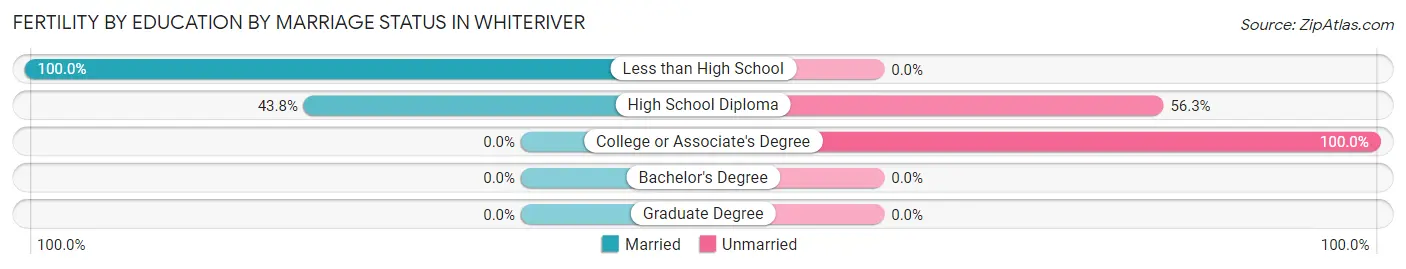
| Educational Attainment | Married | Unmarried |
| Less than High School | 48 (100.0%) | 0 (0.0%) |
| High School Diploma | 21 (43.8%) | 27 (56.2%) |
| College or Associate's Degree | 0 (0.0%) | 35 (100.0%) |
| Bachelor's Degree | 0 (0.0%) | 0 (0.0%) |
| Graduate Degree | 0 (0.0%) | 0 (0.0%) |
| Total | 69 (52.7%) | 62 (47.3%) |
Employment Characteristics in Whiteriver
Employment by Class of Employer in Whiteriver
Among the 1,035 employed individuals in Whiteriver, local government employees (405 | 39.1%), private company employees (369 | 35.6%), and federal government employees (137 | 13.2%) make up the most common classes of employment.
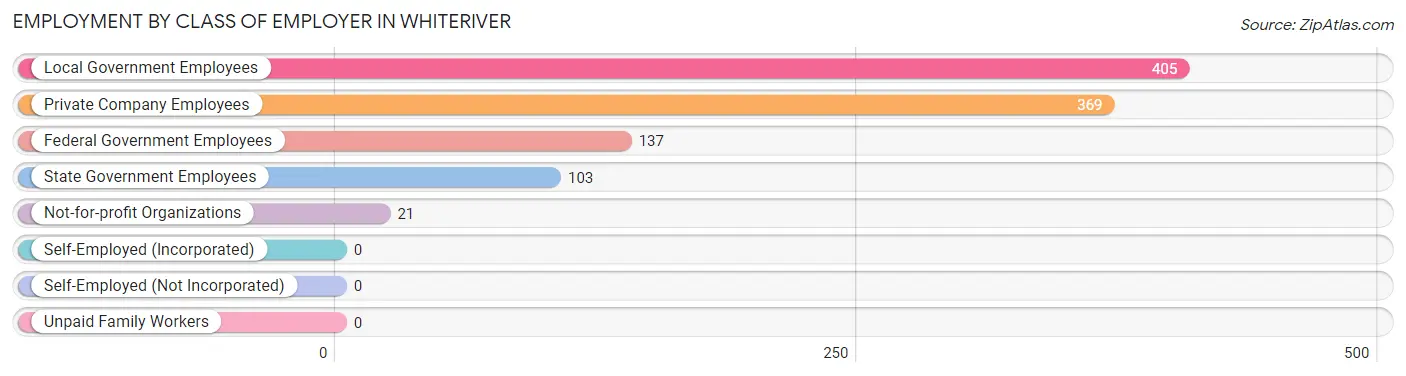
| Employer Class | # Employees | % Employees |
| Private Company Employees | 369 | 35.6% |
| Self-Employed (Incorporated) | 0 | 0.0% |
| Self-Employed (Not Incorporated) | 0 | 0.0% |
| Not-for-profit Organizations | 21 | 2.0% |
| Local Government Employees | 405 | 39.1% |
| State Government Employees | 103 | 10.0% |
| Federal Government Employees | 137 | 13.2% |
| Unpaid Family Workers | 0 | 0.0% |
| Total | 1,035 | 100.0% |
Employment Status by Age in Whiteriver
According to the labor force statistics for Whiteriver, out of the total population over 16 years of age (3,049), 37.4% or 1,140 individuals are in the labor force, with 9.3% or 106 of them unemployed. The age group with the highest labor force participation rate is 45 to 54 years, with 54.7% or 244 individuals in the labor force. Within the labor force, the 45 to 54 years age range has the highest percentage of unemployed individuals, with 24.2% or 59 of them being unemployed.
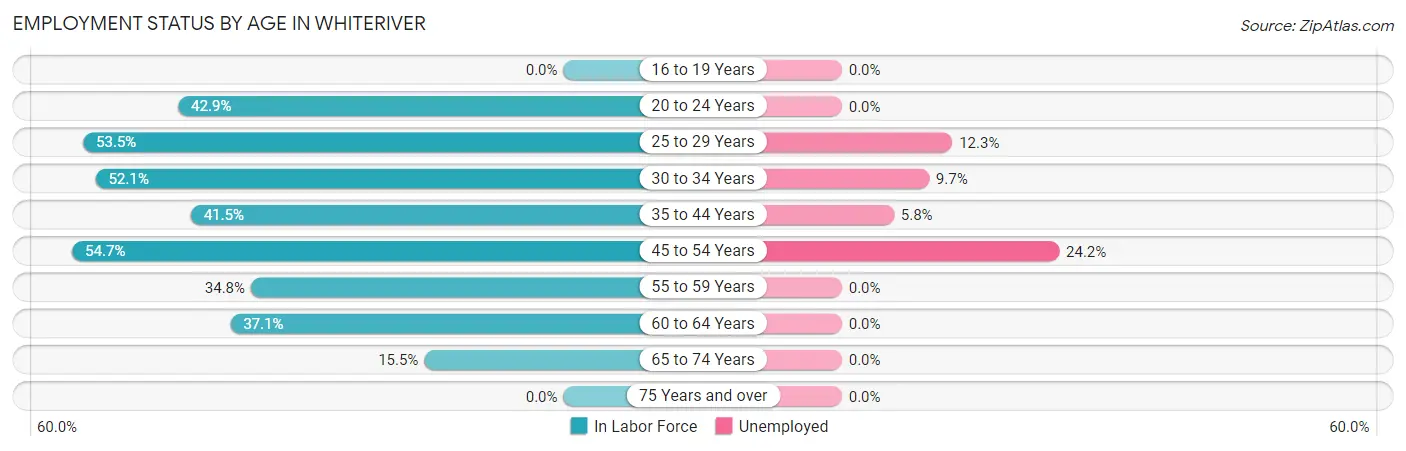
| Age Bracket | In Labor Force | Unemployed |
| 16 to 19 Years | 0 (0.0%) | 0 (0.0%) |
| 20 to 24 Years | 152 (42.9%) | 0 (0.0%) |
| 25 to 29 Years | 130 (53.5%) | 16 (12.3%) |
| 30 to 34 Years | 134 (52.1%) | 13 (9.7%) |
| 35 to 44 Years | 277 (41.5%) | 16 (5.8%) |
| 45 to 54 Years | 244 (54.7%) | 59 (24.2%) |
| 55 to 59 Years | 103 (34.8%) | 0 (0.0%) |
| 60 to 64 Years | 49 (37.1%) | 0 (0.0%) |
| 65 to 74 Years | 50 (15.5%) | 0 (0.0%) |
| 75 Years and over | 0 (0.0%) | 0 (0.0%) |
| Total | 1,140 (37.4%) | 106 (9.3%) |
Employment Status by Educational Attainment in Whiteriver
According to labor force statistics for Whiteriver, 45.9% of individuals (937) out of the total population between 25 and 64 years of age (2,042) are in the labor force, with 11.1% or 104 of them being unemployed. The group with the highest labor force participation rate are those with the educational attainment of bachelor's degree or higher, with 82.9% or 87 individuals in the labor force. Within the labor force, individuals with high school diploma education have the highest percentage of unemployment, with 18.8% or 59 of them being unemployed.
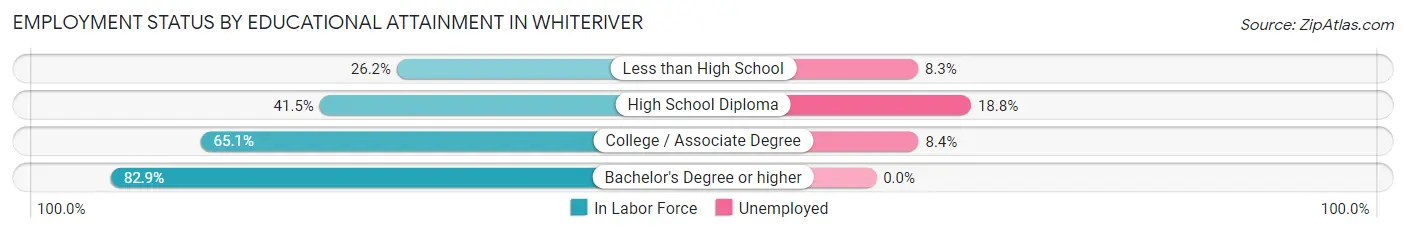
| Educational Attainment | In Labor Force | Unemployed |
| Less than High School | 156 (26.2%) | 49 (8.3%) |
| High School Diploma | 314 (41.5%) | 142 (18.8%) |
| College / Associate Degree | 380 (65.1%) | 49 (8.4%) |
| Bachelor's Degree or higher | 87 (82.9%) | 0 (0.0%) |
| Total | 937 (45.9%) | 227 (11.1%) |
Employment Occupations by Sex in Whiteriver
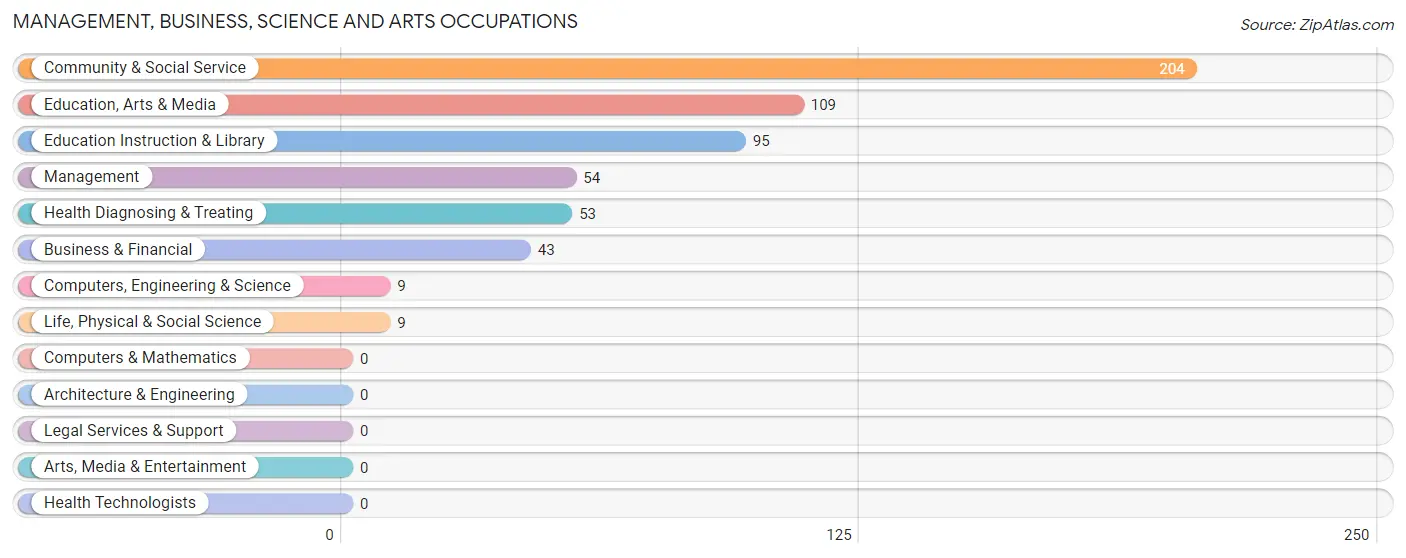
Management, Business, Science and Arts Occupations
The most common Management, Business, Science and Arts occupations in Whiteriver are Community & Social Service (204 | 20.2%), Education, Arts & Media (109 | 10.8%), Education Instruction & Library (95 | 9.4%), Management (54 | 5.3%), and Health Diagnosing & Treating (53 | 5.2%).
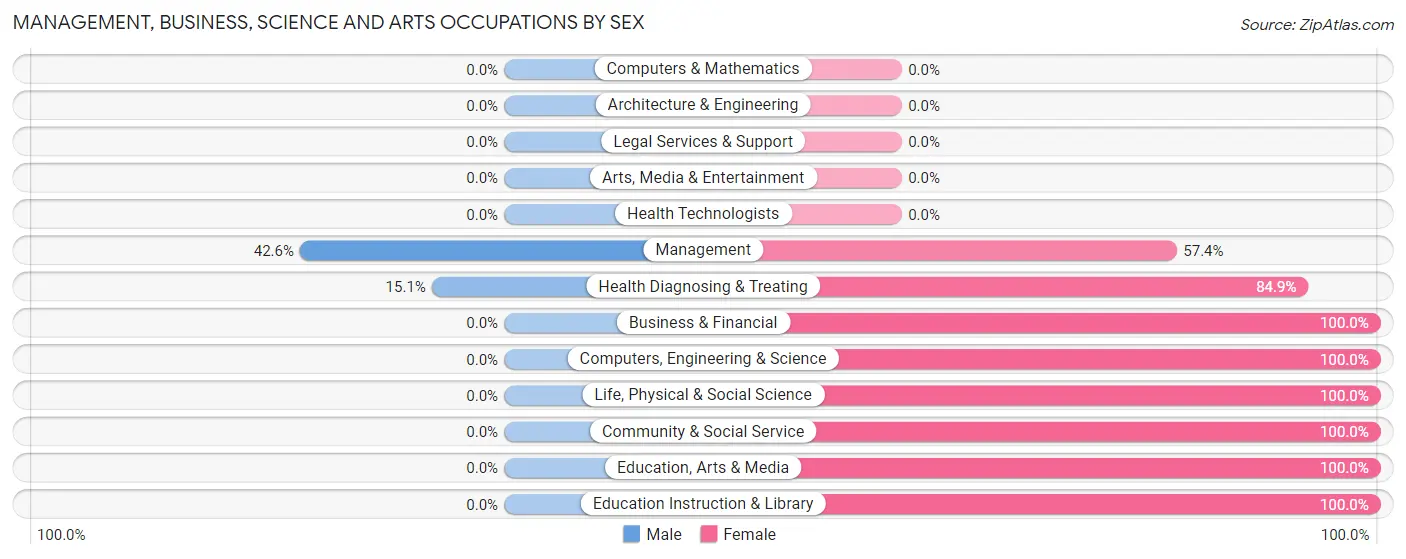
Management, Business, Science and Arts Occupations by Sex
Within the Management, Business, Science and Arts occupations in Whiteriver, the most male-oriented occupations are Management (42.6%), and Health Diagnosing & Treating (15.1%), while the most female-oriented occupations are Business & Financial (100.0%), Computers, Engineering & Science (100.0%), and Life, Physical & Social Science (100.0%).
| Occupation | Male | Female |
| Management | 23 (42.6%) | 31 (57.4%) |
| Business & Financial | 0 (0.0%) | 43 (100.0%) |
| Computers, Engineering & Science | 0 (0.0%) | 9 (100.0%) |
| Computers & Mathematics | 0 (0.0%) | 0 (0.0%) |
| Architecture & Engineering | 0 (0.0%) | 0 (0.0%) |
| Life, Physical & Social Science | 0 (0.0%) | 9 (100.0%) |
| Community & Social Service | 0 (0.0%) | 204 (100.0%) |
| Education, Arts & Media | 0 (0.0%) | 109 (100.0%) |
| Legal Services & Support | 0 (0.0%) | 0 (0.0%) |
| Education Instruction & Library | 0 (0.0%) | 95 (100.0%) |
| Arts, Media & Entertainment | 0 (0.0%) | 0 (0.0%) |
| Health Diagnosing & Treating | 8 (15.1%) | 45 (84.9%) |
| Health Technologists | 0 (0.0%) | 0 (0.0%) |
| Total (Category) | 31 (8.5%) | 332 (91.5%) |
| Total (Overall) | 407 (40.3%) | 604 (59.7%) |
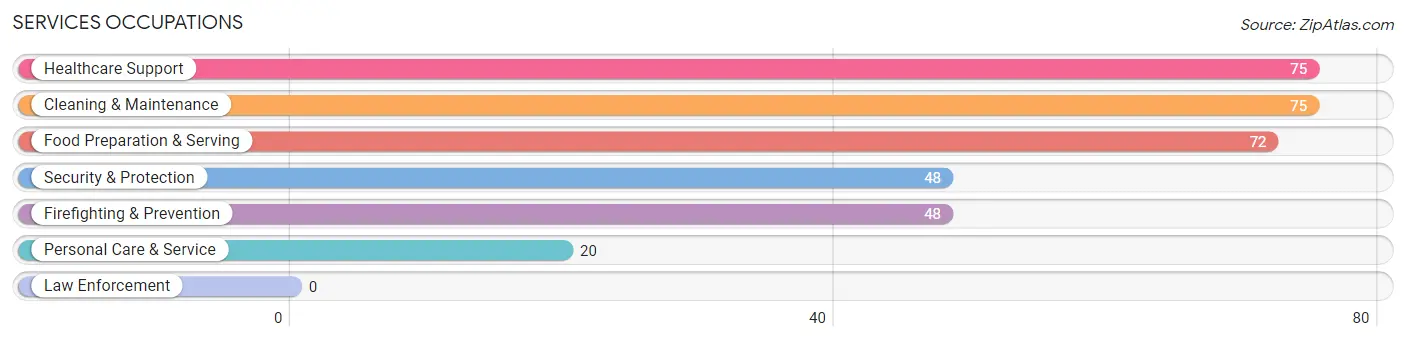
Services Occupations
The most common Services occupations in Whiteriver are Healthcare Support (75 | 7.4%), Cleaning & Maintenance (75 | 7.4%), Food Preparation & Serving (72 | 7.1%), Security & Protection (48 | 4.8%), and Firefighting & Prevention (48 | 4.8%).
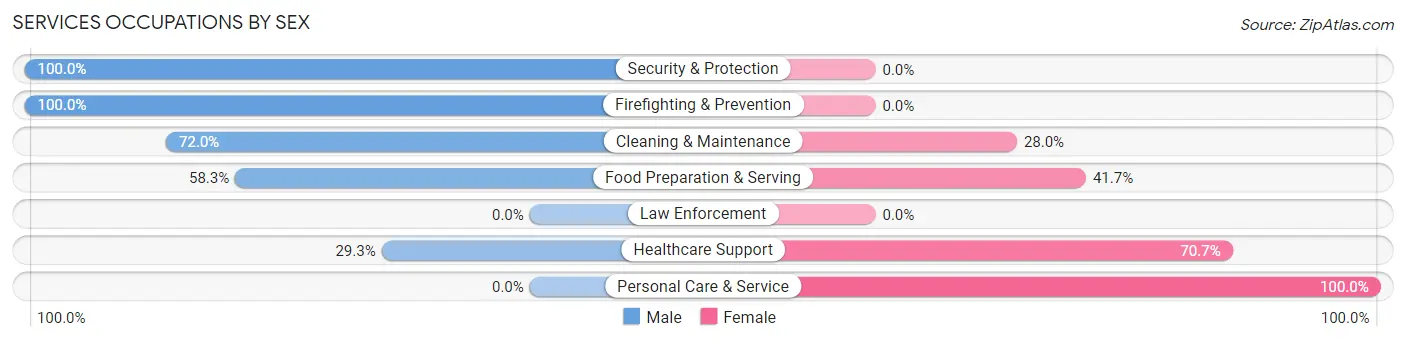
Services Occupations by Sex
Within the Services occupations in Whiteriver, the most male-oriented occupations are Security & Protection (100.0%), Firefighting & Prevention (100.0%), and Cleaning & Maintenance (72.0%), while the most female-oriented occupations are Personal Care & Service (100.0%), Healthcare Support (70.7%), and Food Preparation & Serving (41.7%).
| Occupation | Male | Female |
| Healthcare Support | 22 (29.3%) | 53 (70.7%) |
| Security & Protection | 48 (100.0%) | 0 (0.0%) |
| Firefighting & Prevention | 48 (100.0%) | 0 (0.0%) |
| Law Enforcement | 0 (0.0%) | 0 (0.0%) |
| Food Preparation & Serving | 42 (58.3%) | 30 (41.7%) |
| Cleaning & Maintenance | 54 (72.0%) | 21 (28.0%) |
| Personal Care & Service | 0 (0.0%) | 20 (100.0%) |
| Total (Category) | 166 (57.2%) | 124 (42.8%) |
| Total (Overall) | 407 (40.3%) | 604 (59.7%) |
Sales and Office Occupations
The most common Sales and Office occupations in Whiteriver are Office & Administration (73 | 7.2%), and Sales & Related (38 | 3.8%).
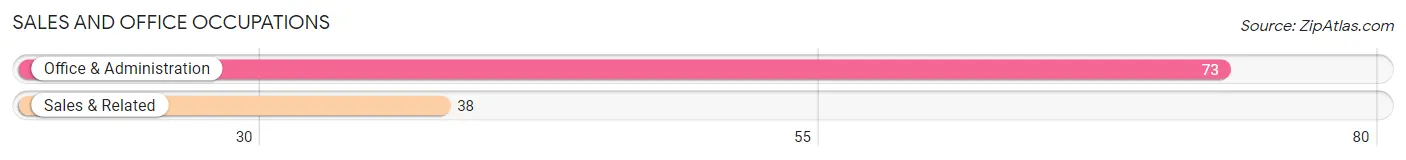
Sales and Office Occupations by Sex
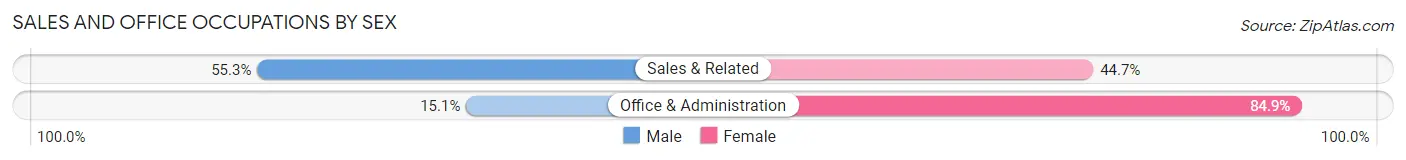
| Occupation | Male | Female |
| Sales & Related | 21 (55.3%) | 17 (44.7%) |
| Office & Administration | 11 (15.1%) | 62 (84.9%) |
| Total (Category) | 32 (28.8%) | 79 (71.2%) |
| Total (Overall) | 407 (40.3%) | 604 (59.7%) |
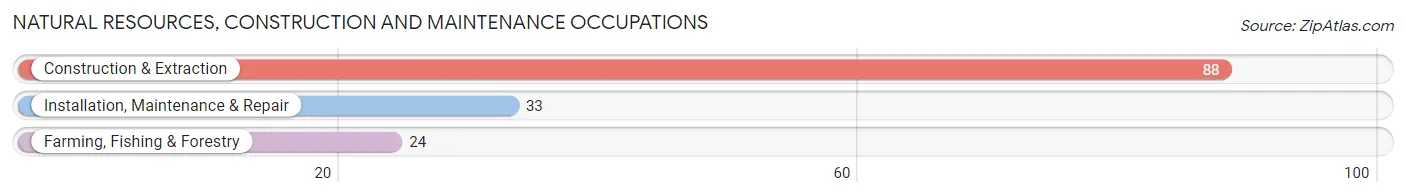
Natural Resources, Construction and Maintenance Occupations
The most common Natural Resources, Construction and Maintenance occupations in Whiteriver are Construction & Extraction (88 | 8.7%), Installation, Maintenance & Repair (33 | 3.3%), and Farming, Fishing & Forestry (24 | 2.4%).
Natural Resources, Construction and Maintenance Occupations by Sex
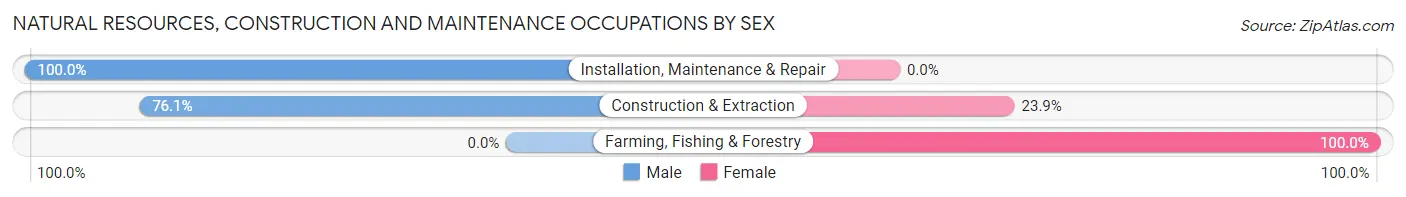
| Occupation | Male | Female |
| Farming, Fishing & Forestry | 0 (0.0%) | 24 (100.0%) |
| Construction & Extraction | 67 (76.1%) | 21 (23.9%) |
| Installation, Maintenance & Repair | 33 (100.0%) | 0 (0.0%) |
| Total (Category) | 100 (69.0%) | 45 (31.0%) |
| Total (Overall) | 407 (40.3%) | 604 (59.7%) |
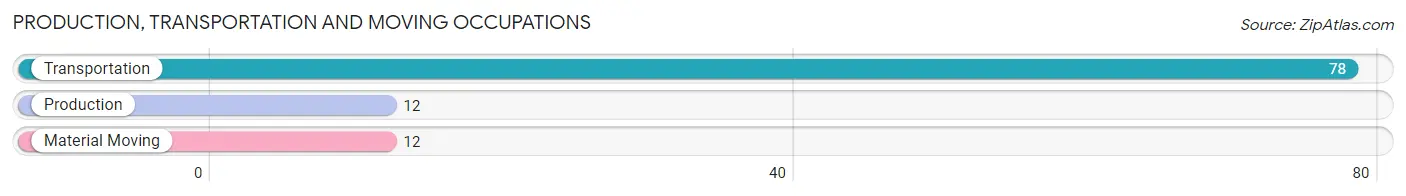
Production, Transportation and Moving Occupations
The most common Production, Transportation and Moving occupations in Whiteriver are Transportation (78 | 7.7%), Production (12 | 1.2%), and Material Moving (12 | 1.2%).
Production, Transportation and Moving Occupations by Sex
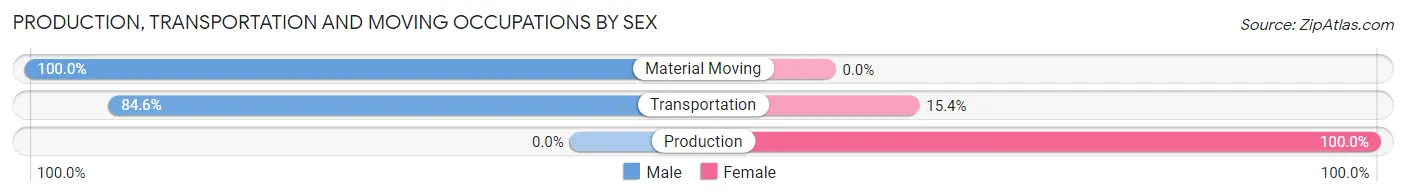
| Occupation | Male | Female |
| Production | 0 (0.0%) | 12 (100.0%) |
| Transportation | 66 (84.6%) | 12 (15.4%) |
| Material Moving | 12 (100.0%) | 0 (0.0%) |
| Total (Category) | 78 (76.5%) | 24 (23.5%) |
| Total (Overall) | 407 (40.3%) | 604 (59.7%) |
Employment Industries by Sex in Whiteriver
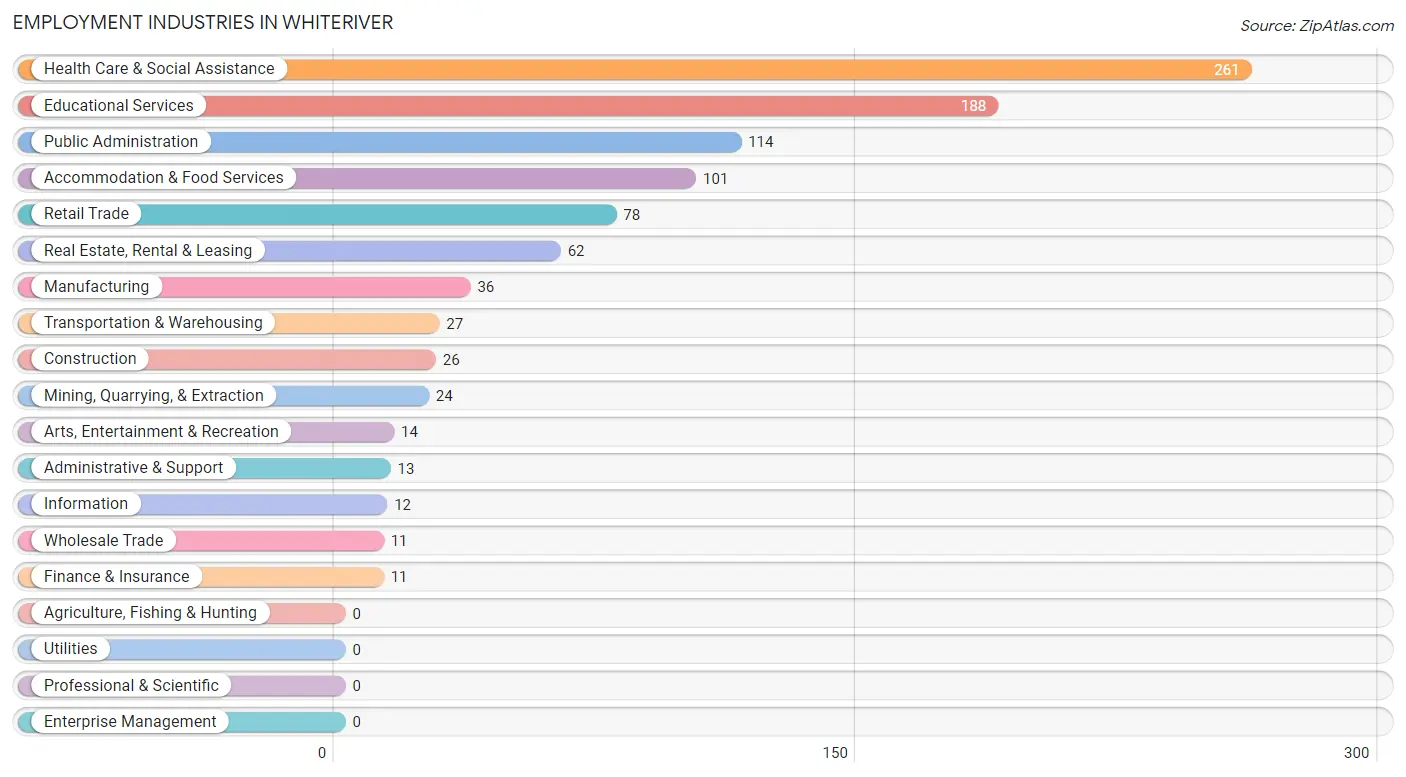
Employment Industries in Whiteriver
The major employment industries in Whiteriver include Health Care & Social Assistance (261 | 25.8%), Educational Services (188 | 18.6%), Public Administration (114 | 11.3%), Accommodation & Food Services (101 | 10.0%), and Retail Trade (78 | 7.7%).
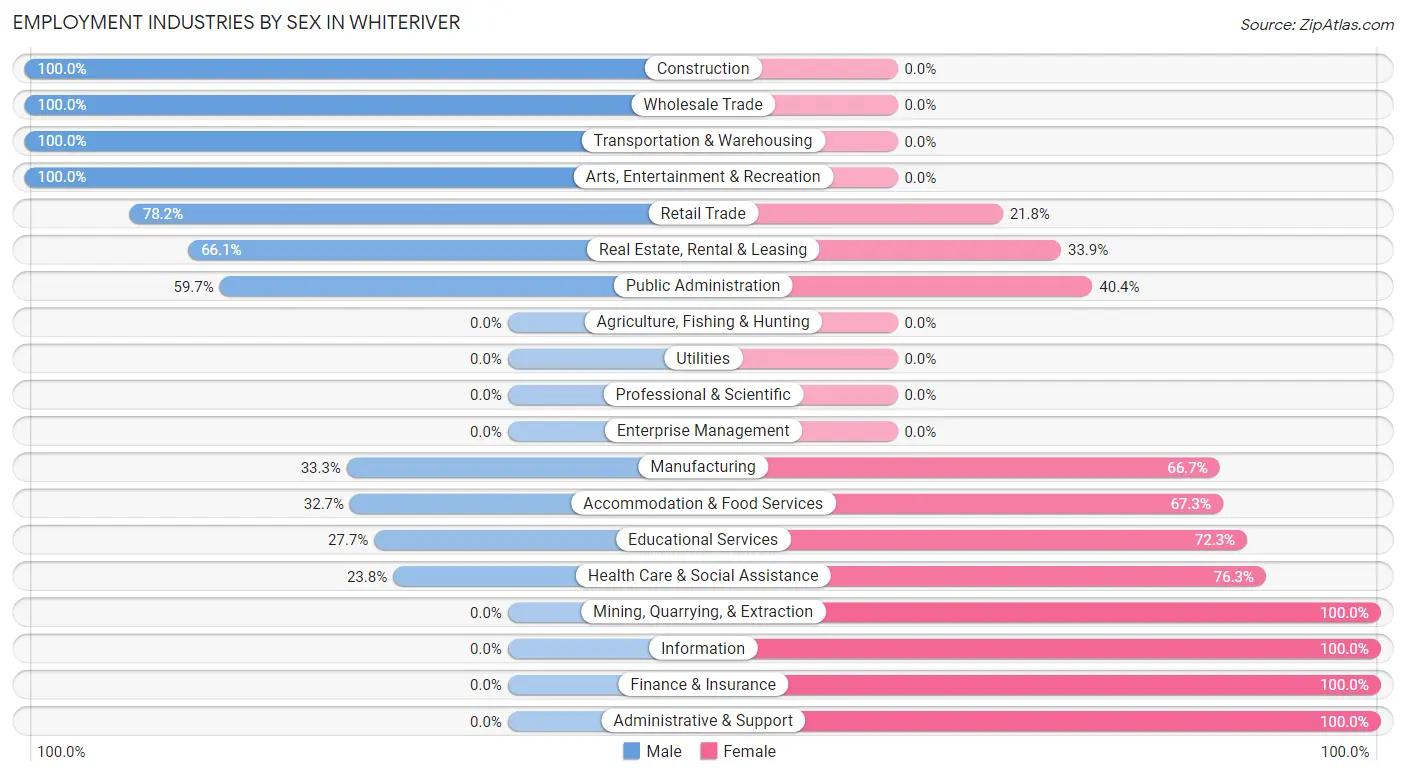
Employment Industries by Sex in Whiteriver
The Whiteriver industries that see more men than women are Construction (100.0%), Wholesale Trade (100.0%), and Transportation & Warehousing (100.0%), whereas the industries that tend to have a higher number of women are Mining, Quarrying, & Extraction (100.0%), Information (100.0%), and Finance & Insurance (100.0%).
| Industry | Male | Female |
| Agriculture, Fishing & Hunting | 0 (0.0%) | 0 (0.0%) |
| Mining, Quarrying, & Extraction | 0 (0.0%) | 24 (100.0%) |
| Construction | 26 (100.0%) | 0 (0.0%) |
| Manufacturing | 12 (33.3%) | 24 (66.7%) |
| Wholesale Trade | 11 (100.0%) | 0 (0.0%) |
| Retail Trade | 61 (78.2%) | 17 (21.8%) |
| Transportation & Warehousing | 27 (100.0%) | 0 (0.0%) |
| Utilities | 0 (0.0%) | 0 (0.0%) |
| Information | 0 (0.0%) | 12 (100.0%) |
| Finance & Insurance | 0 (0.0%) | 11 (100.0%) |
| Real Estate, Rental & Leasing | 41 (66.1%) | 21 (33.9%) |
| Professional & Scientific | 0 (0.0%) | 0 (0.0%) |
| Enterprise Management | 0 (0.0%) | 0 (0.0%) |
| Administrative & Support | 0 (0.0%) | 13 (100.0%) |
| Educational Services | 52 (27.7%) | 136 (72.3%) |
| Health Care & Social Assistance | 62 (23.7%) | 199 (76.2%) |
| Arts, Entertainment & Recreation | 14 (100.0%) | 0 (0.0%) |
| Accommodation & Food Services | 33 (32.7%) | 68 (67.3%) |
| Public Administration | 68 (59.7%) | 46 (40.4%) |
| Total | 407 (40.3%) | 604 (59.7%) |
Education in Whiteriver
School Enrollment in Whiteriver
The most common levels of schooling among the 1,355 students in Whiteriver are middle school (408 | 30.1%), high school (322 | 23.8%), and elementary school (319 | 23.5%).
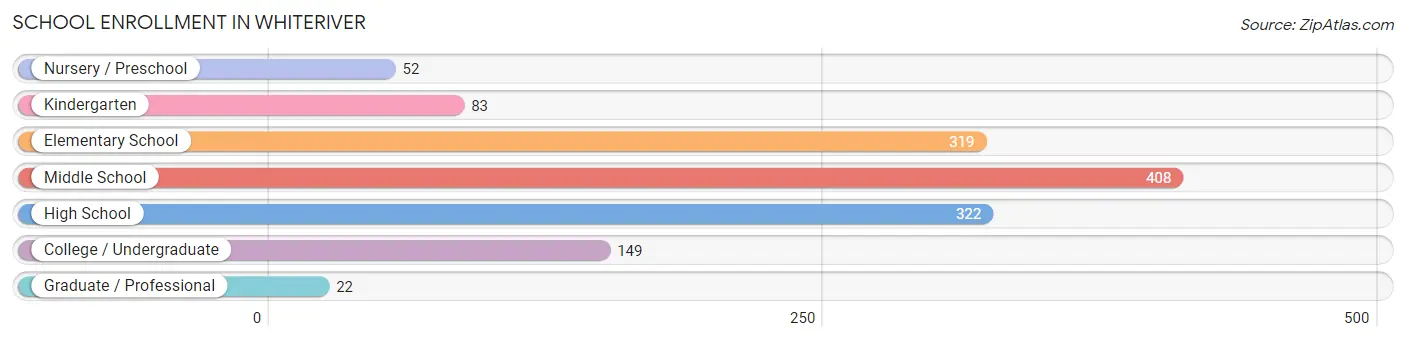
| School Level | # Students | % Students |
| Nursery / Preschool | 52 | 3.8% |
| Kindergarten | 83 | 6.1% |
| Elementary School | 319 | 23.5% |
| Middle School | 408 | 30.1% |
| High School | 322 | 23.8% |
| College / Undergraduate | 149 | 11.0% |
| Graduate / Professional | 22 | 1.6% |
| Total | 1,355 | 100.0% |
School Enrollment by Age by Funding Source in Whiteriver
Out of a total of 1,355 students who are enrolled in schools in Whiteriver, 53 (3.9%) attend a private institution, while the remaining 1,302 (96.1%) are enrolled in public schools. The age group of 35 years and over has the highest likelihood of being enrolled in private schools, with 34 (46.6% in the age bracket) enrolled. Conversely, the age group of 3 to 4 year olds has the lowest likelihood of being enrolled in a private school, with 37 (100.0% in the age bracket) attending a public institution.
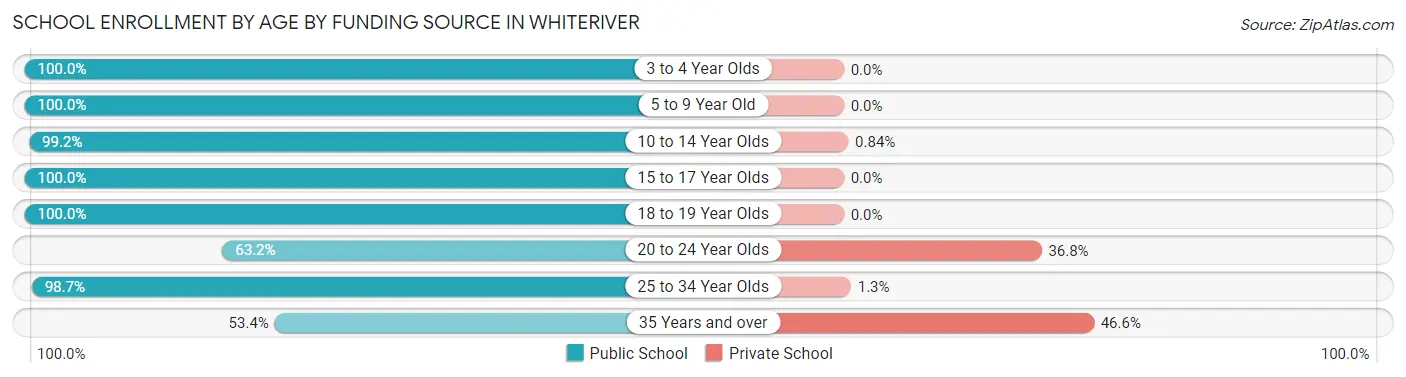
| Age Bracket | Public School | Private School |
| 3 to 4 Year Olds | 37 (100.0%) | 0 (0.0%) |
| 5 to 9 Year Old | 386 (100.0%) | 0 (0.0%) |
| 10 to 14 Year Olds | 470 (99.2%) | 4 (0.8%) |
| 15 to 17 Year Olds | 226 (100.0%) | 0 (0.0%) |
| 18 to 19 Year Olds | 46 (100.0%) | 0 (0.0%) |
| 20 to 24 Year Olds | 24 (63.2%) | 14 (36.8%) |
| 25 to 34 Year Olds | 74 (98.7%) | 1 (1.3%) |
| 35 Years and over | 39 (53.4%) | 34 (46.6%) |
| Total | 1,302 (96.1%) | 53 (3.9%) |
Educational Attainment by Field of Study in Whiteriver
Bio, nature & agricultural (57 | 40.4%), arts & humanities (31 | 22.0%), science & technology (22 | 15.6%), education (22 | 15.6%), and physical & health sciences (9 | 6.4%) are the most common fields of study among 141 individuals in Whiteriver who have obtained a bachelor's degree or higher.
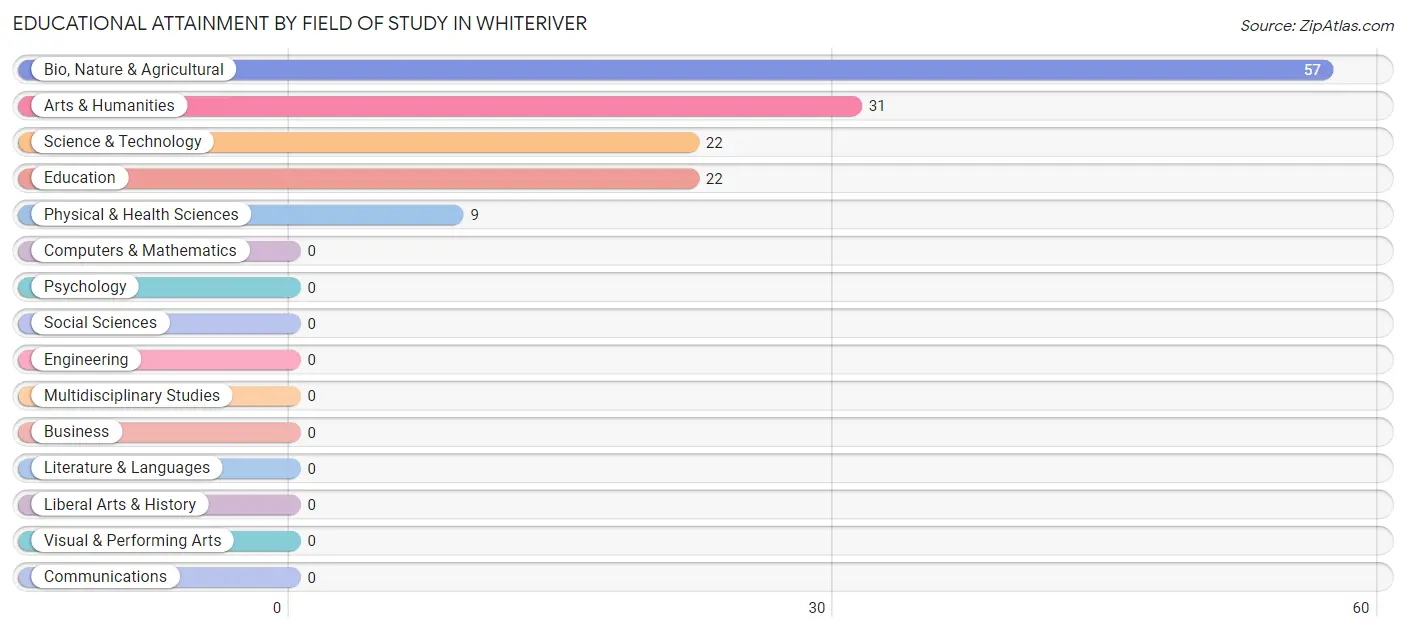
| Field of Study | # Graduates | % Graduates |
| Computers & Mathematics | 0 | 0.0% |
| Bio, Nature & Agricultural | 57 | 40.4% |
| Physical & Health Sciences | 9 | 6.4% |
| Psychology | 0 | 0.0% |
| Social Sciences | 0 | 0.0% |
| Engineering | 0 | 0.0% |
| Multidisciplinary Studies | 0 | 0.0% |
| Science & Technology | 22 | 15.6% |
| Business | 0 | 0.0% |
| Education | 22 | 15.6% |
| Literature & Languages | 0 | 0.0% |
| Liberal Arts & History | 0 | 0.0% |
| Visual & Performing Arts | 0 | 0.0% |
| Communications | 0 | 0.0% |
| Arts & Humanities | 31 | 22.0% |
| Total | 141 | 100.0% |
Transportation & Commute in Whiteriver
Vehicle Availability by Sex in Whiteriver
The most prevalent vehicle ownership categories in Whiteriver are males with 2 vehicles (203, accounting for 47.2%) and females with 2 vehicles (200, making up 33.6%).
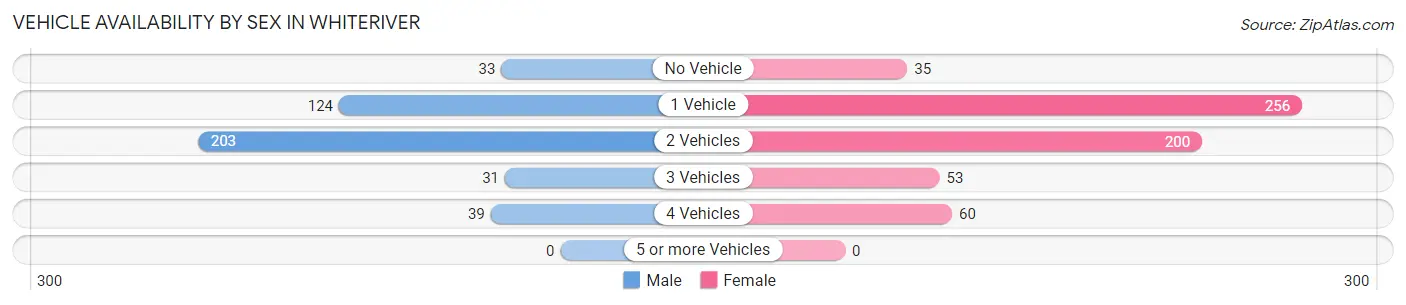
| Vehicles Available | Male | Female |
| No Vehicle | 33 (7.7%) | 35 (5.8%) |
| 1 Vehicle | 124 (28.8%) | 256 (42.4%) |
| 2 Vehicles | 203 (47.2%) | 200 (33.1%) |
| 3 Vehicles | 31 (7.2%) | 53 (8.8%) |
| 4 Vehicles | 39 (9.1%) | 60 (9.9%) |
| 5 or more Vehicles | 0 (0.0%) | 0 (0.0%) |
| Total | 430 (100.0%) | 604 (100.0%) |
Commute Time in Whiteriver
The most frequently occuring commute durations in Whiteriver are 5 to 9 minutes (350 commuters, 35.3%), 30 to 34 minutes (102 commuters, 10.3%), and 45 to 59 minutes (102 commuters, 10.3%).
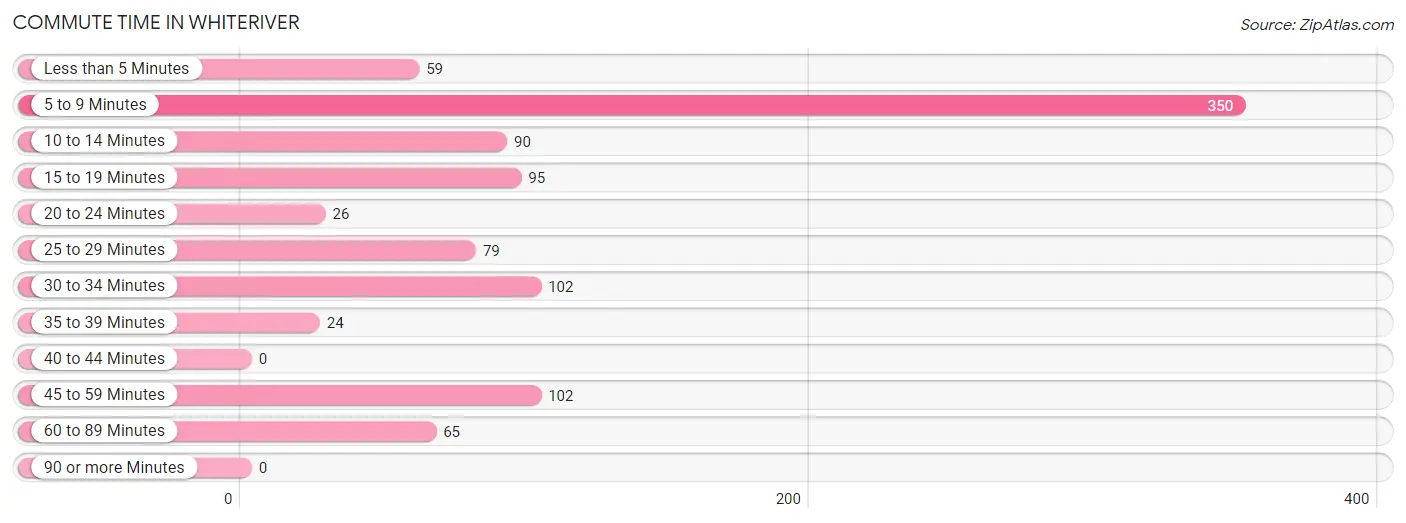
| Commute Time | # Commuters | % Commuters |
| Less than 5 Minutes | 59 | 5.9% |
| 5 to 9 Minutes | 350 | 35.3% |
| 10 to 14 Minutes | 90 | 9.1% |
| 15 to 19 Minutes | 95 | 9.6% |
| 20 to 24 Minutes | 26 | 2.6% |
| 25 to 29 Minutes | 79 | 8.0% |
| 30 to 34 Minutes | 102 | 10.3% |
| 35 to 39 Minutes | 24 | 2.4% |
| 40 to 44 Minutes | 0 | 0.0% |
| 45 to 59 Minutes | 102 | 10.3% |
| 60 to 89 Minutes | 65 | 6.6% |
| 90 or more Minutes | 0 | 0.0% |
Commute Time by Sex in Whiteriver
The most common commute times in Whiteriver are 5 to 9 minutes (183 commuters, 44.6%) for males and 5 to 9 minutes (167 commuters, 28.7%) for females.
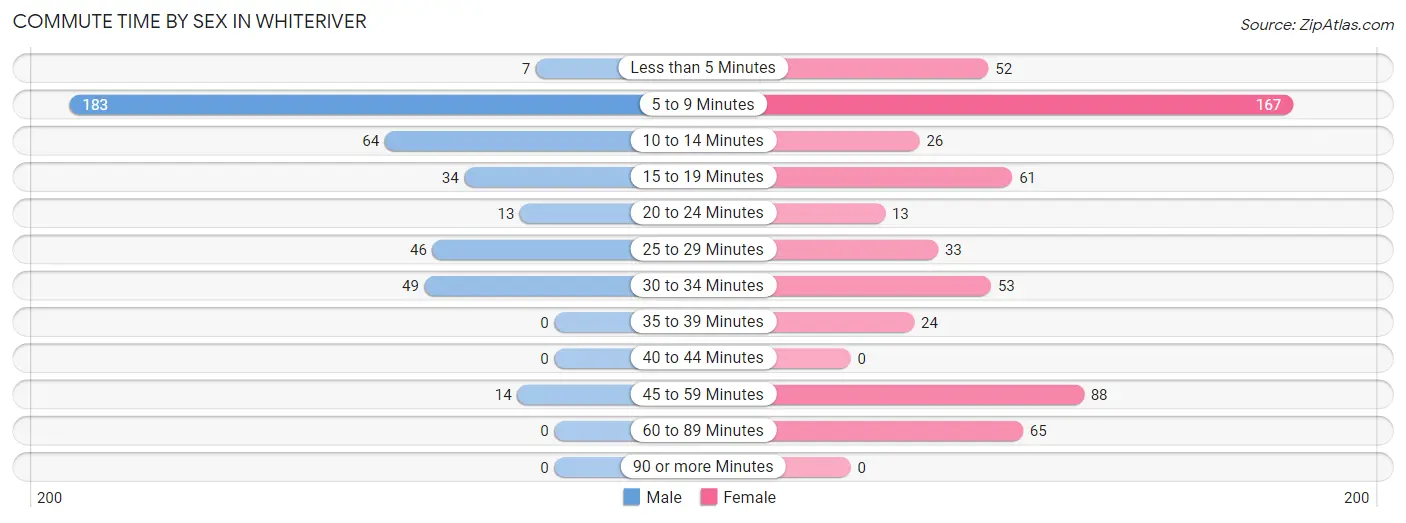
| Commute Time | Male | Female |
| Less than 5 Minutes | 7 (1.7%) | 52 (8.9%) |
| 5 to 9 Minutes | 183 (44.6%) | 167 (28.7%) |
| 10 to 14 Minutes | 64 (15.6%) | 26 (4.5%) |
| 15 to 19 Minutes | 34 (8.3%) | 61 (10.5%) |
| 20 to 24 Minutes | 13 (3.2%) | 13 (2.2%) |
| 25 to 29 Minutes | 46 (11.2%) | 33 (5.7%) |
| 30 to 34 Minutes | 49 (11.9%) | 53 (9.1%) |
| 35 to 39 Minutes | 0 (0.0%) | 24 (4.1%) |
| 40 to 44 Minutes | 0 (0.0%) | 0 (0.0%) |
| 45 to 59 Minutes | 14 (3.4%) | 88 (15.1%) |
| 60 to 89 Minutes | 0 (0.0%) | 65 (11.2%) |
| 90 or more Minutes | 0 (0.0%) | 0 (0.0%) |
Time of Departure to Work by Sex in Whiteriver
The most frequent times of departure to work in Whiteriver are 7:00 AM to 7:29 AM (155, 37.8%) for males and 7:00 AM to 7:29 AM (352, 60.5%) for females.
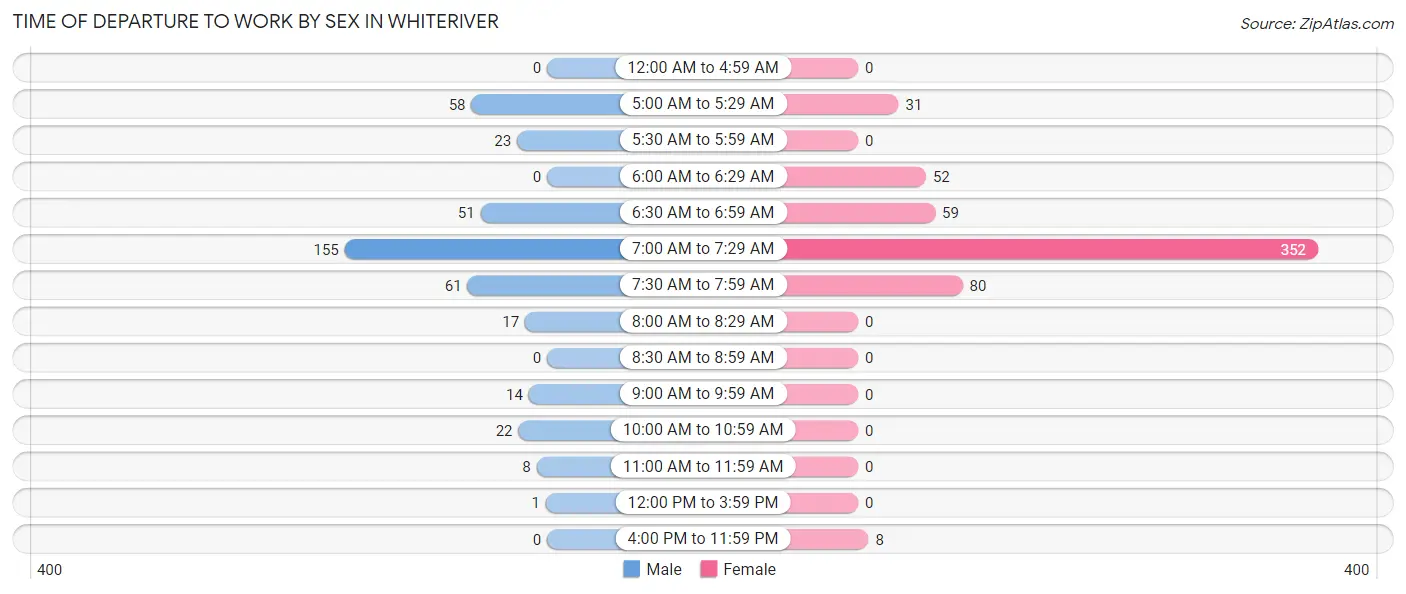
| Time of Departure | Male | Female |
| 12:00 AM to 4:59 AM | 0 (0.0%) | 0 (0.0%) |
| 5:00 AM to 5:29 AM | 58 (14.1%) | 31 (5.3%) |
| 5:30 AM to 5:59 AM | 23 (5.6%) | 0 (0.0%) |
| 6:00 AM to 6:29 AM | 0 (0.0%) | 52 (8.9%) |
| 6:30 AM to 6:59 AM | 51 (12.4%) | 59 (10.1%) |
| 7:00 AM to 7:29 AM | 155 (37.8%) | 352 (60.5%) |
| 7:30 AM to 7:59 AM | 61 (14.9%) | 80 (13.8%) |
| 8:00 AM to 8:29 AM | 17 (4.2%) | 0 (0.0%) |
| 8:30 AM to 8:59 AM | 0 (0.0%) | 0 (0.0%) |
| 9:00 AM to 9:59 AM | 14 (3.4%) | 0 (0.0%) |
| 10:00 AM to 10:59 AM | 22 (5.4%) | 0 (0.0%) |
| 11:00 AM to 11:59 AM | 8 (1.9%) | 0 (0.0%) |
| 12:00 PM to 3:59 PM | 1 (0.2%) | 0 (0.0%) |
| 4:00 PM to 11:59 PM | 0 (0.0%) | 8 (1.4%) |
| Total | 410 (100.0%) | 582 (100.0%) |
Housing Occupancy in Whiteriver
Occupancy by Ownership in Whiteriver
Of the total 1,267 dwellings in Whiteriver, owner-occupied units account for 614 (48.5%), while renter-occupied units make up 653 (51.5%).
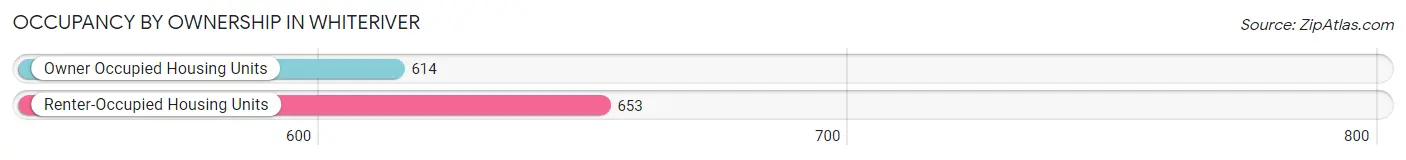
| Occupancy | # Housing Units | % Housing Units |
| Owner Occupied Housing Units | 614 | 48.5% |
| Renter-Occupied Housing Units | 653 | 51.5% |
| Total Occupied Housing Units | 1,267 | 100.0% |
Occupancy by Household Size in Whiteriver
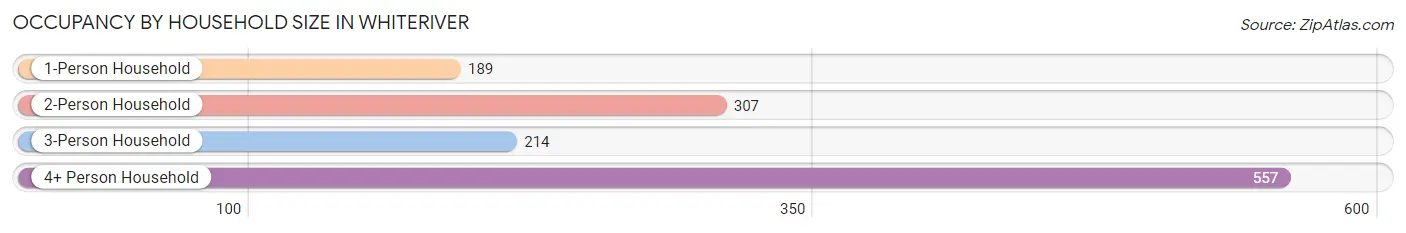
| Household Size | # Housing Units | % Housing Units |
| 1-Person Household | 189 | 14.9% |
| 2-Person Household | 307 | 24.2% |
| 3-Person Household | 214 | 16.9% |
| 4+ Person Household | 557 | 44.0% |
| Total Housing Units | 1,267 | 100.0% |
Occupancy by Ownership by Household Size in Whiteriver
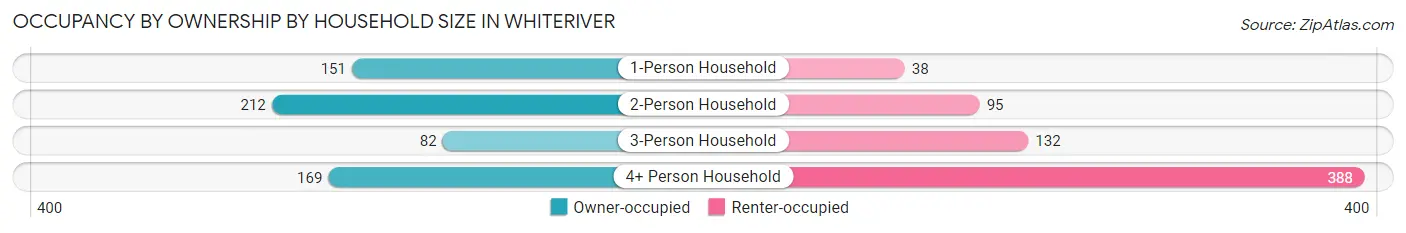
| Household Size | Owner-occupied | Renter-occupied |
| 1-Person Household | 151 (79.9%) | 38 (20.1%) |
| 2-Person Household | 212 (69.1%) | 95 (30.9%) |
| 3-Person Household | 82 (38.3%) | 132 (61.7%) |
| 4+ Person Household | 169 (30.3%) | 388 (69.7%) |
| Total Housing Units | 614 (48.5%) | 653 (51.5%) |
Occupancy by Educational Attainment in Whiteriver
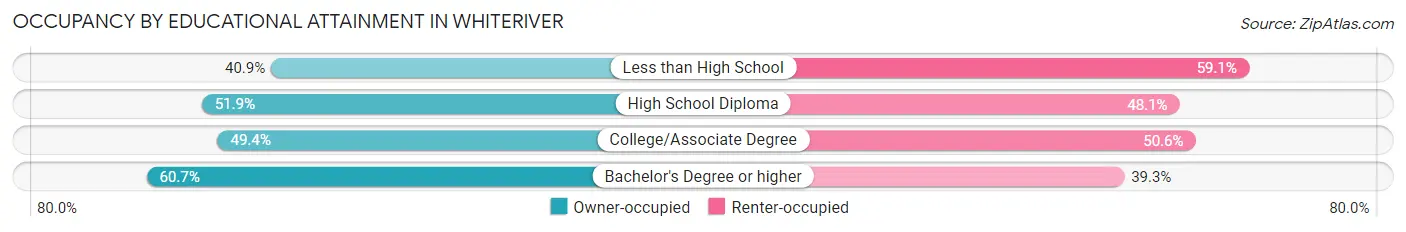
| Household Size | Owner-occupied | Renter-occupied |
| Less than High School | 144 (40.9%) | 208 (59.1%) |
| High School Diploma | 232 (51.9%) | 215 (48.1%) |
| College/Associate Degree | 201 (49.4%) | 206 (50.6%) |
| Bachelor's Degree or higher | 37 (60.7%) | 24 (39.3%) |
Occupancy by Age of Householder in Whiteriver
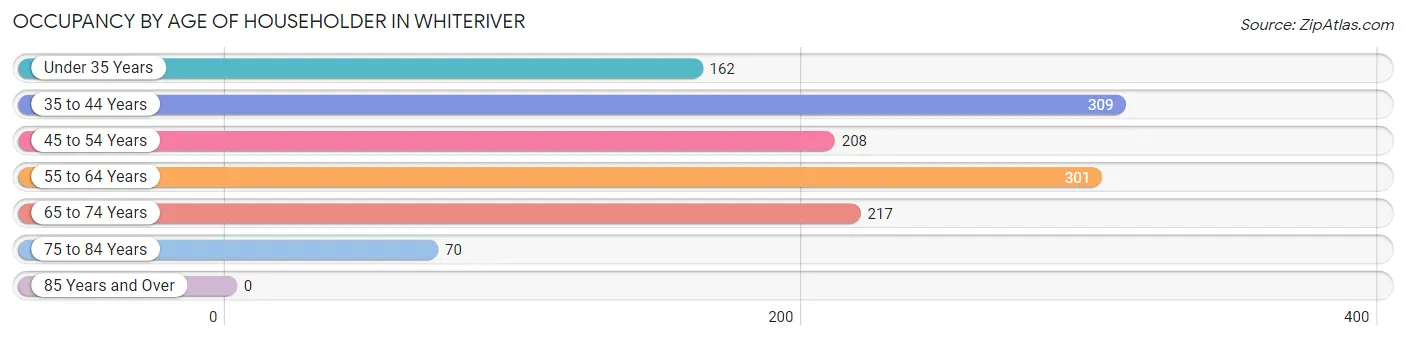
| Age Bracket | # Households | % Households |
| Under 35 Years | 162 | 12.8% |
| 35 to 44 Years | 309 | 24.4% |
| 45 to 54 Years | 208 | 16.4% |
| 55 to 64 Years | 301 | 23.8% |
| 65 to 74 Years | 217 | 17.1% |
| 75 to 84 Years | 70 | 5.5% |
| 85 Years and Over | 0 | 0.0% |
| Total | 1,267 | 100.0% |
Housing Finances in Whiteriver
Median Income by Occupancy in Whiteriver
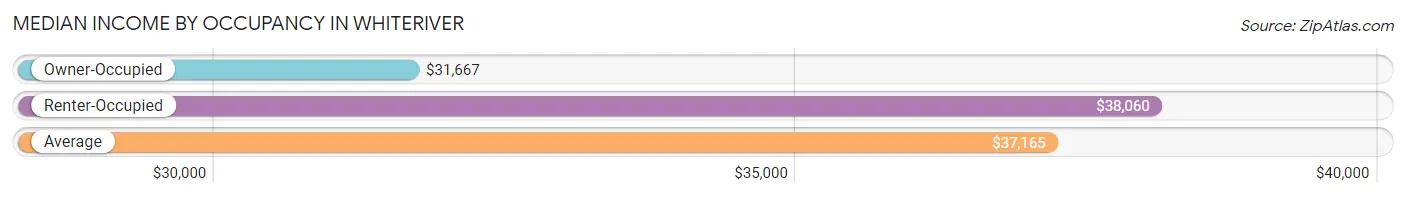
| Occupancy Type | # Households | Median Income |
| Owner-Occupied | 614 (48.5%) | $31,667 |
| Renter-Occupied | 653 (51.5%) | $38,060 |
| Average | 1,267 (100.0%) | $37,165 |
Occupancy by Householder Income Bracket in Whiteriver
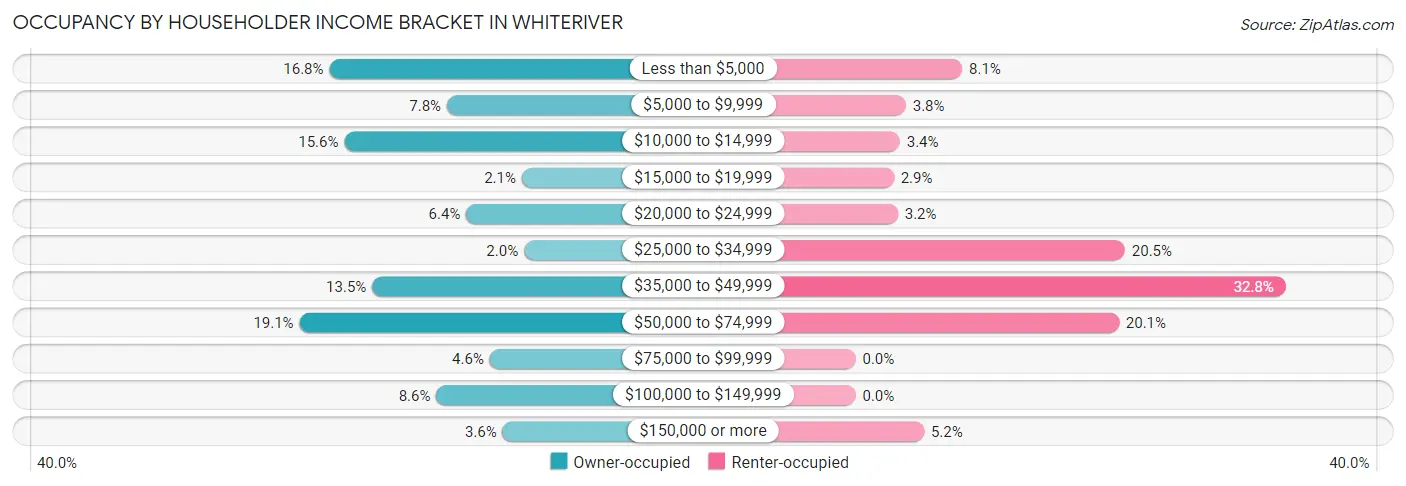
| Income Bracket | Owner-occupied | Renter-occupied |
| Less than $5,000 | 103 (16.8%) | 53 (8.1%) |
| $5,000 to $9,999 | 48 (7.8%) | 25 (3.8%) |
| $10,000 to $14,999 | 96 (15.6%) | 22 (3.4%) |
| $15,000 to $19,999 | 13 (2.1%) | 19 (2.9%) |
| $20,000 to $24,999 | 39 (6.4%) | 21 (3.2%) |
| $25,000 to $34,999 | 12 (1.9%) | 134 (20.5%) |
| $35,000 to $49,999 | 83 (13.5%) | 214 (32.8%) |
| $50,000 to $74,999 | 117 (19.1%) | 131 (20.1%) |
| $75,000 to $99,999 | 28 (4.6%) | 0 (0.0%) |
| $100,000 to $149,999 | 53 (8.6%) | 0 (0.0%) |
| $150,000 or more | 22 (3.6%) | 34 (5.2%) |
| Total | 614 (100.0%) | 653 (100.0%) |
Monthly Housing Cost Tiers in Whiteriver
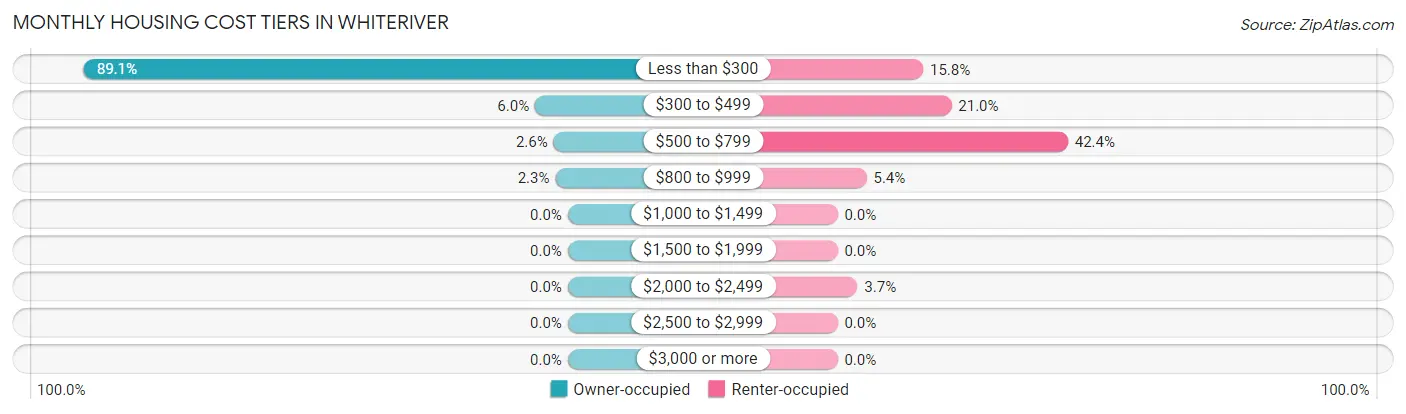
| Monthly Cost | Owner-occupied | Renter-occupied |
| Less than $300 | 547 (89.1%) | 103 (15.8%) |
| $300 to $499 | 37 (6.0%) | 137 (21.0%) |
| $500 to $799 | 16 (2.6%) | 277 (42.4%) |
| $800 to $999 | 14 (2.3%) | 35 (5.4%) |
| $1,000 to $1,499 | 0 (0.0%) | 0 (0.0%) |
| $1,500 to $1,999 | 0 (0.0%) | 0 (0.0%) |
| $2,000 to $2,499 | 0 (0.0%) | 24 (3.7%) |
| $2,500 to $2,999 | 0 (0.0%) | 0 (0.0%) |
| $3,000 or more | 0 (0.0%) | 0 (0.0%) |
| Total | 614 (100.0%) | 653 (100.0%) |
Physical Housing Characteristics in Whiteriver
Housing Structures in Whiteriver
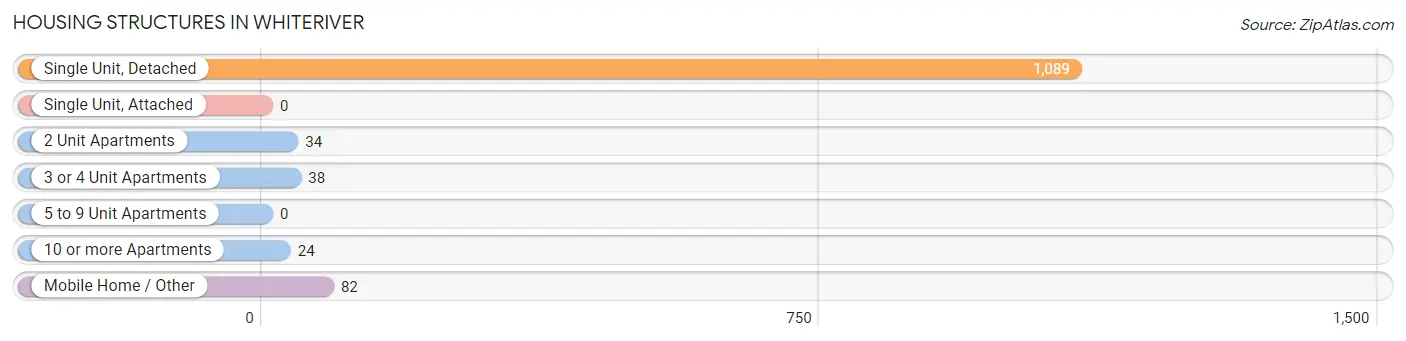
| Structure Type | # Housing Units | % Housing Units |
| Single Unit, Detached | 1,089 | 86.0% |
| Single Unit, Attached | 0 | 0.0% |
| 2 Unit Apartments | 34 | 2.7% |
| 3 or 4 Unit Apartments | 38 | 3.0% |
| 5 to 9 Unit Apartments | 0 | 0.0% |
| 10 or more Apartments | 24 | 1.9% |
| Mobile Home / Other | 82 | 6.5% |
| Total | 1,267 | 100.0% |
Housing Structures by Occupancy in Whiteriver
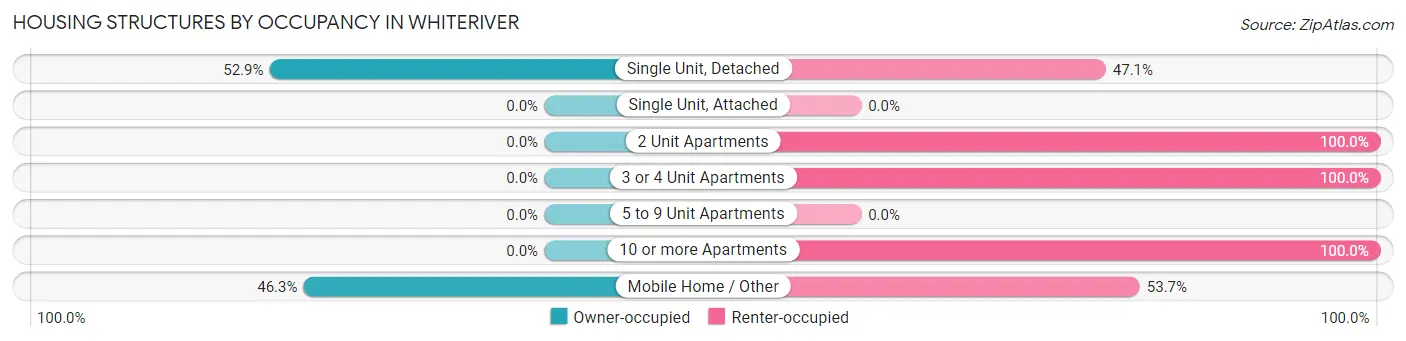
| Structure Type | Owner-occupied | Renter-occupied |
| Single Unit, Detached | 576 (52.9%) | 513 (47.1%) |
| Single Unit, Attached | 0 (0.0%) | 0 (0.0%) |
| 2 Unit Apartments | 0 (0.0%) | 34 (100.0%) |
| 3 or 4 Unit Apartments | 0 (0.0%) | 38 (100.0%) |
| 5 to 9 Unit Apartments | 0 (0.0%) | 0 (0.0%) |
| 10 or more Apartments | 0 (0.0%) | 24 (100.0%) |
| Mobile Home / Other | 38 (46.3%) | 44 (53.7%) |
| Total | 614 (48.5%) | 653 (51.5%) |
Housing Structures by Number of Rooms in Whiteriver
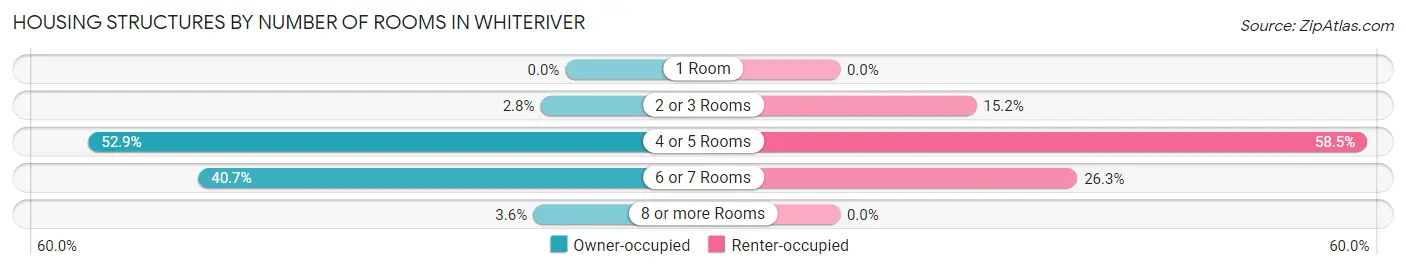
| Number of Rooms | Owner-occupied | Renter-occupied |
| 1 Room | 0 (0.0%) | 0 (0.0%) |
| 2 or 3 Rooms | 17 (2.8%) | 99 (15.2%) |
| 4 or 5 Rooms | 325 (52.9%) | 382 (58.5%) |
| 6 or 7 Rooms | 250 (40.7%) | 172 (26.3%) |
| 8 or more Rooms | 22 (3.6%) | 0 (0.0%) |
| Total | 614 (100.0%) | 653 (100.0%) |
Housing Structure by Heating Type in Whiteriver
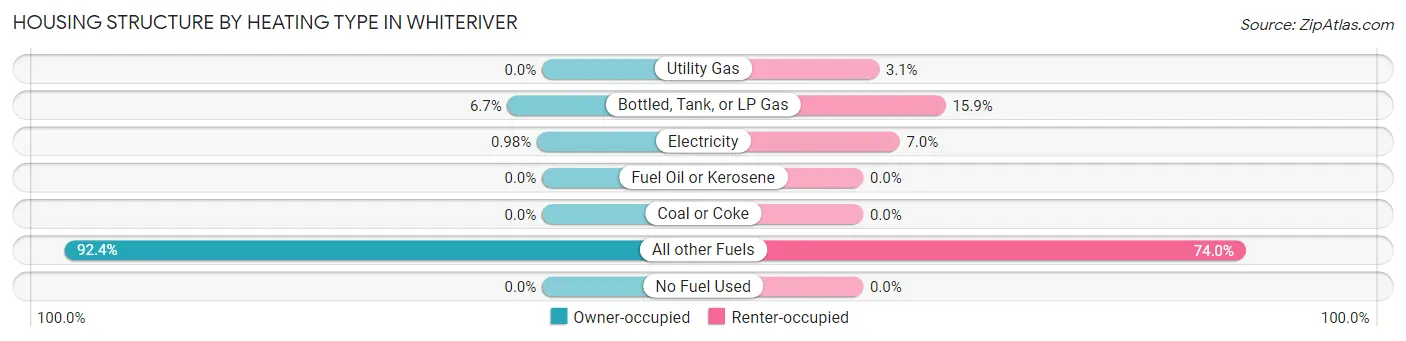
| Heating Type | Owner-occupied | Renter-occupied |
| Utility Gas | 0 (0.0%) | 20 (3.1%) |
| Bottled, Tank, or LP Gas | 41 (6.7%) | 104 (15.9%) |
| Electricity | 6 (1.0%) | 46 (7.0%) |
| Fuel Oil or Kerosene | 0 (0.0%) | 0 (0.0%) |
| Coal or Coke | 0 (0.0%) | 0 (0.0%) |
| All other Fuels | 567 (92.3%) | 483 (74.0%) |
| No Fuel Used | 0 (0.0%) | 0 (0.0%) |
| Total | 614 (100.0%) | 653 (100.0%) |
Household Vehicle Usage in Whiteriver
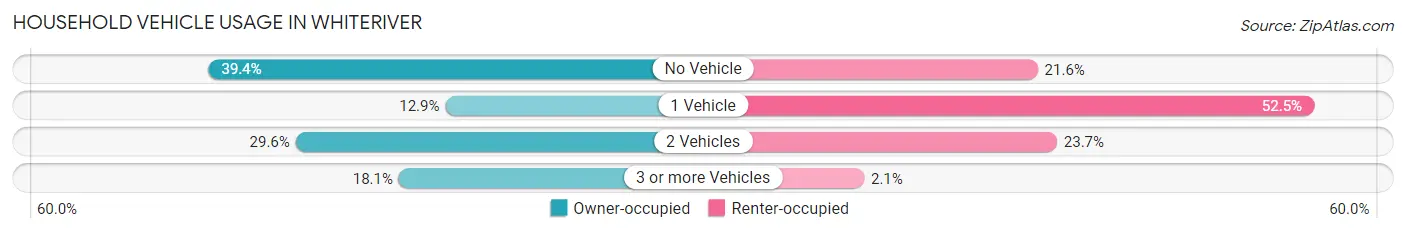
| Vehicles per Household | Owner-occupied | Renter-occupied |
| No Vehicle | 242 (39.4%) | 141 (21.6%) |
| 1 Vehicle | 79 (12.9%) | 343 (52.5%) |
| 2 Vehicles | 182 (29.6%) | 155 (23.7%) |
| 3 or more Vehicles | 111 (18.1%) | 14 (2.1%) |
| Total | 614 (100.0%) | 653 (100.0%) |
Real Estate & Mortgages in Whiteriver
Real Estate and Mortgage Overview in Whiteriver
| Characteristic | Without Mortgage | With Mortgage |
| Housing Units | 594 | 20 |
| Median Property Value | $59,600 | $0 |
| Median Household Income | $24,872 | $0 |
| Monthly Housing Costs | $199 | $0 |
| Real Estate Taxes | - | - |
Property Value by Mortgage Status in Whiteriver
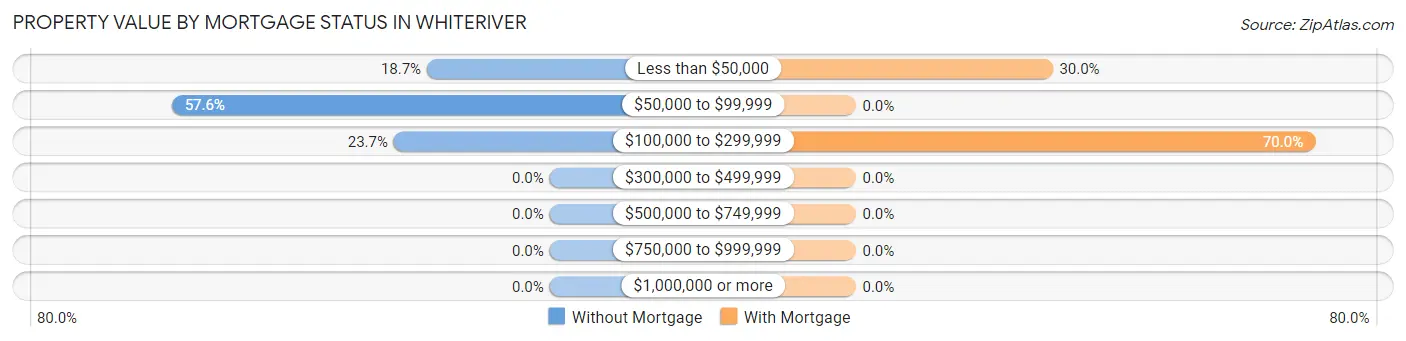
| Property Value | Without Mortgage | With Mortgage |
| Less than $50,000 | 111 (18.7%) | 6 (30.0%) |
| $50,000 to $99,999 | 342 (57.6%) | 0 (0.0%) |
| $100,000 to $299,999 | 141 (23.7%) | 14 (70.0%) |
| $300,000 to $499,999 | 0 (0.0%) | 0 (0.0%) |
| $500,000 to $749,999 | 0 (0.0%) | 0 (0.0%) |
| $750,000 to $999,999 | 0 (0.0%) | 0 (0.0%) |
| $1,000,000 or more | 0 (0.0%) | 0 (0.0%) |
| Total | 594 (100.0%) | 20 (100.0%) |
Household Income by Mortgage Status in Whiteriver
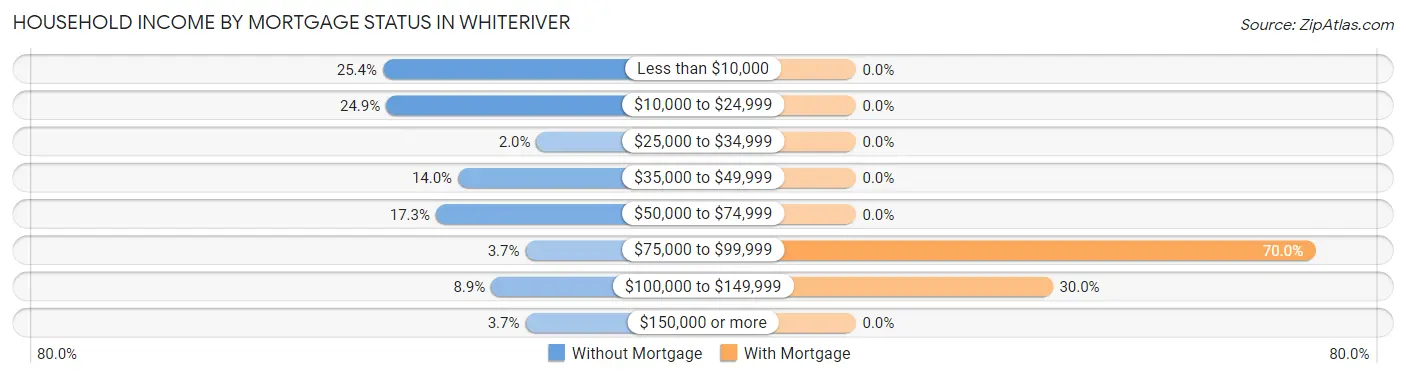
| Household Income | Without Mortgage | With Mortgage |
| Less than $10,000 | 151 (25.4%) | 0 (0.0%) |
| $10,000 to $24,999 | 148 (24.9%) | 0 (0.0%) |
| $25,000 to $34,999 | 12 (2.0%) | 0 (0.0%) |
| $35,000 to $49,999 | 83 (14.0%) | 0 (0.0%) |
| $50,000 to $74,999 | 103 (17.3%) | 0 (0.0%) |
| $75,000 to $99,999 | 22 (3.7%) | 14 (70.0%) |
| $100,000 to $149,999 | 53 (8.9%) | 6 (30.0%) |
| $150,000 or more | 22 (3.7%) | 0 (0.0%) |
| Total | 594 (100.0%) | 20 (100.0%) |
Property Value to Household Income Ratio in Whiteriver
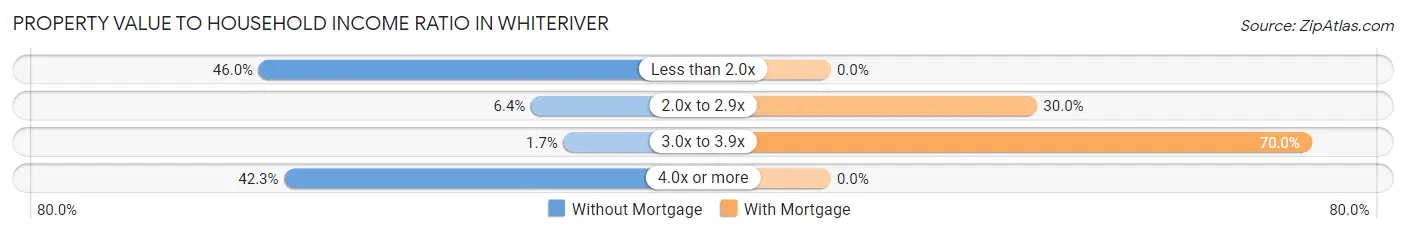
| Value-to-Income Ratio | Without Mortgage | With Mortgage |
| Less than 2.0x | 273 (46.0%) | 0 (0.0%) |
| 2.0x to 2.9x | 38 (6.4%) | 6 (30.0%) |
| 3.0x to 3.9x | 10 (1.7%) | 14 (70.0%) |
| 4.0x or more | 251 (42.3%) | 0 (0.0%) |
| Total | 594 (100.0%) | 20 (100.0%) |
Real Estate Taxes by Mortgage Status in Whiteriver
| Property Taxes | Without Mortgage | With Mortgage |
| Less than $800 | 0 (0.0%) | 0 (0.0%) |
| $800 to $1,499 | 0 (0.0%) | 0 (0.0%) |
| $800 to $1,499 | 0 (0.0%) | 0 (0.0%) |
| Total | 594 (100.0%) | 20 (100.0%) |
Health & Disability in Whiteriver
Health Insurance Coverage by Age in Whiteriver
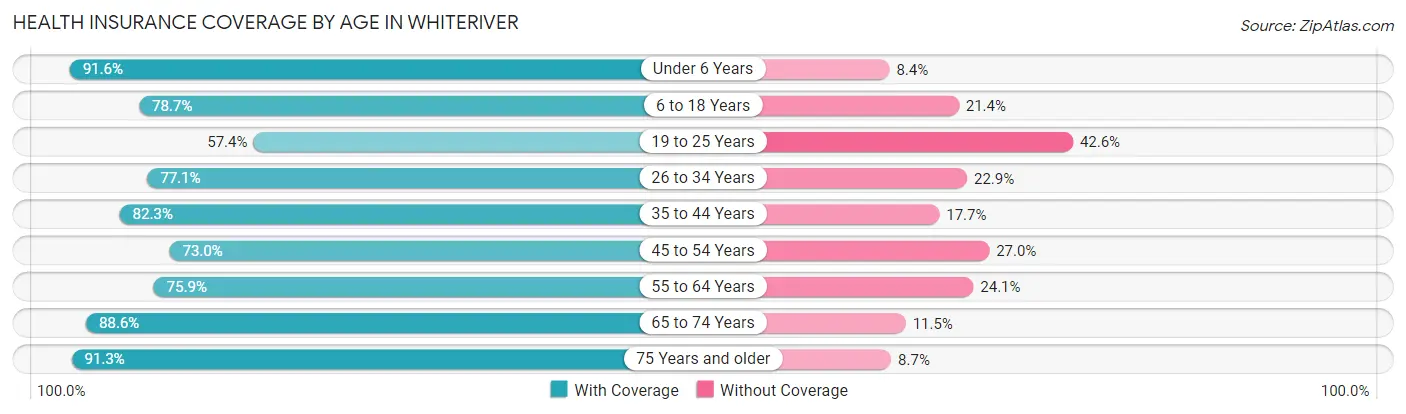
| Age Bracket | With Coverage | Without Coverage |
| Under 6 Years | 337 (91.6%) | 31 (8.4%) |
| 6 to 18 Years | 814 (78.6%) | 221 (21.3%) |
| 19 to 25 Years | 222 (57.4%) | 165 (42.6%) |
| 26 to 34 Years | 347 (77.1%) | 103 (22.9%) |
| 35 to 44 Years | 548 (82.3%) | 118 (17.7%) |
| 45 to 54 Years | 316 (73.0%) | 117 (27.0%) |
| 55 to 64 Years | 325 (75.9%) | 103 (24.1%) |
| 65 to 74 Years | 263 (88.5%) | 34 (11.5%) |
| 75 Years and older | 94 (91.3%) | 9 (8.7%) |
| Total | 3,266 (78.4%) | 901 (21.6%) |
Health Insurance Coverage by Citizenship Status in Whiteriver
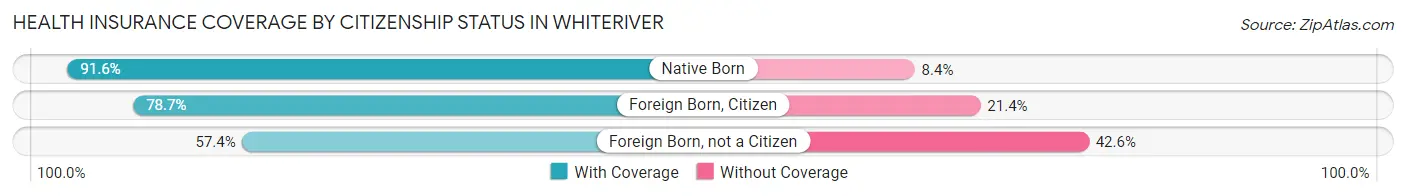
| Citizenship Status | With Coverage | Without Coverage |
| Native Born | 337 (91.6%) | 31 (8.4%) |
| Foreign Born, Citizen | 814 (78.6%) | 221 (21.3%) |
| Foreign Born, not a Citizen | 222 (57.4%) | 165 (42.6%) |
Health Insurance Coverage by Household Income in Whiteriver
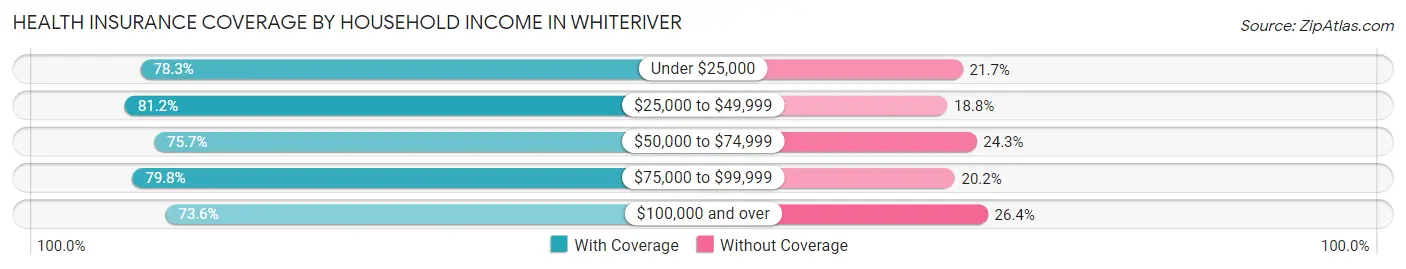
| Household Income | With Coverage | Without Coverage |
| Under $25,000 | 707 (78.3%) | 196 (21.7%) |
| $25,000 to $49,999 | 1,288 (81.2%) | 298 (18.8%) |
| $50,000 to $74,999 | 858 (75.7%) | 275 (24.3%) |
| $75,000 to $99,999 | 83 (79.8%) | 21 (20.2%) |
| $100,000 and over | 307 (73.6%) | 110 (26.4%) |
Public vs Private Health Insurance Coverage by Age in Whiteriver
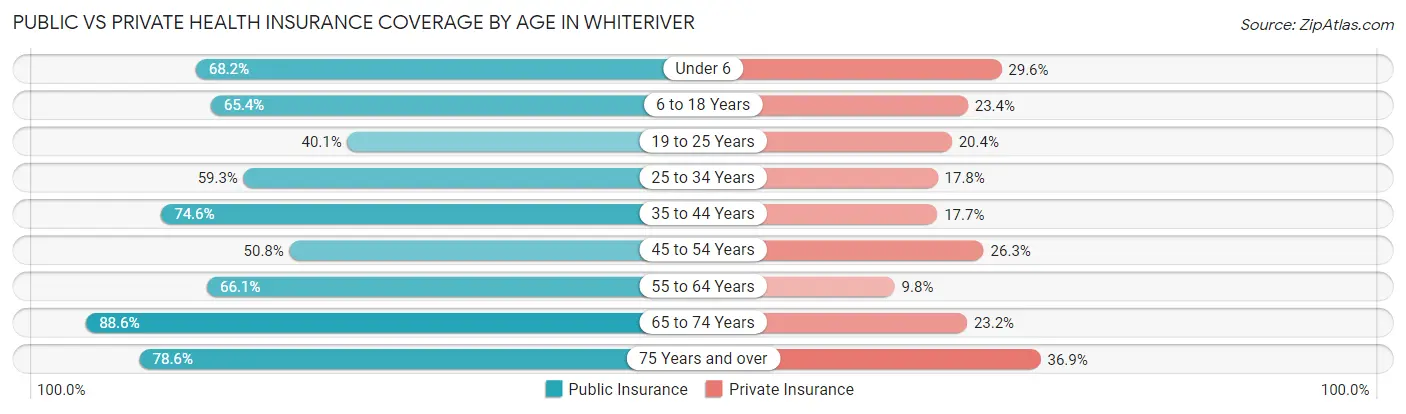
| Age Bracket | Public Insurance | Private Insurance |
| Under 6 | 251 (68.2%) | 109 (29.6%) |
| 6 to 18 Years | 677 (65.4%) | 242 (23.4%) |
| 19 to 25 Years | 155 (40.1%) | 79 (20.4%) |
| 25 to 34 Years | 267 (59.3%) | 80 (17.8%) |
| 35 to 44 Years | 497 (74.6%) | 118 (17.7%) |
| 45 to 54 Years | 220 (50.8%) | 114 (26.3%) |
| 55 to 64 Years | 283 (66.1%) | 42 (9.8%) |
| 65 to 74 Years | 263 (88.5%) | 69 (23.2%) |
| 75 Years and over | 81 (78.6%) | 38 (36.9%) |
| Total | 2,694 (64.6%) | 891 (21.4%) |
Disability Status by Sex by Age in Whiteriver
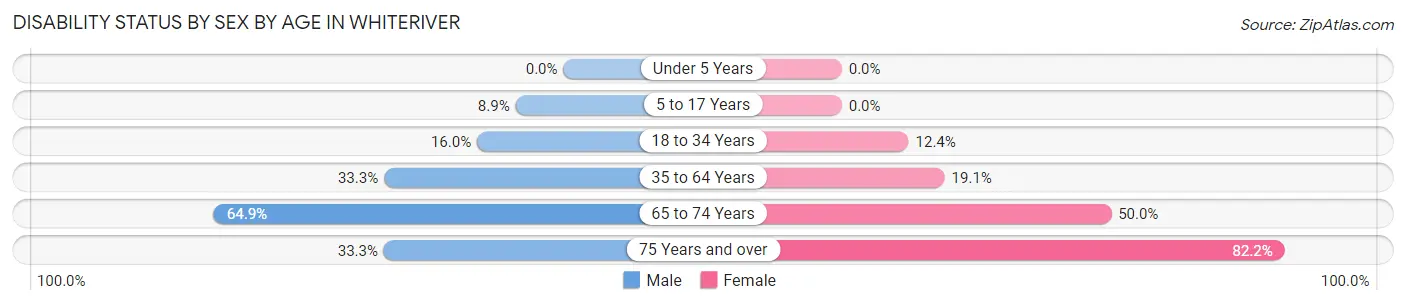
| Age Bracket | Male | Female |
| Under 5 Years | 0 (0.0%) | 0 (0.0%) |
| 5 to 17 Years | 53 (8.9%) | 0 (0.0%) |
| 18 to 34 Years | 67 (16.0%) | 60 (12.4%) |
| 35 to 64 Years | 273 (33.3%) | 135 (19.1%) |
| 65 to 74 Years | 72 (64.9%) | 93 (50.0%) |
| 75 Years and over | 10 (33.3%) | 60 (82.2%) |
Disability Class by Sex by Age in Whiteriver
Disability Class: Hearing Difficulty
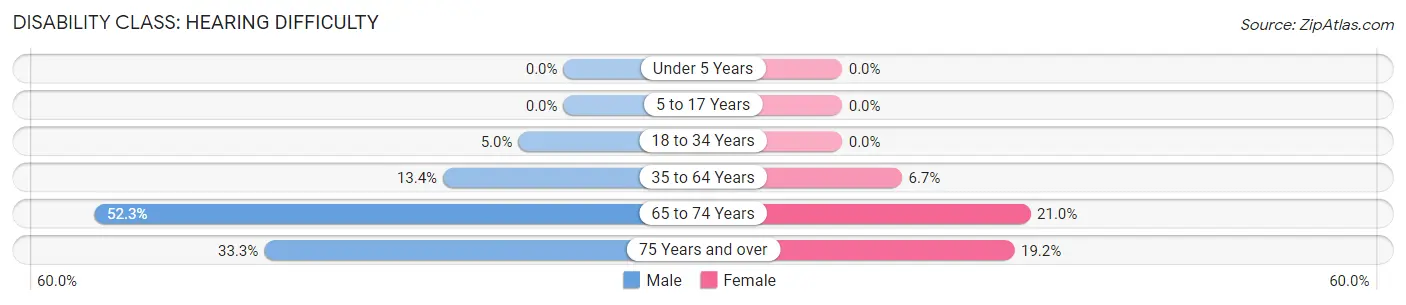
| Age Bracket | Male | Female |
| Under 5 Years | 0 (0.0%) | 0 (0.0%) |
| 5 to 17 Years | 0 (0.0%) | 0 (0.0%) |
| 18 to 34 Years | 21 (5.0%) | 0 (0.0%) |
| 35 to 64 Years | 110 (13.4%) | 47 (6.7%) |
| 65 to 74 Years | 58 (52.2%) | 39 (21.0%) |
| 75 Years and over | 10 (33.3%) | 14 (19.2%) |
Disability Class: Vision Difficulty
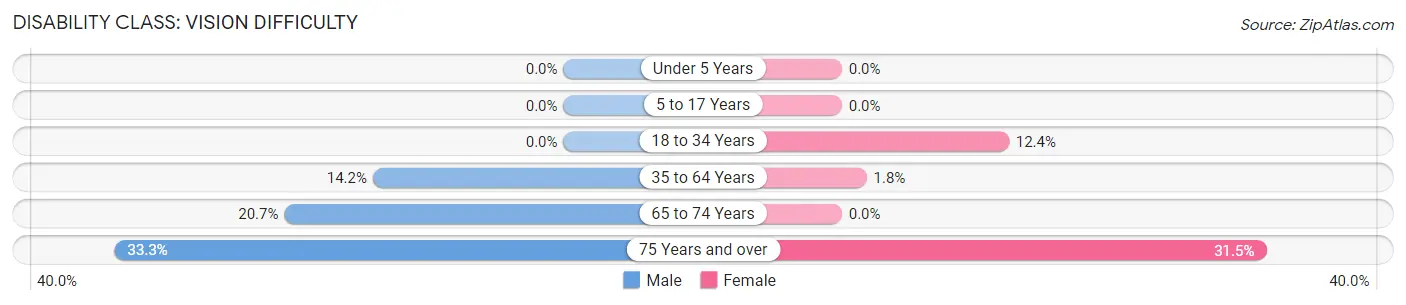
| Age Bracket | Male | Female |
| Under 5 Years | 0 (0.0%) | 0 (0.0%) |
| 5 to 17 Years | 0 (0.0%) | 0 (0.0%) |
| 18 to 34 Years | 0 (0.0%) | 60 (12.4%) |
| 35 to 64 Years | 116 (14.1%) | 13 (1.8%) |
| 65 to 74 Years | 23 (20.7%) | 0 (0.0%) |
| 75 Years and over | 10 (33.3%) | 23 (31.5%) |
Disability Class: Cognitive Difficulty
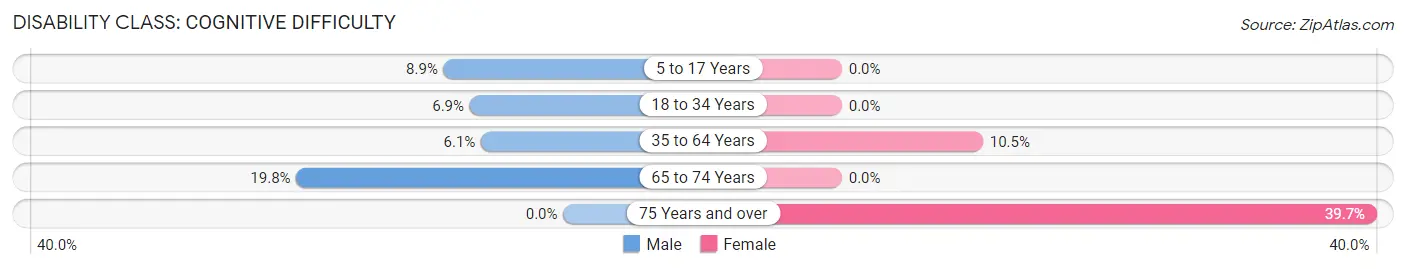
| Age Bracket | Male | Female |
| 5 to 17 Years | 53 (8.9%) | 0 (0.0%) |
| 18 to 34 Years | 29 (6.9%) | 0 (0.0%) |
| 35 to 64 Years | 50 (6.1%) | 74 (10.5%) |
| 65 to 74 Years | 22 (19.8%) | 0 (0.0%) |
| 75 Years and over | 0 (0.0%) | 29 (39.7%) |
Disability Class: Ambulatory Difficulty
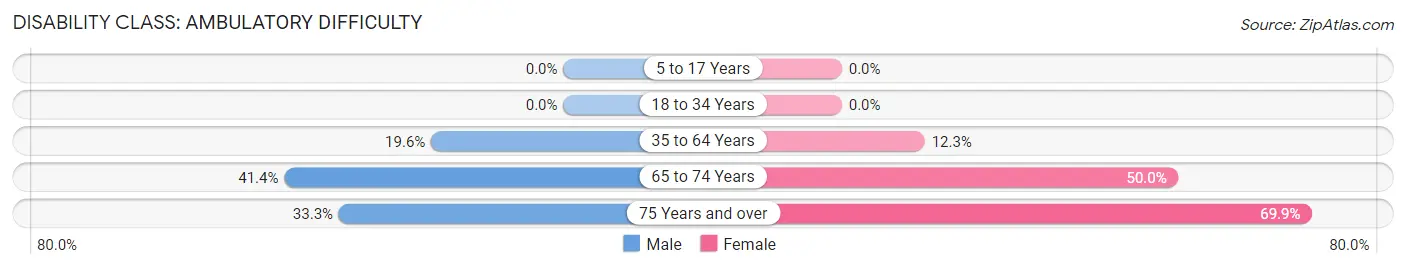
| Age Bracket | Male | Female |
| 5 to 17 Years | 0 (0.0%) | 0 (0.0%) |
| 18 to 34 Years | 0 (0.0%) | 0 (0.0%) |
| 35 to 64 Years | 161 (19.6%) | 87 (12.3%) |
| 65 to 74 Years | 46 (41.4%) | 93 (50.0%) |
| 75 Years and over | 10 (33.3%) | 51 (69.9%) |
Disability Class: Self-Care Difficulty
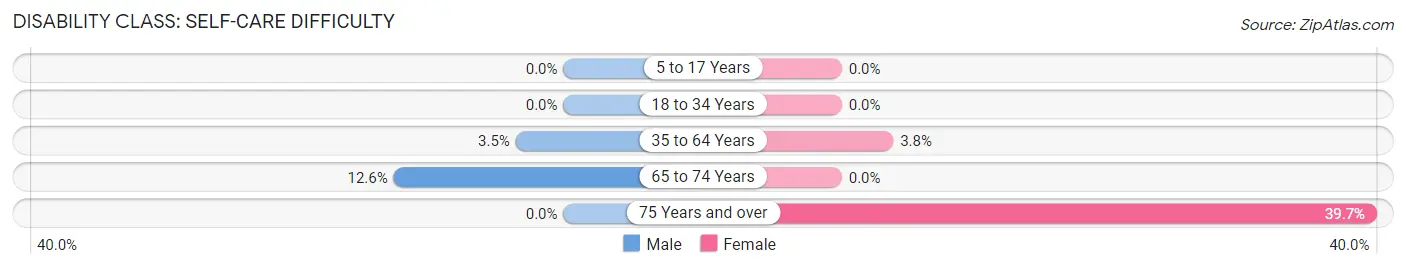
| Age Bracket | Male | Female |
| 5 to 17 Years | 0 (0.0%) | 0 (0.0%) |
| 18 to 34 Years | 0 (0.0%) | 0 (0.0%) |
| 35 to 64 Years | 29 (3.5%) | 27 (3.8%) |
| 65 to 74 Years | 14 (12.6%) | 0 (0.0%) |
| 75 Years and over | 0 (0.0%) | 29 (39.7%) |
Technology Access in Whiteriver
Computing Device Access in Whiteriver
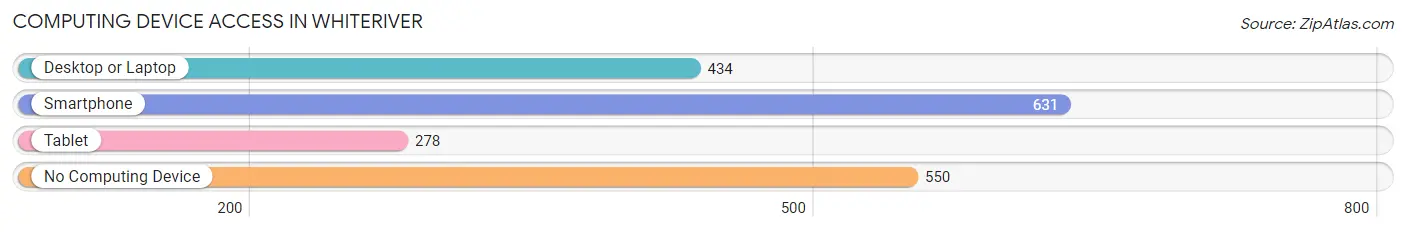
| Device Type | # Households | % Households |
| Desktop or Laptop | 434 | 34.3% |
| Smartphone | 631 | 49.8% |
| Tablet | 278 | 21.9% |
| No Computing Device | 550 | 43.4% |
| Total | 1,267 | 100.0% |
Internet Access in Whiteriver
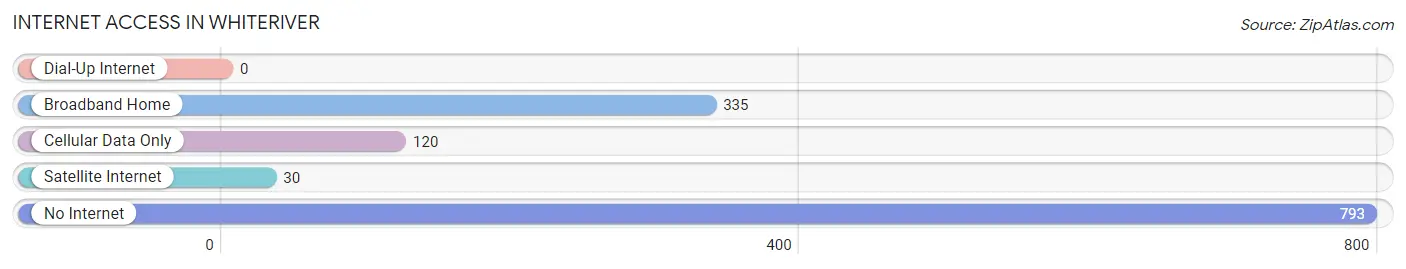
| Internet Type | # Households | % Households |
| Dial-Up Internet | 0 | 0.0% |
| Broadband Home | 335 | 26.4% |
| Cellular Data Only | 120 | 9.5% |
| Satellite Internet | 30 | 2.4% |
| No Internet | 793 | 62.6% |
| Total | 1,267 | 100.0% |
Whiteriver Summary
Whiteriver, Arizona is a small town located in the White Mountains of Arizona, near the Apache-Sitgreaves National Forest. It is the capital of the White Mountain Apache Tribe, and is home to approximately 2,500 people. The town is located in Navajo County, and is part of the Fort Apache Indian Reservation.
History
Whiteriver was originally inhabited by the White Mountain Apache Tribe, who have lived in the area for centuries. The tribe was first encountered by Spanish explorers in the late 1600s, and the area was later settled by the U.S. government in the late 1800s. The town was officially established in 1891, and was named after the nearby White River.
In the early 1900s, the town was a popular tourist destination, and was home to several resorts and hotels. The town was also home to a number of trading posts, which served as a hub for the local economy.
In the mid-1900s, the town began to decline as the local economy shifted away from tourism and towards agriculture. The town was also affected by the construction of the nearby Theodore Roosevelt Dam, which flooded much of the surrounding area.
Geography
Whiteriver is located in the White Mountains of Arizona, near the Apache-Sitgreaves National Forest. The town is situated at an elevation of 5,400 feet, and is surrounded by mountains and forests. The town is located in Navajo County, and is part of the Fort Apache Indian Reservation.
The town is located near several major highways, including Interstate 40, U.S. Route 60, and U.S. Route 191. The town is also located near several major cities, including Flagstaff, Phoenix, and Tucson.
Economy
The economy of Whiteriver is largely based on agriculture and tourism. The town is home to several farms and ranches, which produce a variety of crops, including hay, corn, and alfalfa. The town is also home to several tourist attractions, including the White Mountain Apache Cultural Center and Museum, the White Mountain Apache Tribal Museum, and the Theodore Roosevelt Dam.
The town is also home to several businesses, including restaurants, hotels, and retail stores. The town is also home to several government offices, including the White Mountain Apache Tribal Council and the White Mountain Apache Tribal Court.
Demographics
As of the 2010 census, the population of Whiteriver was 2,500. The town is predominantly Native American, with the White Mountain Apache Tribe making up the majority of the population. The town is also home to a small Hispanic population, as well as a small number of other ethnicities.
The median household income in Whiteriver is $25,000, and the median home value is $90,000. The town has a poverty rate of 28%, and the unemployment rate is 8%. The town is served by the White Mountain Apache School District, which includes two elementary schools, one middle school, and one high school.
Common Questions
What is Per Capita Income in Whiteriver?
Per Capita income in Whiteriver is $13,433.
What is the Median Family Income in Whiteriver?
Median Family Income in Whiteriver is $39,263.
What is the Median Household income in Whiteriver?
Median Household Income in Whiteriver is $37,165.
What is Income or Wage Gap in Whiteriver?
Income or Wage Gap in Whiteriver is 3.9%.
Women in Whiteriver earn 96.1 cents for every dollar earned by a man.
What is Family Income Deficit in Whiteriver?
Family Income Deficit in Whiteriver is $12,733.
Families that are below poverty line in Whiteriver earn $12,733 less on average than the poverty threshold level.
What is Inequality or Gini Index in Whiteriver?
Inequality or Gini Index in Whiteriver is 0.47.
What is the Total Population of Whiteriver?
Total Population of Whiteriver is 4,284.
What is the Total Male Population of Whiteriver?
Total Male Population of Whiteriver is 2,216.
What is the Total Female Population of Whiteriver?
Total Female Population of Whiteriver is 2,068.
What is the Ratio of Males per 100 Females in Whiteriver?
There are 107.16 Males per 100 Females in Whiteriver.
What is the Ratio of Females per 100 Males in Whiteriver?
There are 93.32 Females per 100 Males in Whiteriver.
What is the Median Population Age in Whiteriver?
Median Population Age in Whiteriver is 32.2 Years.
What is the Average Family Size in Whiteriver
Average Family Size in Whiteriver is 3.7 People.
What is the Average Household Size in Whiteriver
Average Household Size in Whiteriver is 3.3 People.
How Large is the Labor Force in Whiteriver?
There are 1,140 People in the Labor Forcein in Whiteriver.
What is the Percentage of People in the Labor Force in Whiteriver?
37.4% of People are in the Labor Force in Whiteriver.
What is the Unemployment Rate in Whiteriver?
Unemployment Rate in Whiteriver is 9.3%.