Gila Bend, AZ Map & Demographics
Gila Bend Map
Gila Bend Overview
$27,947
PER CAPITA INCOME
$63,641
AVG FAMILY INCOME
$52,879
AVG HOUSEHOLD INCOME
59.7%
WAGE / INCOME GAP [ % ]
40.3¢/ $1
WAGE / INCOME GAP [ $ ]
$11,510
FAMILY INCOME DEFICIT
0.46
INEQUALITY / GINI INDEX
1,783
TOTAL POPULATION
1,036
MALE POPULATION
747
FEMALE POPULATION
138.69
MALES / 100 FEMALES
72.10
FEMALES / 100 MALES
39.9
MEDIAN AGE
3.1
AVG FAMILY SIZE
2.5
AVG HOUSEHOLD SIZE
902
LABOR FORCE [ PEOPLE ]
63.4%
PERCENT IN LABOR FORCE
Gila Bend Zip Codes
Gila Bend Area Codes
Income in Gila Bend
Income Overview in Gila Bend
Per Capita Income in Gila Bend is $27,947, while median incomes of families and households are $63,641 and $52,879 respectively.
| Characteristic | Number | Measure |
| Per Capita Income | 1,783 | $27,947 |
| Median Family Income | 415 | $63,641 |
| Mean Family Income | 415 | $66,247 |
| Median Household Income | 716 | $52,879 |
| Mean Household Income | 716 | $69,351 |
| Income Deficit | 415 | $11,510 |
| Wage / Income Gap (%) | 1,783 | 59.71% |
| Wage / Income Gap ($) | 1,783 | 40.29¢ per $1 |
| Gini / Inequality Index | 1,783 | 0.46 |
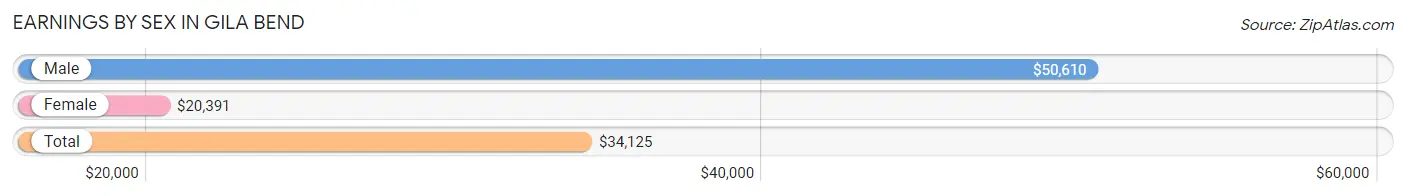
Earnings by Sex in Gila Bend
Average Earnings in Gila Bend are $34,125, $50,610 for men and $20,391 for women, a difference of 59.7%.
| Sex | Number | Average Earnings |
| Male | 651 (69.9%) | $50,610 |
| Female | 281 (30.1%) | $20,391 |
| Total | 932 (100.0%) | $34,125 |
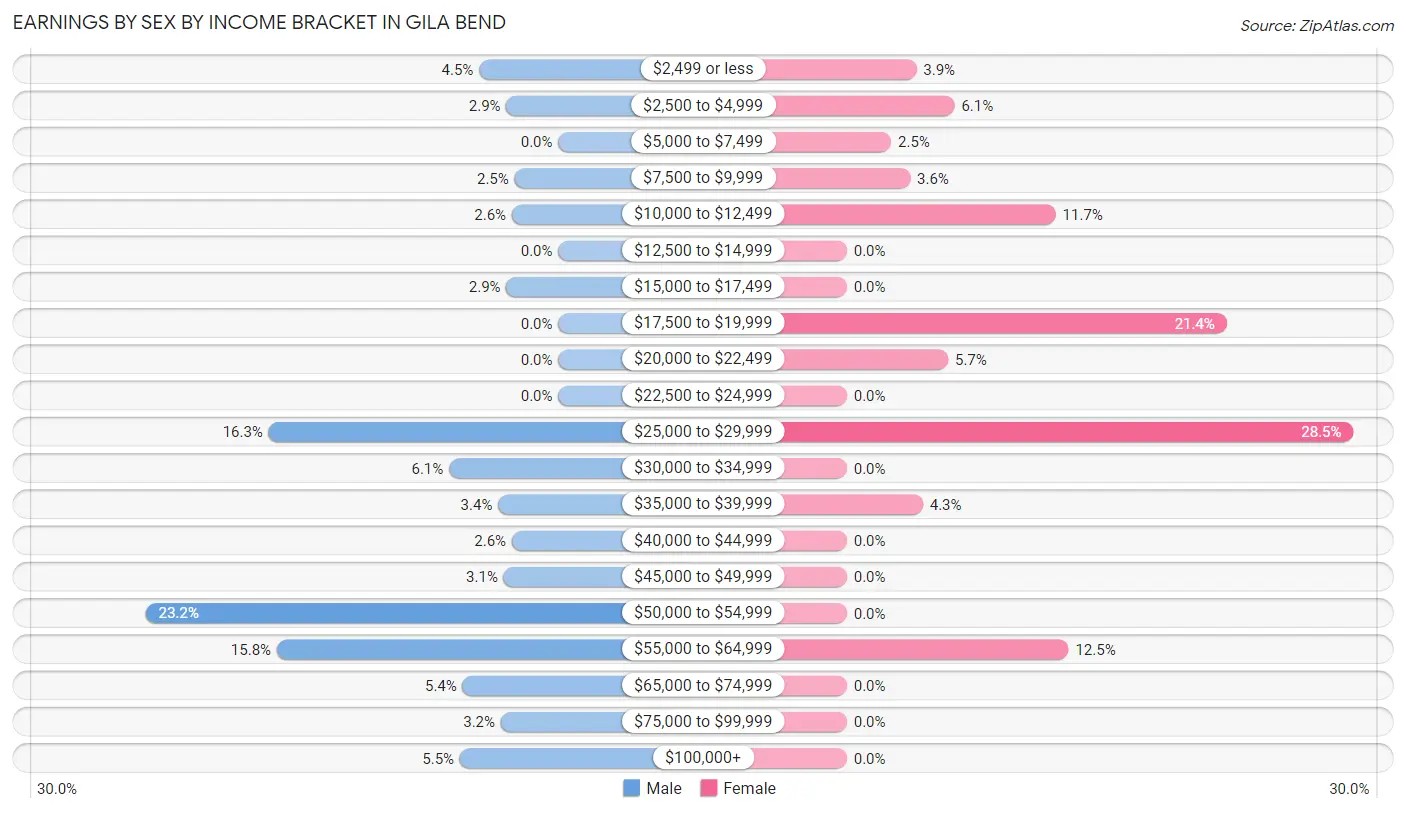
Earnings by Sex by Income Bracket in Gila Bend
The most common earnings brackets in Gila Bend are $50,000 to $54,999 for men (151 | 23.2%) and $25,000 to $29,999 for women (80 | 28.5%).
| Income | Male | Female |
| $2,499 or less | 29 (4.4%) | 11 (3.9%) |
| $2,500 to $4,999 | 19 (2.9%) | 17 (6.0%) |
| $5,000 to $7,499 | 0 (0.0%) | 7 (2.5%) |
| $7,500 to $9,999 | 16 (2.5%) | 10 (3.6%) |
| $10,000 to $12,499 | 17 (2.6%) | 33 (11.7%) |
| $12,500 to $14,999 | 0 (0.0%) | 0 (0.0%) |
| $15,000 to $17,499 | 19 (2.9%) | 0 (0.0%) |
| $17,500 to $19,999 | 0 (0.0%) | 60 (21.3%) |
| $20,000 to $22,499 | 0 (0.0%) | 16 (5.7%) |
| $22,500 to $24,999 | 0 (0.0%) | 0 (0.0%) |
| $25,000 to $29,999 | 106 (16.3%) | 80 (28.5%) |
| $30,000 to $34,999 | 40 (6.1%) | 0 (0.0%) |
| $35,000 to $39,999 | 22 (3.4%) | 12 (4.3%) |
| $40,000 to $44,999 | 17 (2.6%) | 0 (0.0%) |
| $45,000 to $49,999 | 20 (3.1%) | 0 (0.0%) |
| $50,000 to $54,999 | 151 (23.2%) | 0 (0.0%) |
| $55,000 to $64,999 | 103 (15.8%) | 35 (12.5%) |
| $65,000 to $74,999 | 35 (5.4%) | 0 (0.0%) |
| $75,000 to $99,999 | 21 (3.2%) | 0 (0.0%) |
| $100,000+ | 36 (5.5%) | 0 (0.0%) |
| Total | 651 (100.0%) | 281 (100.0%) |
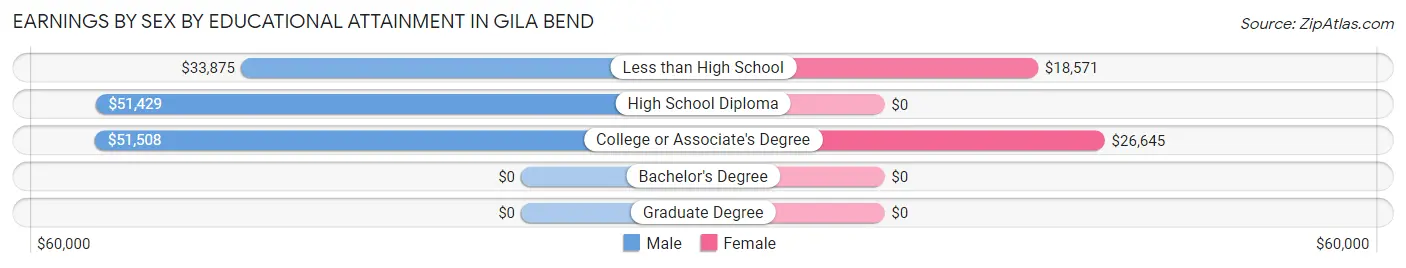
Earnings by Sex by Educational Attainment in Gila Bend
Average earnings in Gila Bend are $51,488 for men and $25,343 for women, a difference of 50.8%. Men with an educational attainment of college or associate's degree enjoy the highest average annual earnings of $51,508, while those with less than high school education earn the least with $33,875. Women with an educational attainment of college or associate's degree earn the most with the average annual earnings of $26,645, while those with less than high school education have the smallest earnings of $18,571.
| Educational Attainment | Male Income | Female Income |
| Less than High School | $33,875 | $18,571 |
| High School Diploma | $51,429 | $0 |
| College or Associate's Degree | $51,508 | $26,645 |
| Bachelor's Degree | - | - |
| Graduate Degree | - | - |
| Total | $51,488 | $25,343 |
Family Income in Gila Bend
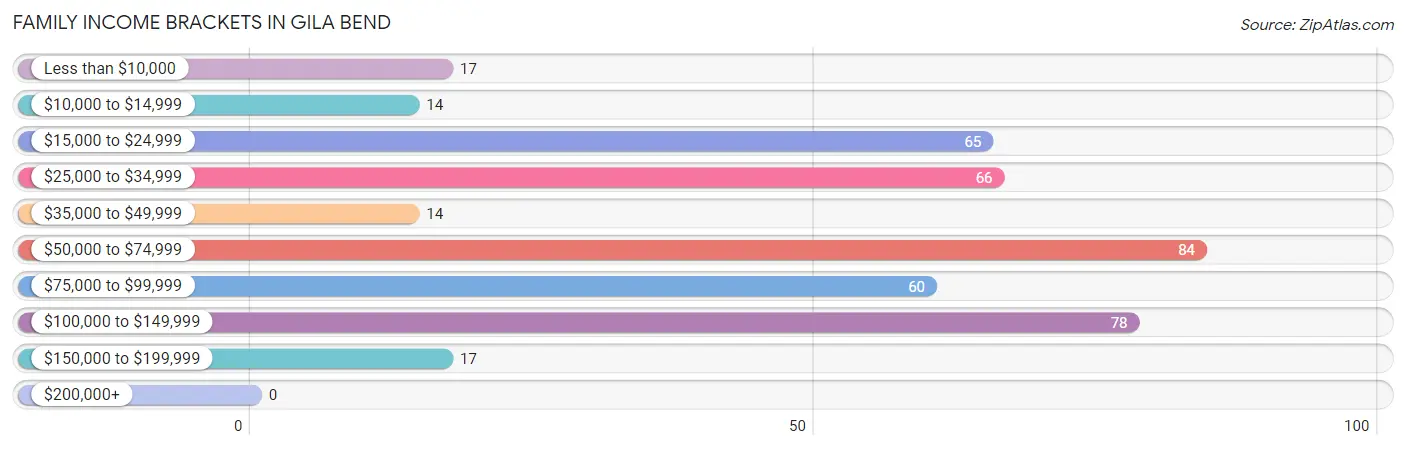
Family Income Brackets in Gila Bend
According to the Gila Bend family income data, there are 84 families falling into the $50,000 to $74,999 income range, which is the most common income bracket and makes up 20.2% of all families.
| Income Bracket | # Families | % Families |
| Less than $10,000 | 17 | 4.1% |
| $10,000 to $14,999 | 14 | 3.4% |
| $15,000 to $24,999 | 65 | 15.7% |
| $25,000 to $34,999 | 66 | 15.9% |
| $35,000 to $49,999 | 14 | 3.4% |
| $50,000 to $74,999 | 84 | 20.2% |
| $75,000 to $99,999 | 60 | 14.5% |
| $100,000 to $149,999 | 78 | 18.8% |
| $150,000 to $199,999 | 17 | 4.1% |
| $200,000+ | 0 | 0.0% |
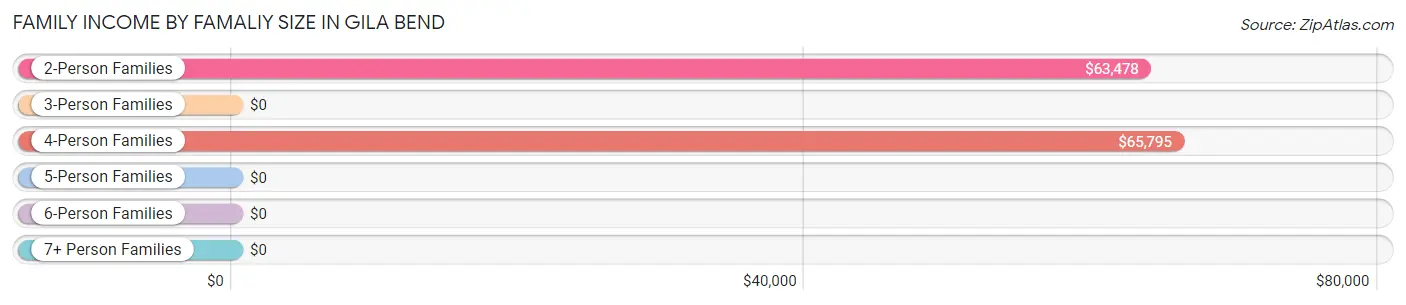
Family Income by Famaliy Size in Gila Bend
4-person families (66 | 15.9%) account for the highest median family income in Gila Bend with $65,795 per family, while 2-person families (190 | 45.8%) have the highest median income of $31,739 per family member.
| Income Bracket | # Families | Median Income |
| 2-Person Families | 190 (45.8%) | $63,478 |
| 3-Person Families | 121 (29.2%) | $0 |
| 4-Person Families | 66 (15.9%) | $65,795 |
| 5-Person Families | 12 (2.9%) | $0 |
| 6-Person Families | 19 (4.6%) | $0 |
| 7+ Person Families | 7 (1.7%) | $0 |
| Total | 415 (100.0%) | $63,641 |
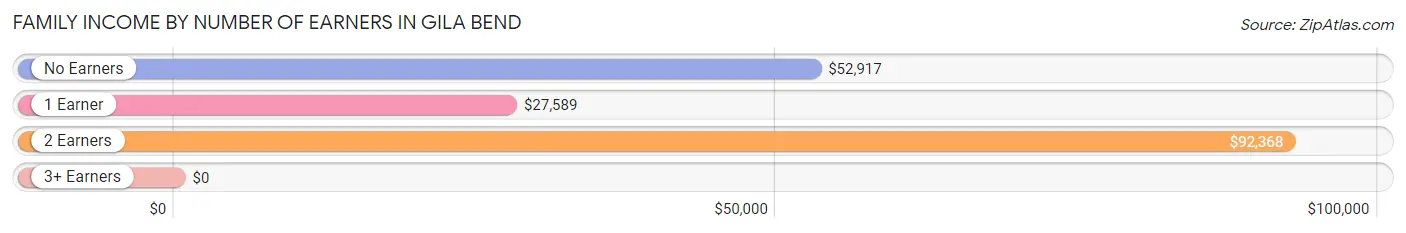
Family Income by Number of Earners in Gila Bend
| Number of Earners | # Families | Median Income |
| No Earners | 43 (10.4%) | $52,917 |
| 1 Earner | 166 (40.0%) | $27,589 |
| 2 Earners | 170 (41.0%) | $92,368 |
| 3+ Earners | 36 (8.7%) | $0 |
| Total | 415 (100.0%) | $63,641 |
Household Income in Gila Bend
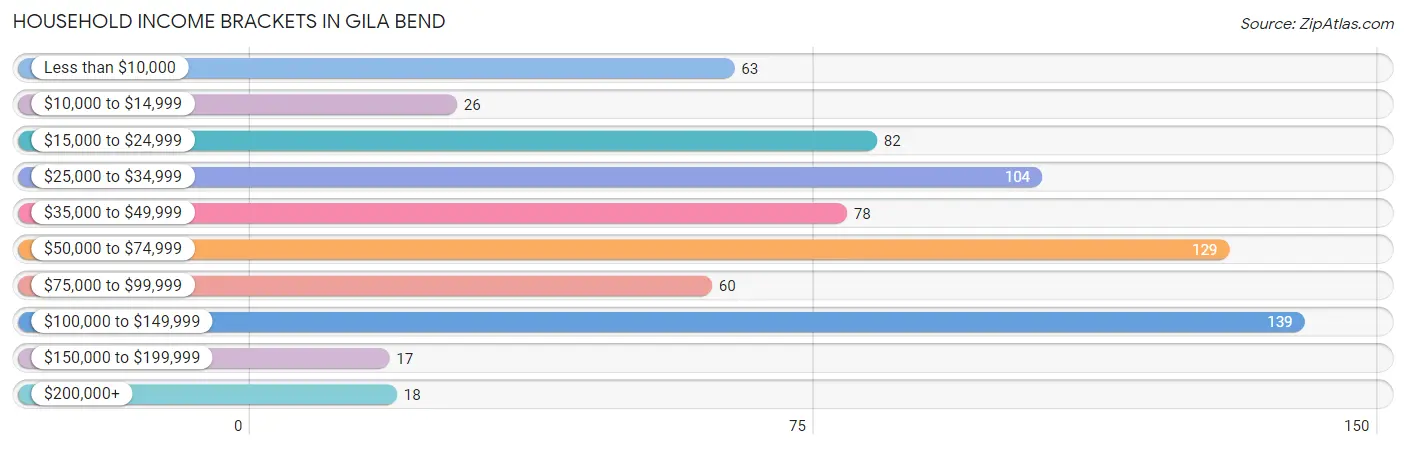
Household Income Brackets in Gila Bend
With 139 households falling in the category, the $100,000 to $149,999 income range is the most frequent in Gila Bend, accounting for 19.4% of all households. In contrast, only 17 households (2.4%) fall into the $150,000 to $199,999 income bracket, making it the least populous group.
| Income Bracket | # Households | % Households |
| Less than $10,000 | 63 | 8.8% |
| $10,000 to $14,999 | 26 | 3.6% |
| $15,000 to $24,999 | 82 | 11.5% |
| $25,000 to $34,999 | 104 | 14.5% |
| $35,000 to $49,999 | 78 | 10.9% |
| $50,000 to $74,999 | 129 | 18.0% |
| $75,000 to $99,999 | 60 | 8.4% |
| $100,000 to $149,999 | 139 | 19.4% |
| $150,000 to $199,999 | 17 | 2.4% |
| $200,000+ | 18 | 2.5% |
Household Income by Householder Age in Gila Bend
The median household income in Gila Bend is $52,879, with the highest median household income of $66,875 found in the 45 to 64 years age bracket for the primary householder. A total of 281 households (39.3%) fall into this category. Meanwhile, the 15 to 24 years age bracket for the primary householder has the lowest median household income of $0, with 33 households (4.6%) in this group.
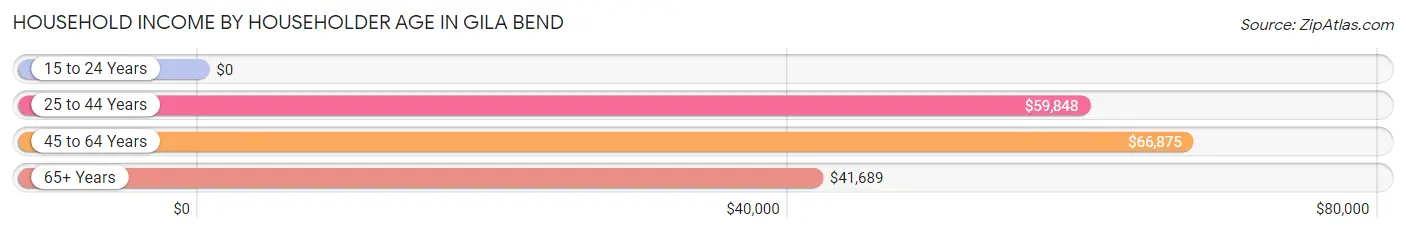
| Income Bracket | # Households | Median Income |
| 15 to 24 Years | 33 (4.6%) | $0 |
| 25 to 44 Years | 190 (26.5%) | $59,848 |
| 45 to 64 Years | 281 (39.3%) | $66,875 |
| 65+ Years | 212 (29.6%) | $41,689 |
| Total | 716 (100.0%) | $52,879 |
Poverty in Gila Bend
Income Below Poverty by Sex and Age in Gila Bend
With 29.0% poverty level for males and 47.7% for females among the residents of Gila Bend, 12 to 14 year old males and under 5 year old females are the most vulnerable to poverty, with 44 males (100.0%) and 34 females (100.0%) in their respective age groups living below the poverty level.
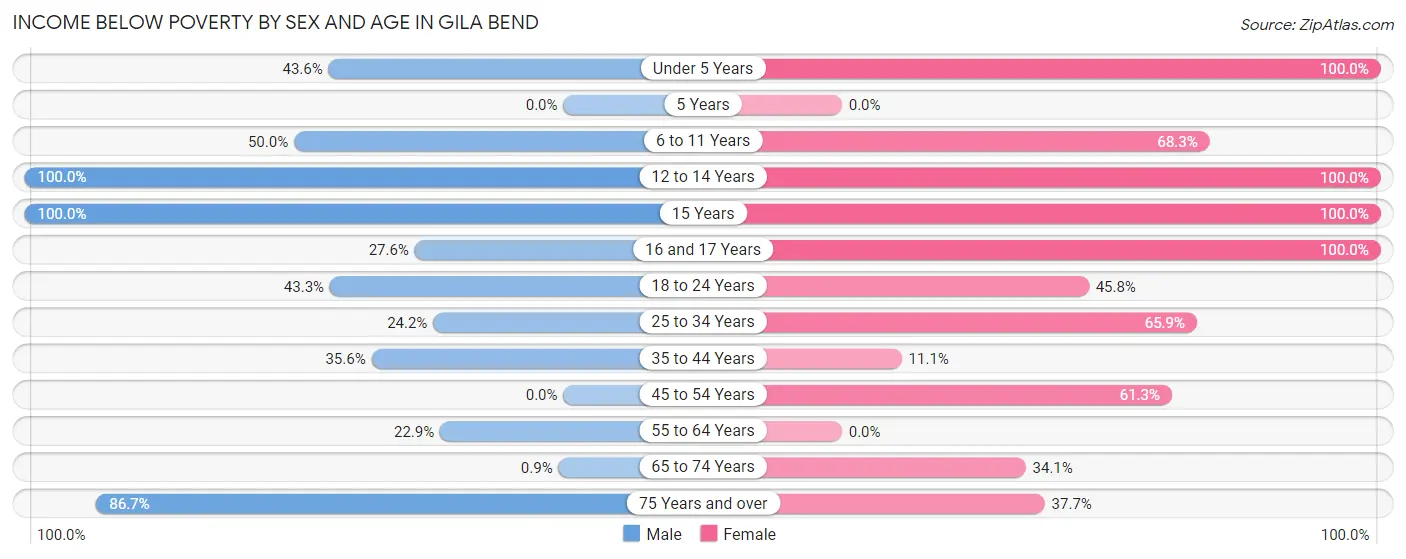
| Age Bracket | Male | Female |
| Under 5 Years | 17 (43.6%) | 34 (100.0%) |
| 5 Years | 0 (0.0%) | 0 (0.0%) |
| 6 to 11 Years | 56 (50.0%) | 43 (68.2%) |
| 12 to 14 Years | 44 (100.0%) | 37 (100.0%) |
| 15 Years | 18 (100.0%) | 14 (100.0%) |
| 16 and 17 Years | 8 (27.6%) | 19 (100.0%) |
| 18 to 24 Years | 13 (43.3%) | 33 (45.8%) |
| 25 to 34 Years | 36 (24.2%) | 56 (65.9%) |
| 35 to 44 Years | 47 (35.6%) | 10 (11.1%) |
| 45 to 54 Years | 0 (0.0%) | 49 (61.3%) |
| 55 to 64 Years | 35 (22.9%) | 0 (0.0%) |
| 65 to 74 Years | 1 (0.9%) | 29 (34.1%) |
| 75 Years and over | 26 (86.7%) | 32 (37.7%) |
| Total | 301 (29.0%) | 356 (47.7%) |
Income Above Poverty by Sex and Age in Gila Bend
According to the poverty statistics in Gila Bend, males aged 45 to 54 years and females aged 55 to 64 years are the age groups that are most secure financially, with 100.0% of males and 100.0% of females in these age groups living above the poverty line.
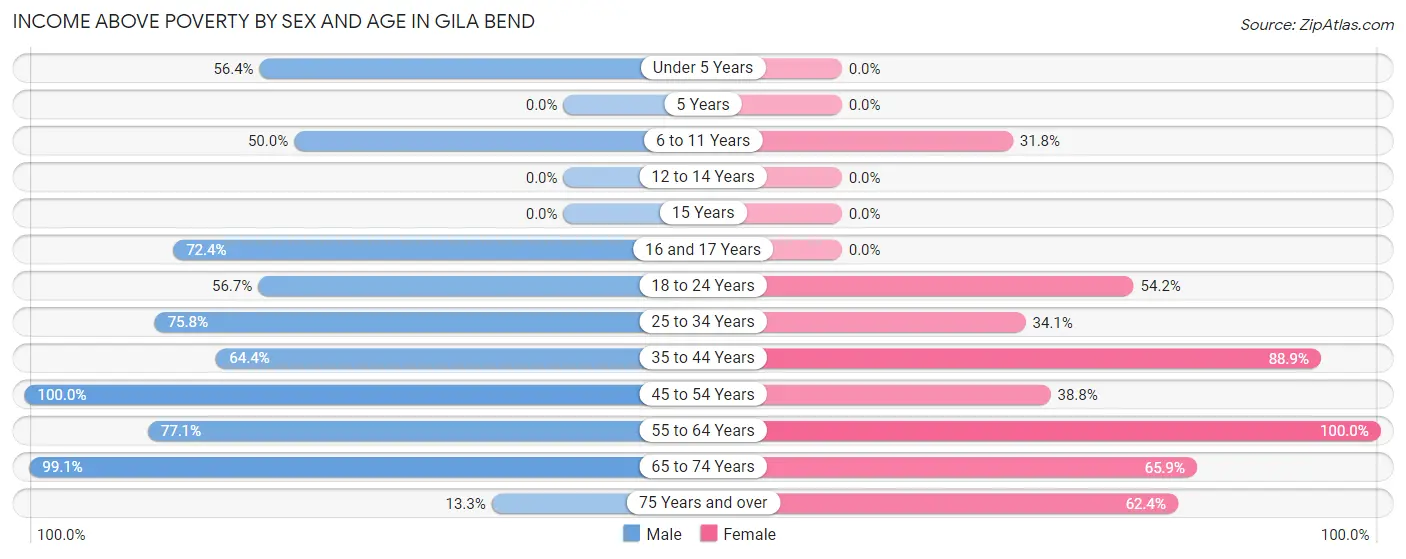
| Age Bracket | Male | Female |
| Under 5 Years | 22 (56.4%) | 0 (0.0%) |
| 5 Years | 0 (0.0%) | 0 (0.0%) |
| 6 to 11 Years | 56 (50.0%) | 20 (31.8%) |
| 12 to 14 Years | 0 (0.0%) | 0 (0.0%) |
| 15 Years | 0 (0.0%) | 0 (0.0%) |
| 16 and 17 Years | 21 (72.4%) | 0 (0.0%) |
| 18 to 24 Years | 17 (56.7%) | 39 (54.2%) |
| 25 to 34 Years | 113 (75.8%) | 29 (34.1%) |
| 35 to 44 Years | 85 (64.4%) | 80 (88.9%) |
| 45 to 54 Years | 189 (100.0%) | 31 (38.8%) |
| 55 to 64 Years | 118 (77.1%) | 83 (100.0%) |
| 65 to 74 Years | 110 (99.1%) | 56 (65.9%) |
| 75 Years and over | 4 (13.3%) | 53 (62.4%) |
| Total | 735 (71.0%) | 391 (52.3%) |
Income Below Poverty Among Married-Couple Families in Gila Bend
The poverty statistics for married-couple families in Gila Bend show that 15.1% or 46 of the total 304 families live below the poverty line. Families with 3 or 4 children have the highest poverty rate of 100.0%, comprising of 19 families. On the other hand, families with no children have the lowest poverty rate of 1.8%, which includes 4 families.
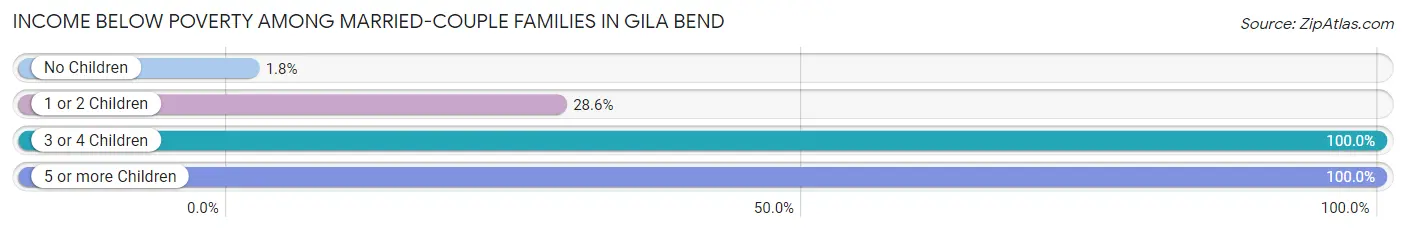
| Children | Above Poverty | Below Poverty |
| No Children | 218 (98.2%) | 4 (1.8%) |
| 1 or 2 Children | 40 (71.4%) | 16 (28.6%) |
| 3 or 4 Children | 0 (0.0%) | 19 (100.0%) |
| 5 or more Children | 0 (0.0%) | 7 (100.0%) |
| Total | 258 (84.9%) | 46 (15.1%) |
Income Below Poverty Among Single-Parent Households in Gila Bend
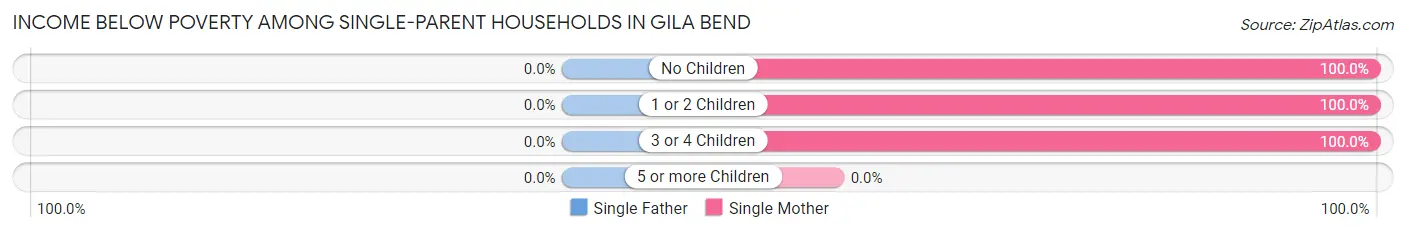
| Children | Single Father | Single Mother |
| No Children | 0 (0.0%) | 30 (100.0%) |
| 1 or 2 Children | 0 (0.0%) | 17 (100.0%) |
| 3 or 4 Children | 0 (0.0%) | 22 (100.0%) |
| 5 or more Children | 0 (0.0%) | 0 (0.0%) |
| Total | 0 (0.0%) | 69 (100.0%) |
Income Below Poverty Among Married-Couple vs Single-Parent Households in Gila Bend
The poverty data for Gila Bend shows that 46 of the married-couple family households (15.1%) and 69 of the single-parent households (62.2%) are living below the poverty level. Within the married-couple family households, those with 3 or 4 children have the highest poverty rate, with 19 households (100.0%) falling below the poverty line. Among the single-parent households, those with no children have the highest poverty rate, with 30 household (100.0%) living below poverty.
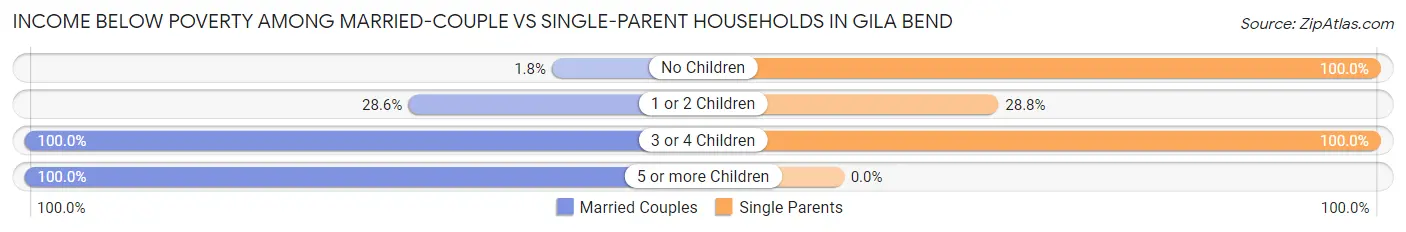
| Children | Married-Couple Families | Single-Parent Households |
| No Children | 4 (1.8%) | 30 (100.0%) |
| 1 or 2 Children | 16 (28.6%) | 17 (28.8%) |
| 3 or 4 Children | 19 (100.0%) | 22 (100.0%) |
| 5 or more Children | 7 (100.0%) | 0 (0.0%) |
| Total | 46 (15.1%) | 69 (62.2%) |
Race in Gila Bend
The most populous races in Gila Bend are Hispanic or Latino (1,173 | 65.8%), White / Caucasian (892 | 50.0%), and Some other Race (536 | 30.1%).
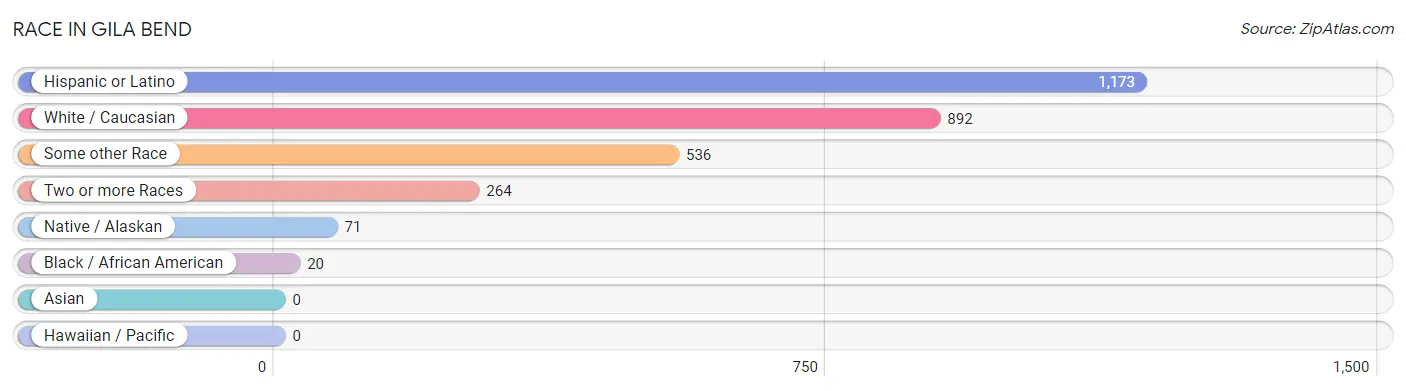
| Race | # Population | % Population |
| Asian | 0 | 0.0% |
| Black / African American | 20 | 1.1% |
| Hawaiian / Pacific | 0 | 0.0% |
| Hispanic or Latino | 1,173 | 65.8% |
| Native / Alaskan | 71 | 4.0% |
| White / Caucasian | 892 | 50.0% |
| Two or more Races | 264 | 14.8% |
| Some other Race | 536 | 30.1% |
| Total | 1,783 | 100.0% |
Ancestry in Gila Bend
The most populous ancestries reported in Gila Bend are Mexican (1,099 | 61.6%), German (167 | 9.4%), English (70 | 3.9%), Dutch (56 | 3.1%), and Irish (45 | 2.5%), together accounting for 80.6% of all Gila Bend residents.
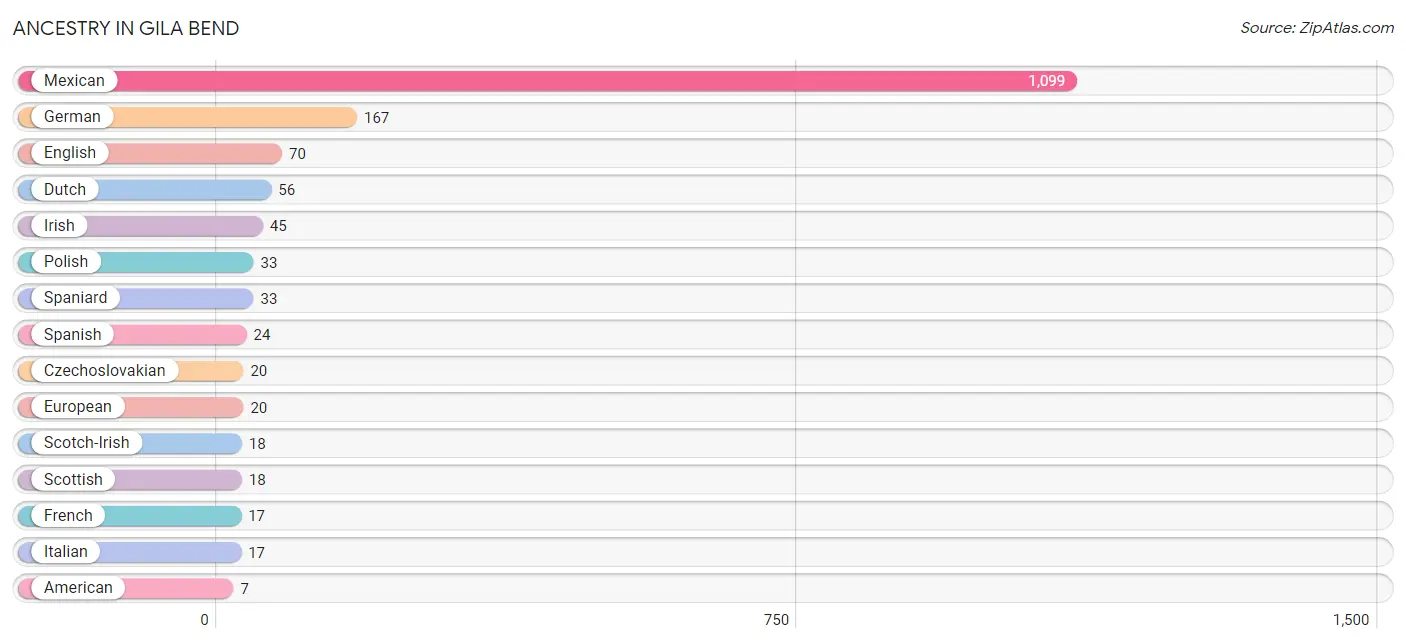
| Ancestry | # Population | % Population |
| American | 7 | 0.4% |
| Czechoslovakian | 20 | 1.1% |
| Dutch | 56 | 3.1% |
| English | 70 | 3.9% |
| European | 20 | 1.1% |
| French | 17 | 0.9% |
| German | 167 | 9.4% |
| Hungarian | 5 | 0.3% |
| Irish | 45 | 2.5% |
| Italian | 17 | 0.9% |
| Mexican | 1,099 | 61.6% |
| Polish | 33 | 1.8% |
| Scotch-Irish | 18 | 1.0% |
| Scottish | 18 | 1.0% |
| Spaniard | 33 | 1.8% |
| Spanish | 24 | 1.3% | View All 16 Rows |
Immigrants in Gila Bend
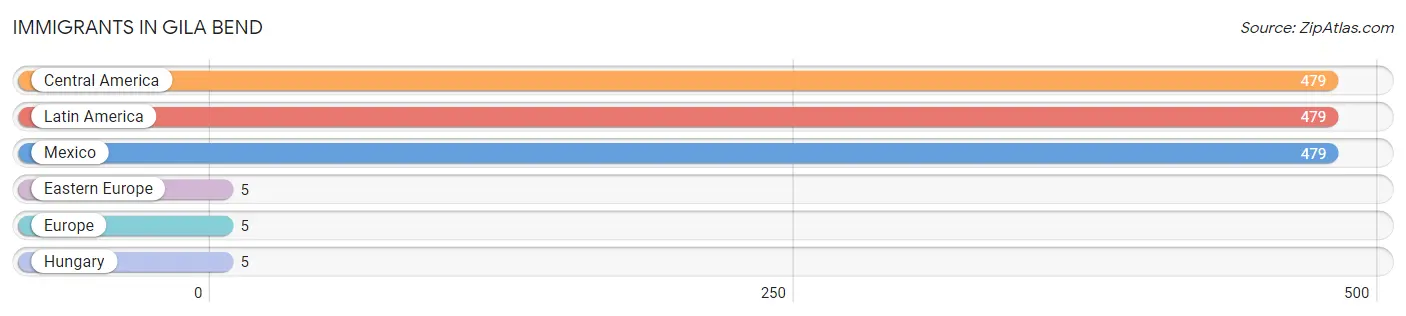
The most numerous immigrant groups reported in Gila Bend came from Central America (479 | 26.9%), Latin America (479 | 26.9%), Mexico (479 | 26.9%), Eastern Europe (5 | 0.3%), and Europe (5 | 0.3%), together accounting for 81.1% of all Gila Bend residents.
| Immigration Origin | # Population | % Population |
| Central America | 479 | 26.9% |
| Eastern Europe | 5 | 0.3% |
| Europe | 5 | 0.3% |
| Hungary | 5 | 0.3% |
| Latin America | 479 | 26.9% |
| Mexico | 479 | 26.9% | View All 6 Rows |
Sex and Age in Gila Bend
Sex and Age in Gila Bend
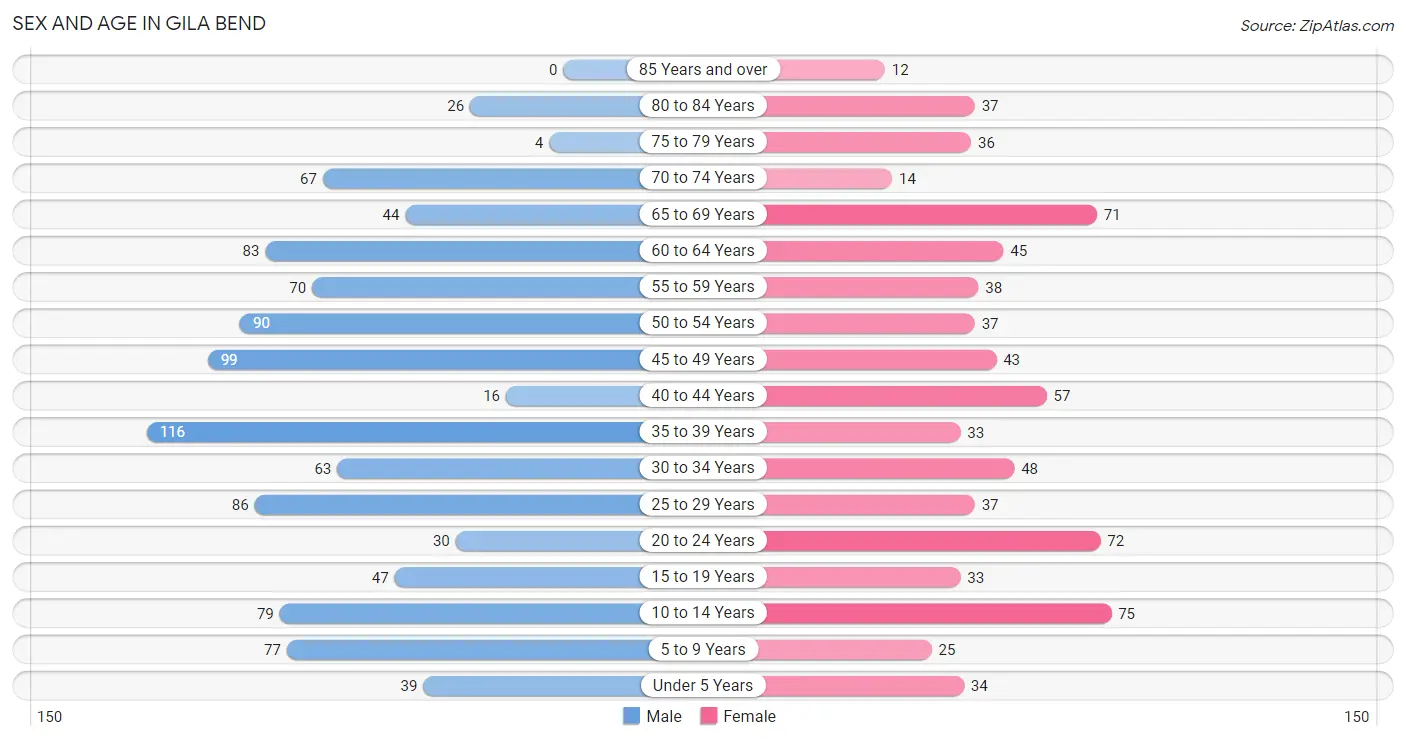
The most populous age groups in Gila Bend are 35 to 39 Years (116 | 11.2%) for men and 10 to 14 Years (75 | 10.0%) for women.
| Age Bracket | Male | Female |
| Under 5 Years | 39 (3.8%) | 34 (4.5%) |
| 5 to 9 Years | 77 (7.4%) | 25 (3.4%) |
| 10 to 14 Years | 79 (7.6%) | 75 (10.0%) |
| 15 to 19 Years | 47 (4.5%) | 33 (4.4%) |
| 20 to 24 Years | 30 (2.9%) | 72 (9.6%) |
| 25 to 29 Years | 86 (8.3%) | 37 (5.0%) |
| 30 to 34 Years | 63 (6.1%) | 48 (6.4%) |
| 35 to 39 Years | 116 (11.2%) | 33 (4.4%) |
| 40 to 44 Years | 16 (1.5%) | 57 (7.6%) |
| 45 to 49 Years | 99 (9.6%) | 43 (5.8%) |
| 50 to 54 Years | 90 (8.7%) | 37 (5.0%) |
| 55 to 59 Years | 70 (6.8%) | 38 (5.1%) |
| 60 to 64 Years | 83 (8.0%) | 45 (6.0%) |
| 65 to 69 Years | 44 (4.3%) | 71 (9.5%) |
| 70 to 74 Years | 67 (6.5%) | 14 (1.9%) |
| 75 to 79 Years | 4 (0.4%) | 36 (4.8%) |
| 80 to 84 Years | 26 (2.5%) | 37 (5.0%) |
| 85 Years and over | 0 (0.0%) | 12 (1.6%) |
| Total | 1,036 (100.0%) | 747 (100.0%) |
Families and Households in Gila Bend
Median Family Size in Gila Bend
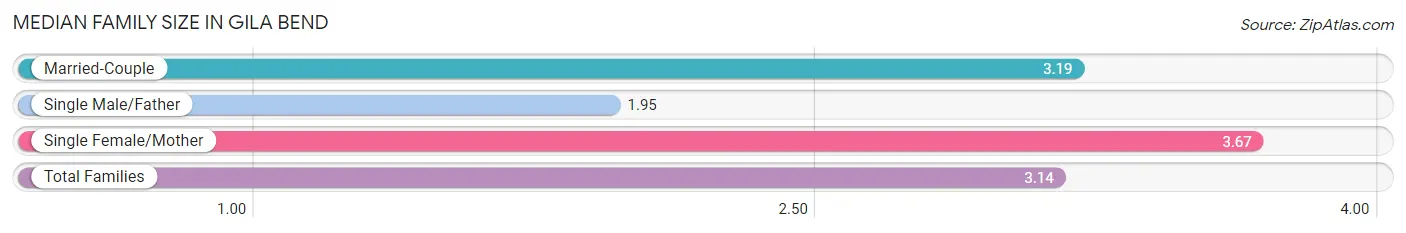
The median family size in Gila Bend is 3.14 persons per family, with single female/mother families (69 | 16.6%) accounting for the largest median family size of 3.67 persons per family. On the other hand, single male/father families (42 | 10.1%) represent the smallest median family size with 1.95 persons per family.
| Family Type | # Families | Family Size |
| Married-Couple | 304 (73.3%) | 3.19 |
| Single Male/Father | 42 (10.1%) | 1.95 |
| Single Female/Mother | 69 (16.6%) | 3.67 |
| Total Families | 415 (100.0%) | 3.14 |
Median Household Size in Gila Bend
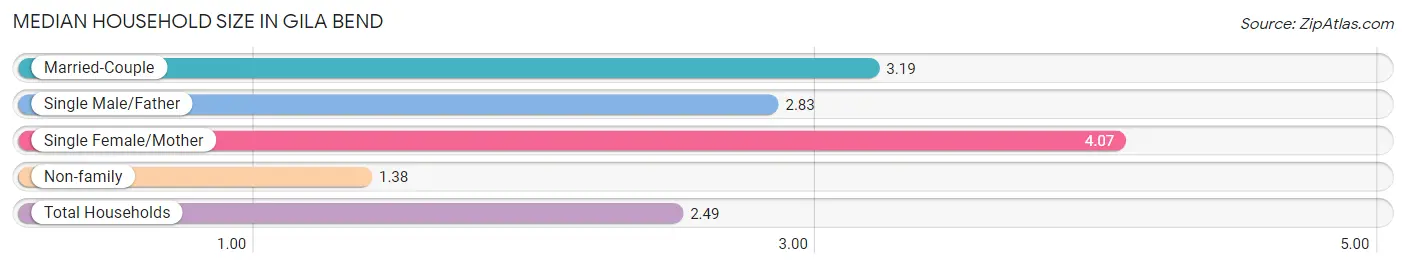
The median household size in Gila Bend is 2.49 persons per household, with single female/mother households (69 | 9.6%) accounting for the largest median household size of 4.07 persons per household. non-family households (301 | 42.0%) represent the smallest median household size with 1.38 persons per household.
| Household Type | # Households | Household Size |
| Married-Couple | 304 (42.5%) | 3.19 |
| Single Male/Father | 42 (5.9%) | 2.83 |
| Single Female/Mother | 69 (9.6%) | 4.07 |
| Non-family | 301 (42.0%) | 1.38 |
| Total Households | 716 (100.0%) | 2.49 |
Household Size by Marriage Status in Gila Bend
Out of a total of 716 households in Gila Bend, 415 (58.0%) are family households, while 301 (42.0%) are nonfamily households. The most numerous type of family households are 2-person households, comprising 148, and the most common type of nonfamily households are 1-person households, comprising 240.
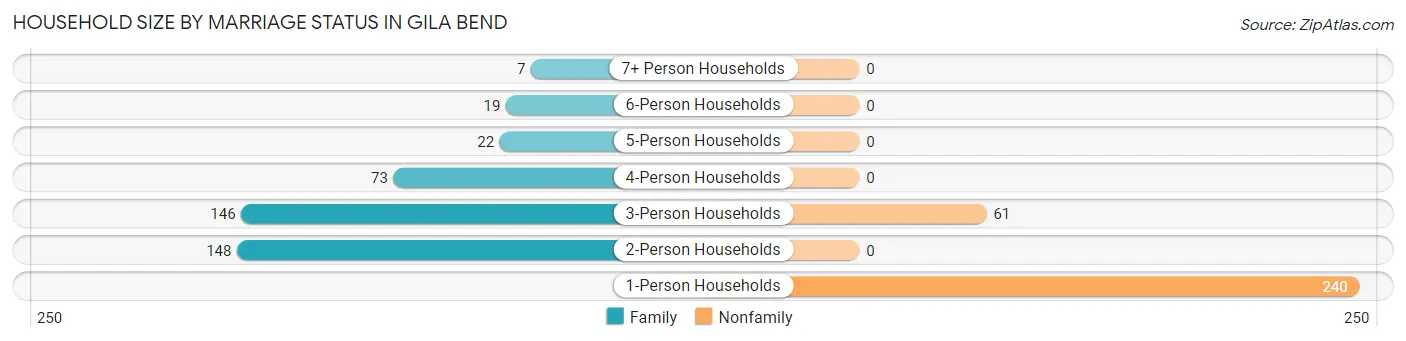
| Household Size | Family Households | Nonfamily Households |
| 1-Person Households | - | 240 (33.5%) |
| 2-Person Households | 148 (20.7%) | 0 (0.0%) |
| 3-Person Households | 146 (20.4%) | 61 (8.5%) |
| 4-Person Households | 73 (10.2%) | 0 (0.0%) |
| 5-Person Households | 22 (3.1%) | 0 (0.0%) |
| 6-Person Households | 19 (2.6%) | 0 (0.0%) |
| 7+ Person Households | 7 (1.0%) | 0 (0.0%) |
| Total | 415 (58.0%) | 301 (42.0%) |
Female Fertility in Gila Bend
Fertility by Age in Gila Bend
Average fertility rate in Gila Bend is 53.0 births per 1,000 women. Women in the age bracket of 20 to 34 years have the highest fertility rate with 108.0 births per 1,000 women. Women in the age bracket of 20 to 34 years acount for 100.0% of all women with births.
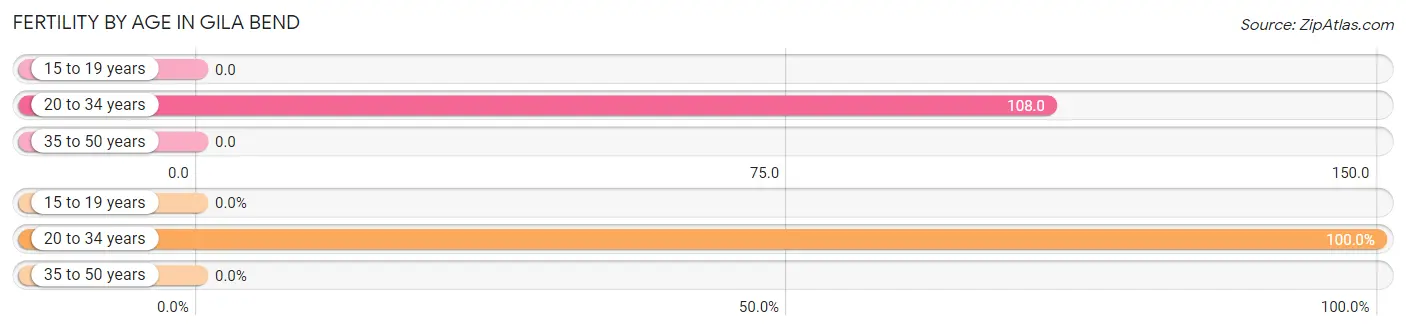
| Age Bracket | Women with Births | Births / 1,000 Women |
| 15 to 19 years | 0 (0.0%) | 0.0 |
| 20 to 34 years | 17 (100.0%) | 108.0 |
| 35 to 50 years | 0 (0.0%) | 0.0 |
| Total | 17 (100.0%) | 53.0 |
Fertility by Age by Marriage Status in Gila Bend
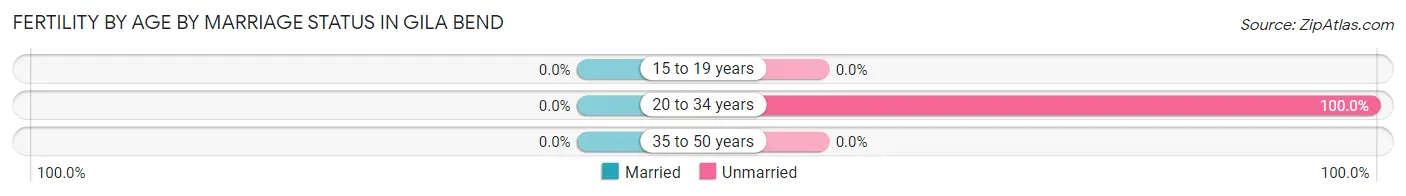
| Age Bracket | Married | Unmarried |
| 15 to 19 years | 0 (0.0%) | 0 (0.0%) |
| 20 to 34 years | 0 (0.0%) | 17 (100.0%) |
| 35 to 50 years | 0 (0.0%) | 0 (0.0%) |
| Total | 0 (0.0%) | 17 (100.0%) |
Fertility by Education in Gila Bend
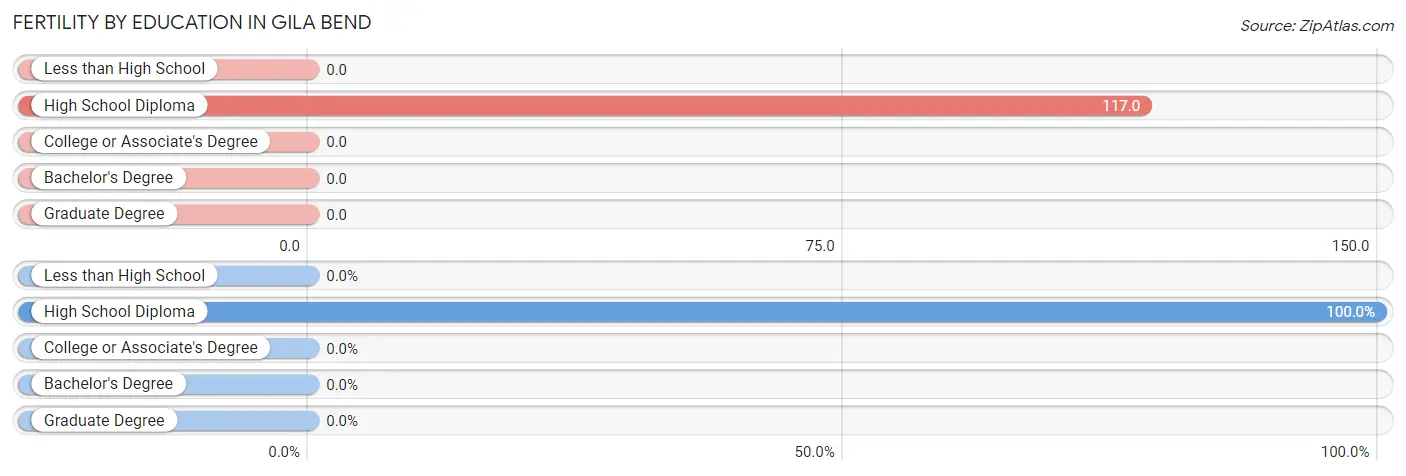
| Educational Attainment | Women with Births | Births / 1,000 Women |
| Less than High School | 0 (0.0%) | 0.0 |
| High School Diploma | 17 (100.0%) | 117.0 |
| College or Associate's Degree | 0 (0.0%) | 0.0 |
| Bachelor's Degree | 0 (0.0%) | 0.0 |
| Graduate Degree | 0 (0.0%) | 0.0 |
| Total | 17 (100.0%) | 53.0 |
Fertility by Education by Marriage Status in Gila Bend
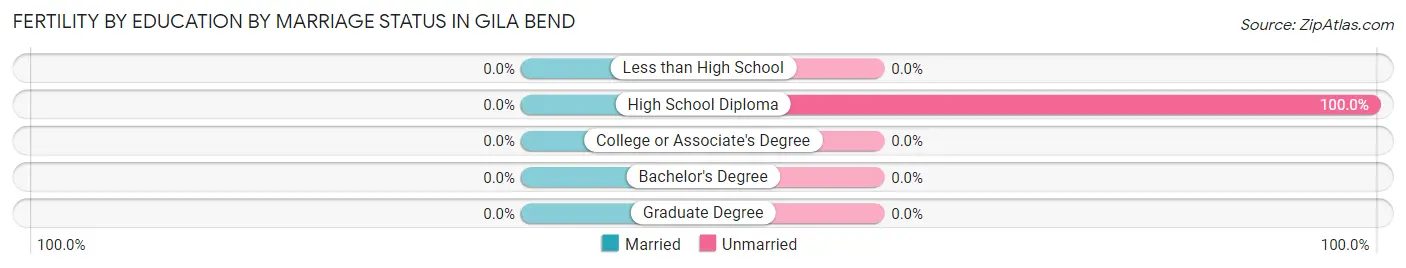
| Educational Attainment | Married | Unmarried |
| Less than High School | 0 (0.0%) | 0 (0.0%) |
| High School Diploma | 0 (0.0%) | 17 (100.0%) |
| College or Associate's Degree | 0 (0.0%) | 0 (0.0%) |
| Bachelor's Degree | 0 (0.0%) | 0 (0.0%) |
| Graduate Degree | 0 (0.0%) | 0 (0.0%) |
| Total | 0 (0.0%) | 17 (100.0%) |
Employment Characteristics in Gila Bend
Employment by Class of Employer in Gila Bend
Among the 895 employed individuals in Gila Bend, private company employees (669 | 74.8%), self-employed (incorporated) (124 | 13.9%), and local government employees (58 | 6.5%) make up the most common classes of employment.
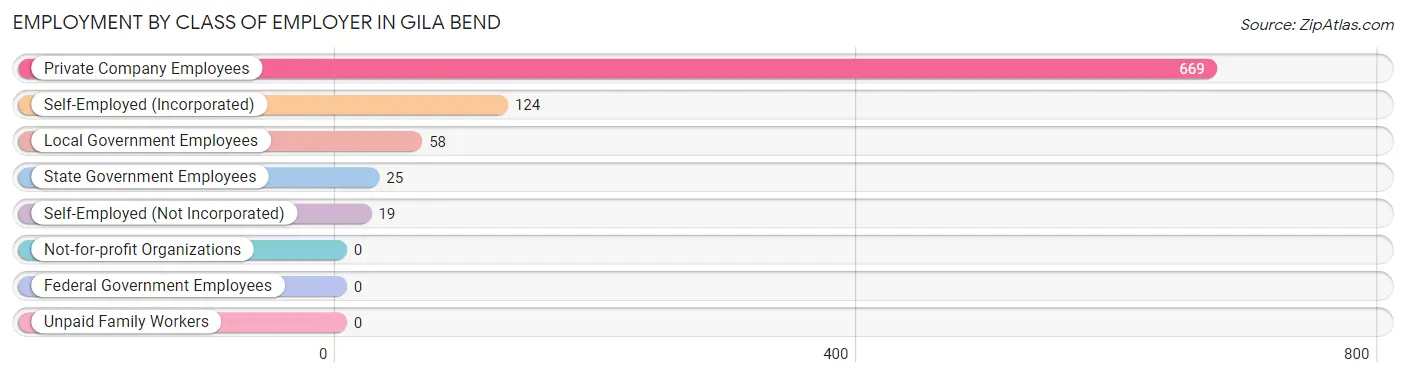
| Employer Class | # Employees | % Employees |
| Private Company Employees | 669 | 74.8% |
| Self-Employed (Incorporated) | 124 | 13.9% |
| Self-Employed (Not Incorporated) | 19 | 2.1% |
| Not-for-profit Organizations | 0 | 0.0% |
| Local Government Employees | 58 | 6.5% |
| State Government Employees | 25 | 2.8% |
| Federal Government Employees | 0 | 0.0% |
| Unpaid Family Workers | 0 | 0.0% |
| Total | 895 | 100.0% |
Employment Status by Age in Gila Bend
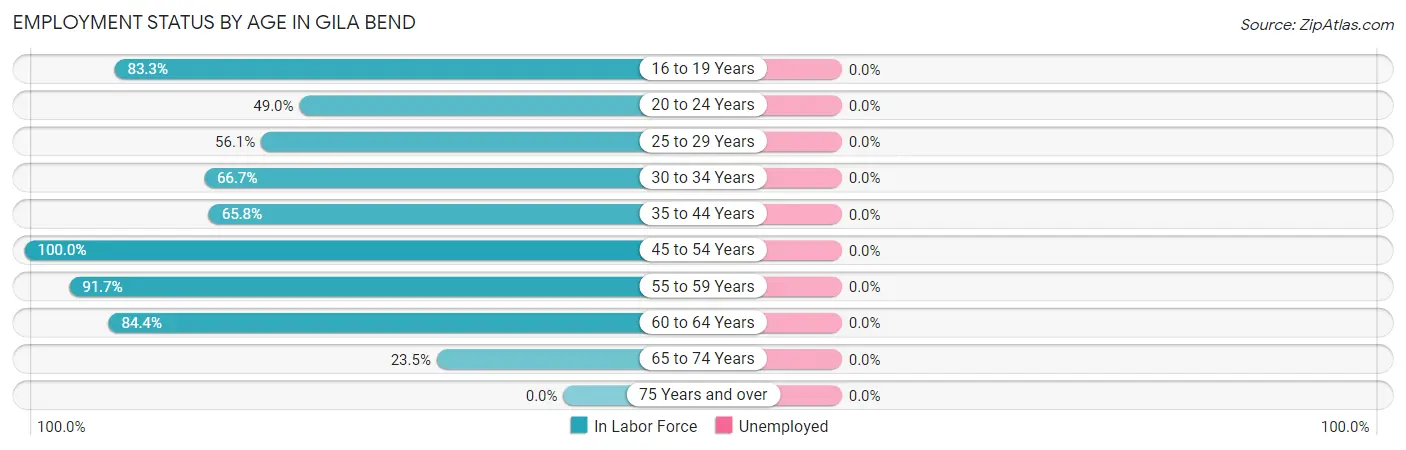
| Age Bracket | In Labor Force | Unemployed |
| 16 to 19 Years | 40 (83.3%) | 0 (0.0%) |
| 20 to 24 Years | 50 (49.0%) | 0 (0.0%) |
| 25 to 29 Years | 69 (56.1%) | 0 (0.0%) |
| 30 to 34 Years | 74 (66.7%) | 0 (0.0%) |
| 35 to 44 Years | 146 (65.8%) | 0 (0.0%) |
| 45 to 54 Years | 269 (100.0%) | 0 (0.0%) |
| 55 to 59 Years | 99 (91.7%) | 0 (0.0%) |
| 60 to 64 Years | 108 (84.4%) | 0 (0.0%) |
| 65 to 74 Years | 46 (23.5%) | 0 (0.0%) |
| 75 Years and over | 0 (0.0%) | 0 (0.0%) |
| Total | 902 (63.4%) | 0 (0.0%) |
Employment Status by Educational Attainment in Gila Bend
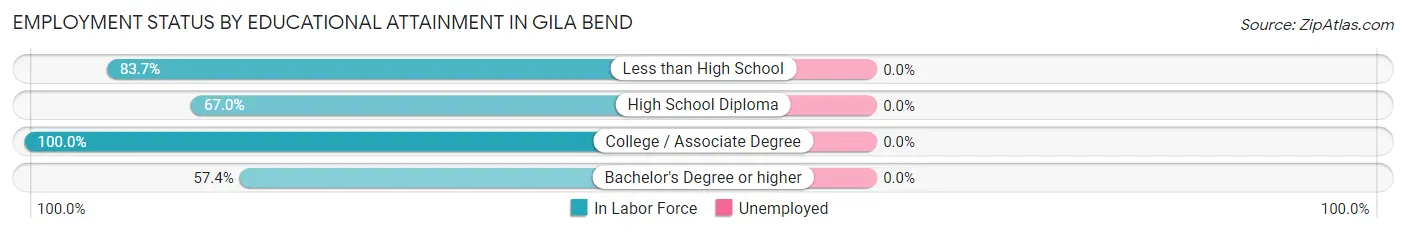
| Educational Attainment | In Labor Force | Unemployed |
| Less than High School | 303 (83.7%) | 0 (0.0%) |
| High School Diploma | 231 (67.0%) | 0 (0.0%) |
| College / Associate Degree | 200 (100.0%) | 0 (0.0%) |
| Bachelor's Degree or higher | 31 (57.4%) | 0 (0.0%) |
| Total | 765 (79.6%) | 0 (0.0%) |
Employment Occupations by Sex in Gila Bend
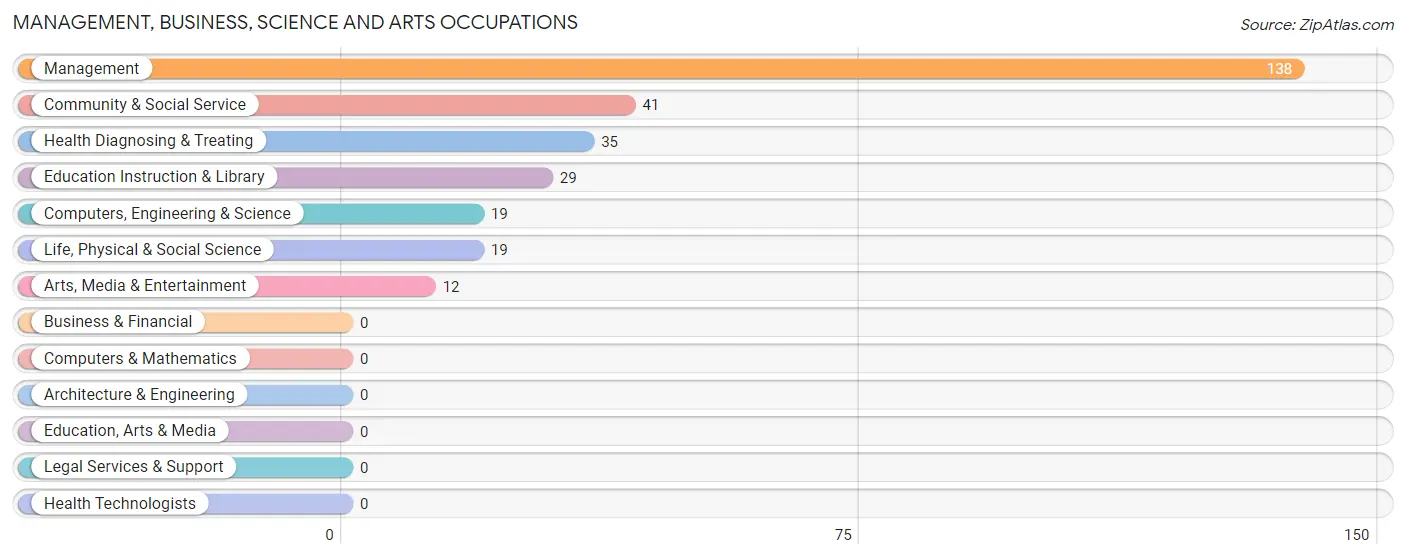
Management, Business, Science and Arts Occupations
The most common Management, Business, Science and Arts occupations in Gila Bend are Management (138 | 15.3%), Community & Social Service (41 | 4.5%), Health Diagnosing & Treating (35 | 3.9%), Education Instruction & Library (29 | 3.2%), and Computers, Engineering & Science (19 | 2.1%).
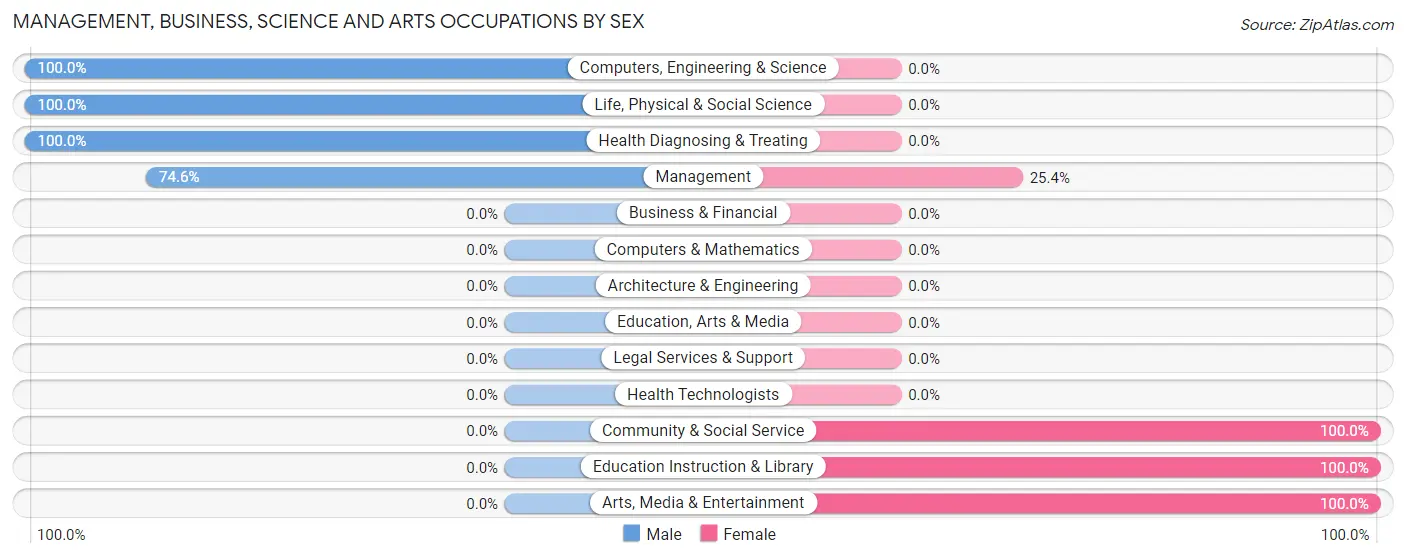
Management, Business, Science and Arts Occupations by Sex
Within the Management, Business, Science and Arts occupations in Gila Bend, the most male-oriented occupations are Computers, Engineering & Science (100.0%), Life, Physical & Social Science (100.0%), and Health Diagnosing & Treating (100.0%), while the most female-oriented occupations are Community & Social Service (100.0%), Education Instruction & Library (100.0%), and Arts, Media & Entertainment (100.0%).
| Occupation | Male | Female |
| Management | 103 (74.6%) | 35 (25.4%) |
| Business & Financial | 0 (0.0%) | 0 (0.0%) |
| Computers, Engineering & Science | 19 (100.0%) | 0 (0.0%) |
| Computers & Mathematics | 0 (0.0%) | 0 (0.0%) |
| Architecture & Engineering | 0 (0.0%) | 0 (0.0%) |
| Life, Physical & Social Science | 19 (100.0%) | 0 (0.0%) |
| Community & Social Service | 0 (0.0%) | 41 (100.0%) |
| Education, Arts & Media | 0 (0.0%) | 0 (0.0%) |
| Legal Services & Support | 0 (0.0%) | 0 (0.0%) |
| Education Instruction & Library | 0 (0.0%) | 29 (100.0%) |
| Arts, Media & Entertainment | 0 (0.0%) | 12 (100.0%) |
| Health Diagnosing & Treating | 35 (100.0%) | 0 (0.0%) |
| Health Technologists | 0 (0.0%) | 0 (0.0%) |
| Total (Category) | 157 (67.4%) | 76 (32.6%) |
| Total (Overall) | 638 (70.8%) | 263 (29.2%) |
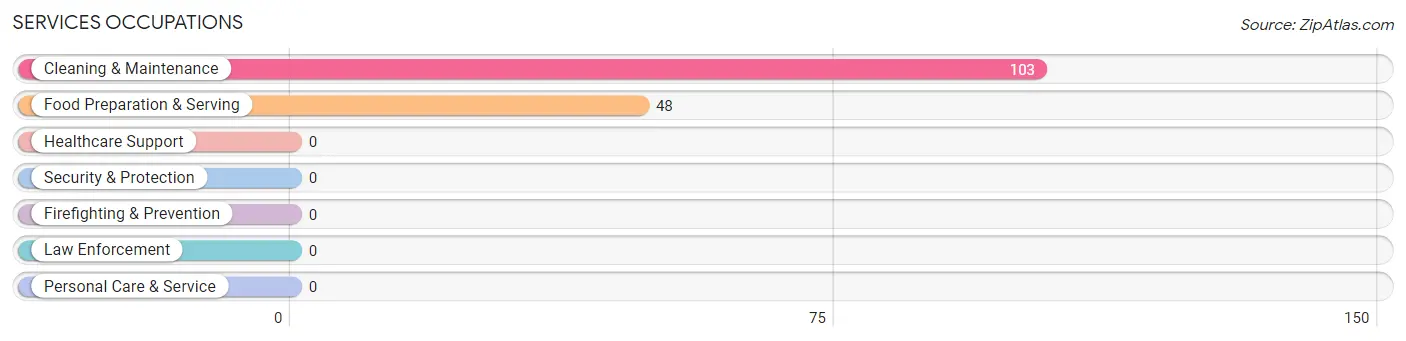
Services Occupations
The most common Services occupations in Gila Bend are Cleaning & Maintenance (103 | 11.4%), and Food Preparation & Serving (48 | 5.3%).
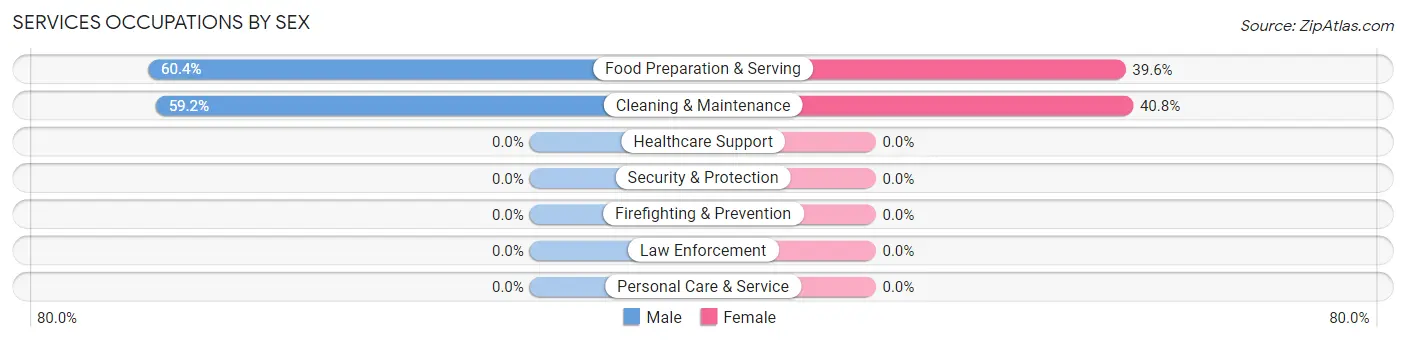
Services Occupations by Sex
Within the Services occupations in Gila Bend, the most male-oriented occupations are Food Preparation & Serving (60.4%), and Cleaning & Maintenance (59.2%), while the most female-oriented occupations are Cleaning & Maintenance (40.8%), and Food Preparation & Serving (39.6%).
| Occupation | Male | Female |
| Healthcare Support | 0 (0.0%) | 0 (0.0%) |
| Security & Protection | 0 (0.0%) | 0 (0.0%) |
| Firefighting & Prevention | 0 (0.0%) | 0 (0.0%) |
| Law Enforcement | 0 (0.0%) | 0 (0.0%) |
| Food Preparation & Serving | 29 (60.4%) | 19 (39.6%) |
| Cleaning & Maintenance | 61 (59.2%) | 42 (40.8%) |
| Personal Care & Service | 0 (0.0%) | 0 (0.0%) |
| Total (Category) | 90 (59.6%) | 61 (40.4%) |
| Total (Overall) | 638 (70.8%) | 263 (29.2%) |
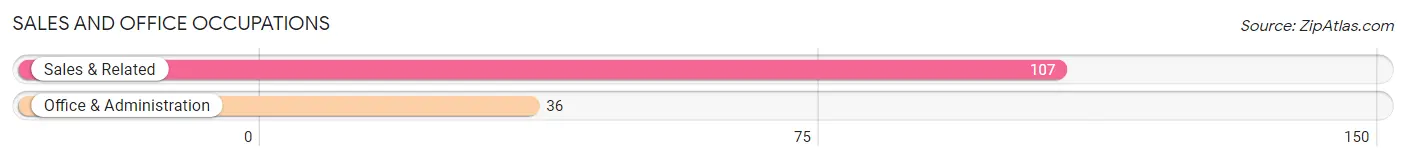
Sales and Office Occupations
The most common Sales and Office occupations in Gila Bend are Sales & Related (107 | 11.9%), and Office & Administration (36 | 4.0%).
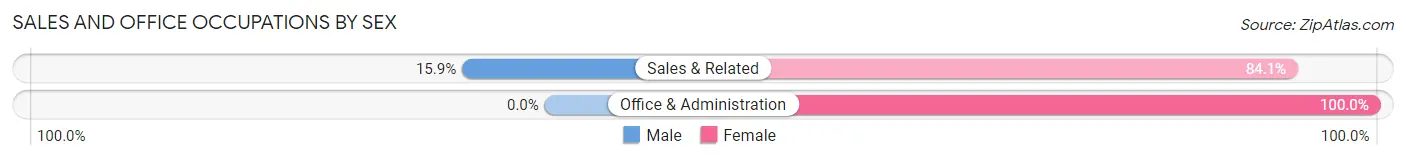
Sales and Office Occupations by Sex
| Occupation | Male | Female |
| Sales & Related | 17 (15.9%) | 90 (84.1%) |
| Office & Administration | 0 (0.0%) | 36 (100.0%) |
| Total (Category) | 17 (11.9%) | 126 (88.1%) |
| Total (Overall) | 638 (70.8%) | 263 (29.2%) |
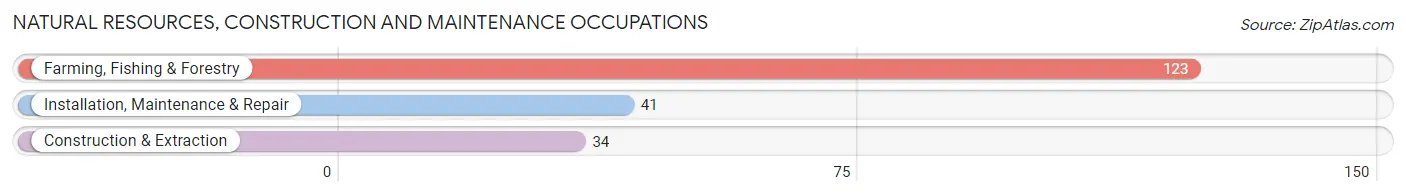
Natural Resources, Construction and Maintenance Occupations
The most common Natural Resources, Construction and Maintenance occupations in Gila Bend are Farming, Fishing & Forestry (123 | 13.7%), Installation, Maintenance & Repair (41 | 4.5%), and Construction & Extraction (34 | 3.8%).
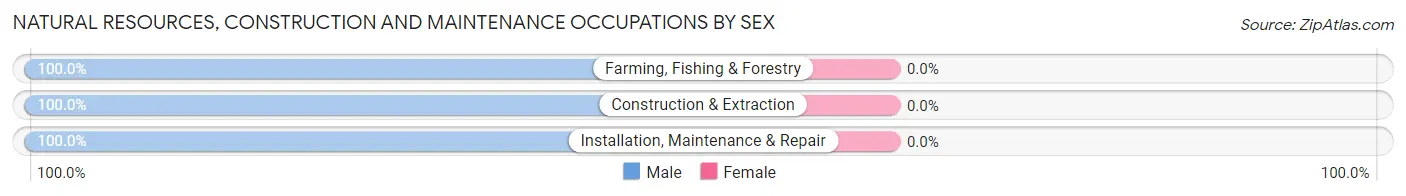
Natural Resources, Construction and Maintenance Occupations by Sex
| Occupation | Male | Female |
| Farming, Fishing & Forestry | 123 (100.0%) | 0 (0.0%) |
| Construction & Extraction | 34 (100.0%) | 0 (0.0%) |
| Installation, Maintenance & Repair | 41 (100.0%) | 0 (0.0%) |
| Total (Category) | 198 (100.0%) | 0 (0.0%) |
| Total (Overall) | 638 (70.8%) | 263 (29.2%) |
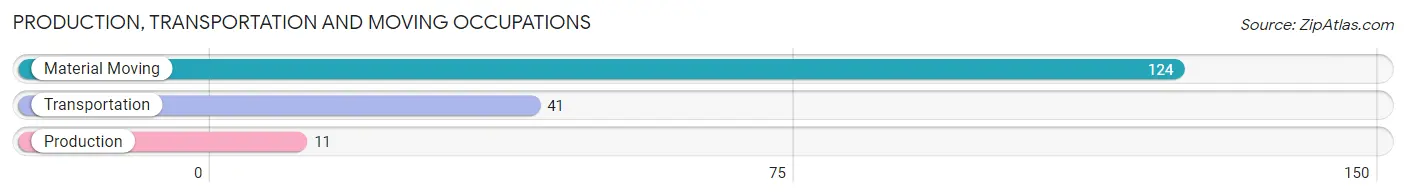
Production, Transportation and Moving Occupations
The most common Production, Transportation and Moving occupations in Gila Bend are Material Moving (124 | 13.8%), Transportation (41 | 4.5%), and Production (11 | 1.2%).
Production, Transportation and Moving Occupations by Sex
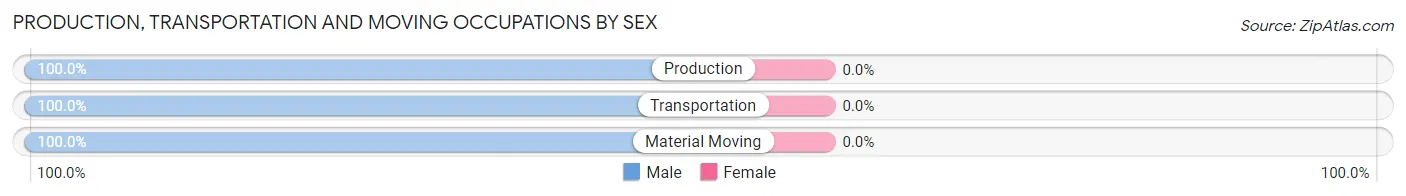
| Occupation | Male | Female |
| Production | 11 (100.0%) | 0 (0.0%) |
| Transportation | 41 (100.0%) | 0 (0.0%) |
| Material Moving | 124 (100.0%) | 0 (0.0%) |
| Total (Category) | 176 (100.0%) | 0 (0.0%) |
| Total (Overall) | 638 (70.8%) | 263 (29.2%) |
Employment Industries by Sex in Gila Bend
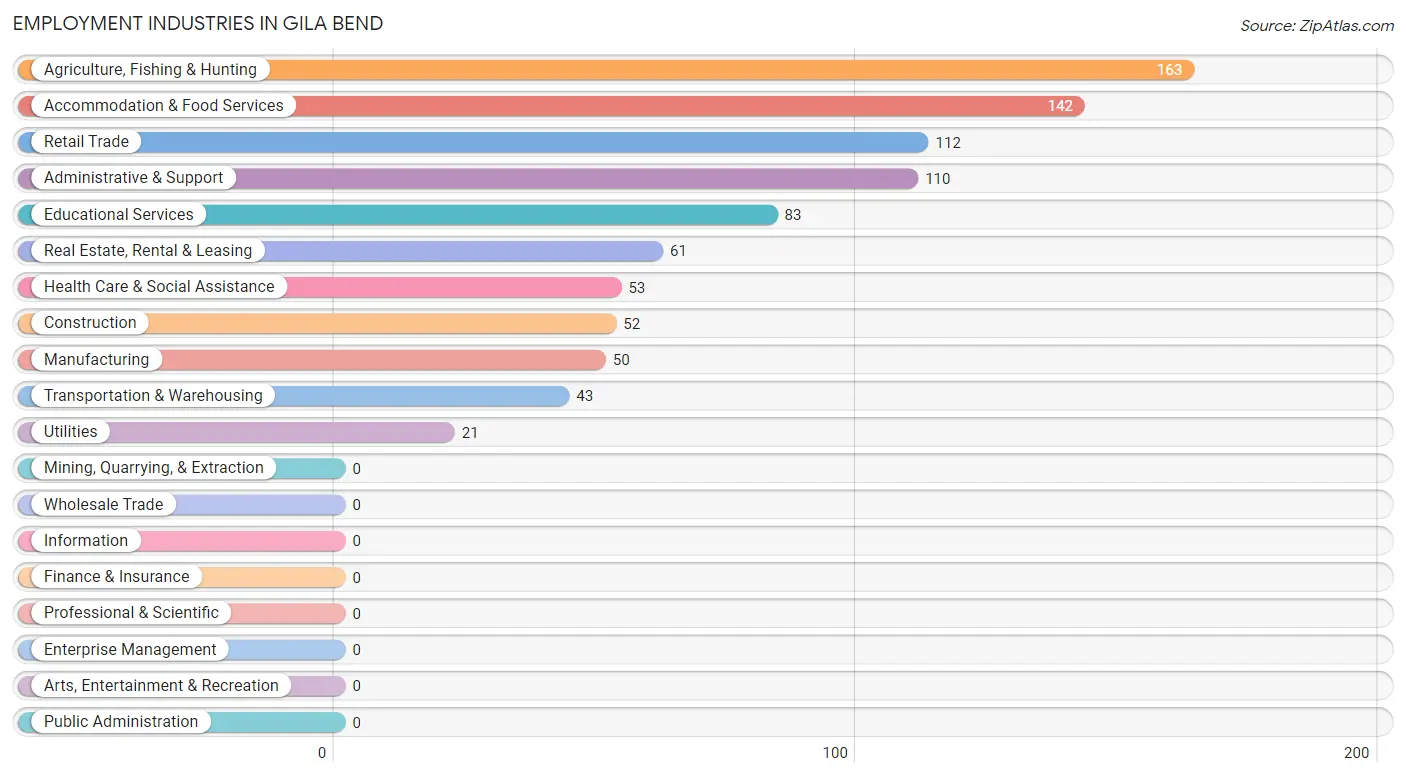
Employment Industries in Gila Bend
The major employment industries in Gila Bend include Agriculture, Fishing & Hunting (163 | 18.1%), Accommodation & Food Services (142 | 15.8%), Retail Trade (112 | 12.4%), Administrative & Support (110 | 12.2%), and Educational Services (83 | 9.2%).
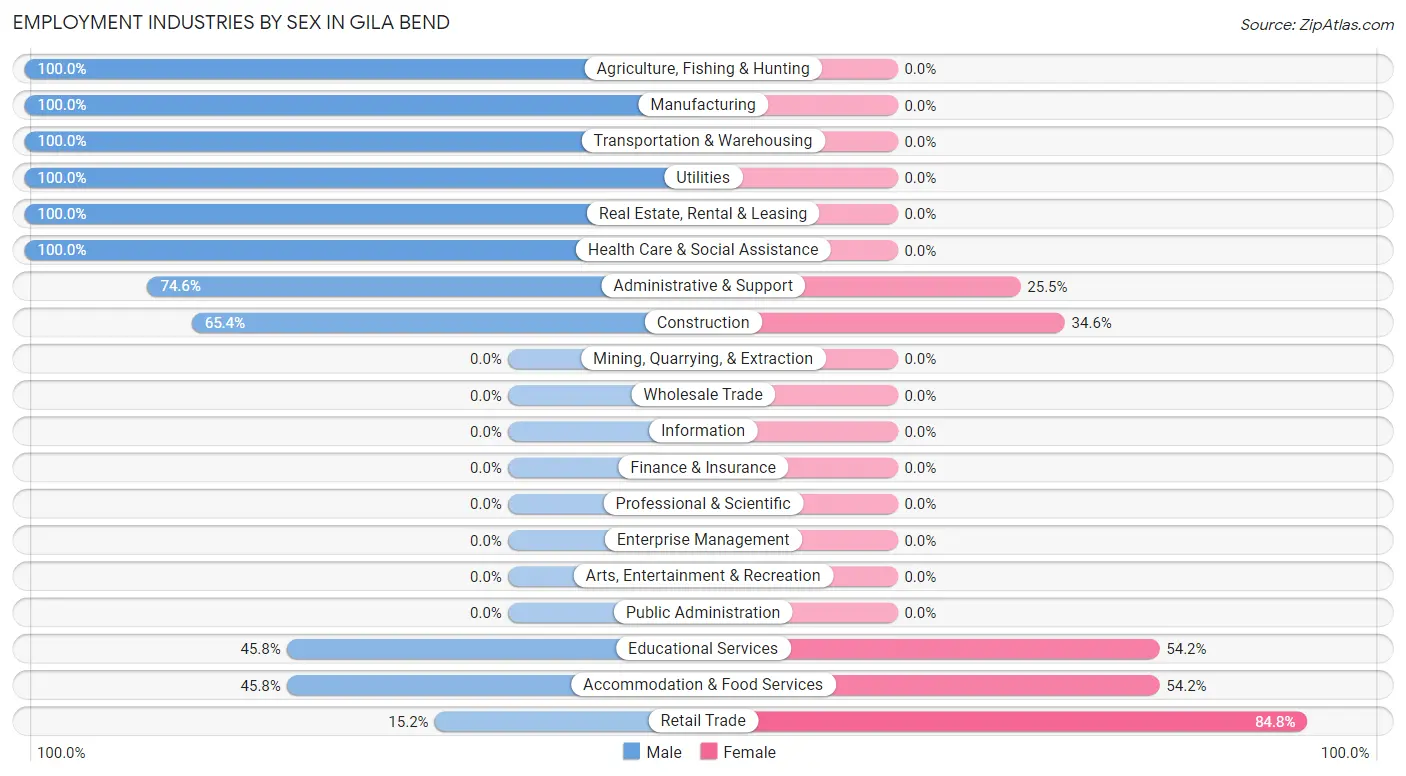
Employment Industries by Sex in Gila Bend
The Gila Bend industries that see more men than women are Agriculture, Fishing & Hunting (100.0%), Manufacturing (100.0%), and Transportation & Warehousing (100.0%), whereas the industries that tend to have a higher number of women are Retail Trade (84.8%), Accommodation & Food Services (54.2%), and Educational Services (54.2%).
| Industry | Male | Female |
| Agriculture, Fishing & Hunting | 163 (100.0%) | 0 (0.0%) |
| Mining, Quarrying, & Extraction | 0 (0.0%) | 0 (0.0%) |
| Construction | 34 (65.4%) | 18 (34.6%) |
| Manufacturing | 50 (100.0%) | 0 (0.0%) |
| Wholesale Trade | 0 (0.0%) | 0 (0.0%) |
| Retail Trade | 17 (15.2%) | 95 (84.8%) |
| Transportation & Warehousing | 43 (100.0%) | 0 (0.0%) |
| Utilities | 21 (100.0%) | 0 (0.0%) |
| Information | 0 (0.0%) | 0 (0.0%) |
| Finance & Insurance | 0 (0.0%) | 0 (0.0%) |
| Real Estate, Rental & Leasing | 61 (100.0%) | 0 (0.0%) |
| Professional & Scientific | 0 (0.0%) | 0 (0.0%) |
| Enterprise Management | 0 (0.0%) | 0 (0.0%) |
| Administrative & Support | 82 (74.6%) | 28 (25.5%) |
| Educational Services | 38 (45.8%) | 45 (54.2%) |
| Health Care & Social Assistance | 53 (100.0%) | 0 (0.0%) |
| Arts, Entertainment & Recreation | 0 (0.0%) | 0 (0.0%) |
| Accommodation & Food Services | 65 (45.8%) | 77 (54.2%) |
| Public Administration | 0 (0.0%) | 0 (0.0%) |
| Total | 638 (70.8%) | 263 (29.2%) |
Education in Gila Bend
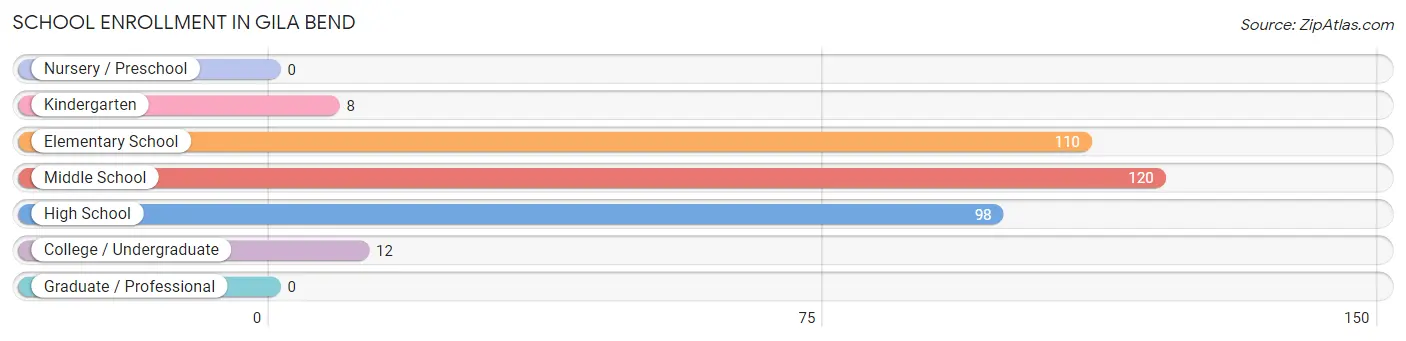
School Enrollment in Gila Bend
The most common levels of schooling among the 348 students in Gila Bend are middle school (120 | 34.5%), elementary school (110 | 31.6%), and high school (98 | 28.2%).
| School Level | # Students | % Students |
| Nursery / Preschool | 0 | 0.0% |
| Kindergarten | 8 | 2.3% |
| Elementary School | 110 | 31.6% |
| Middle School | 120 | 34.5% |
| High School | 98 | 28.2% |
| College / Undergraduate | 12 | 3.5% |
| Graduate / Professional | 0 | 0.0% |
| Total | 348 | 100.0% |
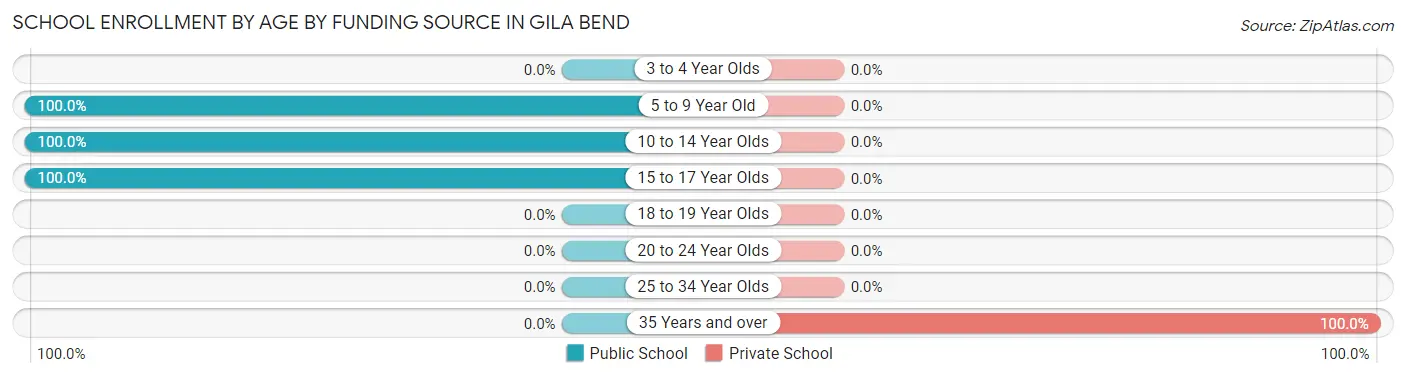
School Enrollment by Age by Funding Source in Gila Bend
Out of a total of 348 students who are enrolled in schools in Gila Bend, 12 (3.4%) attend a private institution, while the remaining 336 (96.6%) are enrolled in public schools. The age group of 35 years and over has the highest likelihood of being enrolled in private schools, with 12 (100.0% in the age bracket) enrolled. Conversely, the age group of 5 to 9 year old has the lowest likelihood of being enrolled in a private school, with 102 (100.0% in the age bracket) attending a public institution.
| Age Bracket | Public School | Private School |
| 3 to 4 Year Olds | 0 (0.0%) | 0 (0.0%) |
| 5 to 9 Year Old | 102 (100.0%) | 0 (0.0%) |
| 10 to 14 Year Olds | 154 (100.0%) | 0 (0.0%) |
| 15 to 17 Year Olds | 80 (100.0%) | 0 (0.0%) |
| 18 to 19 Year Olds | 0 (0.0%) | 0 (0.0%) |
| 20 to 24 Year Olds | 0 (0.0%) | 0 (0.0%) |
| 25 to 34 Year Olds | 0 (0.0%) | 0 (0.0%) |
| 35 Years and over | 0 (0.0%) | 12 (100.0%) |
| Total | 336 (96.6%) | 12 (3.4%) |
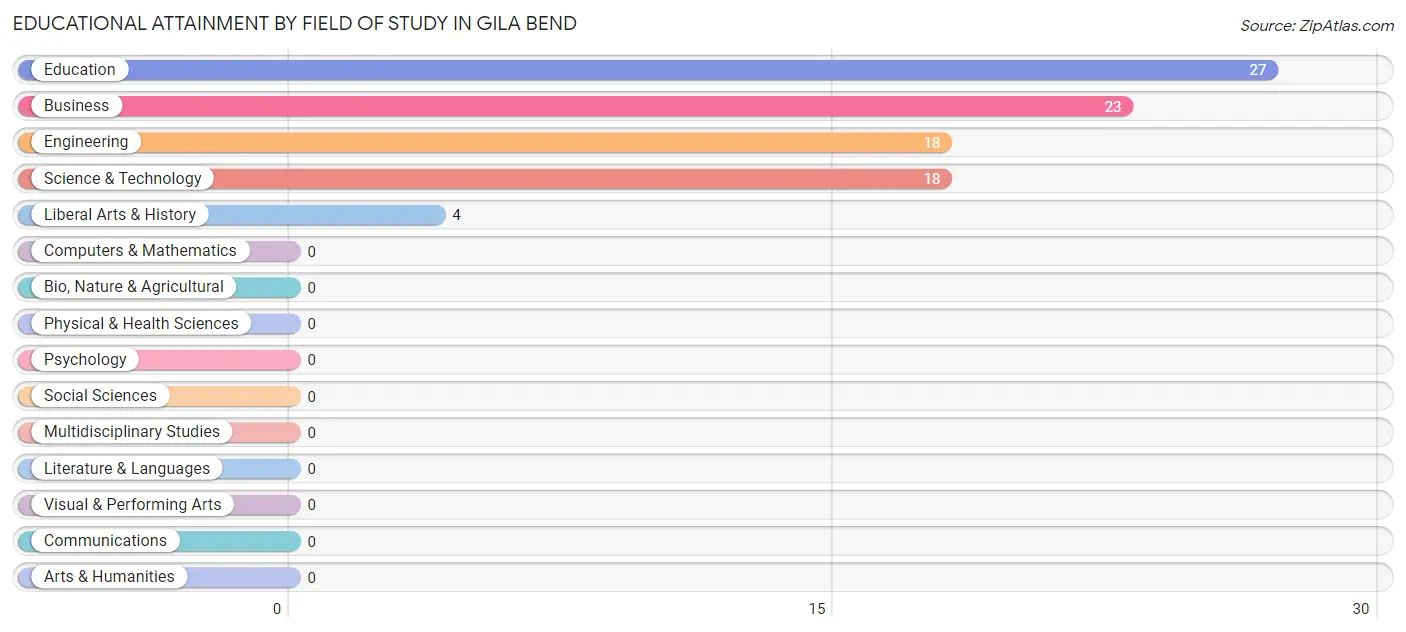
Educational Attainment by Field of Study in Gila Bend
Education (27 | 30.0%), business (23 | 25.6%), engineering (18 | 20.0%), science & technology (18 | 20.0%), and liberal arts & history (4 | 4.4%) are the most common fields of study among 90 individuals in Gila Bend who have obtained a bachelor's degree or higher.
| Field of Study | # Graduates | % Graduates |
| Computers & Mathematics | 0 | 0.0% |
| Bio, Nature & Agricultural | 0 | 0.0% |
| Physical & Health Sciences | 0 | 0.0% |
| Psychology | 0 | 0.0% |
| Social Sciences | 0 | 0.0% |
| Engineering | 18 | 20.0% |
| Multidisciplinary Studies | 0 | 0.0% |
| Science & Technology | 18 | 20.0% |
| Business | 23 | 25.6% |
| Education | 27 | 30.0% |
| Literature & Languages | 0 | 0.0% |
| Liberal Arts & History | 4 | 4.4% |
| Visual & Performing Arts | 0 | 0.0% |
| Communications | 0 | 0.0% |
| Arts & Humanities | 0 | 0.0% |
| Total | 90 | 100.0% |
Transportation & Commute in Gila Bend
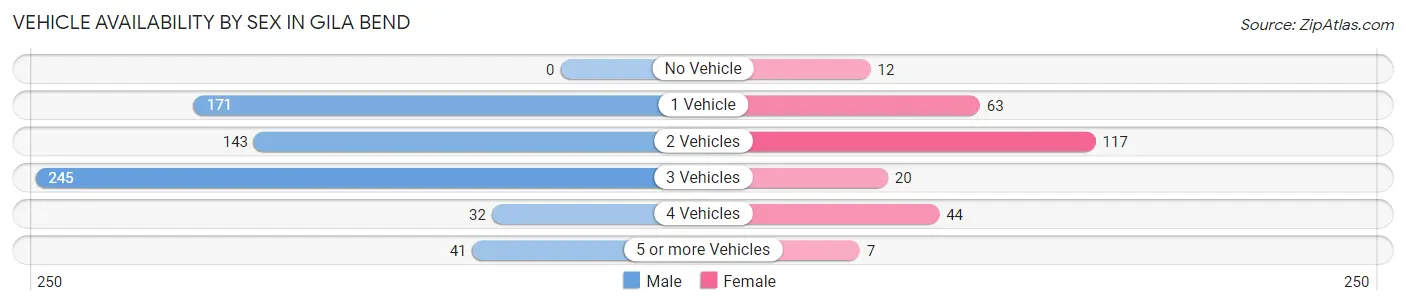
Vehicle Availability by Sex in Gila Bend
The most prevalent vehicle ownership categories in Gila Bend are males with 3 vehicles (245, accounting for 38.8%) and females with 3 vehicles (20, making up 93.2%).
| Vehicles Available | Male | Female |
| No Vehicle | 0 (0.0%) | 12 (4.6%) |
| 1 Vehicle | 171 (27.1%) | 63 (23.9%) |
| 2 Vehicles | 143 (22.6%) | 117 (44.5%) |
| 3 Vehicles | 245 (38.8%) | 20 (7.6%) |
| 4 Vehicles | 32 (5.1%) | 44 (16.7%) |
| 5 or more Vehicles | 41 (6.5%) | 7 (2.7%) |
| Total | 632 (100.0%) | 263 (100.0%) |
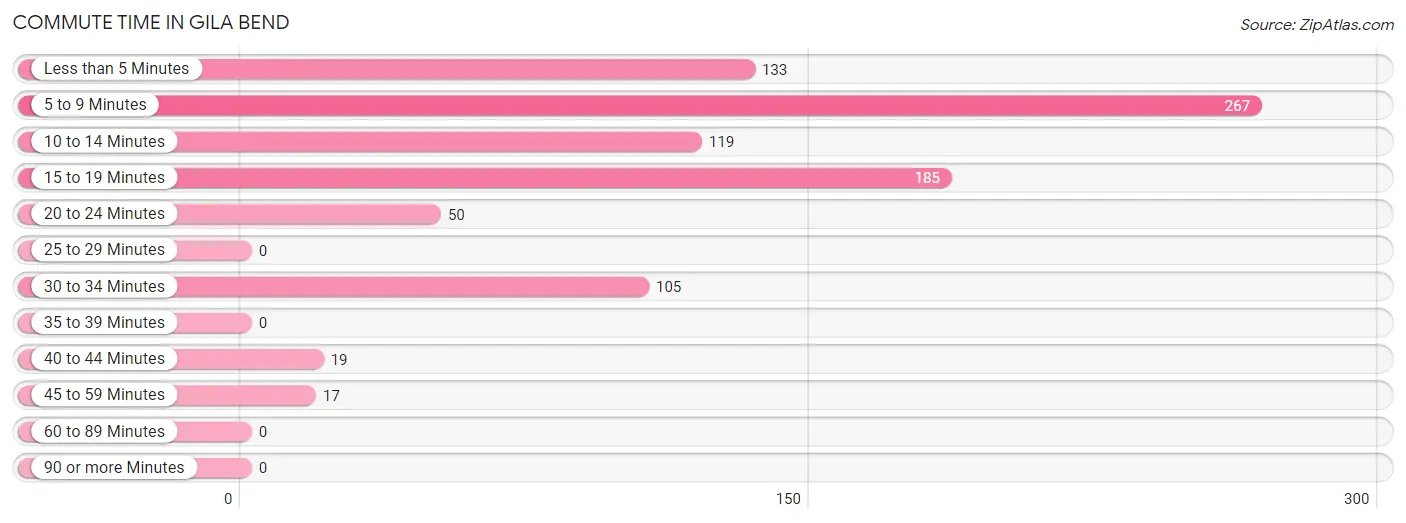
Commute Time in Gila Bend
The most frequently occuring commute durations in Gila Bend are 5 to 9 minutes (267 commuters, 29.8%), 15 to 19 minutes (185 commuters, 20.7%), and less than 5 minutes (133 commuters, 14.9%).
| Commute Time | # Commuters | % Commuters |
| Less than 5 Minutes | 133 | 14.9% |
| 5 to 9 Minutes | 267 | 29.8% |
| 10 to 14 Minutes | 119 | 13.3% |
| 15 to 19 Minutes | 185 | 20.7% |
| 20 to 24 Minutes | 50 | 5.6% |
| 25 to 29 Minutes | 0 | 0.0% |
| 30 to 34 Minutes | 105 | 11.7% |
| 35 to 39 Minutes | 0 | 0.0% |
| 40 to 44 Minutes | 19 | 2.1% |
| 45 to 59 Minutes | 17 | 1.9% |
| 60 to 89 Minutes | 0 | 0.0% |
| 90 or more Minutes | 0 | 0.0% |
Commute Time by Sex in Gila Bend
The most common commute times in Gila Bend are 15 to 19 minutes (185 commuters, 29.3%) for males and 5 to 9 minutes (113 commuters, 43.0%) for females.
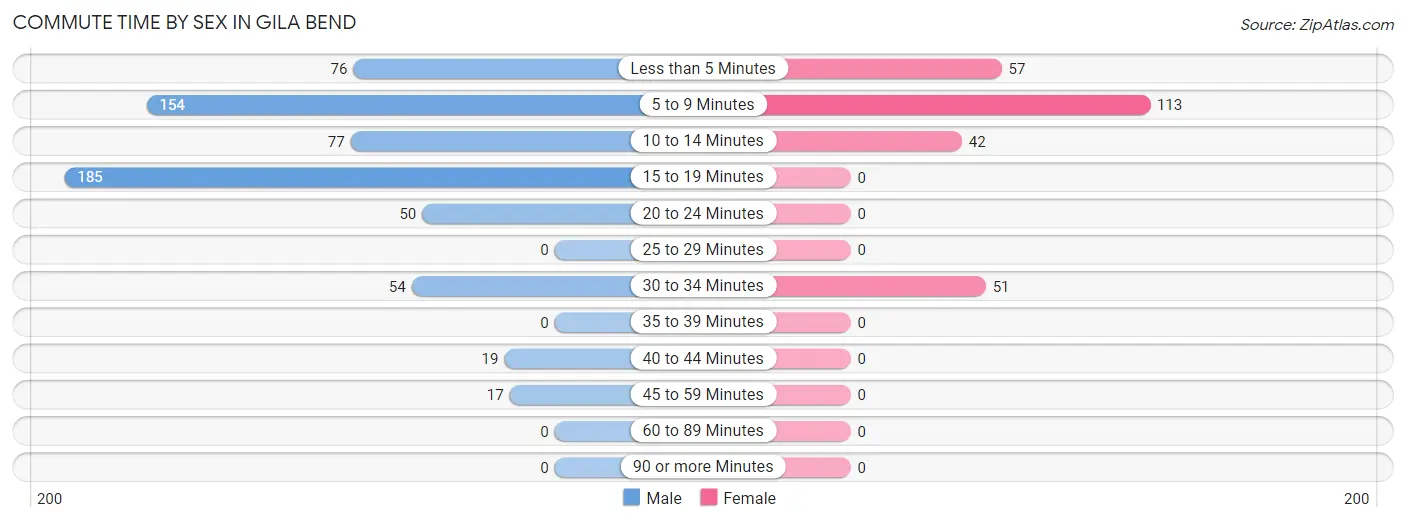
| Commute Time | Male | Female |
| Less than 5 Minutes | 76 (12.0%) | 57 (21.7%) |
| 5 to 9 Minutes | 154 (24.4%) | 113 (43.0%) |
| 10 to 14 Minutes | 77 (12.2%) | 42 (16.0%) |
| 15 to 19 Minutes | 185 (29.3%) | 0 (0.0%) |
| 20 to 24 Minutes | 50 (7.9%) | 0 (0.0%) |
| 25 to 29 Minutes | 0 (0.0%) | 0 (0.0%) |
| 30 to 34 Minutes | 54 (8.5%) | 51 (19.4%) |
| 35 to 39 Minutes | 0 (0.0%) | 0 (0.0%) |
| 40 to 44 Minutes | 19 (3.0%) | 0 (0.0%) |
| 45 to 59 Minutes | 17 (2.7%) | 0 (0.0%) |
| 60 to 89 Minutes | 0 (0.0%) | 0 (0.0%) |
| 90 or more Minutes | 0 (0.0%) | 0 (0.0%) |
Time of Departure to Work by Sex in Gila Bend
The most frequent times of departure to work in Gila Bend are 12:00 AM to 4:59 AM (192, 30.4%) for males and 9:00 AM to 9:59 AM (84, 31.9%) for females.
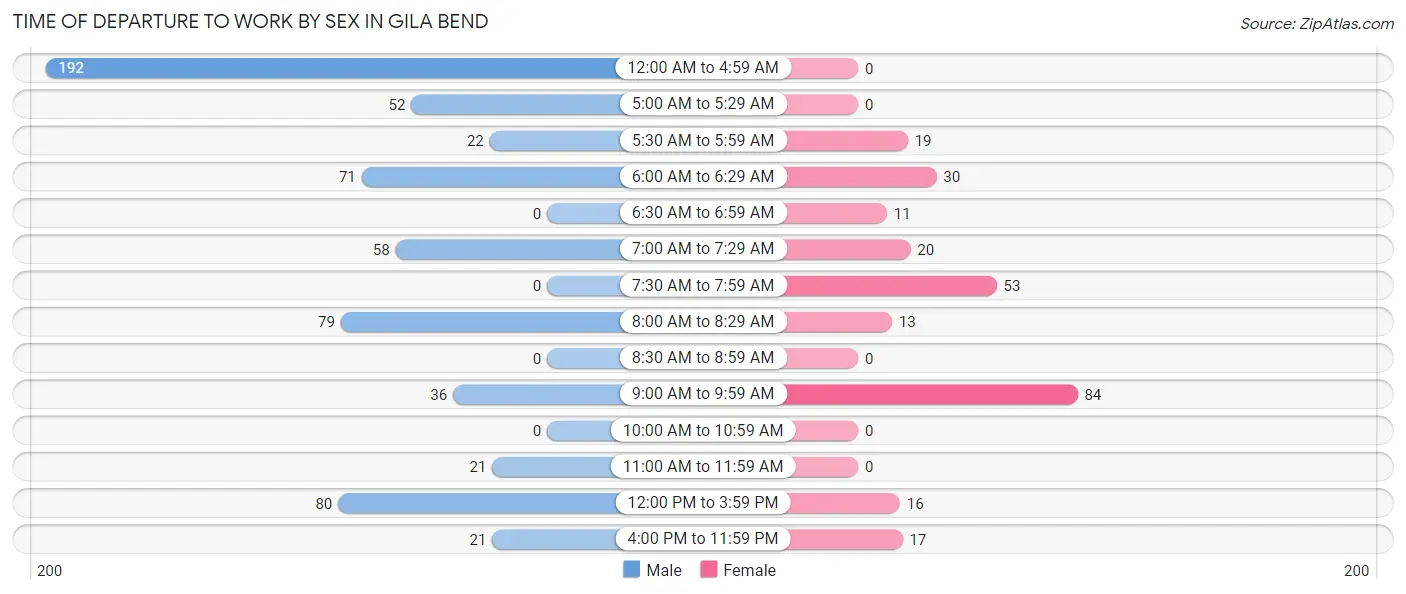
| Time of Departure | Male | Female |
| 12:00 AM to 4:59 AM | 192 (30.4%) | 0 (0.0%) |
| 5:00 AM to 5:29 AM | 52 (8.2%) | 0 (0.0%) |
| 5:30 AM to 5:59 AM | 22 (3.5%) | 19 (7.2%) |
| 6:00 AM to 6:29 AM | 71 (11.2%) | 30 (11.4%) |
| 6:30 AM to 6:59 AM | 0 (0.0%) | 11 (4.2%) |
| 7:00 AM to 7:29 AM | 58 (9.2%) | 20 (7.6%) |
| 7:30 AM to 7:59 AM | 0 (0.0%) | 53 (20.2%) |
| 8:00 AM to 8:29 AM | 79 (12.5%) | 13 (4.9%) |
| 8:30 AM to 8:59 AM | 0 (0.0%) | 0 (0.0%) |
| 9:00 AM to 9:59 AM | 36 (5.7%) | 84 (31.9%) |
| 10:00 AM to 10:59 AM | 0 (0.0%) | 0 (0.0%) |
| 11:00 AM to 11:59 AM | 21 (3.3%) | 0 (0.0%) |
| 12:00 PM to 3:59 PM | 80 (12.7%) | 16 (6.1%) |
| 4:00 PM to 11:59 PM | 21 (3.3%) | 17 (6.5%) |
| Total | 632 (100.0%) | 263 (100.0%) |
Housing Occupancy in Gila Bend
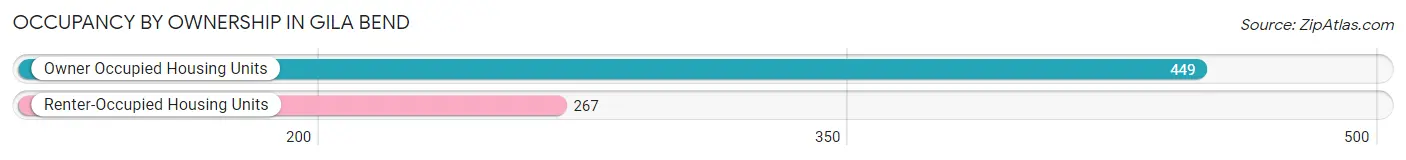
Occupancy by Ownership in Gila Bend
Of the total 716 dwellings in Gila Bend, owner-occupied units account for 449 (62.7%), while renter-occupied units make up 267 (37.3%).
| Occupancy | # Housing Units | % Housing Units |
| Owner Occupied Housing Units | 449 | 62.7% |
| Renter-Occupied Housing Units | 267 | 37.3% |
| Total Occupied Housing Units | 716 | 100.0% |
Occupancy by Household Size in Gila Bend
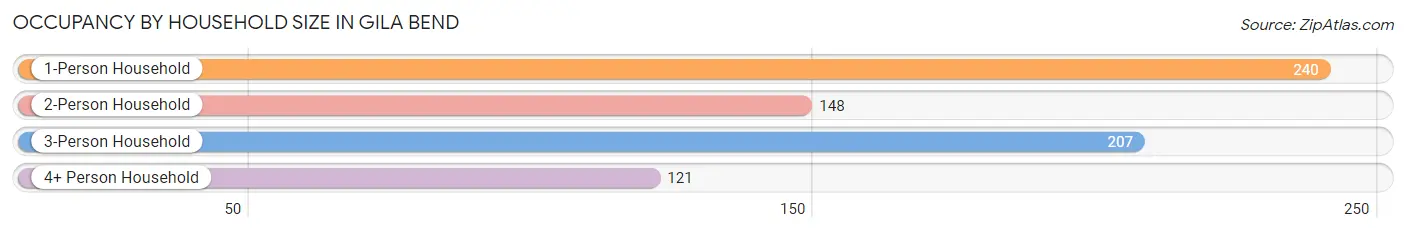
| Household Size | # Housing Units | % Housing Units |
| 1-Person Household | 240 | 33.5% |
| 2-Person Household | 148 | 20.7% |
| 3-Person Household | 207 | 28.9% |
| 4+ Person Household | 121 | 16.9% |
| Total Housing Units | 716 | 100.0% |
Occupancy by Ownership by Household Size in Gila Bend
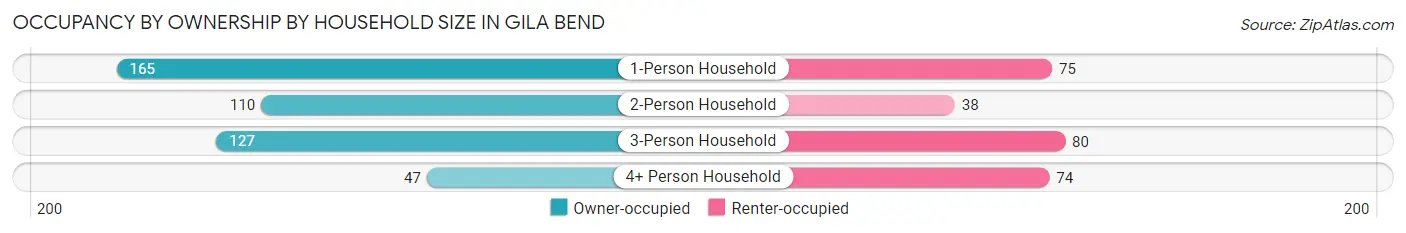
| Household Size | Owner-occupied | Renter-occupied |
| 1-Person Household | 165 (68.8%) | 75 (31.2%) |
| 2-Person Household | 110 (74.3%) | 38 (25.7%) |
| 3-Person Household | 127 (61.4%) | 80 (38.7%) |
| 4+ Person Household | 47 (38.8%) | 74 (61.2%) |
| Total Housing Units | 449 (62.7%) | 267 (37.3%) |
Occupancy by Educational Attainment in Gila Bend
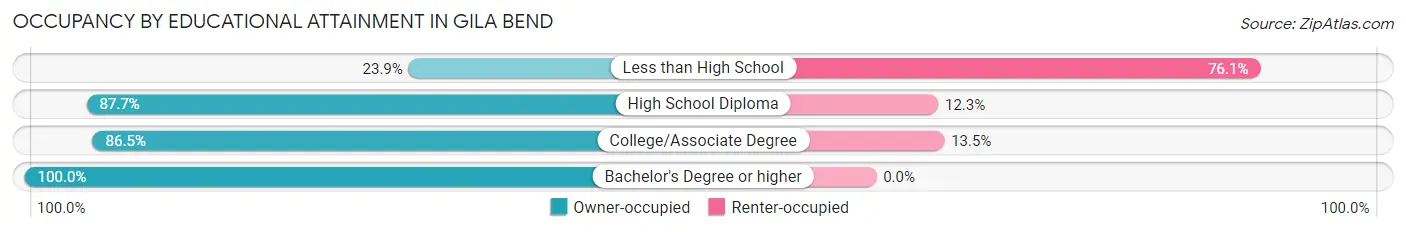
| Household Size | Owner-occupied | Renter-occupied |
| Less than High School | 68 (23.9%) | 217 (76.1%) |
| High School Diploma | 236 (87.7%) | 33 (12.3%) |
| College/Associate Degree | 109 (86.5%) | 17 (13.5%) |
| Bachelor's Degree or higher | 36 (100.0%) | 0 (0.0%) |
Occupancy by Age of Householder in Gila Bend
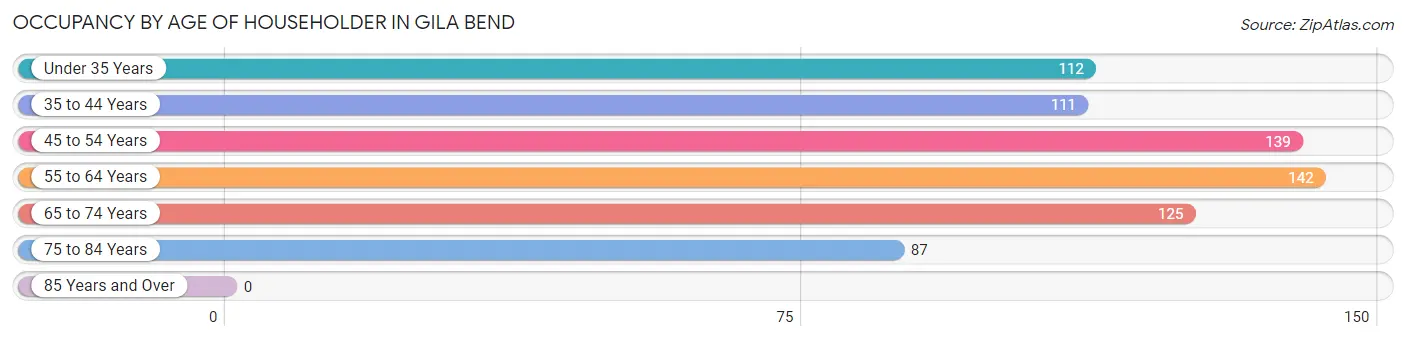
| Age Bracket | # Households | % Households |
| Under 35 Years | 112 | 15.6% |
| 35 to 44 Years | 111 | 15.5% |
| 45 to 54 Years | 139 | 19.4% |
| 55 to 64 Years | 142 | 19.8% |
| 65 to 74 Years | 125 | 17.5% |
| 75 to 84 Years | 87 | 12.1% |
| 85 Years and Over | 0 | 0.0% |
| Total | 716 | 100.0% |
Housing Finances in Gila Bend
Median Income by Occupancy in Gila Bend
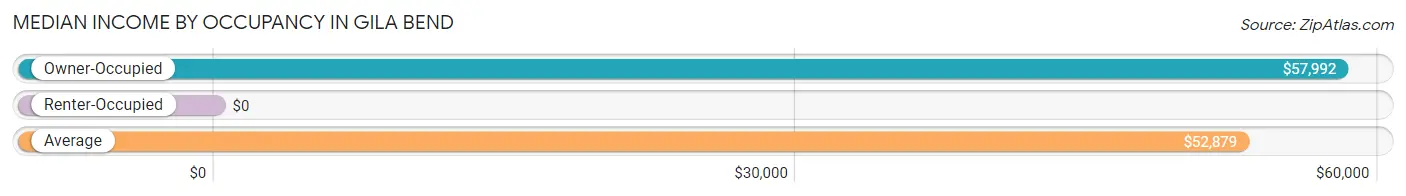
| Occupancy Type | # Households | Median Income |
| Owner-Occupied | 449 (62.7%) | $57,992 |
| Renter-Occupied | 267 (37.3%) | $0 |
| Average | 716 (100.0%) | $52,879 |
Occupancy by Householder Income Bracket in Gila Bend
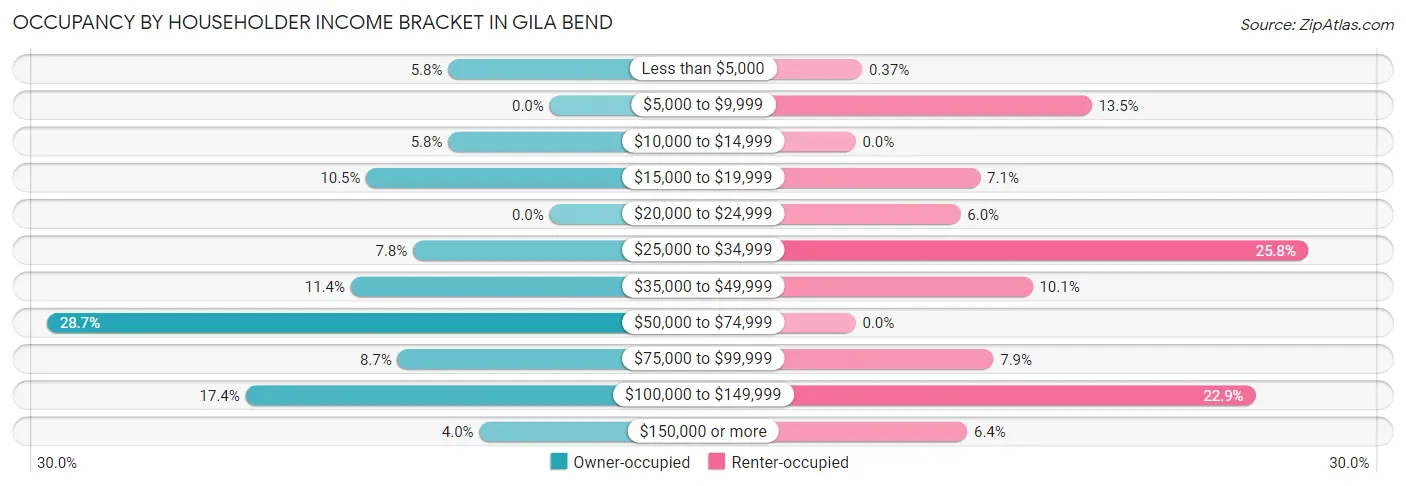
| Income Bracket | Owner-occupied | Renter-occupied |
| Less than $5,000 | 26 (5.8%) | 1 (0.4%) |
| $5,000 to $9,999 | 0 (0.0%) | 36 (13.5%) |
| $10,000 to $14,999 | 26 (5.8%) | 0 (0.0%) |
| $15,000 to $19,999 | 47 (10.5%) | 19 (7.1%) |
| $20,000 to $24,999 | 0 (0.0%) | 16 (6.0%) |
| $25,000 to $34,999 | 35 (7.8%) | 69 (25.8%) |
| $35,000 to $49,999 | 51 (11.4%) | 27 (10.1%) |
| $50,000 to $74,999 | 129 (28.7%) | 0 (0.0%) |
| $75,000 to $99,999 | 39 (8.7%) | 21 (7.9%) |
| $100,000 to $149,999 | 78 (17.4%) | 61 (22.9%) |
| $150,000 or more | 18 (4.0%) | 17 (6.4%) |
| Total | 449 (100.0%) | 267 (100.0%) |
Monthly Housing Cost Tiers in Gila Bend
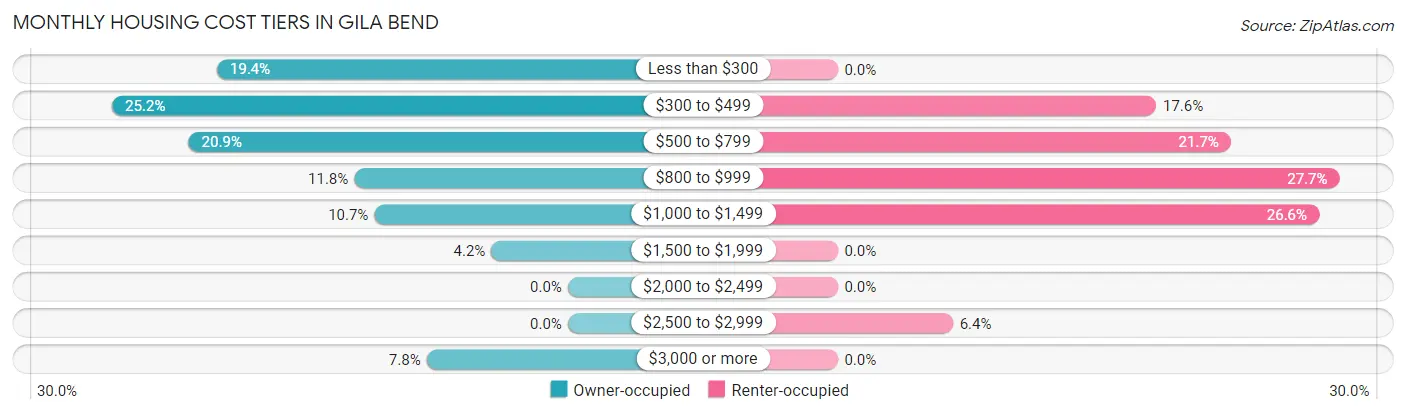
| Monthly Cost | Owner-occupied | Renter-occupied |
| Less than $300 | 87 (19.4%) | 0 (0.0%) |
| $300 to $499 | 113 (25.2%) | 47 (17.6%) |
| $500 to $799 | 94 (20.9%) | 58 (21.7%) |
| $800 to $999 | 53 (11.8%) | 74 (27.7%) |
| $1,000 to $1,499 | 48 (10.7%) | 71 (26.6%) |
| $1,500 to $1,999 | 19 (4.2%) | 0 (0.0%) |
| $2,000 to $2,499 | 0 (0.0%) | 0 (0.0%) |
| $2,500 to $2,999 | 0 (0.0%) | 17 (6.4%) |
| $3,000 or more | 35 (7.8%) | 0 (0.0%) |
| Total | 449 (100.0%) | 267 (100.0%) |
Physical Housing Characteristics in Gila Bend
Housing Structures in Gila Bend
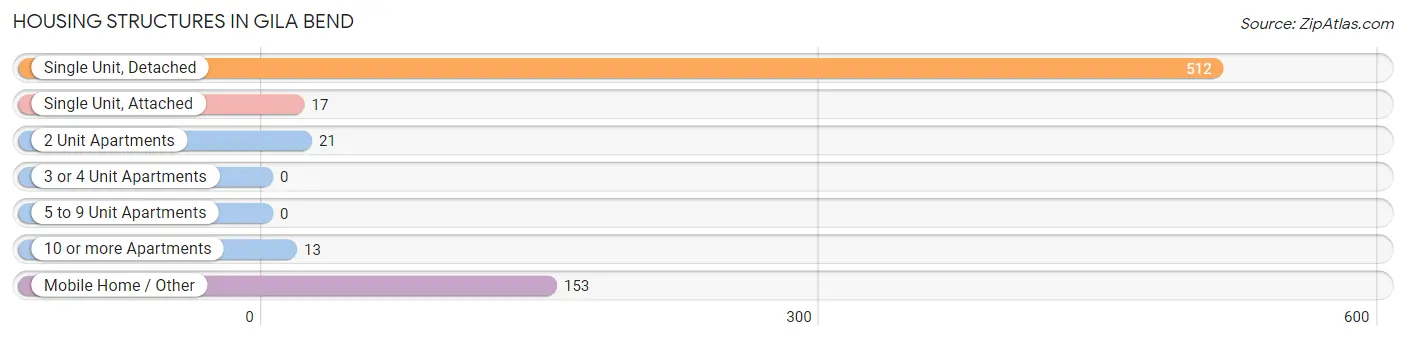
| Structure Type | # Housing Units | % Housing Units |
| Single Unit, Detached | 512 | 71.5% |
| Single Unit, Attached | 17 | 2.4% |
| 2 Unit Apartments | 21 | 2.9% |
| 3 or 4 Unit Apartments | 0 | 0.0% |
| 5 to 9 Unit Apartments | 0 | 0.0% |
| 10 or more Apartments | 13 | 1.8% |
| Mobile Home / Other | 153 | 21.4% |
| Total | 716 | 100.0% |
Housing Structures by Occupancy in Gila Bend
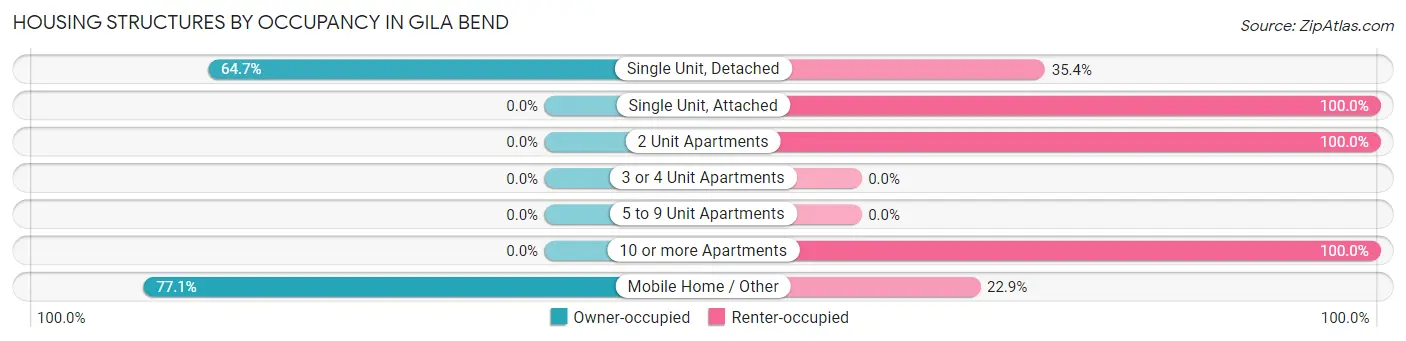
| Structure Type | Owner-occupied | Renter-occupied |
| Single Unit, Detached | 331 (64.6%) | 181 (35.3%) |
| Single Unit, Attached | 0 (0.0%) | 17 (100.0%) |
| 2 Unit Apartments | 0 (0.0%) | 21 (100.0%) |
| 3 or 4 Unit Apartments | 0 (0.0%) | 0 (0.0%) |
| 5 to 9 Unit Apartments | 0 (0.0%) | 0 (0.0%) |
| 10 or more Apartments | 0 (0.0%) | 13 (100.0%) |
| Mobile Home / Other | 118 (77.1%) | 35 (22.9%) |
| Total | 449 (62.7%) | 267 (37.3%) |
Housing Structures by Number of Rooms in Gila Bend
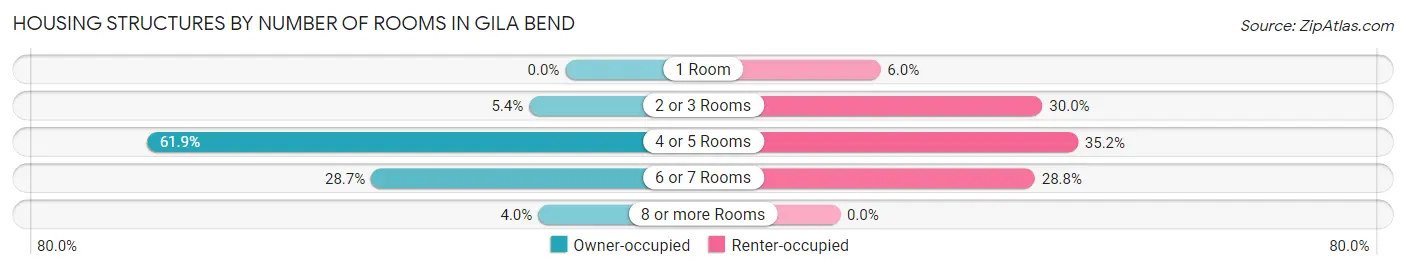
| Number of Rooms | Owner-occupied | Renter-occupied |
| 1 Room | 0 (0.0%) | 16 (6.0%) |
| 2 or 3 Rooms | 24 (5.3%) | 80 (30.0%) |
| 4 or 5 Rooms | 278 (61.9%) | 94 (35.2%) |
| 6 or 7 Rooms | 129 (28.7%) | 77 (28.8%) |
| 8 or more Rooms | 18 (4.0%) | 0 (0.0%) |
| Total | 449 (100.0%) | 267 (100.0%) |
Housing Structure by Heating Type in Gila Bend
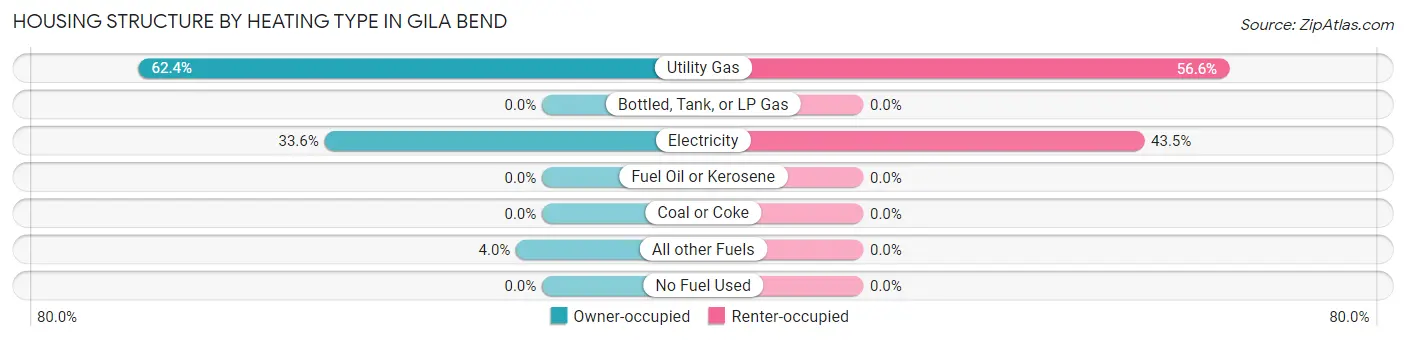
| Heating Type | Owner-occupied | Renter-occupied |
| Utility Gas | 280 (62.4%) | 151 (56.6%) |
| Bottled, Tank, or LP Gas | 0 (0.0%) | 0 (0.0%) |
| Electricity | 151 (33.6%) | 116 (43.4%) |
| Fuel Oil or Kerosene | 0 (0.0%) | 0 (0.0%) |
| Coal or Coke | 0 (0.0%) | 0 (0.0%) |
| All other Fuels | 18 (4.0%) | 0 (0.0%) |
| No Fuel Used | 0 (0.0%) | 0 (0.0%) |
| Total | 449 (100.0%) | 267 (100.0%) |
Household Vehicle Usage in Gila Bend
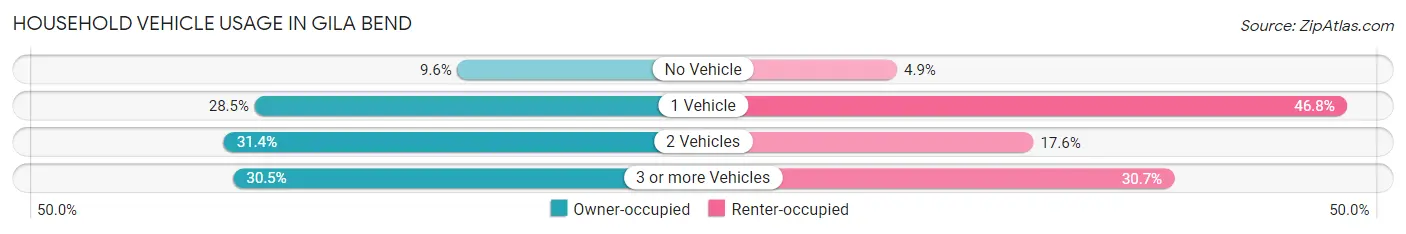
| Vehicles per Household | Owner-occupied | Renter-occupied |
| No Vehicle | 43 (9.6%) | 13 (4.9%) |
| 1 Vehicle | 128 (28.5%) | 125 (46.8%) |
| 2 Vehicles | 141 (31.4%) | 47 (17.6%) |
| 3 or more Vehicles | 137 (30.5%) | 82 (30.7%) |
| Total | 449 (100.0%) | 267 (100.0%) |
Real Estate & Mortgages in Gila Bend
Real Estate and Mortgage Overview in Gila Bend
| Characteristic | Without Mortgage | With Mortgage |
| Housing Units | 276 | 173 |
| Median Property Value | $110,500 | $135,100 |
| Median Household Income | $40,270 | $0 |
| Monthly Housing Costs | $410 | $35 |
| Real Estate Taxes | $514 | $0 |
Property Value by Mortgage Status in Gila Bend
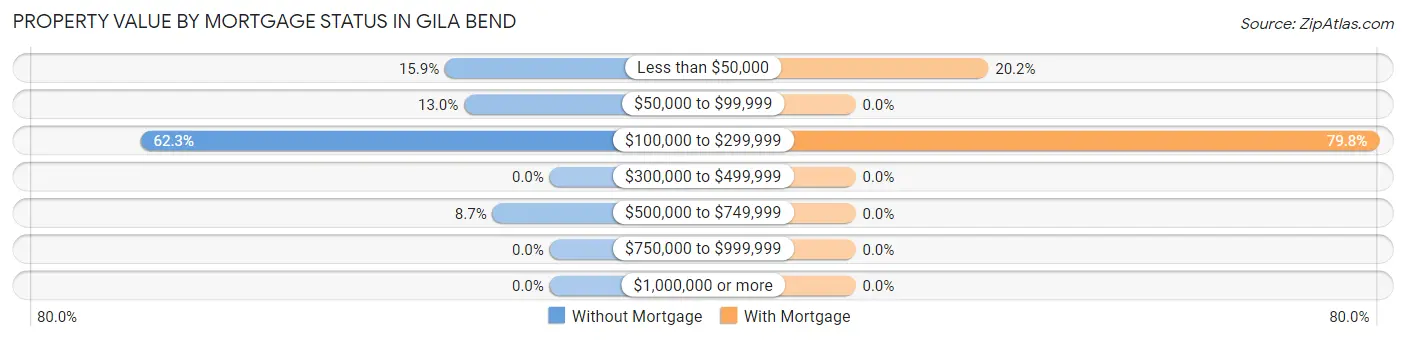
| Property Value | Without Mortgage | With Mortgage |
| Less than $50,000 | 44 (15.9%) | 35 (20.2%) |
| $50,000 to $99,999 | 36 (13.0%) | 0 (0.0%) |
| $100,000 to $299,999 | 172 (62.3%) | 138 (79.8%) |
| $300,000 to $499,999 | 0 (0.0%) | 0 (0.0%) |
| $500,000 to $749,999 | 24 (8.7%) | 0 (0.0%) |
| $750,000 to $999,999 | 0 (0.0%) | 0 (0.0%) |
| $1,000,000 or more | 0 (0.0%) | 0 (0.0%) |
| Total | 276 (100.0%) | 173 (100.0%) |
Household Income by Mortgage Status in Gila Bend
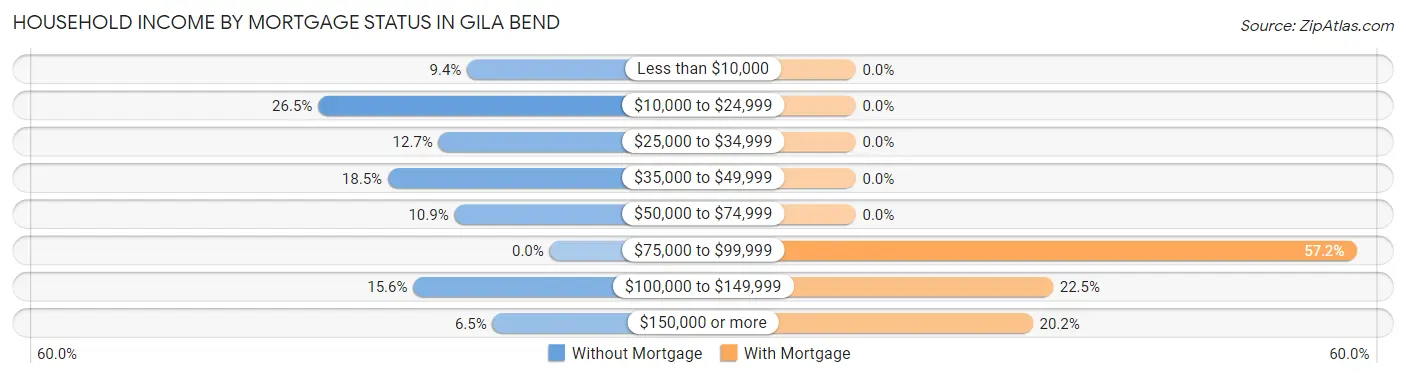
| Household Income | Without Mortgage | With Mortgage |
| Less than $10,000 | 26 (9.4%) | 0 (0.0%) |
| $10,000 to $24,999 | 73 (26.5%) | 0 (0.0%) |
| $25,000 to $34,999 | 35 (12.7%) | 0 (0.0%) |
| $35,000 to $49,999 | 51 (18.5%) | 0 (0.0%) |
| $50,000 to $74,999 | 30 (10.9%) | 0 (0.0%) |
| $75,000 to $99,999 | 0 (0.0%) | 99 (57.2%) |
| $100,000 to $149,999 | 43 (15.6%) | 39 (22.5%) |
| $150,000 or more | 18 (6.5%) | 35 (20.2%) |
| Total | 276 (100.0%) | 173 (100.0%) |
Property Value to Household Income Ratio in Gila Bend
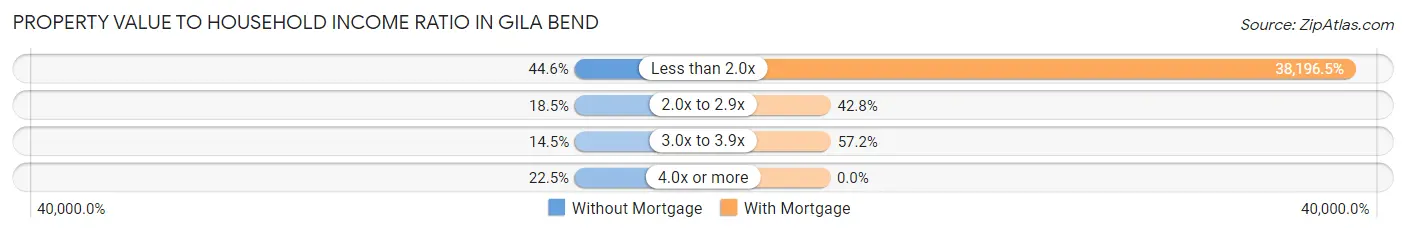
| Value-to-Income Ratio | Without Mortgage | With Mortgage |
| Less than 2.0x | 123 (44.6%) | 66,080 (38,196.5%) |
| 2.0x to 2.9x | 51 (18.5%) | 74 (42.8%) |
| 3.0x to 3.9x | 40 (14.5%) | 99 (57.2%) |
| 4.0x or more | 62 (22.5%) | 0 (0.0%) |
| Total | 276 (100.0%) | 173 (100.0%) |
Real Estate Taxes by Mortgage Status in Gila Bend
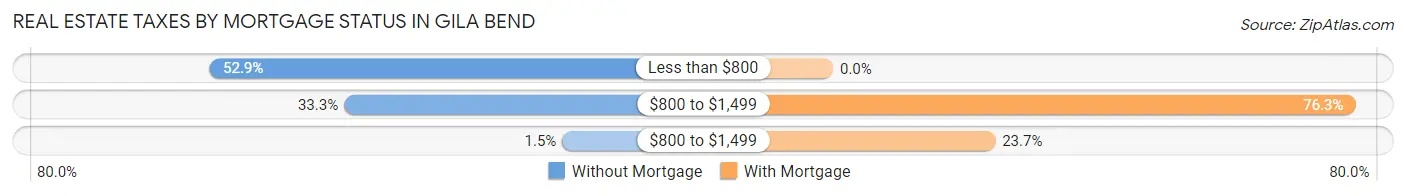
| Property Taxes | Without Mortgage | With Mortgage |
| Less than $800 | 146 (52.9%) | 0 (0.0%) |
| $800 to $1,499 | 92 (33.3%) | 132 (76.3%) |
| $800 to $1,499 | 4 (1.5%) | 41 (23.7%) |
| Total | 276 (100.0%) | 173 (100.0%) |
Health & Disability in Gila Bend
Health Insurance Coverage by Age in Gila Bend
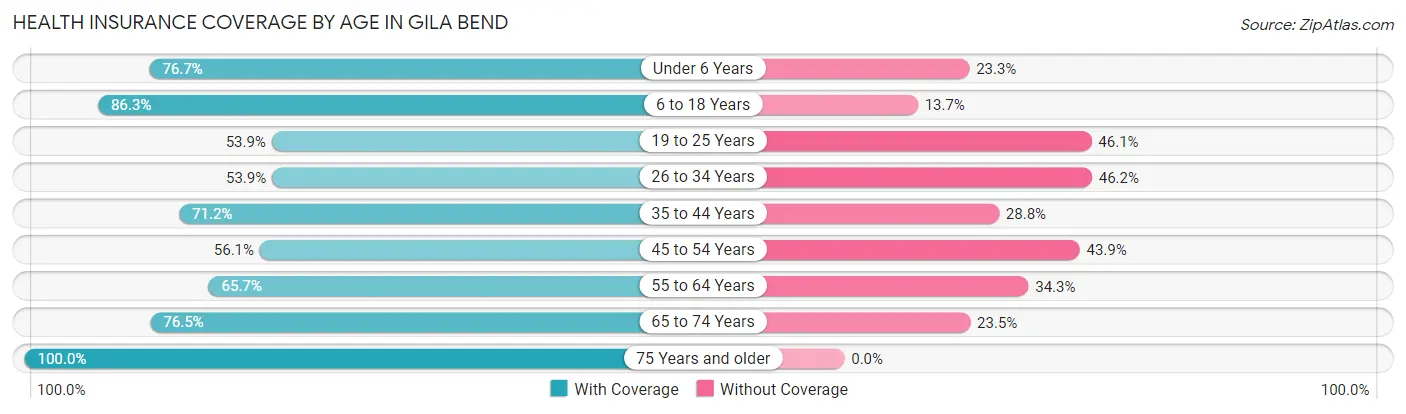
| Age Bracket | With Coverage | Without Coverage |
| Under 6 Years | 56 (76.7%) | 17 (23.3%) |
| 6 to 18 Years | 290 (86.3%) | 46 (13.7%) |
| 19 to 25 Years | 55 (53.9%) | 47 (46.1%) |
| 26 to 34 Years | 126 (53.8%) | 108 (46.2%) |
| 35 to 44 Years | 158 (71.2%) | 64 (28.8%) |
| 45 to 54 Years | 151 (56.1%) | 118 (43.9%) |
| 55 to 64 Years | 155 (65.7%) | 81 (34.3%) |
| 65 to 74 Years | 150 (76.5%) | 46 (23.5%) |
| 75 Years and older | 115 (100.0%) | 0 (0.0%) |
| Total | 1,256 (70.4%) | 527 (29.6%) |
Health Insurance Coverage by Citizenship Status in Gila Bend
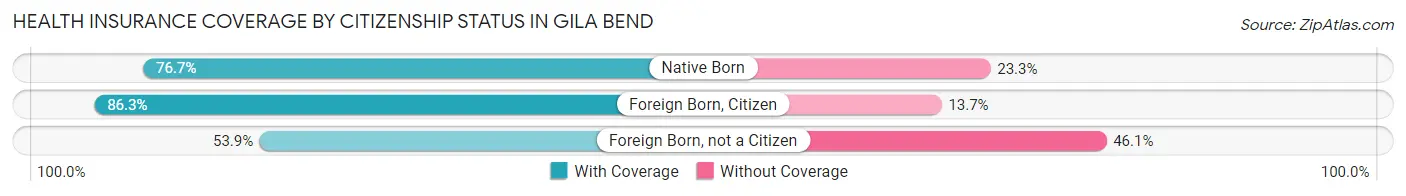
| Citizenship Status | With Coverage | Without Coverage |
| Native Born | 56 (76.7%) | 17 (23.3%) |
| Foreign Born, Citizen | 290 (86.3%) | 46 (13.7%) |
| Foreign Born, not a Citizen | 55 (53.9%) | 47 (46.1%) |
Health Insurance Coverage by Household Income in Gila Bend
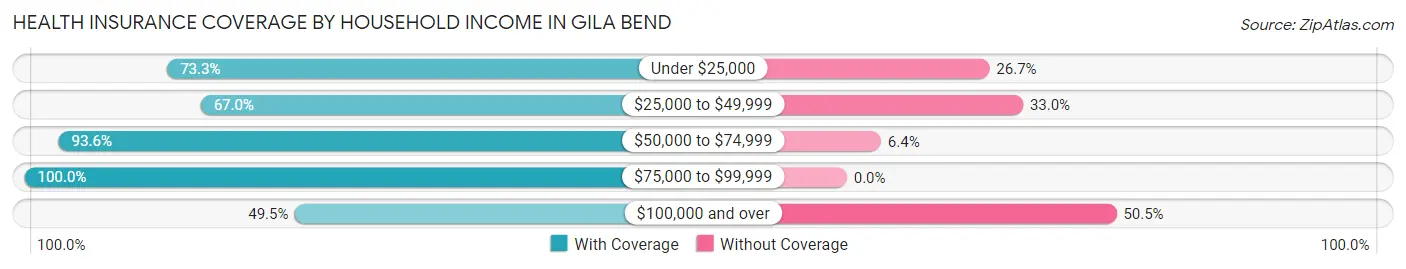
| Household Income | With Coverage | Without Coverage |
| Under $25,000 | 277 (73.3%) | 101 (26.7%) |
| $25,000 to $49,999 | 335 (67.0%) | 165 (33.0%) |
| $50,000 to $74,999 | 293 (93.6%) | 20 (6.4%) |
| $75,000 to $99,999 | 115 (100.0%) | 0 (0.0%) |
| $100,000 and over | 236 (49.5%) | 241 (50.5%) |
Public vs Private Health Insurance Coverage by Age in Gila Bend
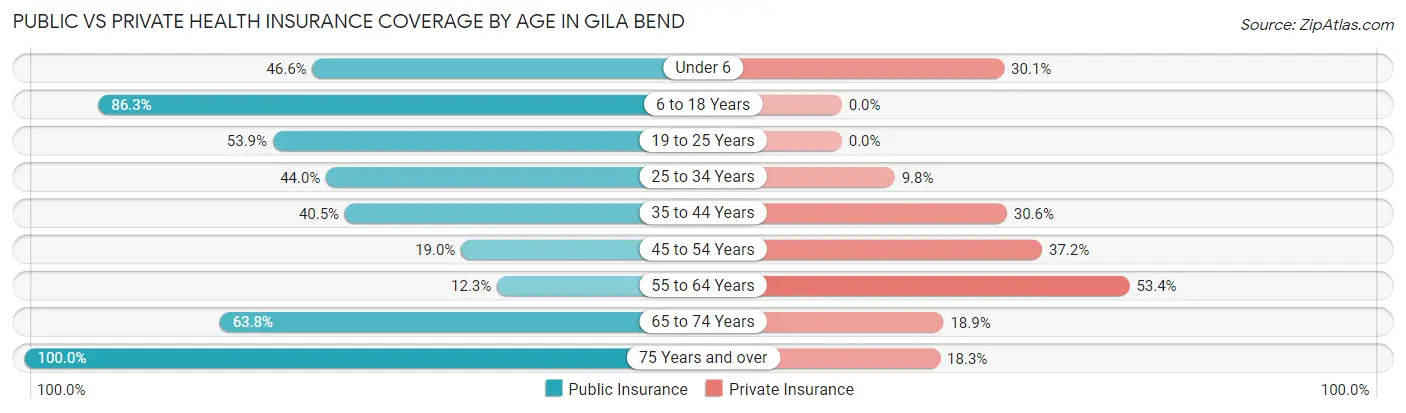
| Age Bracket | Public Insurance | Private Insurance |
| Under 6 | 34 (46.6%) | 22 (30.1%) |
| 6 to 18 Years | 290 (86.3%) | 0 (0.0%) |
| 19 to 25 Years | 55 (53.9%) | 0 (0.0%) |
| 25 to 34 Years | 103 (44.0%) | 23 (9.8%) |
| 35 to 44 Years | 90 (40.5%) | 68 (30.6%) |
| 45 to 54 Years | 51 (19.0%) | 100 (37.2%) |
| 55 to 64 Years | 29 (12.3%) | 126 (53.4%) |
| 65 to 74 Years | 125 (63.8%) | 37 (18.9%) |
| 75 Years and over | 115 (100.0%) | 21 (18.3%) |
| Total | 892 (50.0%) | 397 (22.3%) |
Disability Status by Sex by Age in Gila Bend
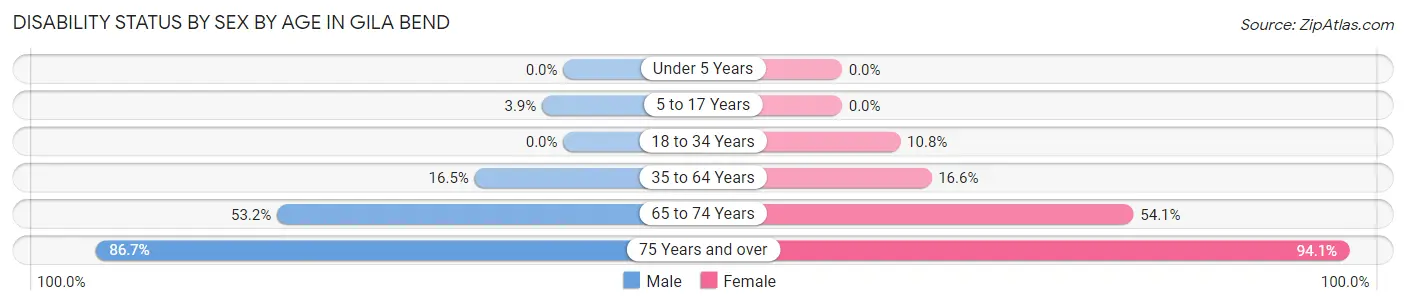
| Age Bracket | Male | Female |
| Under 5 Years | 0 (0.0%) | 0 (0.0%) |
| 5 to 17 Years | 8 (3.9%) | 0 (0.0%) |
| 18 to 34 Years | 0 (0.0%) | 17 (10.8%) |
| 35 to 64 Years | 78 (16.5%) | 42 (16.6%) |
| 65 to 74 Years | 59 (53.1%) | 46 (54.1%) |
| 75 Years and over | 26 (86.7%) | 80 (94.1%) |
Disability Class by Sex by Age in Gila Bend
Disability Class: Hearing Difficulty
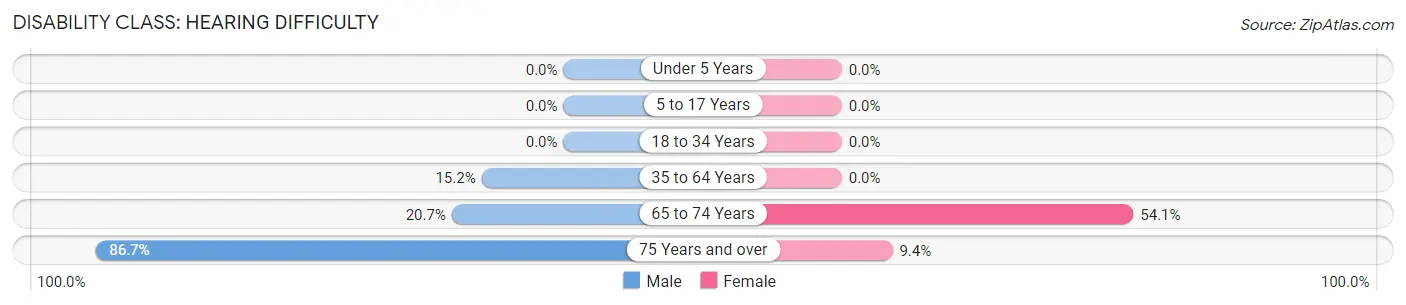
| Age Bracket | Male | Female |
| Under 5 Years | 0 (0.0%) | 0 (0.0%) |
| 5 to 17 Years | 0 (0.0%) | 0 (0.0%) |
| 18 to 34 Years | 0 (0.0%) | 0 (0.0%) |
| 35 to 64 Years | 72 (15.2%) | 0 (0.0%) |
| 65 to 74 Years | 23 (20.7%) | 46 (54.1%) |
| 75 Years and over | 26 (86.7%) | 8 (9.4%) |
Disability Class: Vision Difficulty
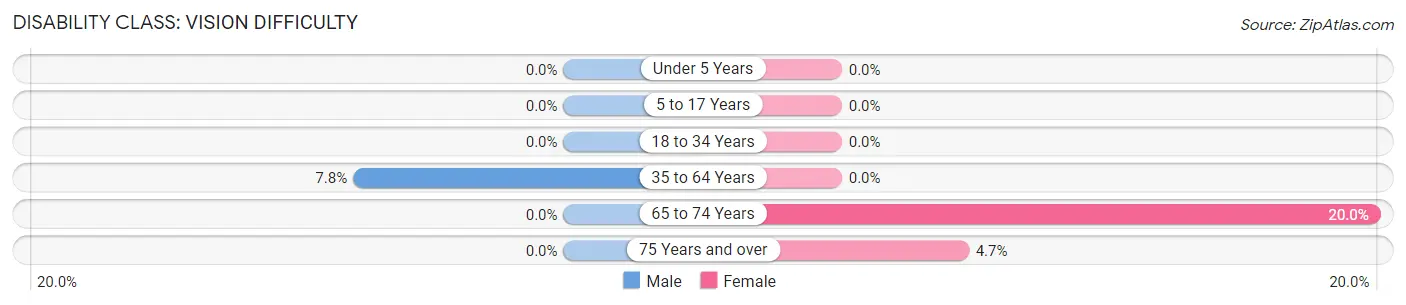
| Age Bracket | Male | Female |
| Under 5 Years | 0 (0.0%) | 0 (0.0%) |
| 5 to 17 Years | 0 (0.0%) | 0 (0.0%) |
| 18 to 34 Years | 0 (0.0%) | 0 (0.0%) |
| 35 to 64 Years | 37 (7.8%) | 0 (0.0%) |
| 65 to 74 Years | 0 (0.0%) | 17 (20.0%) |
| 75 Years and over | 0 (0.0%) | 4 (4.7%) |
Disability Class: Cognitive Difficulty
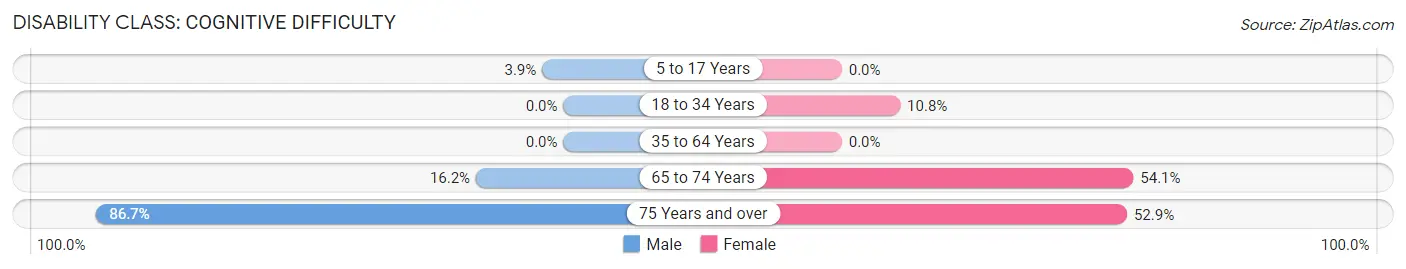
| Age Bracket | Male | Female |
| 5 to 17 Years | 8 (3.9%) | 0 (0.0%) |
| 18 to 34 Years | 0 (0.0%) | 17 (10.8%) |
| 35 to 64 Years | 0 (0.0%) | 0 (0.0%) |
| 65 to 74 Years | 18 (16.2%) | 46 (54.1%) |
| 75 Years and over | 26 (86.7%) | 45 (52.9%) |
Disability Class: Ambulatory Difficulty
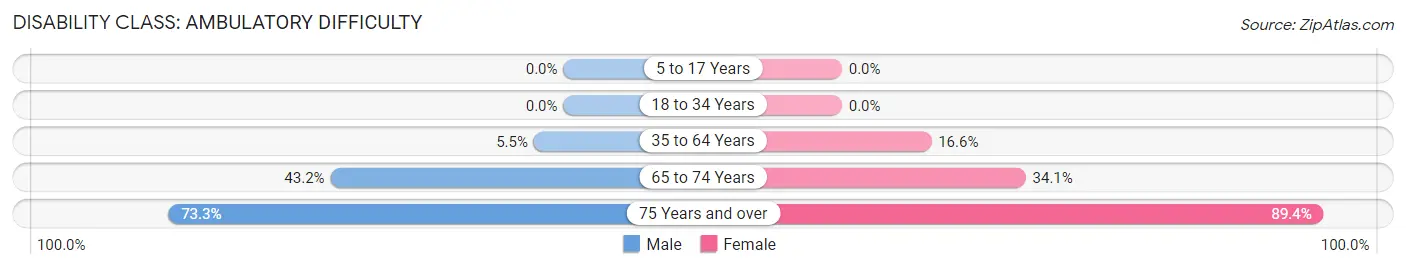
| Age Bracket | Male | Female |
| 5 to 17 Years | 0 (0.0%) | 0 (0.0%) |
| 18 to 34 Years | 0 (0.0%) | 0 (0.0%) |
| 35 to 64 Years | 26 (5.5%) | 42 (16.6%) |
| 65 to 74 Years | 48 (43.2%) | 29 (34.1%) |
| 75 Years and over | 22 (73.3%) | 76 (89.4%) |
Disability Class: Self-Care Difficulty
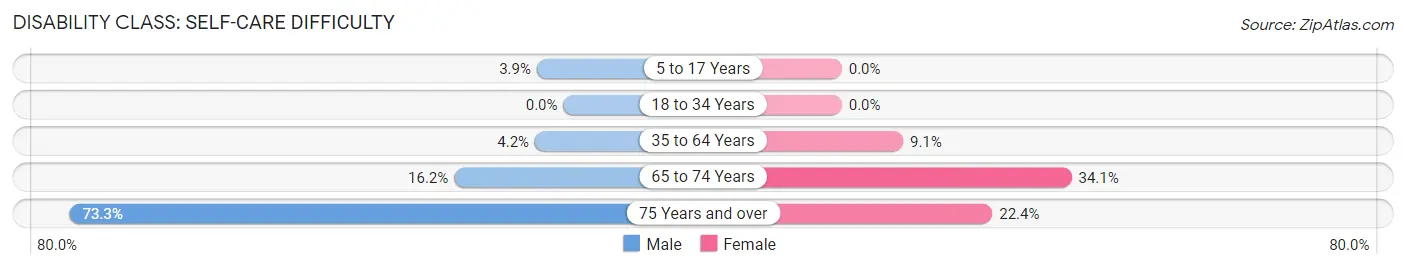
| Age Bracket | Male | Female |
| 5 to 17 Years | 8 (3.9%) | 0 (0.0%) |
| 18 to 34 Years | 0 (0.0%) | 0 (0.0%) |
| 35 to 64 Years | 20 (4.2%) | 23 (9.1%) |
| 65 to 74 Years | 18 (16.2%) | 29 (34.1%) |
| 75 Years and over | 22 (73.3%) | 19 (22.4%) |
Technology Access in Gila Bend
Computing Device Access in Gila Bend
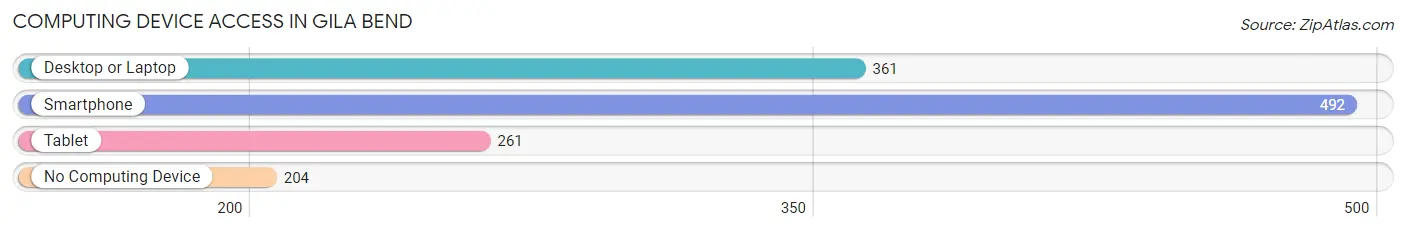
| Device Type | # Households | % Households |
| Desktop or Laptop | 361 | 50.4% |
| Smartphone | 492 | 68.7% |
| Tablet | 261 | 36.4% |
| No Computing Device | 204 | 28.5% |
| Total | 716 | 100.0% |
Internet Access in Gila Bend
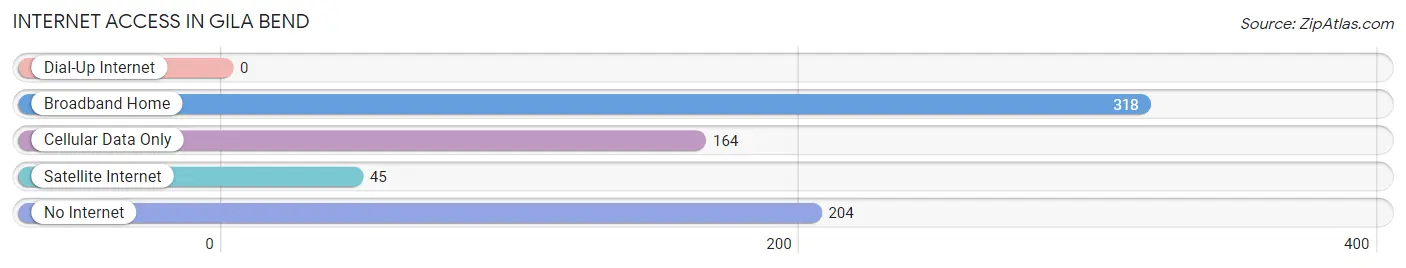
| Internet Type | # Households | % Households |
| Dial-Up Internet | 0 | 0.0% |
| Broadband Home | 318 | 44.4% |
| Cellular Data Only | 164 | 22.9% |
| Satellite Internet | 45 | 6.3% |
| No Internet | 204 | 28.5% |
| Total | 716 | 100.0% |
Gila Bend Summary
Gila Bend is a small town located in Maricopa County, Arizona, United States. It is situated along the Gila River, approximately 85 miles southwest of Phoenix. The town was founded in 1872 and has a population of approximately 2,000 people.
Geography
Gila Bend is located in the Sonoran Desert, at an elevation of 1,068 feet. The town is situated along the Gila River, which is a tributary of the Colorado River. The town is surrounded by the Gila Bend Mountains to the north and the Gila Bend Hills to the south. The climate in Gila Bend is hot and dry, with temperatures ranging from the mid-90s in the summer to the mid-50s in the winter.
Economy
Gila Bend’s economy is largely based on agriculture and tourism. The town is home to several farms, which produce a variety of crops, including cotton, alfalfa, and wheat. The town is also home to several tourist attractions, including the Gila Bend Museum, the Gila Bend Air Force Auxiliary Field, and the Gila Bend Speedway.
Demographics
As of the 2010 census, Gila Bend had a population of 2,084 people. The racial makeup of the town was 75.3% White, 0.7% African American, 0.9% Native American, 0.3% Asian, 0.1% Pacific Islander, 19.2% from other races, and 3.5% from two or more races. Hispanic or Latino of any race were 37.2% of the population.
The median income for a household in Gila Bend was $25,938, and the median income for a family was $30,938. The per capita income for the town was $13,845. About 22.2% of families and 25.7% of the population were below the poverty line, including 33.3% of those under age 18 and 16.7% of those age 65 or over.
History
Gila Bend was founded in 1872 by a group of settlers from the nearby town of Maricopa. The town was named after the nearby Gila River, which was named by Spanish explorers in the 1700s. The town was originally a stagecoach stop and a trading post for travelers heading to California.
In the late 1800s, Gila Bend became a popular stop for travelers on the Southern Pacific Railroad. The town was also home to several mines, which produced gold, silver, and copper.
In the early 1900s, Gila Bend became a popular tourist destination, with several hotels and resorts being built in the area. The town was also home to several military bases, including the Gila Bend Air Force Auxiliary Field, which was used during World War II.
In the late 20th century, Gila Bend experienced a population boom, with the town’s population increasing from 1,000 in 1980 to 2,000 in 2000. The town is now home to several businesses, including restaurants, shops, and hotels.
Gila Bend is a small town with a rich history and a bright future. The town is home to a diverse population and a thriving economy. With its close proximity to Phoenix and its many attractions, Gila Bend is an ideal destination for visitors looking to explore the Southwest.
Common Questions
What is Per Capita Income in Gila Bend?
Per Capita income in Gila Bend is $27,947.
What is the Median Family Income in Gila Bend?
Median Family Income in Gila Bend is $63,641.
What is the Median Household income in Gila Bend?
Median Household Income in Gila Bend is $52,879.
What is Income or Wage Gap in Gila Bend?
Income or Wage Gap in Gila Bend is 59.7%.
Women in Gila Bend earn 40.3 cents for every dollar earned by a man.
What is Family Income Deficit in Gila Bend?
Family Income Deficit in Gila Bend is $11,510.
Families that are below poverty line in Gila Bend earn $11,510 less on average than the poverty threshold level.
What is Inequality or Gini Index in Gila Bend?
Inequality or Gini Index in Gila Bend is 0.46.
What is the Total Population of Gila Bend?
Total Population of Gila Bend is 1,783.
What is the Total Male Population of Gila Bend?
Total Male Population of Gila Bend is 1,036.
What is the Total Female Population of Gila Bend?
Total Female Population of Gila Bend is 747.
What is the Ratio of Males per 100 Females in Gila Bend?
There are 138.69 Males per 100 Females in Gila Bend.
What is the Ratio of Females per 100 Males in Gila Bend?
There are 72.10 Females per 100 Males in Gila Bend.
What is the Median Population Age in Gila Bend?
Median Population Age in Gila Bend is 39.9 Years.
What is the Average Family Size in Gila Bend
Average Family Size in Gila Bend is 3.1 People.
What is the Average Household Size in Gila Bend
Average Household Size in Gila Bend is 2.5 People.
How Large is the Labor Force in Gila Bend?
There are 902 People in the Labor Forcein in Gila Bend.
What is the Percentage of People in the Labor Force in Gila Bend?
63.4% of People are in the Labor Force in Gila Bend.