Locust Fork, AL Map & Demographics
Locust Fork Map
Locust Fork Overview
$27,506
PER CAPITA INCOME
$55,096
AVG FAMILY INCOME
$44,688
AVG HOUSEHOLD INCOME
41.6%
WAGE / INCOME GAP [ % ]
58.4¢/ $1
WAGE / INCOME GAP [ $ ]
$8,092
FAMILY INCOME DEFICIT
0.44
INEQUALITY / GINI INDEX
1,316
TOTAL POPULATION
574
MALE POPULATION
742
FEMALE POPULATION
77.36
MALES / 100 FEMALES
129.27
FEMALES / 100 MALES
47.7
MEDIAN AGE
2.9
AVG FAMILY SIZE
2.6
AVG HOUSEHOLD SIZE
524
LABOR FORCE [ PEOPLE ]
48.7%
PERCENT IN LABOR FORCE
5.4%
UNEMPLOYMENT RATE
Locust Fork Zip Codes
Locust Fork Area Codes
Income in Locust Fork
Income Overview in Locust Fork
Per Capita Income in Locust Fork is $27,506, while median incomes of families and households are $55,096 and $44,688 respectively.
| Characteristic | Number | Measure |
| Per Capita Income | 1,316 | $27,506 |
| Median Family Income | 381 | $55,096 |
| Mean Family Income | 381 | $72,069 |
| Median Household Income | 511 | $44,688 |
| Mean Household Income | 511 | $65,203 |
| Income Deficit | 381 | $8,092 |
| Wage / Income Gap (%) | 1,316 | 41.60% |
| Wage / Income Gap ($) | 1,316 | 58.40¢ per $1 |
| Gini / Inequality Index | 1,316 | 0.44 |
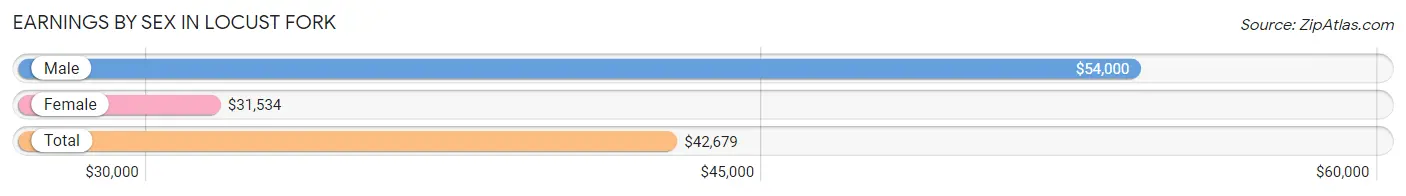
Earnings by Sex in Locust Fork
Average Earnings in Locust Fork are $42,679, $54,000 for men and $31,534 for women, a difference of 41.6%.
| Sex | Number | Average Earnings |
| Male | 284 (52.5%) | $54,000 |
| Female | 257 (47.5%) | $31,534 |
| Total | 541 (100.0%) | $42,679 |
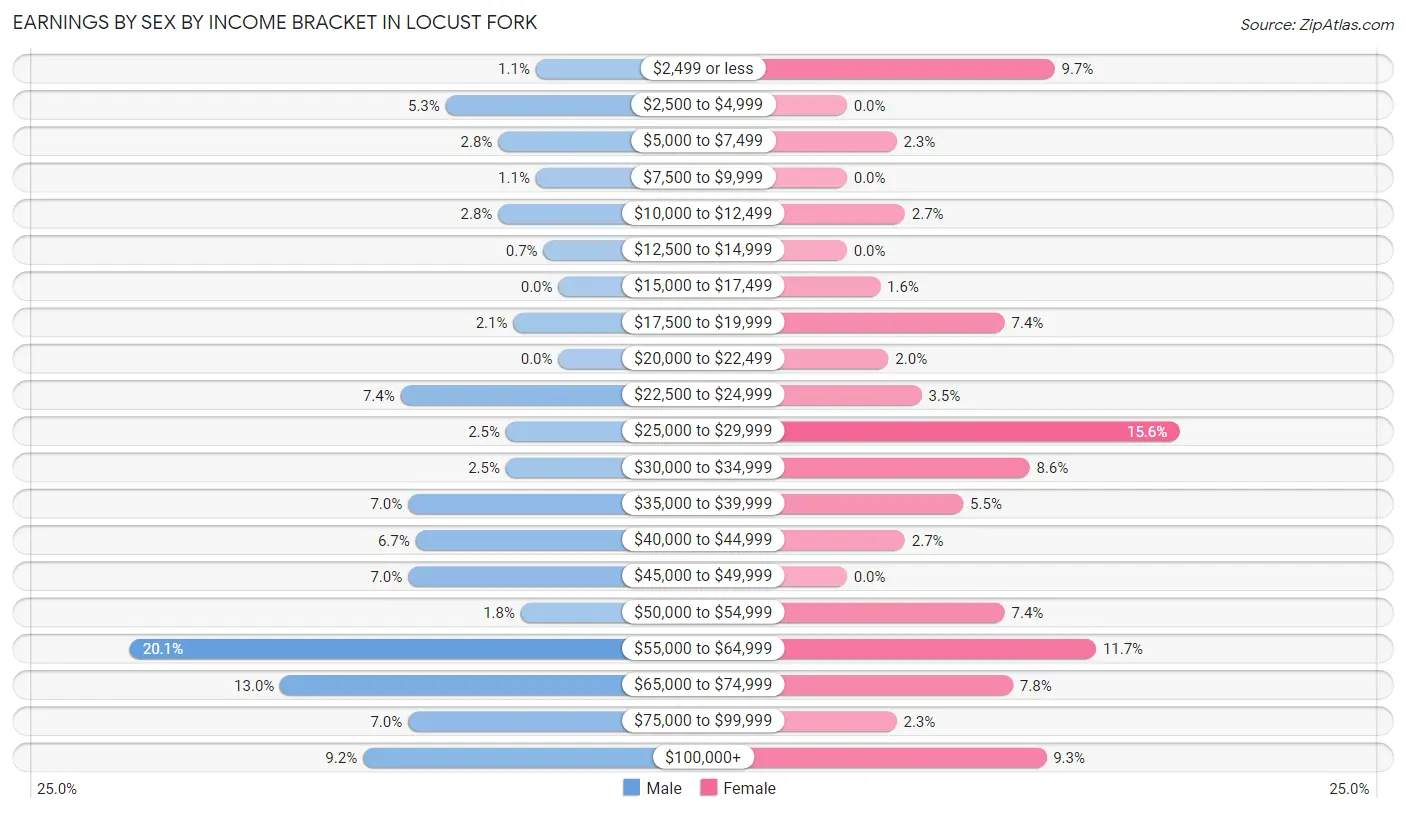
Earnings by Sex by Income Bracket in Locust Fork
The most common earnings brackets in Locust Fork are $55,000 to $64,999 for men (57 | 20.1%) and $25,000 to $29,999 for women (40 | 15.6%).
| Income | Male | Female |
| $2,499 or less | 3 (1.1%) | 25 (9.7%) |
| $2,500 to $4,999 | 15 (5.3%) | 0 (0.0%) |
| $5,000 to $7,499 | 8 (2.8%) | 6 (2.3%) |
| $7,500 to $9,999 | 3 (1.1%) | 0 (0.0%) |
| $10,000 to $12,499 | 8 (2.8%) | 7 (2.7%) |
| $12,500 to $14,999 | 2 (0.7%) | 0 (0.0%) |
| $15,000 to $17,499 | 0 (0.0%) | 4 (1.6%) |
| $17,500 to $19,999 | 6 (2.1%) | 19 (7.4%) |
| $20,000 to $22,499 | 0 (0.0%) | 5 (1.9%) |
| $22,500 to $24,999 | 21 (7.4%) | 9 (3.5%) |
| $25,000 to $29,999 | 7 (2.5%) | 40 (15.6%) |
| $30,000 to $34,999 | 7 (2.5%) | 22 (8.6%) |
| $35,000 to $39,999 | 20 (7.0%) | 14 (5.4%) |
| $40,000 to $44,999 | 19 (6.7%) | 7 (2.7%) |
| $45,000 to $49,999 | 20 (7.0%) | 0 (0.0%) |
| $50,000 to $54,999 | 5 (1.8%) | 19 (7.4%) |
| $55,000 to $64,999 | 57 (20.1%) | 30 (11.7%) |
| $65,000 to $74,999 | 37 (13.0%) | 20 (7.8%) |
| $75,000 to $99,999 | 20 (7.0%) | 6 (2.3%) |
| $100,000+ | 26 (9.1%) | 24 (9.3%) |
| Total | 284 (100.0%) | 257 (100.0%) |
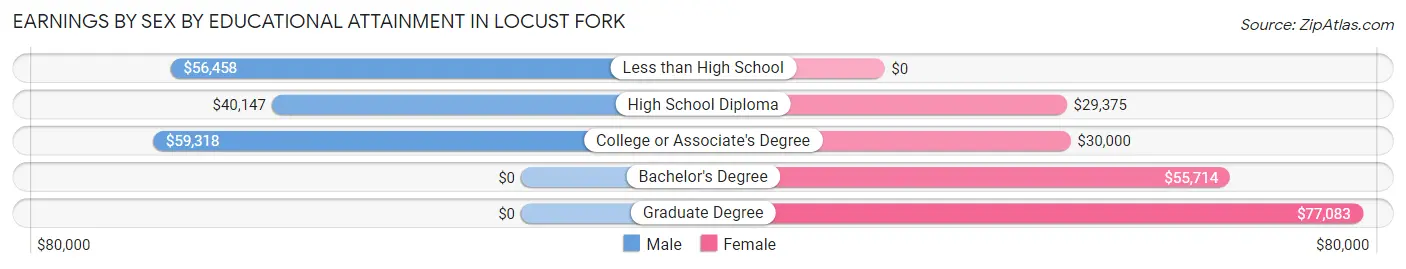
Earnings by Sex by Educational Attainment in Locust Fork
Average earnings in Locust Fork are $54,750 for men and $32,102 for women, a difference of 41.4%. Men with an educational attainment of college or associate's degree enjoy the highest average annual earnings of $59,318, while those with high school diploma education earn the least with $40,147. Women with an educational attainment of graduate degree earn the most with the average annual earnings of $77,083, while those with high school diploma education have the smallest earnings of $29,375.
| Educational Attainment | Male Income | Female Income |
| Less than High School | $56,458 | $0 |
| High School Diploma | $40,147 | $29,375 |
| College or Associate's Degree | $59,318 | $30,000 |
| Bachelor's Degree | - | - |
| Graduate Degree | - | - |
| Total | $54,750 | $32,102 |
Family Income in Locust Fork
Family Income Brackets in Locust Fork
According to the Locust Fork family income data, there are 83 families falling into the $100,000 to $149,999 income range, which is the most common income bracket and makes up 21.8% of all families. Conversely, the $10,000 to $14,999 income bracket is the least frequent group with only 3 families (0.8%) belonging to this category.
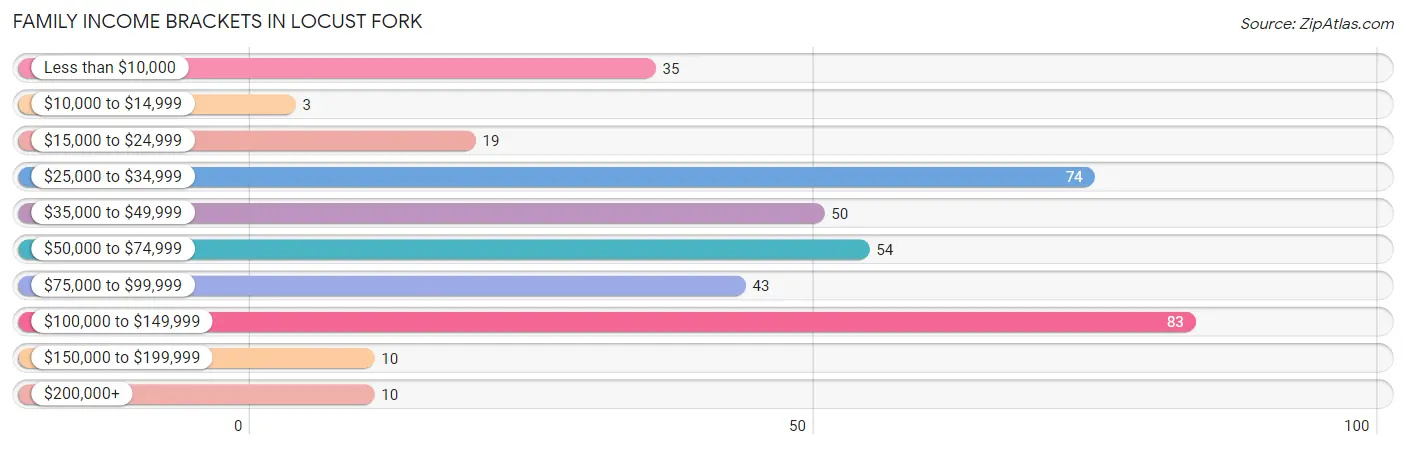
| Income Bracket | # Families | % Families |
| Less than $10,000 | 35 | 9.2% |
| $10,000 to $14,999 | 3 | 0.8% |
| $15,000 to $24,999 | 19 | 5.0% |
| $25,000 to $34,999 | 74 | 19.4% |
| $35,000 to $49,999 | 50 | 13.1% |
| $50,000 to $74,999 | 54 | 14.2% |
| $75,000 to $99,999 | 43 | 11.3% |
| $100,000 to $149,999 | 83 | 21.8% |
| $150,000 to $199,999 | 10 | 2.6% |
| $200,000+ | 10 | 2.6% |
Family Income by Famaliy Size in Locust Fork
5-person families (19 | 5.0%) account for the highest median family income in Locust Fork with $82,188 per family, while 3-person families (66 | 17.3%) have the highest median income of $23,194 per family member.
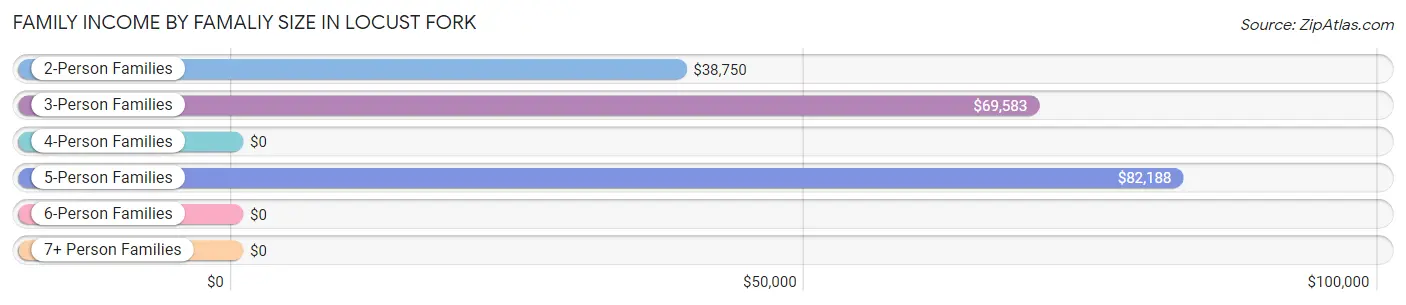
| Income Bracket | # Families | Median Income |
| 2-Person Families | 236 (61.9%) | $38,750 |
| 3-Person Families | 66 (17.3%) | $69,583 |
| 4-Person Families | 52 (13.7%) | $0 |
| 5-Person Families | 19 (5.0%) | $82,188 |
| 6-Person Families | 8 (2.1%) | $0 |
| 7+ Person Families | 0 (0.0%) | $0 |
| Total | 381 (100.0%) | $55,096 |
Family Income by Number of Earners in Locust Fork
The median family income in Locust Fork is $55,096, with families comprising 2 earners (111) having the highest median family income of $121,250, while families with no earners (133) have the lowest median family income of $34,659, accounting for 29.1% and 34.9% of families, respectively.
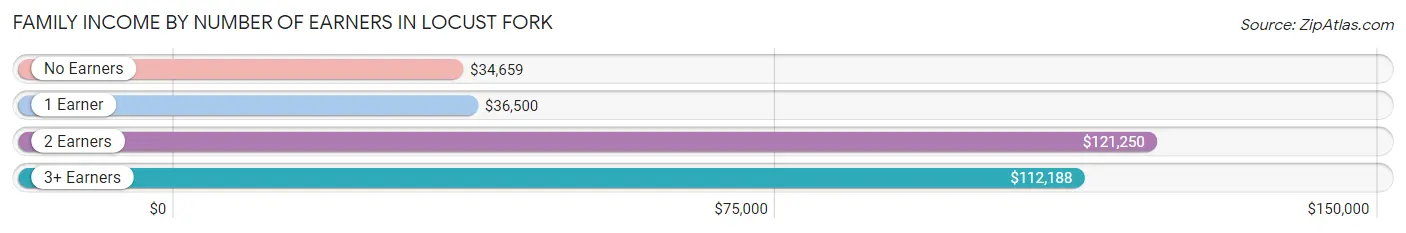
| Number of Earners | # Families | Median Income |
| No Earners | 133 (34.9%) | $34,659 |
| 1 Earner | 122 (32.0%) | $36,500 |
| 2 Earners | 111 (29.1%) | $121,250 |
| 3+ Earners | 15 (3.9%) | $112,188 |
| Total | 381 (100.0%) | $55,096 |
Household Income in Locust Fork
Household Income Brackets in Locust Fork
With 92 households falling in the category, the $100,000 to $149,999 income range is the most frequent in Locust Fork, accounting for 18.0% of all households. In contrast, only 3 households (0.6%) fall into the $10,000 to $14,999 income bracket, making it the least populous group.
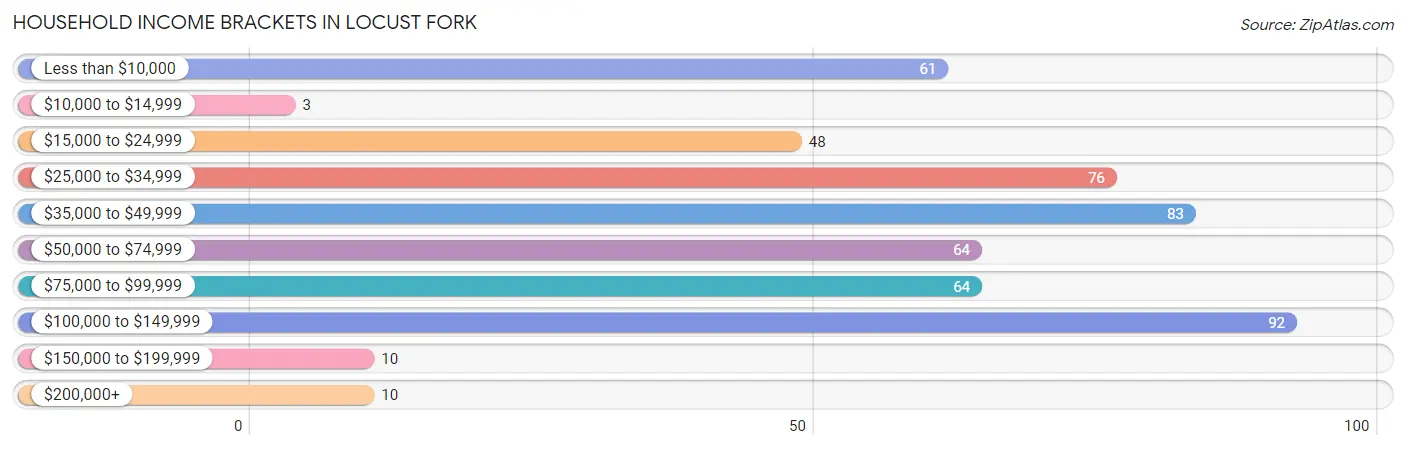
| Income Bracket | # Households | % Households |
| Less than $10,000 | 61 | 11.9% |
| $10,000 to $14,999 | 3 | 0.6% |
| $15,000 to $24,999 | 48 | 9.4% |
| $25,000 to $34,999 | 76 | 14.9% |
| $35,000 to $49,999 | 83 | 16.2% |
| $50,000 to $74,999 | 64 | 12.5% |
| $75,000 to $99,999 | 64 | 12.5% |
| $100,000 to $149,999 | 92 | 18.0% |
| $150,000 to $199,999 | 10 | 2.0% |
| $200,000+ | 10 | 2.0% |
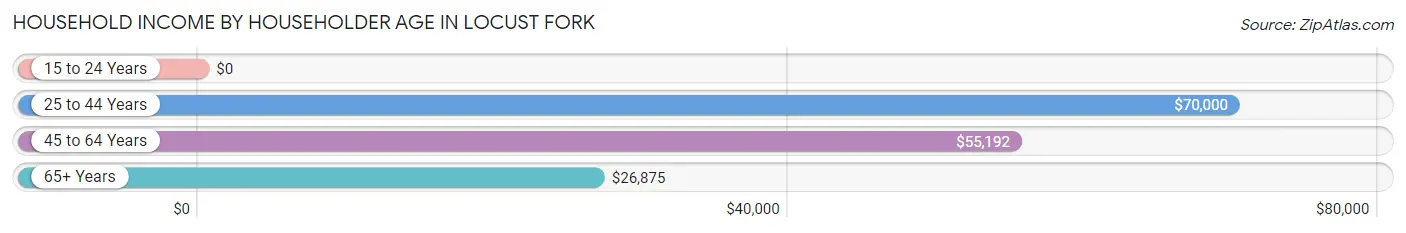
Household Income by Householder Age in Locust Fork
The median household income in Locust Fork is $44,688, with the highest median household income of $70,000 found in the 25 to 44 years age bracket for the primary householder. A total of 120 households (23.5%) fall into this category.
| Income Bracket | # Households | Median Income |
| 15 to 24 Years | 0 (0.0%) | $0 |
| 25 to 44 Years | 120 (23.5%) | $70,000 |
| 45 to 64 Years | 262 (51.3%) | $55,192 |
| 65+ Years | 129 (25.2%) | $26,875 |
| Total | 511 (100.0%) | $44,688 |
Poverty in Locust Fork
Income Below Poverty by Sex and Age in Locust Fork
With 18.5% poverty level for males and 19.4% for females among the residents of Locust Fork, 75 year old and over males and 16 and 17 year old females are the most vulnerable to poverty, with 34 males (70.8%) and 3 females (50.0%) in their respective age groups living below the poverty level.
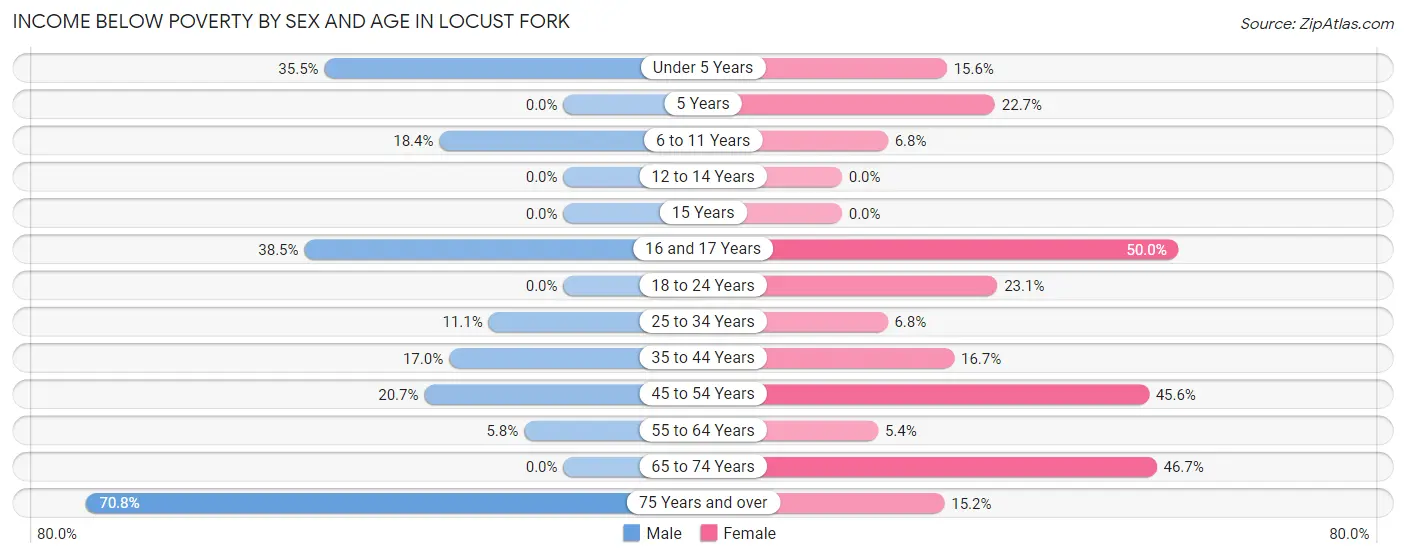
| Age Bracket | Male | Female |
| Under 5 Years | 11 (35.5%) | 12 (15.6%) |
| 5 Years | 0 (0.0%) | 5 (22.7%) |
| 6 to 11 Years | 7 (18.4%) | 3 (6.8%) |
| 12 to 14 Years | 0 (0.0%) | 0 (0.0%) |
| 15 Years | 0 (0.0%) | 0 (0.0%) |
| 16 and 17 Years | 5 (38.5%) | 3 (50.0%) |
| 18 to 24 Years | 0 (0.0%) | 12 (23.1%) |
| 25 to 34 Years | 4 (11.1%) | 8 (6.8%) |
| 35 to 44 Years | 18 (17.0%) | 7 (16.7%) |
| 45 to 54 Years | 19 (20.6%) | 36 (45.6%) |
| 55 to 64 Years | 8 (5.8%) | 8 (5.4%) |
| 65 to 74 Years | 0 (0.0%) | 43 (46.7%) |
| 75 Years and over | 34 (70.8%) | 7 (15.2%) |
| Total | 106 (18.5%) | 144 (19.4%) |
Income Above Poverty by Sex and Age in Locust Fork
According to the poverty statistics in Locust Fork, males aged 5 years and females aged 12 to 14 years are the age groups that are most secure financially, with 100.0% of males and 100.0% of females in these age groups living above the poverty line.

| Age Bracket | Male | Female |
| Under 5 Years | 20 (64.5%) | 65 (84.4%) |
| 5 Years | 3 (100.0%) | 17 (77.3%) |
| 6 to 11 Years | 31 (81.6%) | 41 (93.2%) |
| 12 to 14 Years | 9 (100.0%) | 15 (100.0%) |
| 15 Years | 0 (0.0%) | 0 (0.0%) |
| 16 and 17 Years | 8 (61.5%) | 3 (50.0%) |
| 18 to 24 Years | 3 (100.0%) | 40 (76.9%) |
| 25 to 34 Years | 32 (88.9%) | 110 (93.2%) |
| 35 to 44 Years | 88 (83.0%) | 35 (83.3%) |
| 45 to 54 Years | 73 (79.3%) | 43 (54.4%) |
| 55 to 64 Years | 129 (94.2%) | 141 (94.6%) |
| 65 to 74 Years | 58 (100.0%) | 49 (53.3%) |
| 75 Years and over | 14 (29.2%) | 39 (84.8%) |
| Total | 468 (81.5%) | 598 (80.6%) |
Income Below Poverty Among Married-Couple Families in Locust Fork
The poverty statistics for married-couple families in Locust Fork show that 18.0% or 55 of the total 306 families live below the poverty line. Families with 1 or 2 children have the highest poverty rate of 26.0%, comprising of 20 families. On the other hand, families with 3 or 4 children have the lowest poverty rate of 0.0%, which includes 0 families.
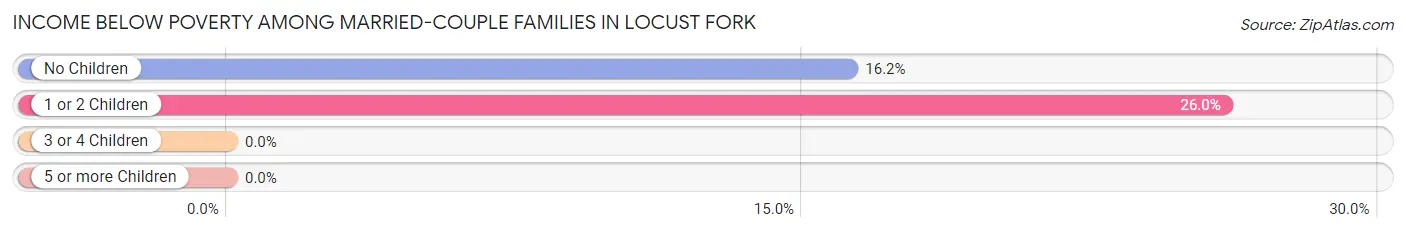
| Children | Above Poverty | Below Poverty |
| No Children | 181 (83.8%) | 35 (16.2%) |
| 1 or 2 Children | 57 (74.0%) | 20 (26.0%) |
| 3 or 4 Children | 13 (100.0%) | 0 (0.0%) |
| 5 or more Children | 0 (0.0%) | 0 (0.0%) |
| Total | 251 (82.0%) | 55 (18.0%) |
Income Below Poverty Among Single-Parent Households in Locust Fork
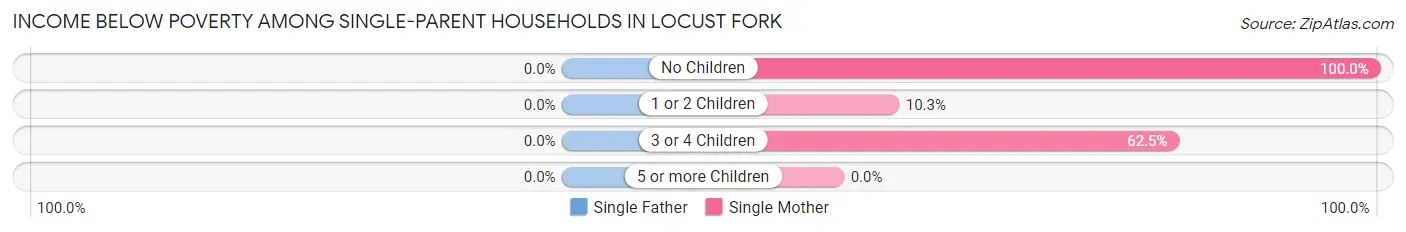
| Children | Single Father | Single Mother |
| No Children | 0 (0.0%) | 7 (100.0%) |
| 1 or 2 Children | 0 (0.0%) | 4 (10.3%) |
| 3 or 4 Children | 0 (0.0%) | 5 (62.5%) |
| 5 or more Children | 0 (0.0%) | 0 (0.0%) |
| Total | 0 (0.0%) | 16 (29.6%) |
Income Below Poverty Among Married-Couple vs Single-Parent Households in Locust Fork
The poverty data for Locust Fork shows that 55 of the married-couple family households (18.0%) and 16 of the single-parent households (21.3%) are living below the poverty level. Within the married-couple family households, those with 1 or 2 children have the highest poverty rate, with 20 households (26.0%) falling below the poverty line. Among the single-parent households, those with 3 or 4 children have the highest poverty rate, with 5 household (62.5%) living below poverty.
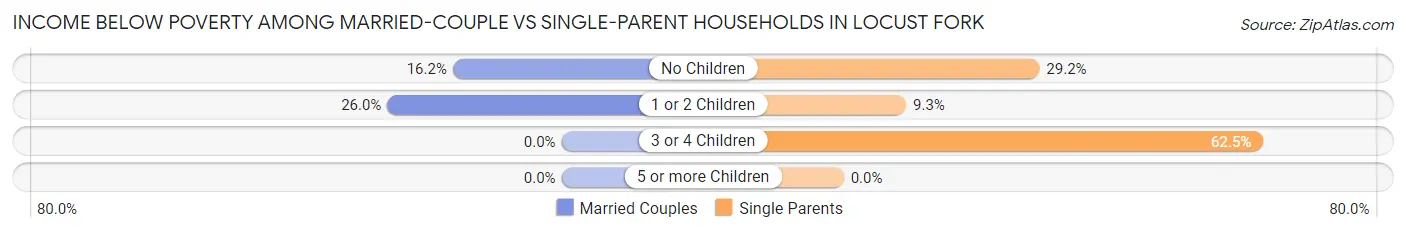
| Children | Married-Couple Families | Single-Parent Households |
| No Children | 35 (16.2%) | 7 (29.2%) |
| 1 or 2 Children | 20 (26.0%) | 4 (9.3%) |
| 3 or 4 Children | 0 (0.0%) | 5 (62.5%) |
| 5 or more Children | 0 (0.0%) | 0 (0.0%) |
| Total | 55 (18.0%) | 16 (21.3%) |
Race in Locust Fork
The most populous races in Locust Fork are White / Caucasian (1,273 | 96.7%), Two or more Races (31 | 2.4%), and Hispanic or Latino (16 | 1.2%).
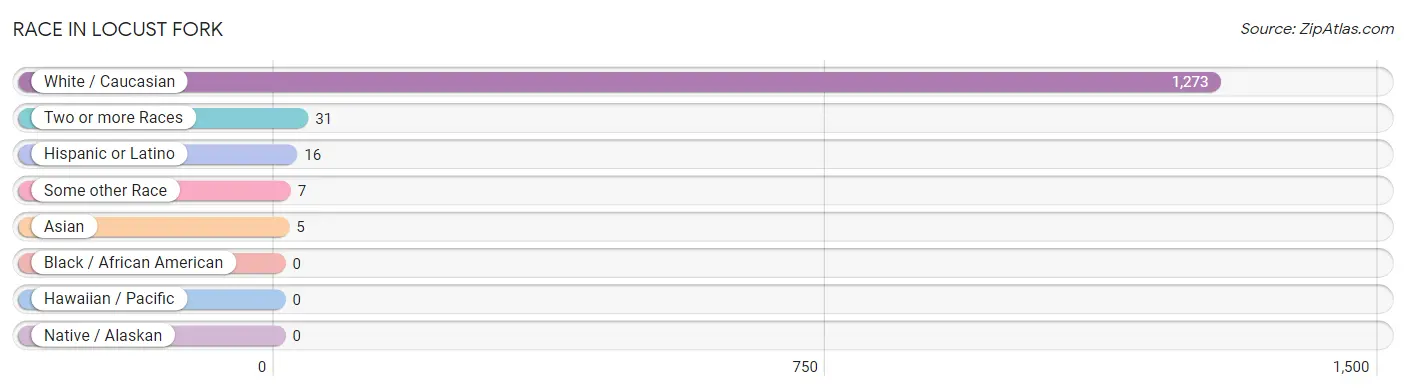
| Race | # Population | % Population |
| Asian | 5 | 0.4% |
| Black / African American | 0 | 0.0% |
| Hawaiian / Pacific | 0 | 0.0% |
| Hispanic or Latino | 16 | 1.2% |
| Native / Alaskan | 0 | 0.0% |
| White / Caucasian | 1,273 | 96.7% |
| Two or more Races | 31 | 2.4% |
| Some other Race | 7 | 0.5% |
| Total | 1,316 | 100.0% |
Ancestry in Locust Fork
The most populous ancestries reported in Locust Fork are American (246 | 18.7%), Irish (149 | 11.3%), English (127 | 9.7%), German (78 | 5.9%), and Italian (42 | 3.2%), together accounting for 48.8% of all Locust Fork residents.
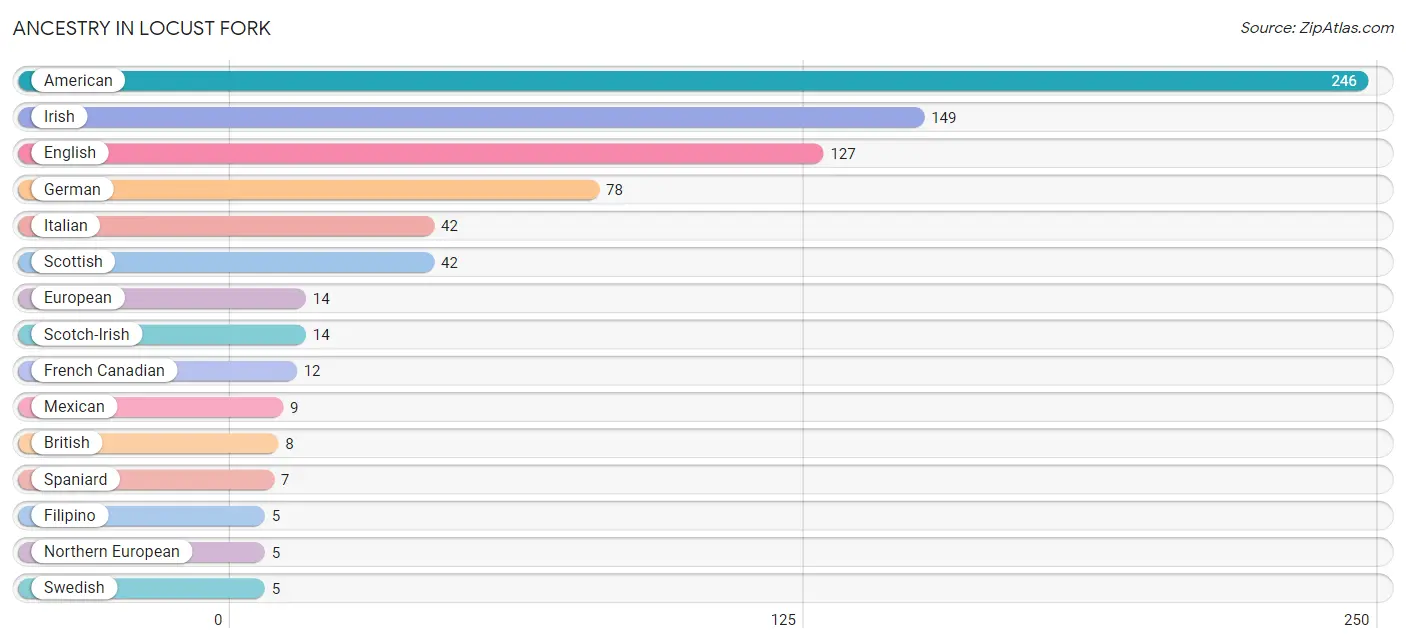
| Ancestry | # Population | % Population |
| American | 246 | 18.7% |
| Austrian | 3 | 0.2% |
| British | 8 | 0.6% |
| Cherokee | 3 | 0.2% |
| Dutch | 4 | 0.3% |
| English | 127 | 9.7% |
| European | 14 | 1.1% |
| Filipino | 5 | 0.4% |
| French | 3 | 0.2% |
| French Canadian | 12 | 0.9% |
| German | 78 | 5.9% |
| Irish | 149 | 11.3% |
| Italian | 42 | 3.2% |
| Mexican | 9 | 0.7% |
| Northern European | 5 | 0.4% |
| Scotch-Irish | 14 | 1.1% |
| Scottish | 42 | 3.2% |
| Slovak | 2 | 0.2% |
| Spaniard | 7 | 0.5% |
| Swedish | 5 | 0.4% |
| Swiss | 4 | 0.3% | View All 21 Rows |
Immigrants in Locust Fork
The most numerous immigrant groups reported in Locust Fork came from Europe (13 | 1.0%), Germany (10 | 0.8%), Western Europe (10 | 0.8%), and Northern Europe (3 | 0.2%), together accounting for 2.7% of all Locust Fork residents.
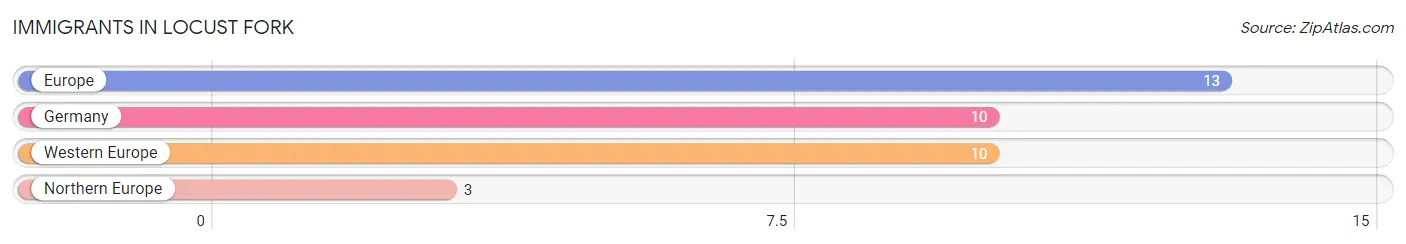
| Immigration Origin | # Population | % Population |
| Europe | 13 | 1.0% |
| Germany | 10 | 0.8% |
| Northern Europe | 3 | 0.2% |
| Western Europe | 10 | 0.8% | View All 4 Rows |
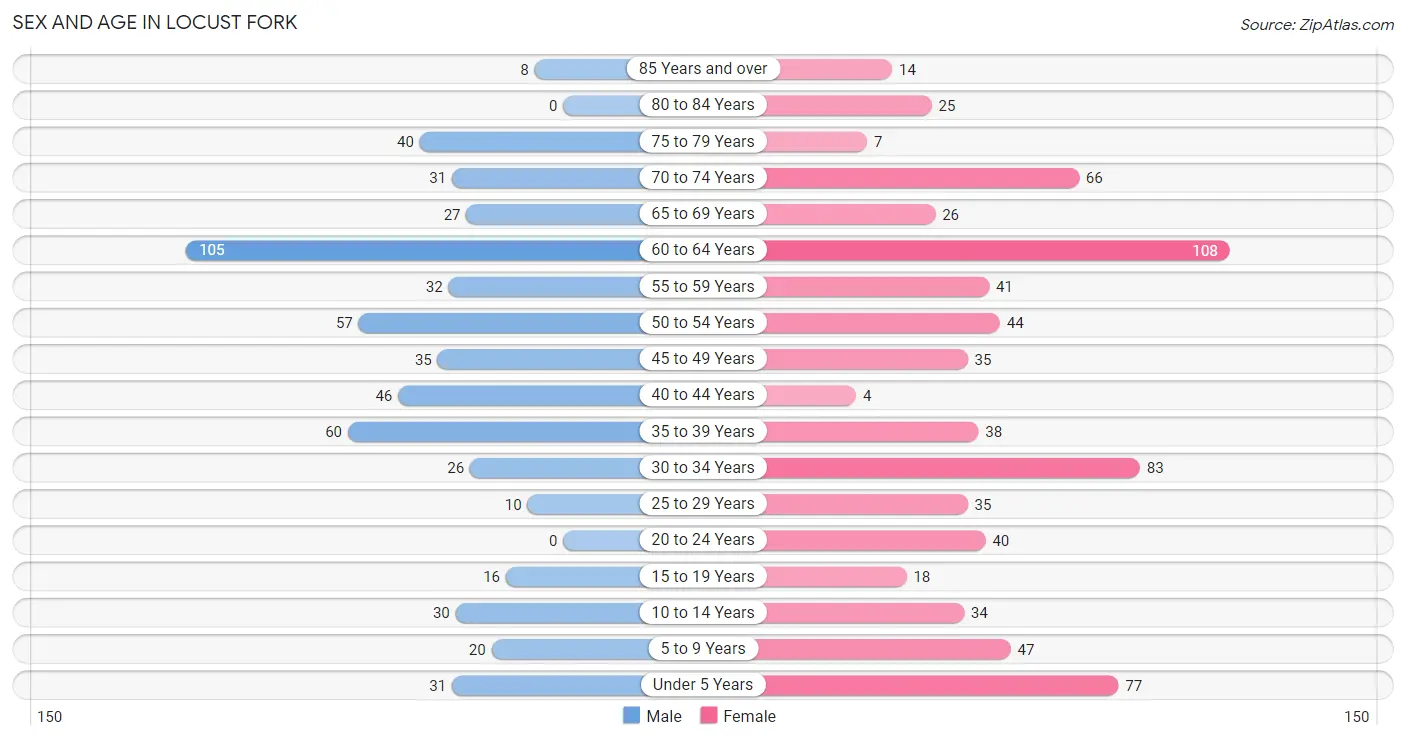
Sex and Age in Locust Fork
Sex and Age in Locust Fork
The most populous age groups in Locust Fork are 60 to 64 Years (105 | 18.3%) for men and 60 to 64 Years (108 | 14.6%) for women.
| Age Bracket | Male | Female |
| Under 5 Years | 31 (5.4%) | 77 (10.4%) |
| 5 to 9 Years | 20 (3.5%) | 47 (6.3%) |
| 10 to 14 Years | 30 (5.2%) | 34 (4.6%) |
| 15 to 19 Years | 16 (2.8%) | 18 (2.4%) |
| 20 to 24 Years | 0 (0.0%) | 40 (5.4%) |
| 25 to 29 Years | 10 (1.7%) | 35 (4.7%) |
| 30 to 34 Years | 26 (4.5%) | 83 (11.2%) |
| 35 to 39 Years | 60 (10.4%) | 38 (5.1%) |
| 40 to 44 Years | 46 (8.0%) | 4 (0.5%) |
| 45 to 49 Years | 35 (6.1%) | 35 (4.7%) |
| 50 to 54 Years | 57 (9.9%) | 44 (5.9%) |
| 55 to 59 Years | 32 (5.6%) | 41 (5.5%) |
| 60 to 64 Years | 105 (18.3%) | 108 (14.6%) |
| 65 to 69 Years | 27 (4.7%) | 26 (3.5%) |
| 70 to 74 Years | 31 (5.4%) | 66 (8.9%) |
| 75 to 79 Years | 40 (7.0%) | 7 (0.9%) |
| 80 to 84 Years | 0 (0.0%) | 25 (3.4%) |
| 85 Years and over | 8 (1.4%) | 14 (1.9%) |
| Total | 574 (100.0%) | 742 (100.0%) |
Families and Households in Locust Fork
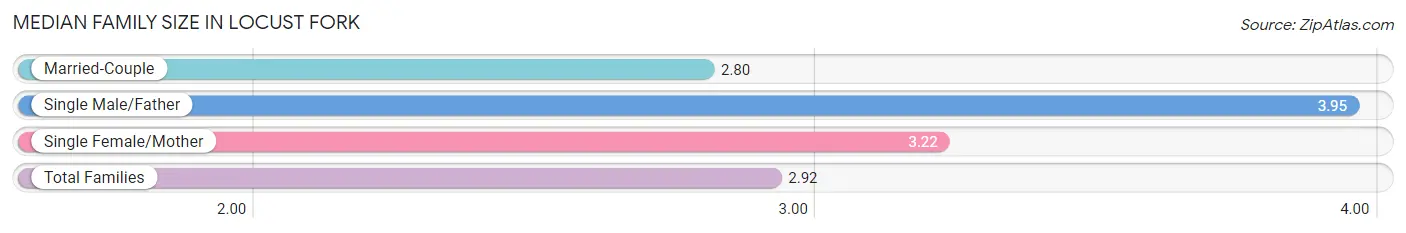
Median Family Size in Locust Fork
The median family size in Locust Fork is 2.92 persons per family, with single male/father families (21 | 5.5%) accounting for the largest median family size of 3.95 persons per family. On the other hand, married-couple families (306 | 80.3%) represent the smallest median family size with 2.80 persons per family.
| Family Type | # Families | Family Size |
| Married-Couple | 306 (80.3%) | 2.80 |
| Single Male/Father | 21 (5.5%) | 3.95 |
| Single Female/Mother | 54 (14.2%) | 3.22 |
| Total Families | 381 (100.0%) | 2.92 |
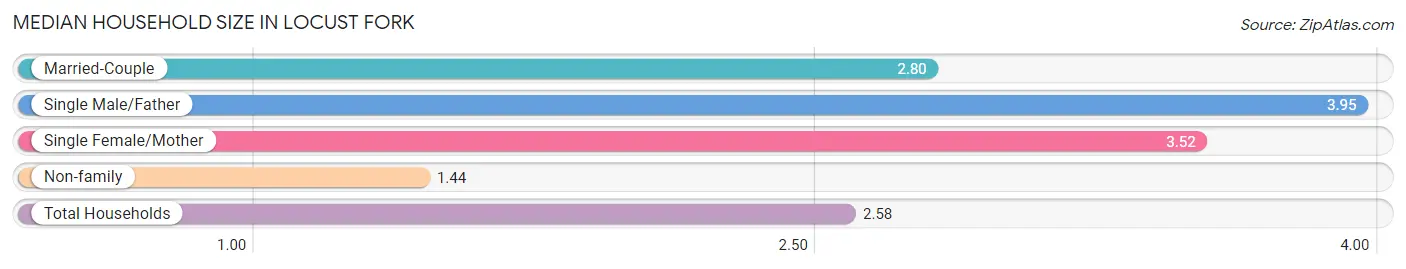
Median Household Size in Locust Fork
The median household size in Locust Fork is 2.58 persons per household, with single male/father households (21 | 4.1%) accounting for the largest median household size of 3.95 persons per household. non-family households (130 | 25.4%) represent the smallest median household size with 1.44 persons per household.
| Household Type | # Households | Household Size |
| Married-Couple | 306 (59.9%) | 2.80 |
| Single Male/Father | 21 (4.1%) | 3.95 |
| Single Female/Mother | 54 (10.6%) | 3.52 |
| Non-family | 130 (25.4%) | 1.44 |
| Total Households | 511 (100.0%) | 2.58 |
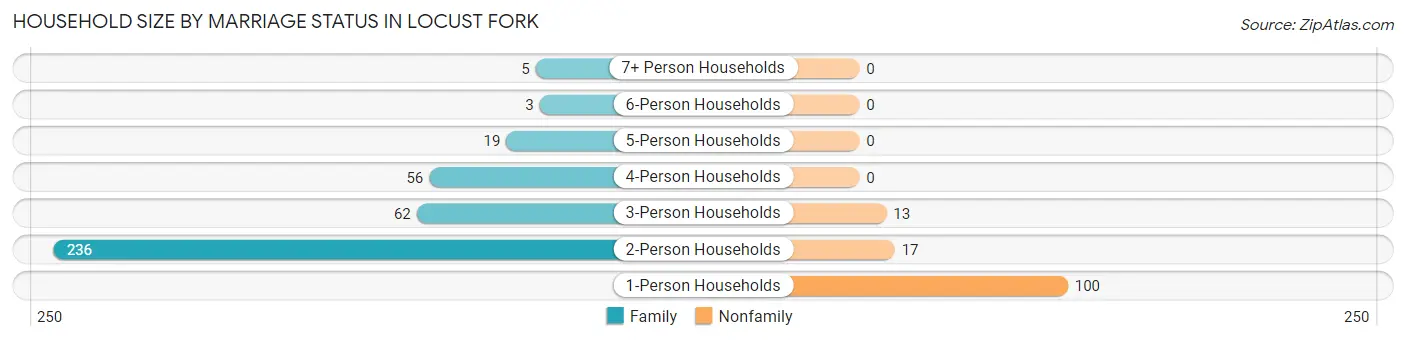
Household Size by Marriage Status in Locust Fork
Out of a total of 511 households in Locust Fork, 381 (74.6%) are family households, while 130 (25.4%) are nonfamily households. The most numerous type of family households are 2-person households, comprising 236, and the most common type of nonfamily households are 1-person households, comprising 100.
| Household Size | Family Households | Nonfamily Households |
| 1-Person Households | - | 100 (19.6%) |
| 2-Person Households | 236 (46.2%) | 17 (3.3%) |
| 3-Person Households | 62 (12.1%) | 13 (2.5%) |
| 4-Person Households | 56 (11.0%) | 0 (0.0%) |
| 5-Person Households | 19 (3.7%) | 0 (0.0%) |
| 6-Person Households | 3 (0.6%) | 0 (0.0%) |
| 7+ Person Households | 5 (1.0%) | 0 (0.0%) |
| Total | 381 (74.6%) | 130 (25.4%) |
Female Fertility in Locust Fork
Fertility by Age in Locust Fork
Average fertility rate in Locust Fork is 112.0 births per 1,000 women. Women in the age bracket of 15 to 19 years have the highest fertility rate with 167.0 births per 1,000 women. Women in the age bracket of 20 to 34 years acount for 89.7% of all women with births.
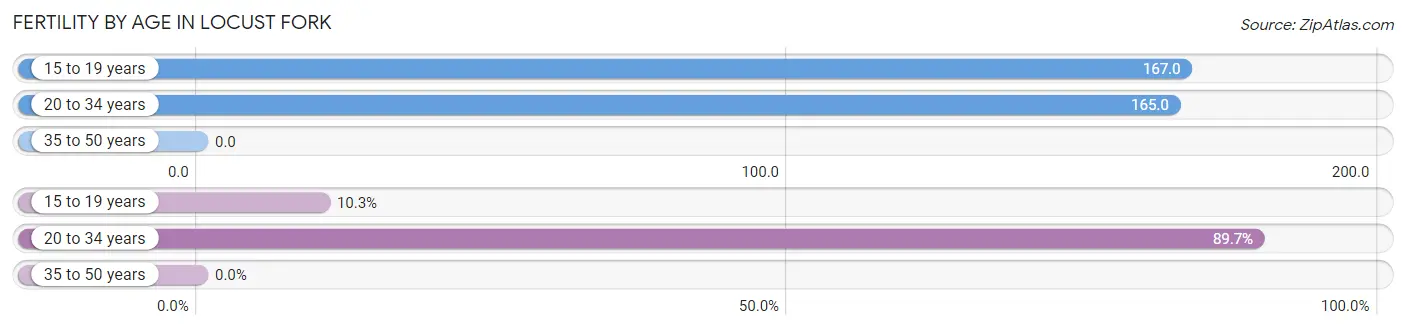
| Age Bracket | Women with Births | Births / 1,000 Women |
| 15 to 19 years | 3 (10.3%) | 167.0 |
| 20 to 34 years | 26 (89.7%) | 165.0 |
| 35 to 50 years | 0 (0.0%) | 0.0 |
| Total | 29 (100.0%) | 112.0 |
Fertility by Age by Marriage Status in Locust Fork
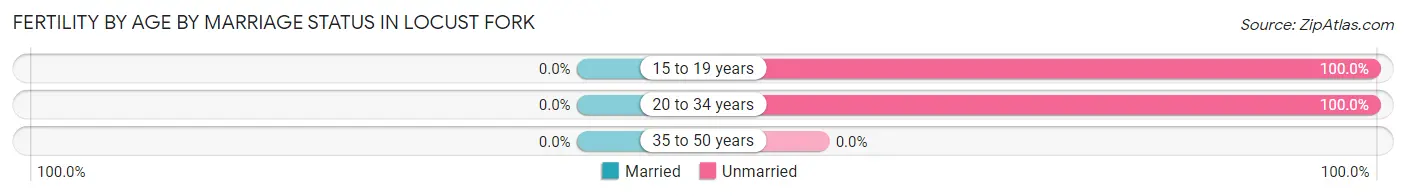
| Age Bracket | Married | Unmarried |
| 15 to 19 years | 0 (0.0%) | 3 (100.0%) |
| 20 to 34 years | 0 (0.0%) | 26 (100.0%) |
| 35 to 50 years | 0 (0.0%) | 0 (0.0%) |
| Total | 0 (0.0%) | 29 (100.0%) |
Fertility by Education in Locust Fork
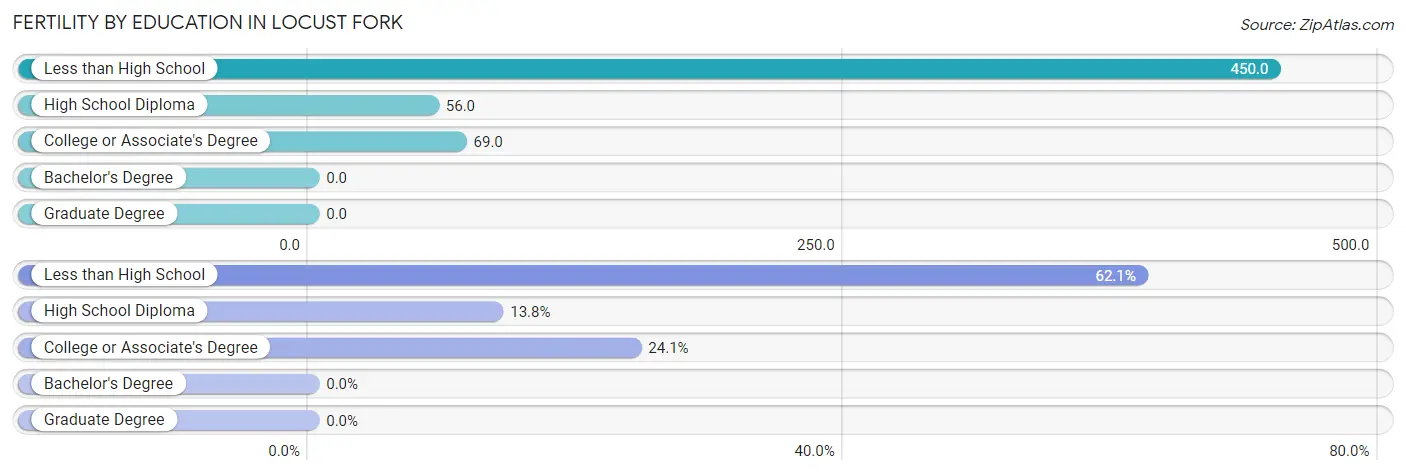
| Educational Attainment | Women with Births | Births / 1,000 Women |
| Less than High School | 18 (62.1%) | 450.0 |
| High School Diploma | 4 (13.8%) | 56.0 |
| College or Associate's Degree | 7 (24.1%) | 69.0 |
| Bachelor's Degree | 0 (0.0%) | 0.0 |
| Graduate Degree | 0 (0.0%) | 0.0 |
| Total | 29 (100.0%) | 112.0 |
Fertility by Education by Marriage Status in Locust Fork
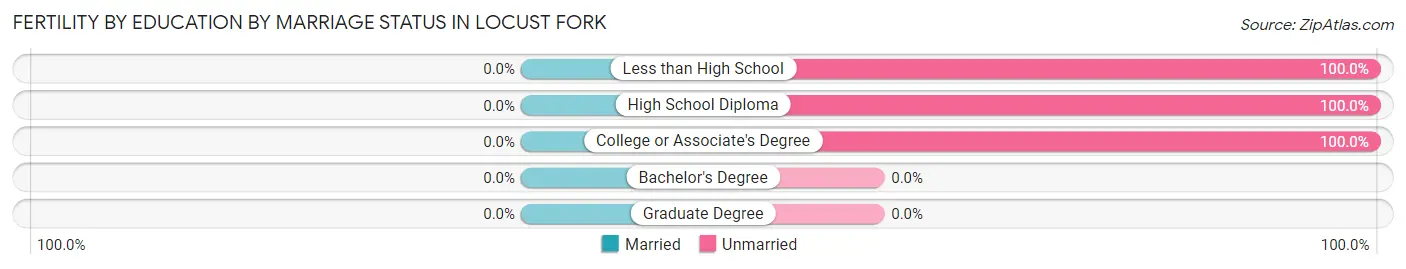
| Educational Attainment | Married | Unmarried |
| Less than High School | 0 (0.0%) | 18 (100.0%) |
| High School Diploma | 0 (0.0%) | 4 (100.0%) |
| College or Associate's Degree | 0 (0.0%) | 7 (100.0%) |
| Bachelor's Degree | 0 (0.0%) | 0 (0.0%) |
| Graduate Degree | 0 (0.0%) | 0 (0.0%) |
| Total | 0 (0.0%) | 29 (100.0%) |
Employment Characteristics in Locust Fork
Employment by Class of Employer in Locust Fork
Among the 497 employed individuals in Locust Fork, private company employees (360 | 72.4%), self-employed (not incorporated) (45 | 9.0%), and not-for-profit organizations (21 | 4.2%) make up the most common classes of employment.
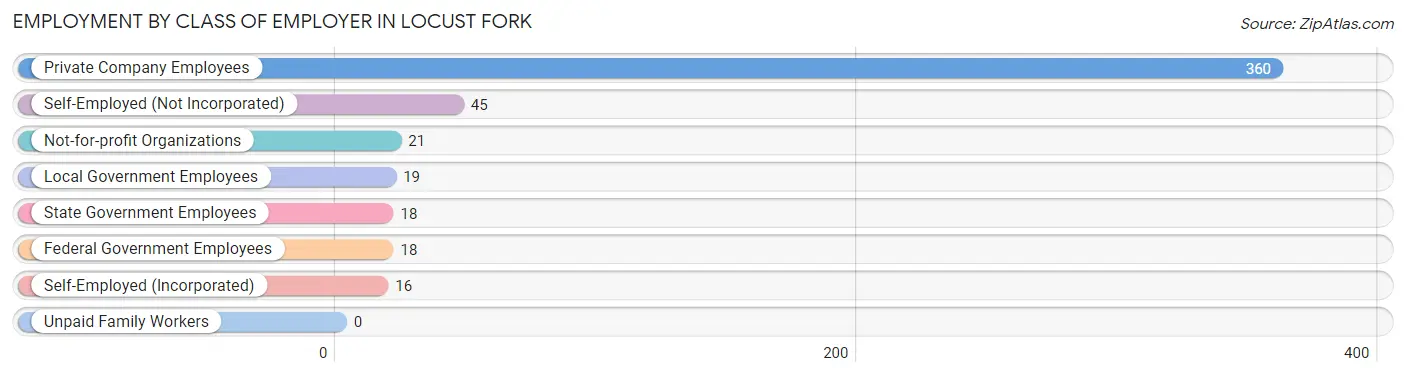
| Employer Class | # Employees | % Employees |
| Private Company Employees | 360 | 72.4% |
| Self-Employed (Incorporated) | 16 | 3.2% |
| Self-Employed (Not Incorporated) | 45 | 9.0% |
| Not-for-profit Organizations | 21 | 4.2% |
| Local Government Employees | 19 | 3.8% |
| State Government Employees | 18 | 3.6% |
| Federal Government Employees | 18 | 3.6% |
| Unpaid Family Workers | 0 | 0.0% |
| Total | 497 | 100.0% |
Employment Status by Age in Locust Fork
According to the labor force statistics for Locust Fork, out of the total population over 16 years of age (1,077), 48.7% or 524 individuals are in the labor force, with 5.4% or 28 of them unemployed. The age group with the highest labor force participation rate is 30 to 34 years, with 95.4% or 104 individuals in the labor force. Within the labor force, the 16 to 19 years age range has the highest percentage of unemployed individuals, with 62.5% or 5 of them being unemployed.
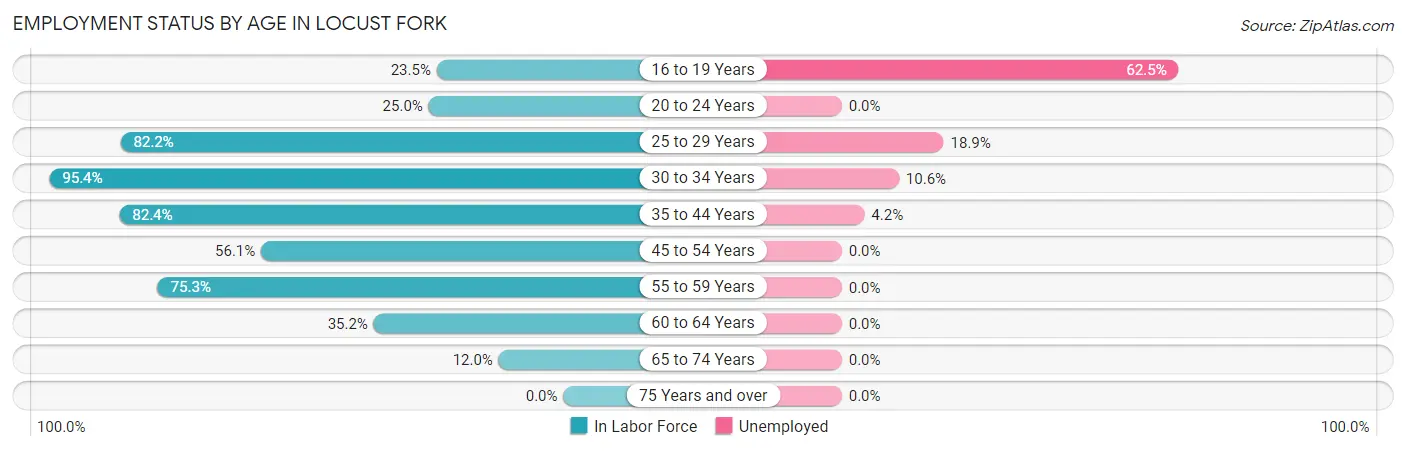
| Age Bracket | In Labor Force | Unemployed |
| 16 to 19 Years | 8 (23.5%) | 5 (62.5%) |
| 20 to 24 Years | 10 (25.0%) | 0 (0.0%) |
| 25 to 29 Years | 37 (82.2%) | 7 (18.9%) |
| 30 to 34 Years | 104 (95.4%) | 11 (10.6%) |
| 35 to 44 Years | 122 (82.4%) | 5 (4.2%) |
| 45 to 54 Years | 96 (56.1%) | 0 (0.0%) |
| 55 to 59 Years | 55 (75.3%) | 0 (0.0%) |
| 60 to 64 Years | 75 (35.2%) | 0 (0.0%) |
| 65 to 74 Years | 18 (12.0%) | 0 (0.0%) |
| 75 Years and over | 0 (0.0%) | 0 (0.0%) |
| Total | 524 (48.7%) | 28 (5.4%) |
Employment Status by Educational Attainment in Locust Fork
According to labor force statistics for Locust Fork, 64.4% of individuals (489) out of the total population between 25 and 64 years of age (759) are in the labor force, with 4.7% or 23 of them being unemployed. The group with the highest labor force participation rate are those with the educational attainment of bachelor's degree or higher, with 88.0% or 81 individuals in the labor force. Within the labor force, individuals with less than high school education have the highest percentage of unemployment, with 11.4% or 5 of them being unemployed.
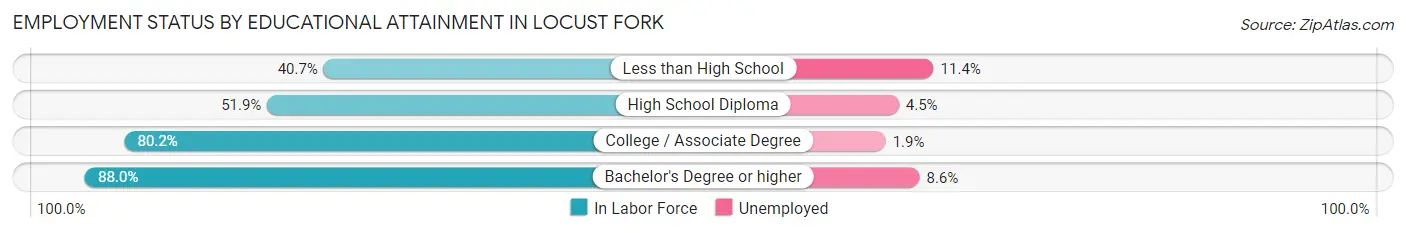
| Educational Attainment | In Labor Force | Unemployed |
| Less than High School | 44 (40.7%) | 12 (11.4%) |
| High School Diploma | 154 (51.9%) | 13 (4.5%) |
| College / Associate Degree | 210 (80.2%) | 5 (1.9%) |
| Bachelor's Degree or higher | 81 (88.0%) | 8 (8.6%) |
| Total | 489 (64.4%) | 36 (4.7%) |
Employment Occupations by Sex in Locust Fork
Management, Business, Science and Arts Occupations
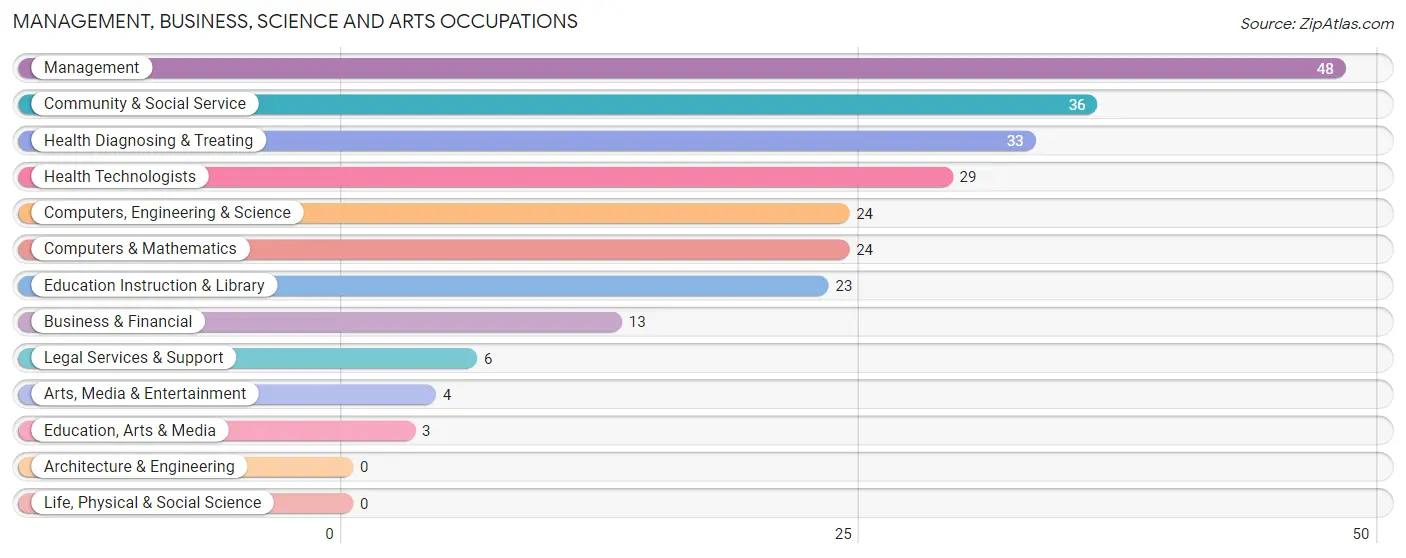
The most common Management, Business, Science and Arts occupations in Locust Fork are Management (48 | 9.7%), Community & Social Service (36 | 7.3%), Health Diagnosing & Treating (33 | 6.7%), Health Technologists (29 | 5.9%), and Computers, Engineering & Science (24 | 4.9%).
Management, Business, Science and Arts Occupations by Sex
Within the Management, Business, Science and Arts occupations in Locust Fork, the most male-oriented occupations are Education, Arts & Media (100.0%), Computers, Engineering & Science (62.5%), and Computers & Mathematics (62.5%), while the most female-oriented occupations are Legal Services & Support (100.0%), Arts, Media & Entertainment (100.0%), and Health Diagnosing & Treating (100.0%).
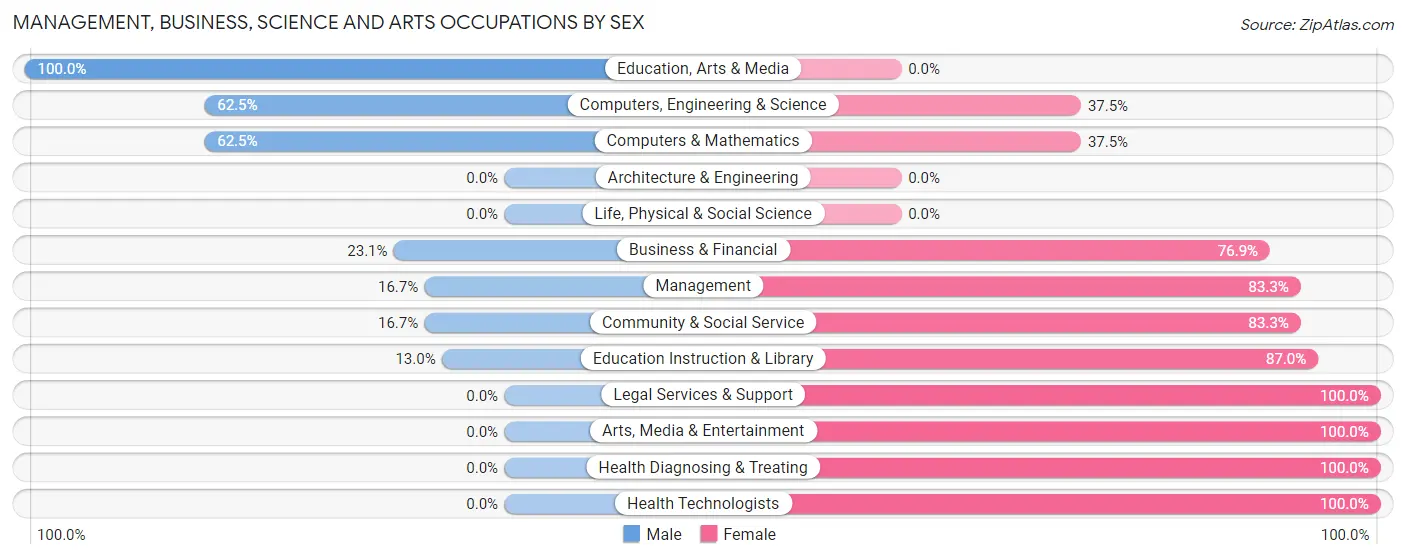
| Occupation | Male | Female |
| Management | 8 (16.7%) | 40 (83.3%) |
| Business & Financial | 3 (23.1%) | 10 (76.9%) |
| Computers, Engineering & Science | 15 (62.5%) | 9 (37.5%) |
| Computers & Mathematics | 15 (62.5%) | 9 (37.5%) |
| Architecture & Engineering | 0 (0.0%) | 0 (0.0%) |
| Life, Physical & Social Science | 0 (0.0%) | 0 (0.0%) |
| Community & Social Service | 6 (16.7%) | 30 (83.3%) |
| Education, Arts & Media | 3 (100.0%) | 0 (0.0%) |
| Legal Services & Support | 0 (0.0%) | 6 (100.0%) |
| Education Instruction & Library | 3 (13.0%) | 20 (87.0%) |
| Arts, Media & Entertainment | 0 (0.0%) | 4 (100.0%) |
| Health Diagnosing & Treating | 0 (0.0%) | 33 (100.0%) |
| Health Technologists | 0 (0.0%) | 29 (100.0%) |
| Total (Category) | 32 (20.8%) | 122 (79.2%) |
| Total (Overall) | 245 (49.6%) | 249 (50.4%) |
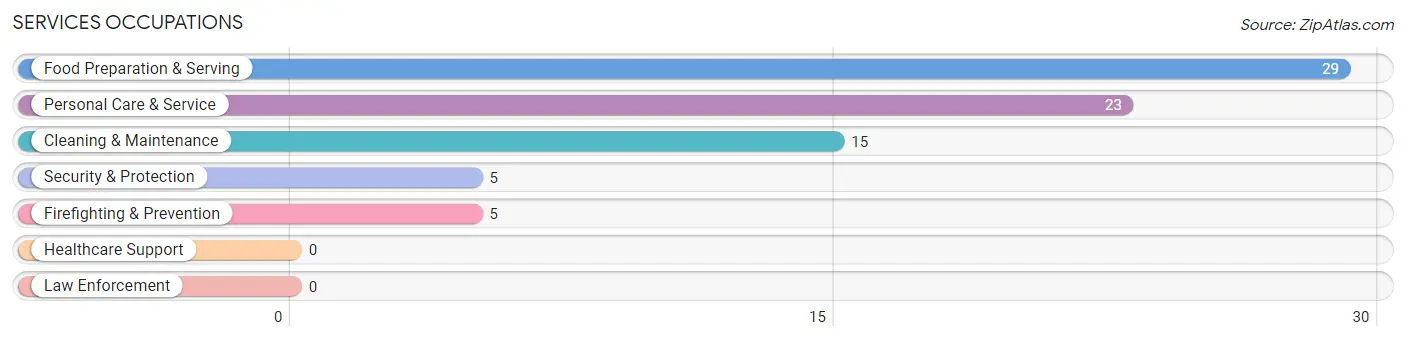
Services Occupations
The most common Services occupations in Locust Fork are Food Preparation & Serving (29 | 5.9%), Personal Care & Service (23 | 4.7%), Cleaning & Maintenance (15 | 3.0%), Security & Protection (5 | 1.0%), and Firefighting & Prevention (5 | 1.0%).
Services Occupations by Sex
Within the Services occupations in Locust Fork, the most male-oriented occupations are Security & Protection (100.0%), Firefighting & Prevention (100.0%), and Cleaning & Maintenance (86.7%), while the most female-oriented occupations are Food Preparation & Serving (89.7%), Personal Care & Service (69.6%), and Cleaning & Maintenance (13.3%).
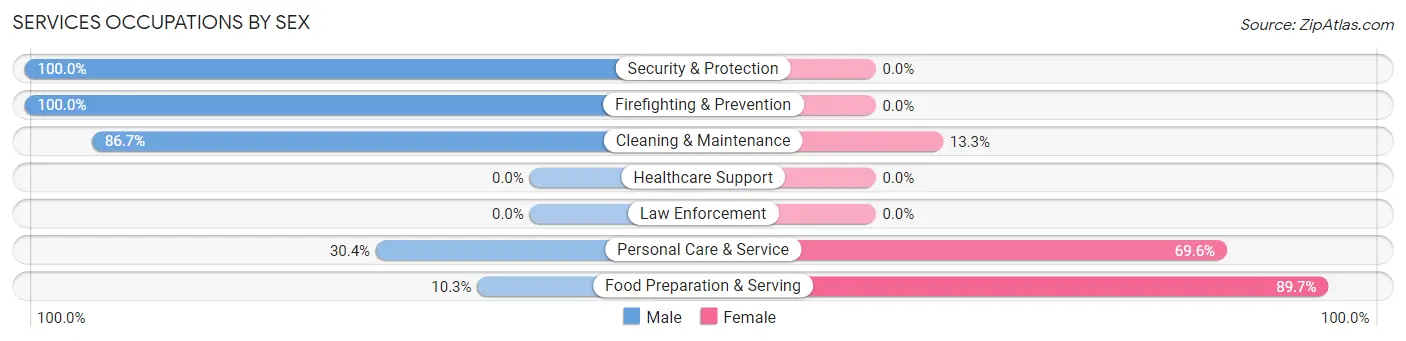
| Occupation | Male | Female |
| Healthcare Support | 0 (0.0%) | 0 (0.0%) |
| Security & Protection | 5 (100.0%) | 0 (0.0%) |
| Firefighting & Prevention | 5 (100.0%) | 0 (0.0%) |
| Law Enforcement | 0 (0.0%) | 0 (0.0%) |
| Food Preparation & Serving | 3 (10.3%) | 26 (89.7%) |
| Cleaning & Maintenance | 13 (86.7%) | 2 (13.3%) |
| Personal Care & Service | 7 (30.4%) | 16 (69.6%) |
| Total (Category) | 28 (38.9%) | 44 (61.1%) |
| Total (Overall) | 245 (49.6%) | 249 (50.4%) |
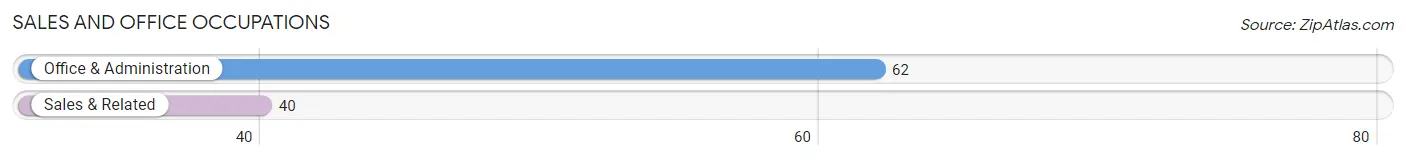
Sales and Office Occupations
The most common Sales and Office occupations in Locust Fork are Office & Administration (62 | 12.6%), and Sales & Related (40 | 8.1%).
Sales and Office Occupations by Sex
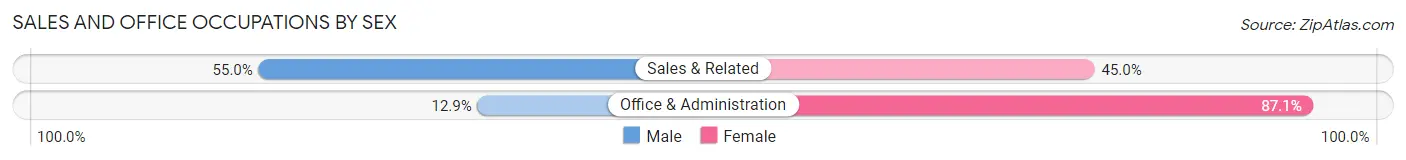
| Occupation | Male | Female |
| Sales & Related | 22 (55.0%) | 18 (45.0%) |
| Office & Administration | 8 (12.9%) | 54 (87.1%) |
| Total (Category) | 30 (29.4%) | 72 (70.6%) |
| Total (Overall) | 245 (49.6%) | 249 (50.4%) |
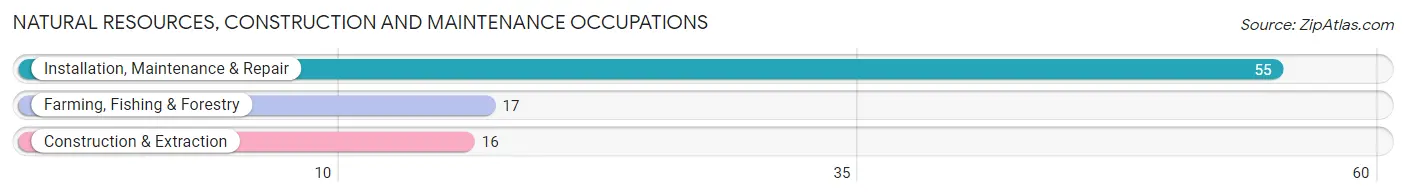
Natural Resources, Construction and Maintenance Occupations
The most common Natural Resources, Construction and Maintenance occupations in Locust Fork are Installation, Maintenance & Repair (55 | 11.1%), Farming, Fishing & Forestry (17 | 3.4%), and Construction & Extraction (16 | 3.2%).
Natural Resources, Construction and Maintenance Occupations by Sex
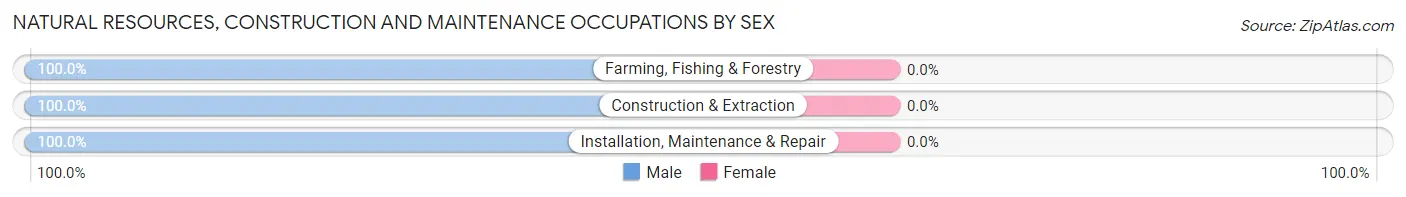
| Occupation | Male | Female |
| Farming, Fishing & Forestry | 17 (100.0%) | 0 (0.0%) |
| Construction & Extraction | 16 (100.0%) | 0 (0.0%) |
| Installation, Maintenance & Repair | 55 (100.0%) | 0 (0.0%) |
| Total (Category) | 88 (100.0%) | 0 (0.0%) |
| Total (Overall) | 245 (49.6%) | 249 (50.4%) |
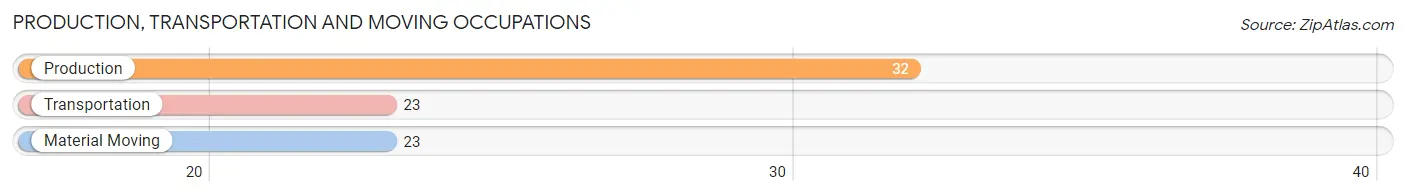
Production, Transportation and Moving Occupations
The most common Production, Transportation and Moving occupations in Locust Fork are Production (32 | 6.5%), Transportation (23 | 4.7%), and Material Moving (23 | 4.7%).
Production, Transportation and Moving Occupations by Sex
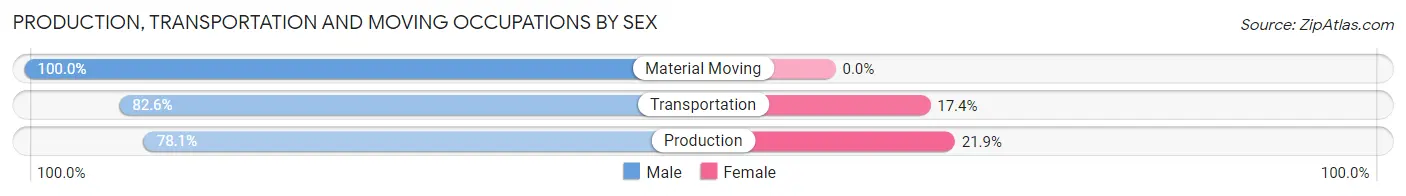
| Occupation | Male | Female |
| Production | 25 (78.1%) | 7 (21.9%) |
| Transportation | 19 (82.6%) | 4 (17.4%) |
| Material Moving | 23 (100.0%) | 0 (0.0%) |
| Total (Category) | 67 (85.9%) | 11 (14.1%) |
| Total (Overall) | 245 (49.6%) | 249 (50.4%) |
Employment Industries by Sex in Locust Fork
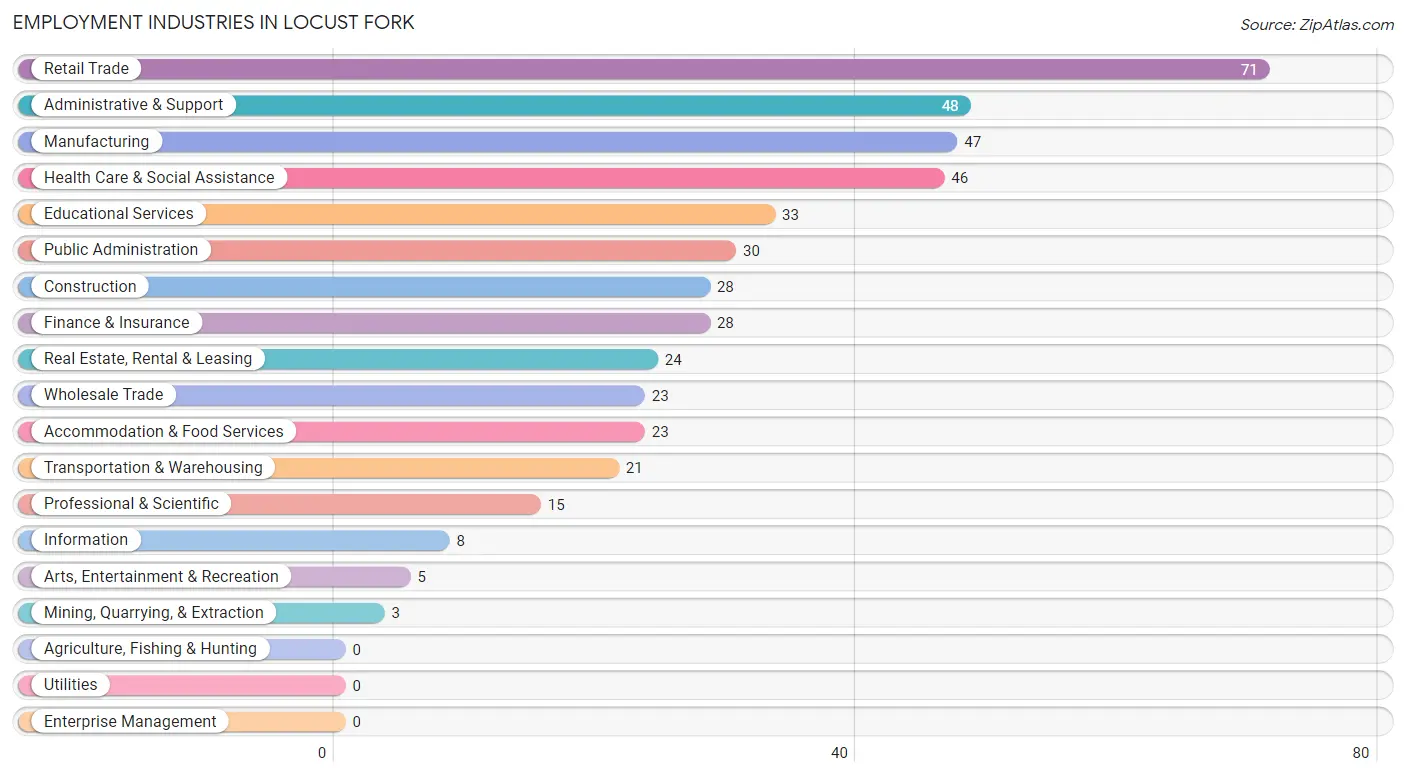
Employment Industries in Locust Fork
The major employment industries in Locust Fork include Retail Trade (71 | 14.4%), Administrative & Support (48 | 9.7%), Manufacturing (47 | 9.5%), Health Care & Social Assistance (46 | 9.3%), and Educational Services (33 | 6.7%).
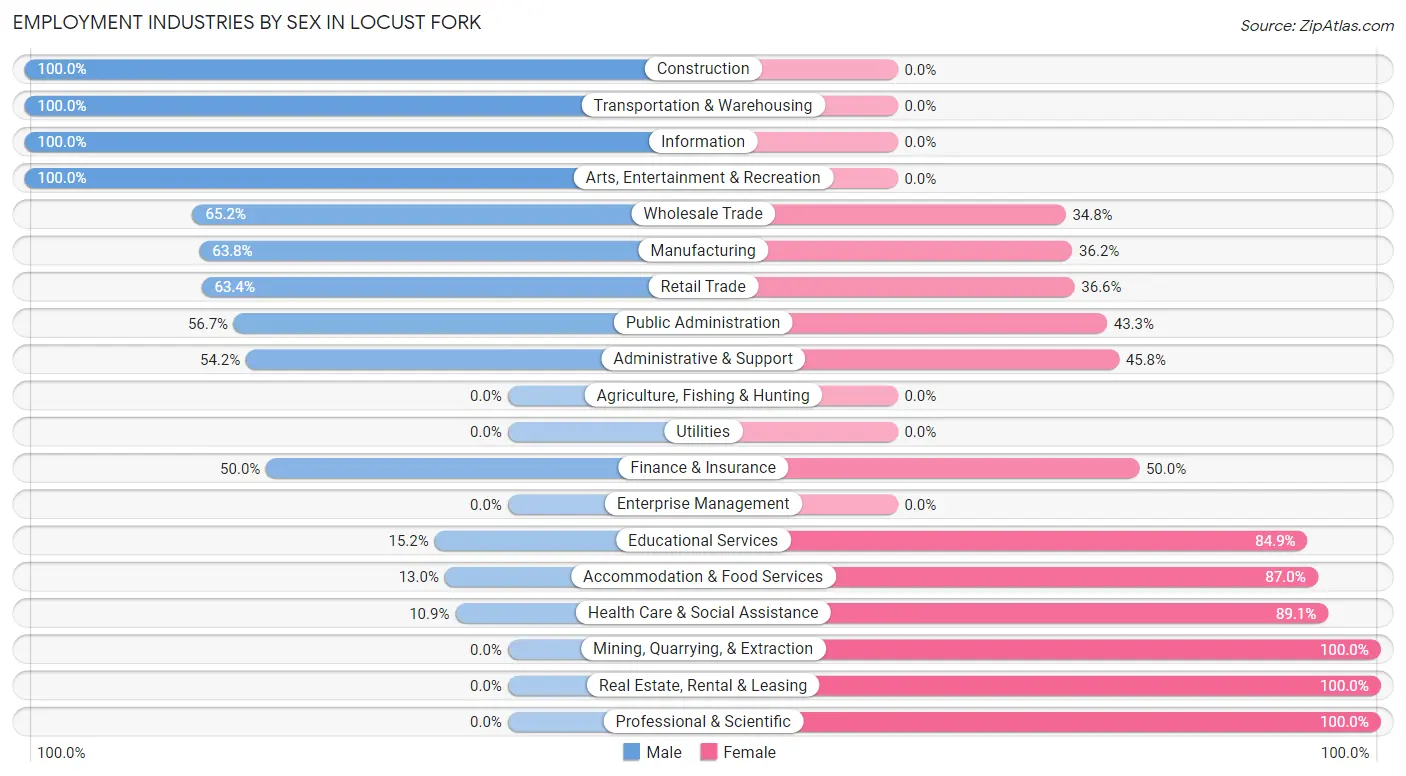
Employment Industries by Sex in Locust Fork
The Locust Fork industries that see more men than women are Construction (100.0%), Transportation & Warehousing (100.0%), and Information (100.0%), whereas the industries that tend to have a higher number of women are Mining, Quarrying, & Extraction (100.0%), Real Estate, Rental & Leasing (100.0%), and Professional & Scientific (100.0%).
| Industry | Male | Female |
| Agriculture, Fishing & Hunting | 0 (0.0%) | 0 (0.0%) |
| Mining, Quarrying, & Extraction | 0 (0.0%) | 3 (100.0%) |
| Construction | 28 (100.0%) | 0 (0.0%) |
| Manufacturing | 30 (63.8%) | 17 (36.2%) |
| Wholesale Trade | 15 (65.2%) | 8 (34.8%) |
| Retail Trade | 45 (63.4%) | 26 (36.6%) |
| Transportation & Warehousing | 21 (100.0%) | 0 (0.0%) |
| Utilities | 0 (0.0%) | 0 (0.0%) |
| Information | 8 (100.0%) | 0 (0.0%) |
| Finance & Insurance | 14 (50.0%) | 14 (50.0%) |
| Real Estate, Rental & Leasing | 0 (0.0%) | 24 (100.0%) |
| Professional & Scientific | 0 (0.0%) | 15 (100.0%) |
| Enterprise Management | 0 (0.0%) | 0 (0.0%) |
| Administrative & Support | 26 (54.2%) | 22 (45.8%) |
| Educational Services | 5 (15.1%) | 28 (84.9%) |
| Health Care & Social Assistance | 5 (10.9%) | 41 (89.1%) |
| Arts, Entertainment & Recreation | 5 (100.0%) | 0 (0.0%) |
| Accommodation & Food Services | 3 (13.0%) | 20 (87.0%) |
| Public Administration | 17 (56.7%) | 13 (43.3%) |
| Total | 245 (49.6%) | 249 (50.4%) |
Education in Locust Fork
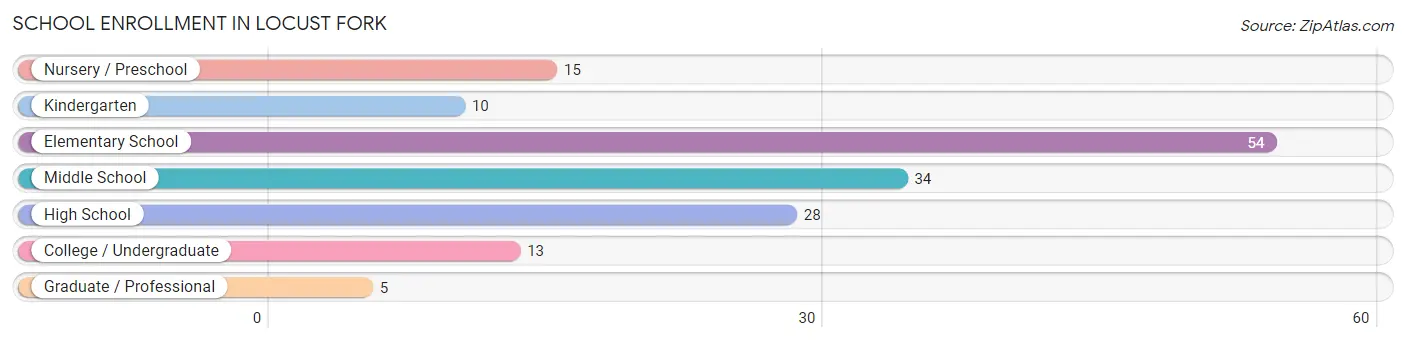
School Enrollment in Locust Fork
The most common levels of schooling among the 159 students in Locust Fork are elementary school (54 | 34.0%), middle school (34 | 21.4%), and high school (28 | 17.6%).
| School Level | # Students | % Students |
| Nursery / Preschool | 15 | 9.4% |
| Kindergarten | 10 | 6.3% |
| Elementary School | 54 | 34.0% |
| Middle School | 34 | 21.4% |
| High School | 28 | 17.6% |
| College / Undergraduate | 13 | 8.2% |
| Graduate / Professional | 5 | 3.1% |
| Total | 159 | 100.0% |
School Enrollment by Age by Funding Source in Locust Fork
Out of a total of 159 students who are enrolled in schools in Locust Fork, 27 (17.0%) attend a private institution, while the remaining 132 (83.0%) are enrolled in public schools. The age group of 3 to 4 year olds has the highest likelihood of being enrolled in private schools, with 9 (100.0% in the age bracket) enrolled. Conversely, the age group of 35 years and over has the lowest likelihood of being enrolled in a private school, with 2 (100.0% in the age bracket) attending a public institution.
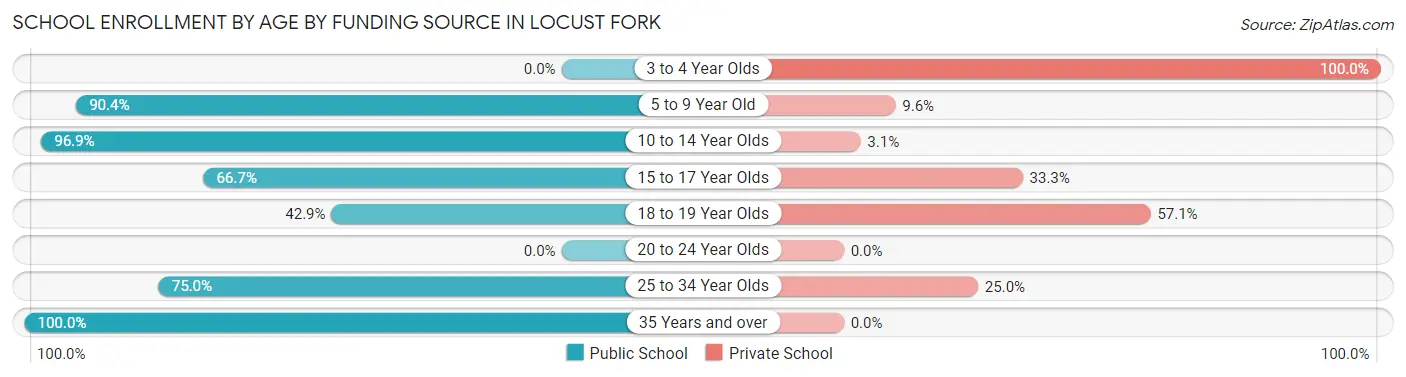
| Age Bracket | Public School | Private School |
| 3 to 4 Year Olds | 0 (0.0%) | 9 (100.0%) |
| 5 to 9 Year Old | 47 (90.4%) | 5 (9.6%) |
| 10 to 14 Year Olds | 62 (96.9%) | 2 (3.1%) |
| 15 to 17 Year Olds | 6 (66.7%) | 3 (33.3%) |
| 18 to 19 Year Olds | 3 (42.9%) | 4 (57.1%) |
| 20 to 24 Year Olds | 0 (0.0%) | 0 (0.0%) |
| 25 to 34 Year Olds | 12 (75.0%) | 4 (25.0%) |
| 35 Years and over | 2 (100.0%) | 0 (0.0%) |
| Total | 132 (83.0%) | 27 (17.0%) |
Educational Attainment by Field of Study in Locust Fork
Business (31 | 24.6%), science & technology (17 | 13.5%), arts & humanities (15 | 11.9%), education (14 | 11.1%), and communications (9 | 7.1%) are the most common fields of study among 126 individuals in Locust Fork who have obtained a bachelor's degree or higher.
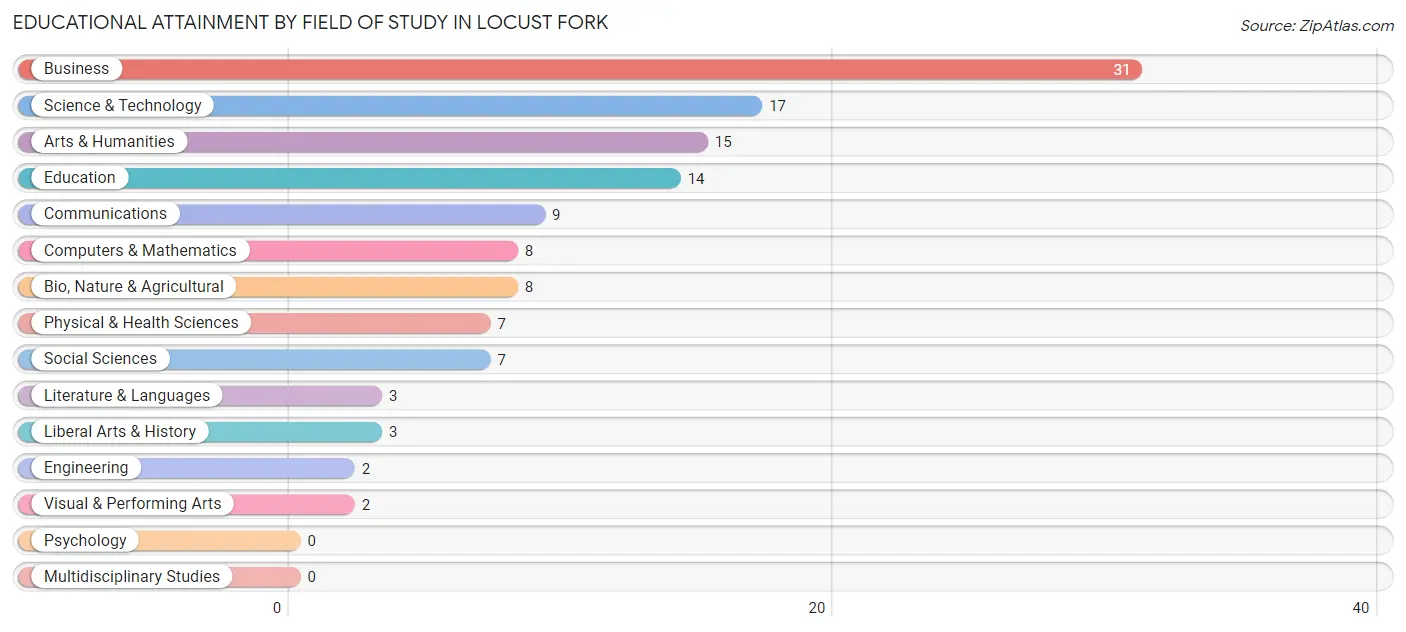
| Field of Study | # Graduates | % Graduates |
| Computers & Mathematics | 8 | 6.4% |
| Bio, Nature & Agricultural | 8 | 6.4% |
| Physical & Health Sciences | 7 | 5.6% |
| Psychology | 0 | 0.0% |
| Social Sciences | 7 | 5.6% |
| Engineering | 2 | 1.6% |
| Multidisciplinary Studies | 0 | 0.0% |
| Science & Technology | 17 | 13.5% |
| Business | 31 | 24.6% |
| Education | 14 | 11.1% |
| Literature & Languages | 3 | 2.4% |
| Liberal Arts & History | 3 | 2.4% |
| Visual & Performing Arts | 2 | 1.6% |
| Communications | 9 | 7.1% |
| Arts & Humanities | 15 | 11.9% |
| Total | 126 | 100.0% |
Transportation & Commute in Locust Fork
Vehicle Availability by Sex in Locust Fork
The most prevalent vehicle ownership categories in Locust Fork are males with 2 vehicles (86, accounting for 34.7%) and females with 2 vehicles (89, making up 34.5%).
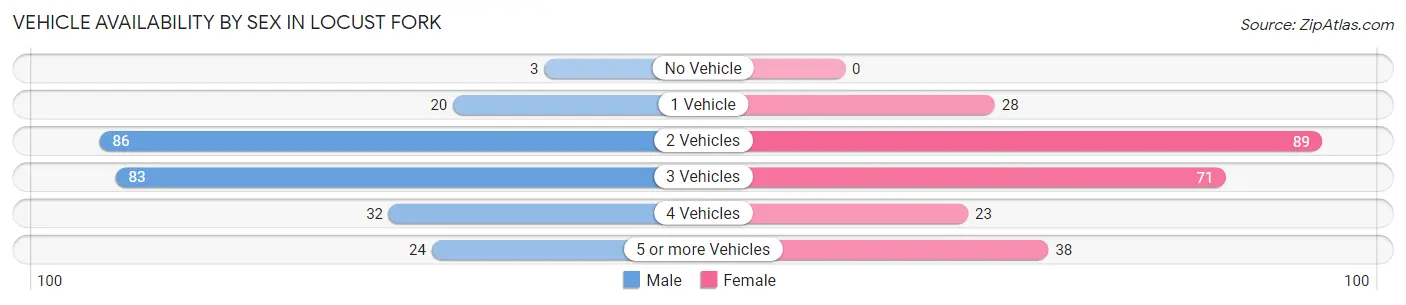
| Vehicles Available | Male | Female |
| No Vehicle | 3 (1.2%) | 0 (0.0%) |
| 1 Vehicle | 20 (8.1%) | 28 (11.2%) |
| 2 Vehicles | 86 (34.7%) | 89 (35.7%) |
| 3 Vehicles | 83 (33.5%) | 71 (28.5%) |
| 4 Vehicles | 32 (12.9%) | 23 (9.2%) |
| 5 or more Vehicles | 24 (9.7%) | 38 (15.3%) |
| Total | 248 (100.0%) | 249 (100.0%) |
Commute Time in Locust Fork
The most frequently occuring commute durations in Locust Fork are 45 to 59 minutes (119 commuters, 25.2%), 25 to 29 minutes (61 commuters, 12.9%), and 10 to 14 minutes (58 commuters, 12.3%).
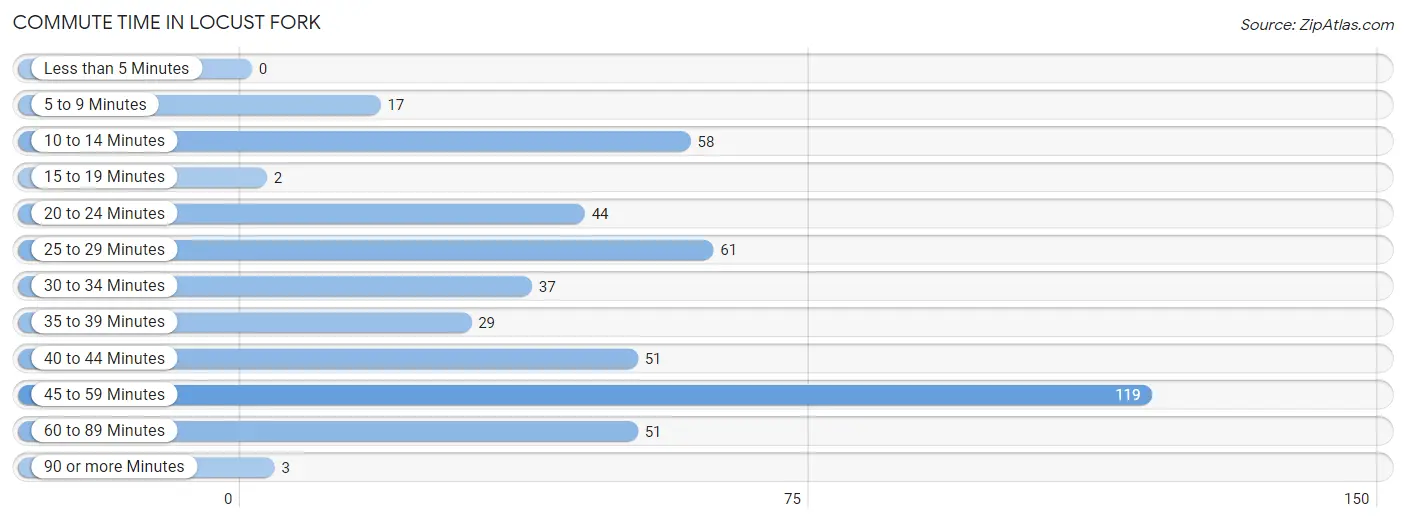
| Commute Time | # Commuters | % Commuters |
| Less than 5 Minutes | 0 | 0.0% |
| 5 to 9 Minutes | 17 | 3.6% |
| 10 to 14 Minutes | 58 | 12.3% |
| 15 to 19 Minutes | 2 | 0.4% |
| 20 to 24 Minutes | 44 | 9.3% |
| 25 to 29 Minutes | 61 | 12.9% |
| 30 to 34 Minutes | 37 | 7.8% |
| 35 to 39 Minutes | 29 | 6.1% |
| 40 to 44 Minutes | 51 | 10.8% |
| 45 to 59 Minutes | 119 | 25.2% |
| 60 to 89 Minutes | 51 | 10.8% |
| 90 or more Minutes | 3 | 0.6% |
Commute Time by Sex in Locust Fork
The most common commute times in Locust Fork are 45 to 59 minutes (50 commuters, 20.7%) for males and 45 to 59 minutes (69 commuters, 29.9%) for females.
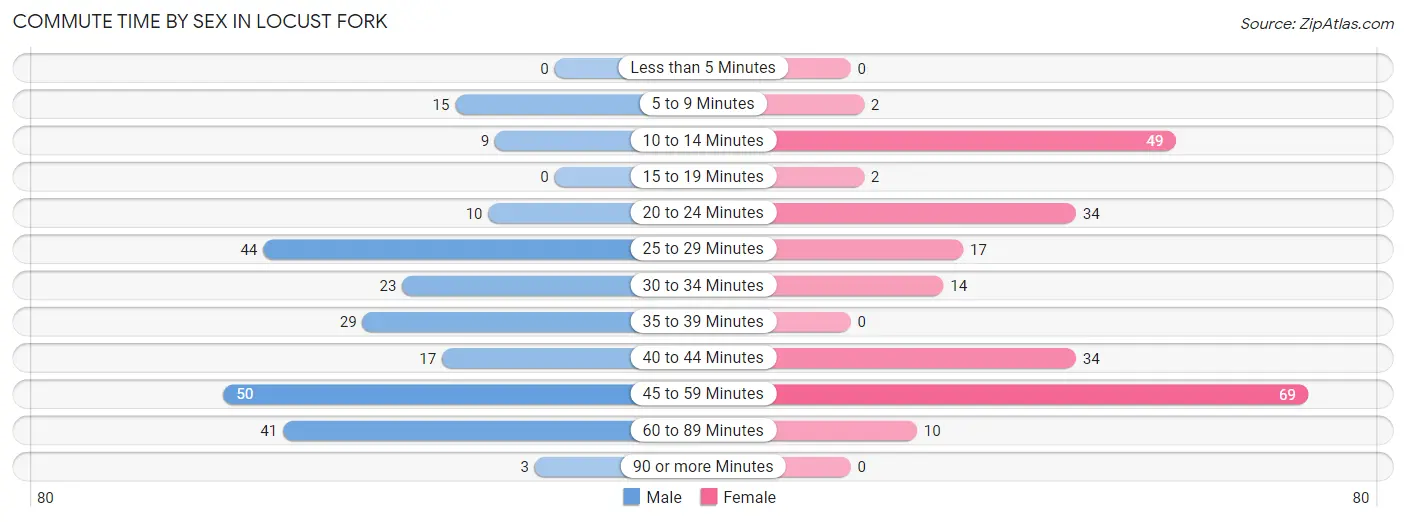
| Commute Time | Male | Female |
| Less than 5 Minutes | 0 (0.0%) | 0 (0.0%) |
| 5 to 9 Minutes | 15 (6.2%) | 2 (0.9%) |
| 10 to 14 Minutes | 9 (3.7%) | 49 (21.2%) |
| 15 to 19 Minutes | 0 (0.0%) | 2 (0.9%) |
| 20 to 24 Minutes | 10 (4.2%) | 34 (14.7%) |
| 25 to 29 Minutes | 44 (18.3%) | 17 (7.4%) |
| 30 to 34 Minutes | 23 (9.5%) | 14 (6.1%) |
| 35 to 39 Minutes | 29 (12.0%) | 0 (0.0%) |
| 40 to 44 Minutes | 17 (7.0%) | 34 (14.7%) |
| 45 to 59 Minutes | 50 (20.7%) | 69 (29.9%) |
| 60 to 89 Minutes | 41 (17.0%) | 10 (4.3%) |
| 90 or more Minutes | 3 (1.2%) | 0 (0.0%) |
Time of Departure to Work by Sex in Locust Fork
The most frequent times of departure to work in Locust Fork are 7:00 AM to 7:29 AM (50, 20.7%) for males and 7:00 AM to 7:29 AM (48, 20.8%) for females.
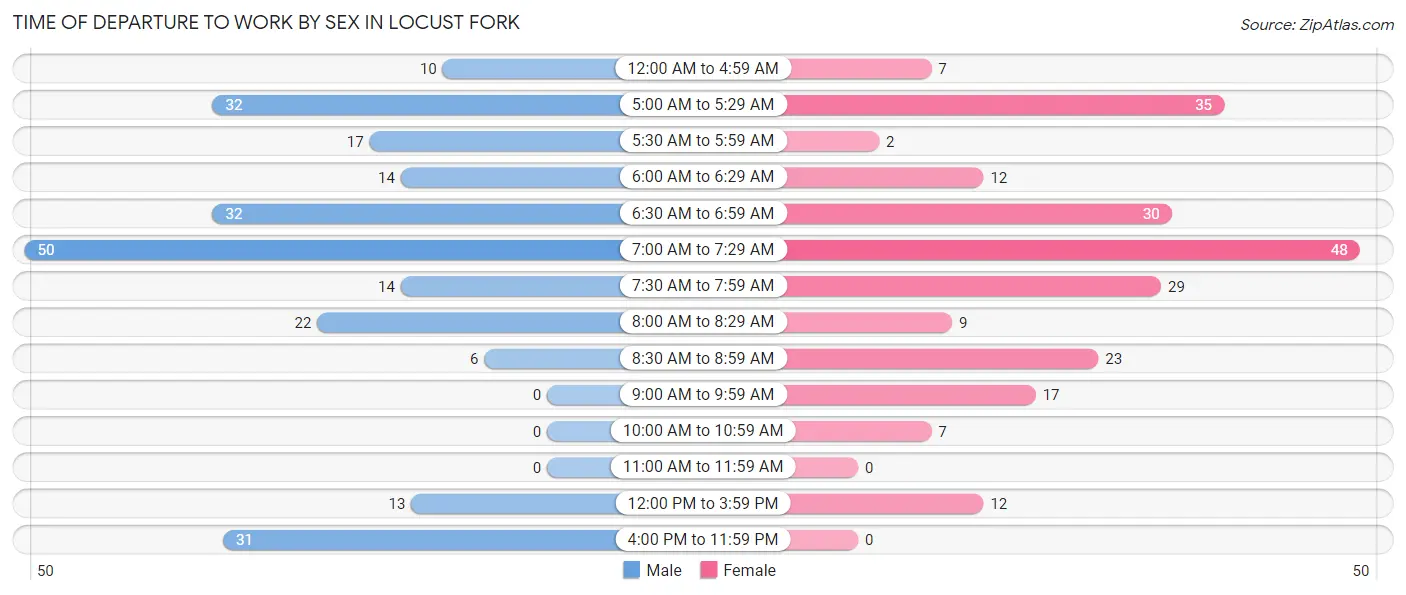
| Time of Departure | Male | Female |
| 12:00 AM to 4:59 AM | 10 (4.2%) | 7 (3.0%) |
| 5:00 AM to 5:29 AM | 32 (13.3%) | 35 (15.1%) |
| 5:30 AM to 5:59 AM | 17 (7.0%) | 2 (0.9%) |
| 6:00 AM to 6:29 AM | 14 (5.8%) | 12 (5.2%) |
| 6:30 AM to 6:59 AM | 32 (13.3%) | 30 (13.0%) |
| 7:00 AM to 7:29 AM | 50 (20.7%) | 48 (20.8%) |
| 7:30 AM to 7:59 AM | 14 (5.8%) | 29 (12.6%) |
| 8:00 AM to 8:29 AM | 22 (9.1%) | 9 (3.9%) |
| 8:30 AM to 8:59 AM | 6 (2.5%) | 23 (10.0%) |
| 9:00 AM to 9:59 AM | 0 (0.0%) | 17 (7.4%) |
| 10:00 AM to 10:59 AM | 0 (0.0%) | 7 (3.0%) |
| 11:00 AM to 11:59 AM | 0 (0.0%) | 0 (0.0%) |
| 12:00 PM to 3:59 PM | 13 (5.4%) | 12 (5.2%) |
| 4:00 PM to 11:59 PM | 31 (12.9%) | 0 (0.0%) |
| Total | 241 (100.0%) | 231 (100.0%) |
Housing Occupancy in Locust Fork
Occupancy by Ownership in Locust Fork
Of the total 511 dwellings in Locust Fork, owner-occupied units account for 439 (85.9%), while renter-occupied units make up 72 (14.1%).
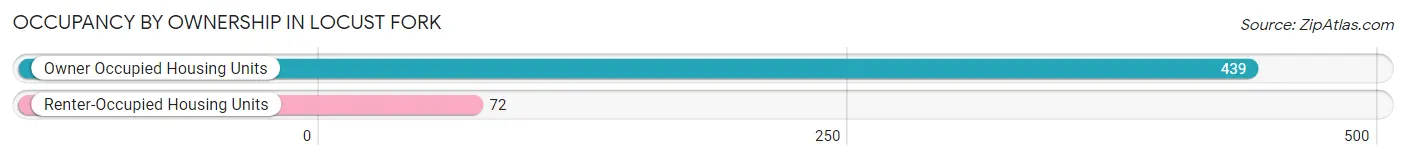
| Occupancy | # Housing Units | % Housing Units |
| Owner Occupied Housing Units | 439 | 85.9% |
| Renter-Occupied Housing Units | 72 | 14.1% |
| Total Occupied Housing Units | 511 | 100.0% |
Occupancy by Household Size in Locust Fork
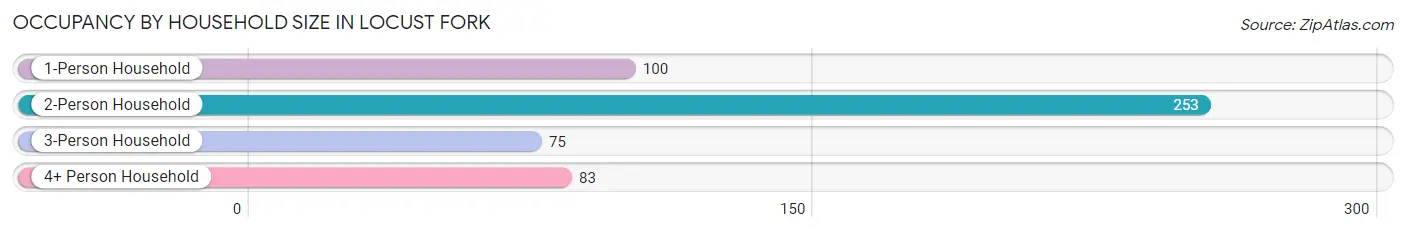
| Household Size | # Housing Units | % Housing Units |
| 1-Person Household | 100 | 19.6% |
| 2-Person Household | 253 | 49.5% |
| 3-Person Household | 75 | 14.7% |
| 4+ Person Household | 83 | 16.2% |
| Total Housing Units | 511 | 100.0% |
Occupancy by Ownership by Household Size in Locust Fork
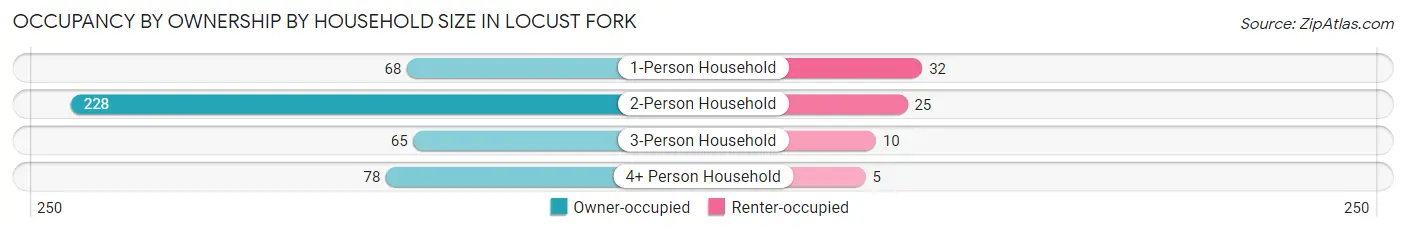
| Household Size | Owner-occupied | Renter-occupied |
| 1-Person Household | 68 (68.0%) | 32 (32.0%) |
| 2-Person Household | 228 (90.1%) | 25 (9.9%) |
| 3-Person Household | 65 (86.7%) | 10 (13.3%) |
| 4+ Person Household | 78 (94.0%) | 5 (6.0%) |
| Total Housing Units | 439 (85.9%) | 72 (14.1%) |
Occupancy by Educational Attainment in Locust Fork
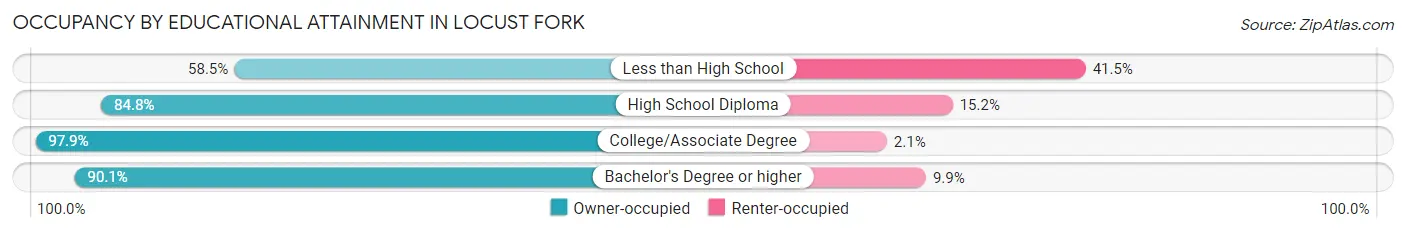
| Household Size | Owner-occupied | Renter-occupied |
| Less than High School | 38 (58.5%) | 27 (41.5%) |
| High School Diploma | 190 (84.8%) | 34 (15.2%) |
| College/Associate Degree | 138 (97.9%) | 3 (2.1%) |
| Bachelor's Degree or higher | 73 (90.1%) | 8 (9.9%) |
Occupancy by Age of Householder in Locust Fork
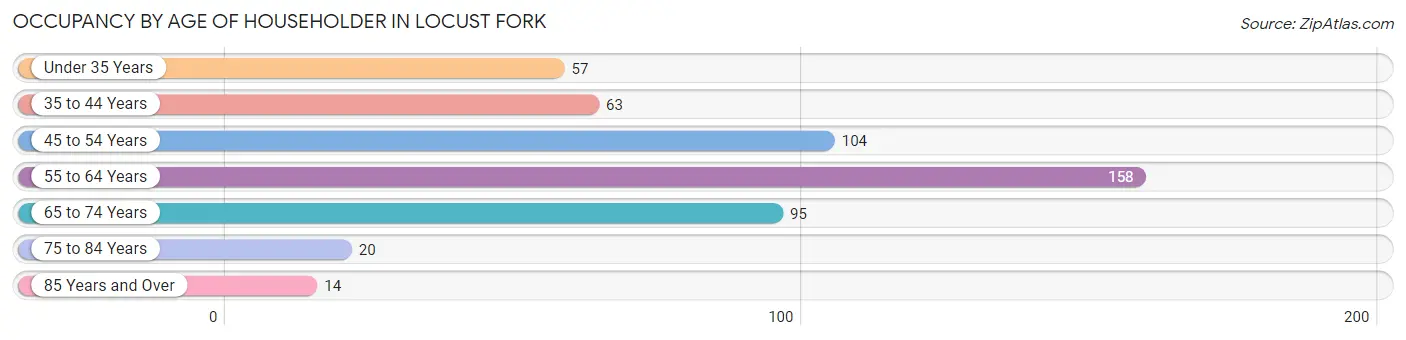
| Age Bracket | # Households | % Households |
| Under 35 Years | 57 | 11.2% |
| 35 to 44 Years | 63 | 12.3% |
| 45 to 54 Years | 104 | 20.3% |
| 55 to 64 Years | 158 | 30.9% |
| 65 to 74 Years | 95 | 18.6% |
| 75 to 84 Years | 20 | 3.9% |
| 85 Years and Over | 14 | 2.7% |
| Total | 511 | 100.0% |
Housing Finances in Locust Fork
Median Income by Occupancy in Locust Fork
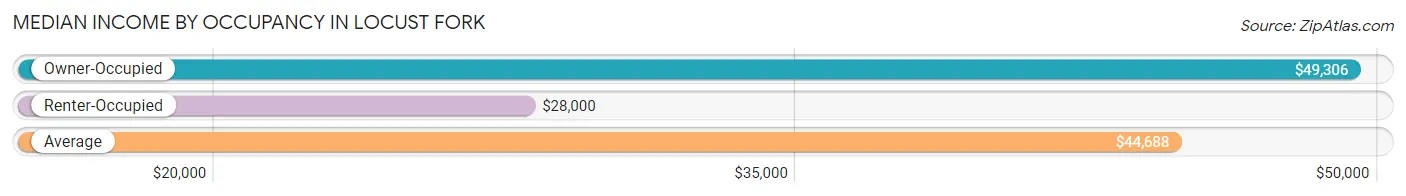
| Occupancy Type | # Households | Median Income |
| Owner-Occupied | 439 (85.9%) | $49,306 |
| Renter-Occupied | 72 (14.1%) | $28,000 |
| Average | 511 (100.0%) | $44,688 |
Occupancy by Householder Income Bracket in Locust Fork
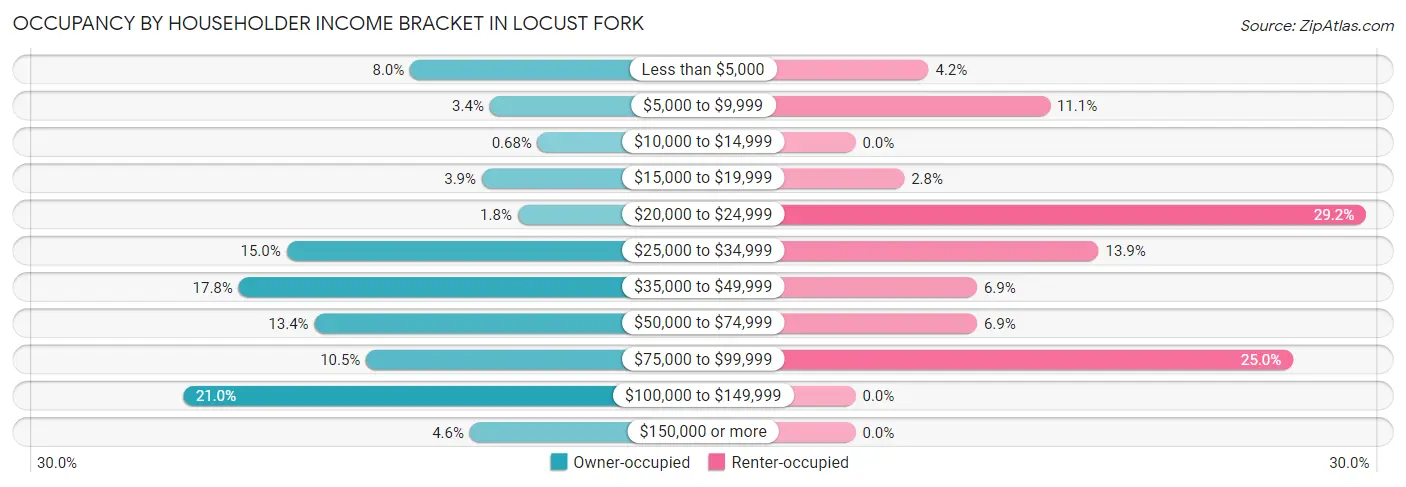
| Income Bracket | Owner-occupied | Renter-occupied |
| Less than $5,000 | 35 (8.0%) | 3 (4.2%) |
| $5,000 to $9,999 | 15 (3.4%) | 8 (11.1%) |
| $10,000 to $14,999 | 3 (0.7%) | 0 (0.0%) |
| $15,000 to $19,999 | 17 (3.9%) | 2 (2.8%) |
| $20,000 to $24,999 | 8 (1.8%) | 21 (29.2%) |
| $25,000 to $34,999 | 66 (15.0%) | 10 (13.9%) |
| $35,000 to $49,999 | 78 (17.8%) | 5 (6.9%) |
| $50,000 to $74,999 | 59 (13.4%) | 5 (6.9%) |
| $75,000 to $99,999 | 46 (10.5%) | 18 (25.0%) |
| $100,000 to $149,999 | 92 (21.0%) | 0 (0.0%) |
| $150,000 or more | 20 (4.6%) | 0 (0.0%) |
| Total | 439 (100.0%) | 72 (100.0%) |
Monthly Housing Cost Tiers in Locust Fork
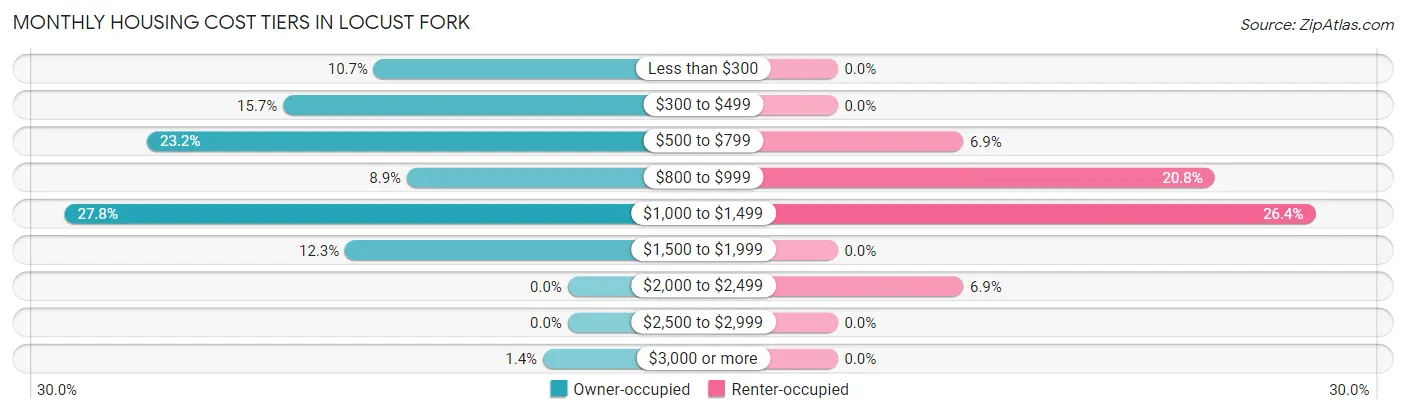
| Monthly Cost | Owner-occupied | Renter-occupied |
| Less than $300 | 47 (10.7%) | 0 (0.0%) |
| $300 to $499 | 69 (15.7%) | 0 (0.0%) |
| $500 to $799 | 102 (23.2%) | 5 (6.9%) |
| $800 to $999 | 39 (8.9%) | 15 (20.8%) |
| $1,000 to $1,499 | 122 (27.8%) | 19 (26.4%) |
| $1,500 to $1,999 | 54 (12.3%) | 0 (0.0%) |
| $2,000 to $2,499 | 0 (0.0%) | 5 (6.9%) |
| $2,500 to $2,999 | 0 (0.0%) | 0 (0.0%) |
| $3,000 or more | 6 (1.4%) | 0 (0.0%) |
| Total | 439 (100.0%) | 72 (100.0%) |
Physical Housing Characteristics in Locust Fork
Housing Structures in Locust Fork
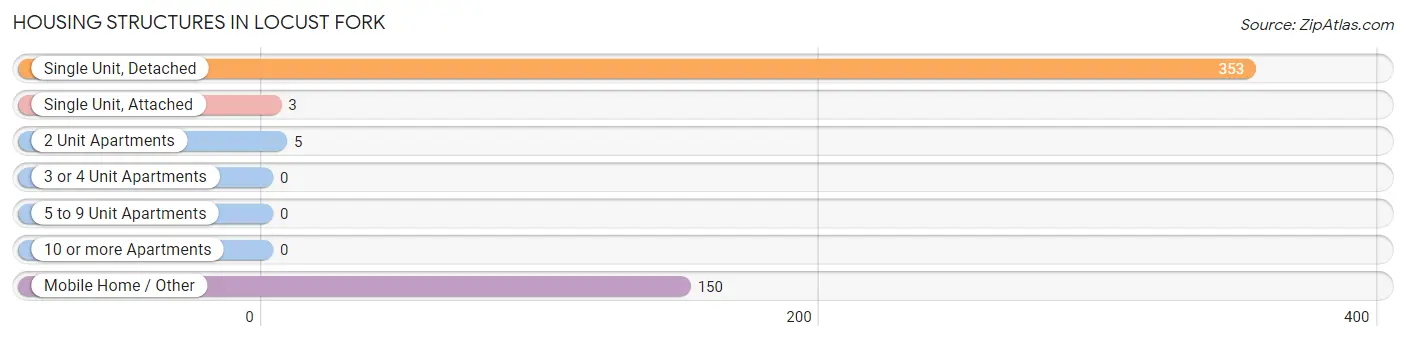
| Structure Type | # Housing Units | % Housing Units |
| Single Unit, Detached | 353 | 69.1% |
| Single Unit, Attached | 3 | 0.6% |
| 2 Unit Apartments | 5 | 1.0% |
| 3 or 4 Unit Apartments | 0 | 0.0% |
| 5 to 9 Unit Apartments | 0 | 0.0% |
| 10 or more Apartments | 0 | 0.0% |
| Mobile Home / Other | 150 | 29.3% |
| Total | 511 | 100.0% |
Housing Structures by Occupancy in Locust Fork
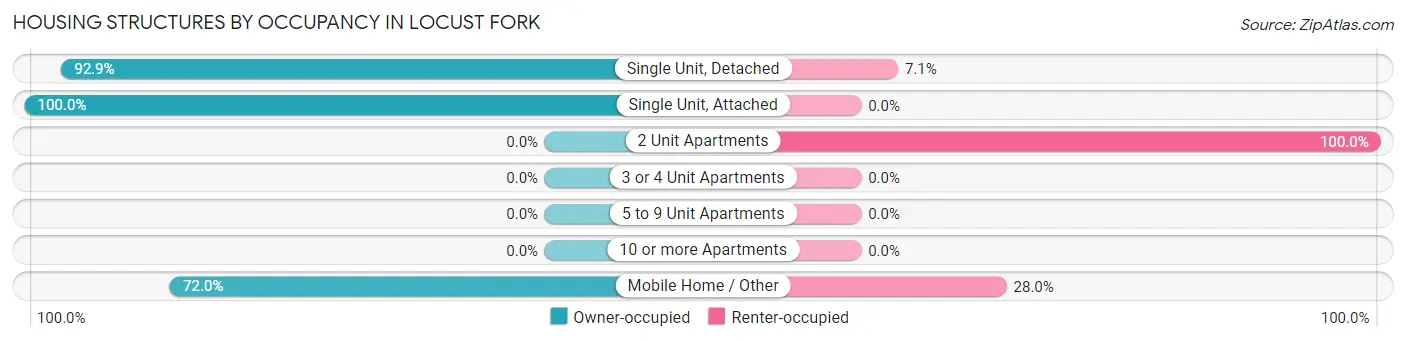
| Structure Type | Owner-occupied | Renter-occupied |
| Single Unit, Detached | 328 (92.9%) | 25 (7.1%) |
| Single Unit, Attached | 3 (100.0%) | 0 (0.0%) |
| 2 Unit Apartments | 0 (0.0%) | 5 (100.0%) |
| 3 or 4 Unit Apartments | 0 (0.0%) | 0 (0.0%) |
| 5 to 9 Unit Apartments | 0 (0.0%) | 0 (0.0%) |
| 10 or more Apartments | 0 (0.0%) | 0 (0.0%) |
| Mobile Home / Other | 108 (72.0%) | 42 (28.0%) |
| Total | 439 (85.9%) | 72 (14.1%) |
Housing Structures by Number of Rooms in Locust Fork

| Number of Rooms | Owner-occupied | Renter-occupied |
| 1 Room | 13 (3.0%) | 11 (15.3%) |
| 2 or 3 Rooms | 4 (0.9%) | 0 (0.0%) |
| 4 or 5 Rooms | 112 (25.5%) | 15 (20.8%) |
| 6 or 7 Rooms | 187 (42.6%) | 24 (33.3%) |
| 8 or more Rooms | 123 (28.0%) | 22 (30.6%) |
| Total | 439 (100.0%) | 72 (100.0%) |
Housing Structure by Heating Type in Locust Fork
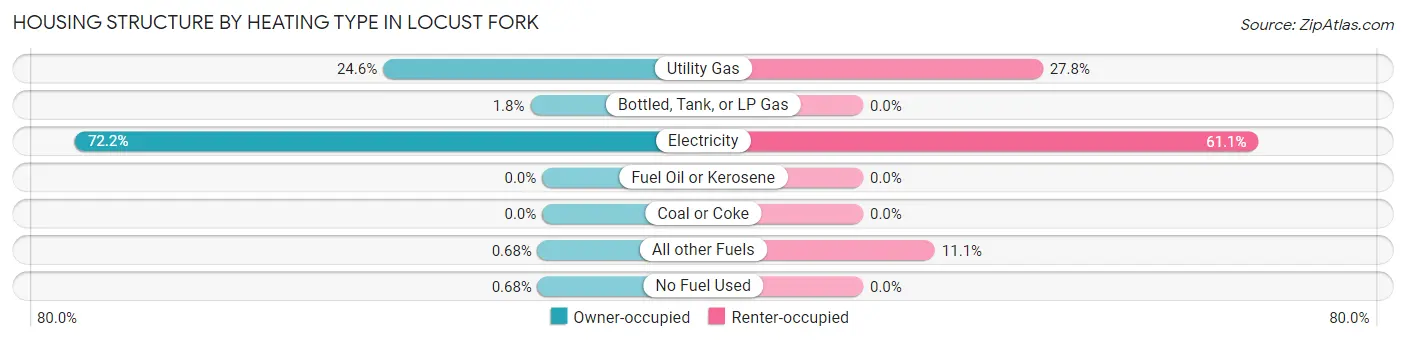
| Heating Type | Owner-occupied | Renter-occupied |
| Utility Gas | 108 (24.6%) | 20 (27.8%) |
| Bottled, Tank, or LP Gas | 8 (1.8%) | 0 (0.0%) |
| Electricity | 317 (72.2%) | 44 (61.1%) |
| Fuel Oil or Kerosene | 0 (0.0%) | 0 (0.0%) |
| Coal or Coke | 0 (0.0%) | 0 (0.0%) |
| All other Fuels | 3 (0.7%) | 8 (11.1%) |
| No Fuel Used | 3 (0.7%) | 0 (0.0%) |
| Total | 439 (100.0%) | 72 (100.0%) |
Household Vehicle Usage in Locust Fork
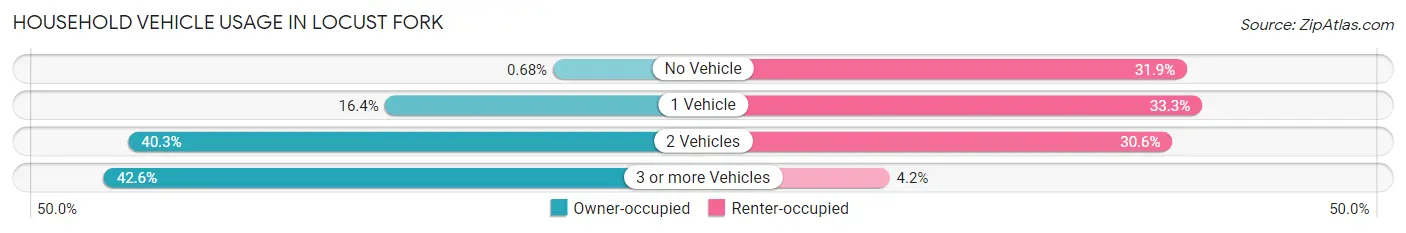
| Vehicles per Household | Owner-occupied | Renter-occupied |
| No Vehicle | 3 (0.7%) | 23 (31.9%) |
| 1 Vehicle | 72 (16.4%) | 24 (33.3%) |
| 2 Vehicles | 177 (40.3%) | 22 (30.6%) |
| 3 or more Vehicles | 187 (42.6%) | 3 (4.2%) |
| Total | 439 (100.0%) | 72 (100.0%) |
Real Estate & Mortgages in Locust Fork
Real Estate and Mortgage Overview in Locust Fork
| Characteristic | Without Mortgage | With Mortgage |
| Housing Units | 152 | 287 |
| Median Property Value | $136,400 | $147,600 |
| Median Household Income | $48,333 | $11 |
| Monthly Housing Costs | $413 | $6 |
| Real Estate Taxes | $471 | $91 |
Property Value by Mortgage Status in Locust Fork
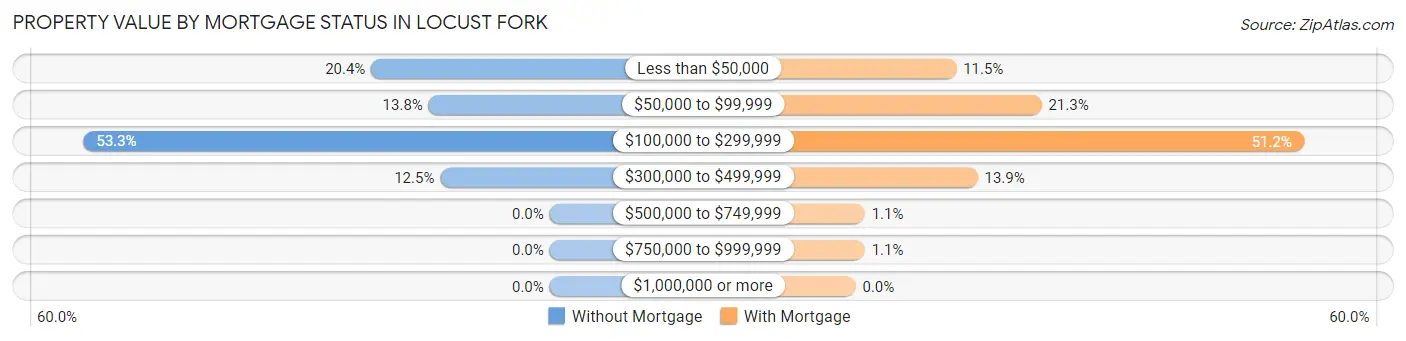
| Property Value | Without Mortgage | With Mortgage |
| Less than $50,000 | 31 (20.4%) | 33 (11.5%) |
| $50,000 to $99,999 | 21 (13.8%) | 61 (21.2%) |
| $100,000 to $299,999 | 81 (53.3%) | 147 (51.2%) |
| $300,000 to $499,999 | 19 (12.5%) | 40 (13.9%) |
| $500,000 to $749,999 | 0 (0.0%) | 3 (1.1%) |
| $750,000 to $999,999 | 0 (0.0%) | 3 (1.1%) |
| $1,000,000 or more | 0 (0.0%) | 0 (0.0%) |
| Total | 152 (100.0%) | 287 (100.0%) |
Household Income by Mortgage Status in Locust Fork
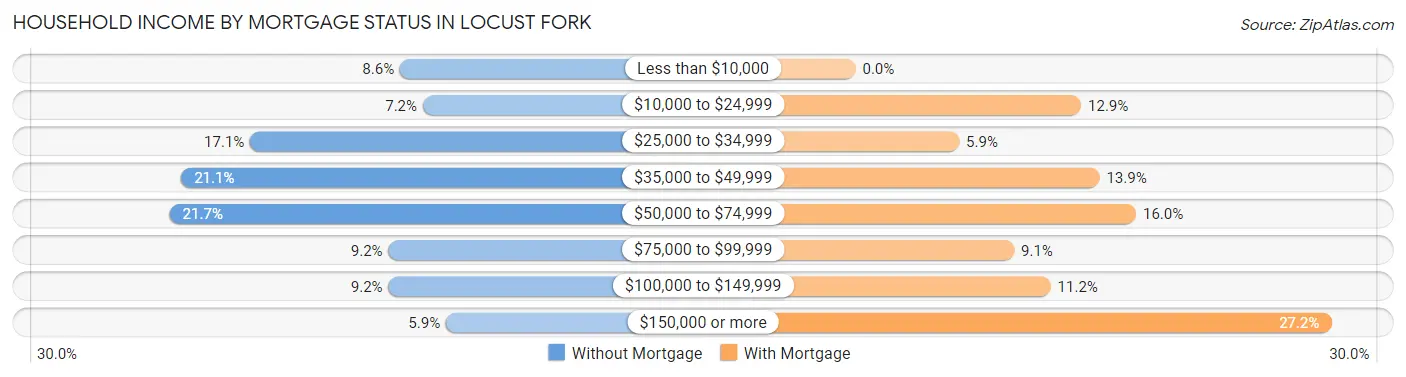
| Household Income | Without Mortgage | With Mortgage |
| Less than $10,000 | 13 (8.6%) | 0 (0.0%) |
| $10,000 to $24,999 | 11 (7.2%) | 37 (12.9%) |
| $25,000 to $34,999 | 26 (17.1%) | 17 (5.9%) |
| $35,000 to $49,999 | 32 (21.0%) | 40 (13.9%) |
| $50,000 to $74,999 | 33 (21.7%) | 46 (16.0%) |
| $75,000 to $99,999 | 14 (9.2%) | 26 (9.1%) |
| $100,000 to $149,999 | 14 (9.2%) | 32 (11.2%) |
| $150,000 or more | 9 (5.9%) | 78 (27.2%) |
| Total | 152 (100.0%) | 287 (100.0%) |
Property Value to Household Income Ratio in Locust Fork
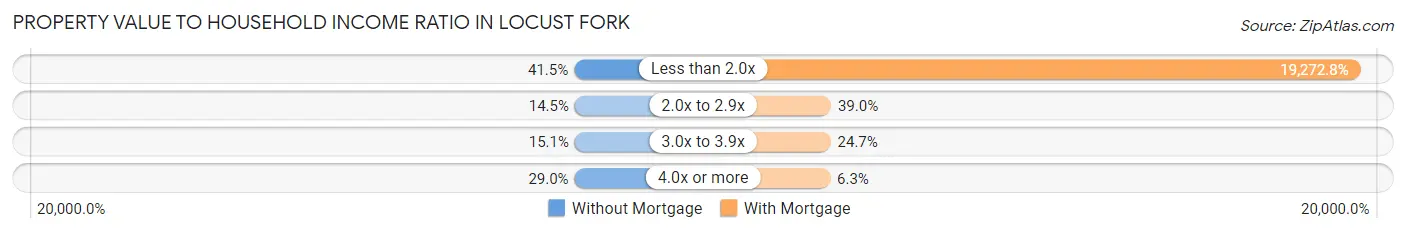
| Value-to-Income Ratio | Without Mortgage | With Mortgage |
| Less than 2.0x | 63 (41.4%) | 55,313 (19,272.8%) |
| 2.0x to 2.9x | 22 (14.5%) | 112 (39.0%) |
| 3.0x to 3.9x | 23 (15.1%) | 71 (24.7%) |
| 4.0x or more | 44 (28.9%) | 18 (6.3%) |
| Total | 152 (100.0%) | 287 (100.0%) |
Real Estate Taxes by Mortgage Status in Locust Fork
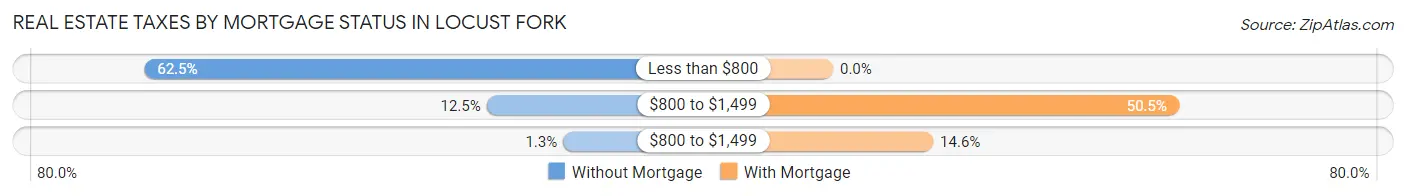
| Property Taxes | Without Mortgage | With Mortgage |
| Less than $800 | 95 (62.5%) | 0 (0.0%) |
| $800 to $1,499 | 19 (12.5%) | 145 (50.5%) |
| $800 to $1,499 | 2 (1.3%) | 42 (14.6%) |
| Total | 152 (100.0%) | 287 (100.0%) |
Health & Disability in Locust Fork
Health Insurance Coverage by Age in Locust Fork
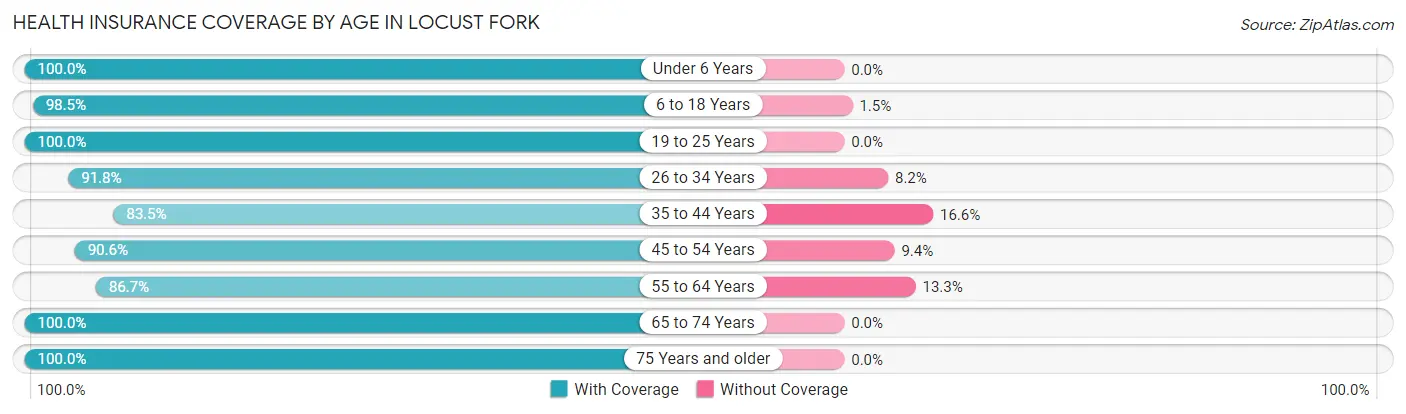
| Age Bracket | With Coverage | Without Coverage |
| Under 6 Years | 133 (100.0%) | 0 (0.0%) |
| 6 to 18 Years | 130 (98.5%) | 2 (1.5%) |
| 19 to 25 Years | 55 (100.0%) | 0 (0.0%) |
| 26 to 34 Years | 135 (91.8%) | 12 (8.2%) |
| 35 to 44 Years | 121 (83.5%) | 24 (16.6%) |
| 45 to 54 Years | 155 (90.6%) | 16 (9.4%) |
| 55 to 64 Years | 248 (86.7%) | 38 (13.3%) |
| 65 to 74 Years | 150 (100.0%) | 0 (0.0%) |
| 75 Years and older | 94 (100.0%) | 0 (0.0%) |
| Total | 1,221 (93.0%) | 92 (7.0%) |
Health Insurance Coverage by Citizenship Status in Locust Fork
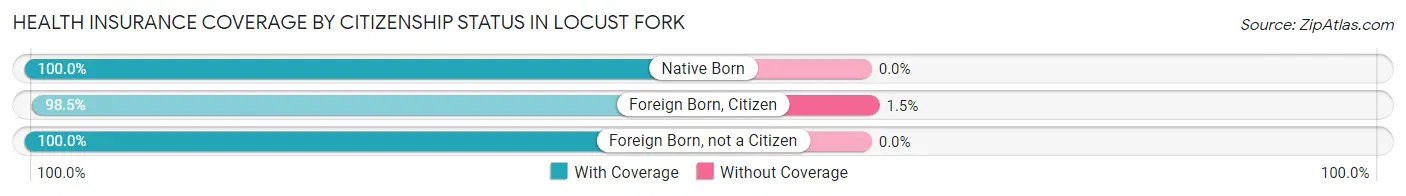
| Citizenship Status | With Coverage | Without Coverage |
| Native Born | 133 (100.0%) | 0 (0.0%) |
| Foreign Born, Citizen | 130 (98.5%) | 2 (1.5%) |
| Foreign Born, not a Citizen | 55 (100.0%) | 0 (0.0%) |
Health Insurance Coverage by Household Income in Locust Fork
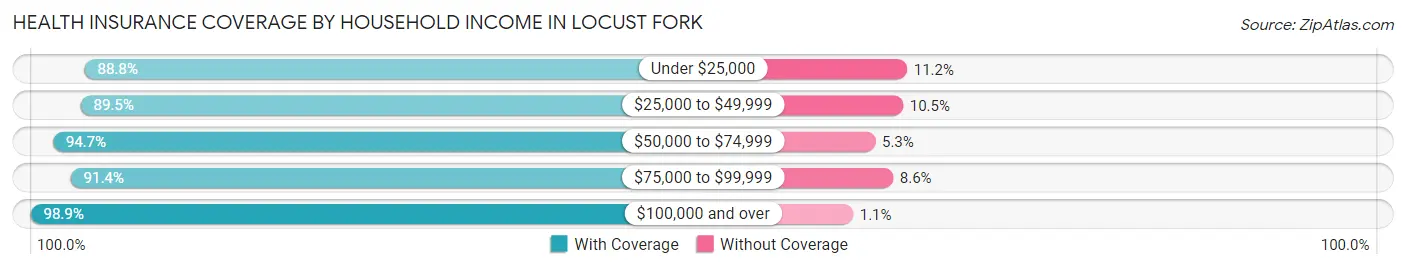
| Household Income | With Coverage | Without Coverage |
| Under $25,000 | 158 (88.8%) | 20 (11.2%) |
| $25,000 to $49,999 | 350 (89.5%) | 41 (10.5%) |
| $50,000 to $74,999 | 179 (94.7%) | 10 (5.3%) |
| $75,000 to $99,999 | 180 (91.4%) | 17 (8.6%) |
| $100,000 and over | 354 (98.9%) | 4 (1.1%) |
Public vs Private Health Insurance Coverage by Age in Locust Fork
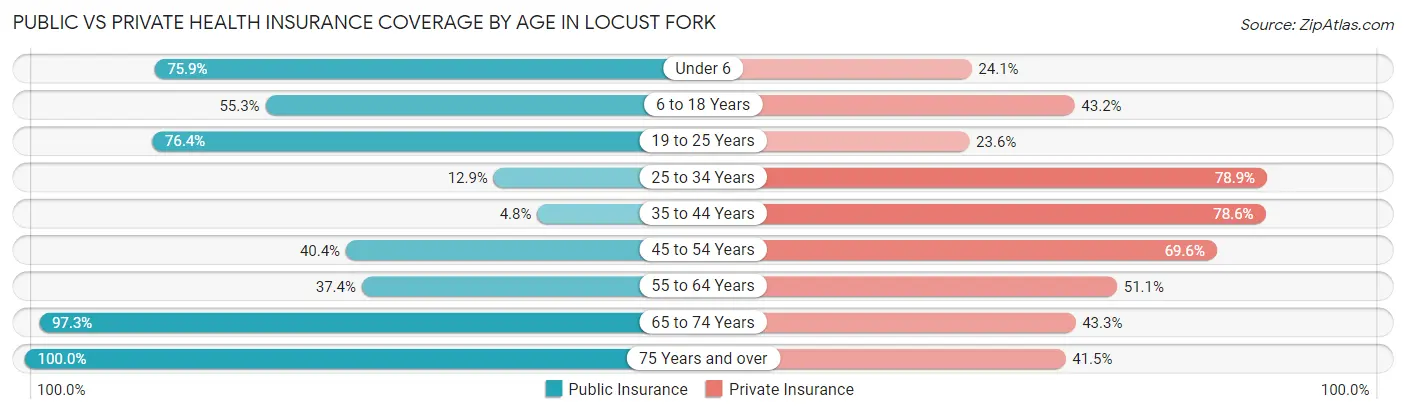
| Age Bracket | Public Insurance | Private Insurance |
| Under 6 | 101 (75.9%) | 32 (24.1%) |
| 6 to 18 Years | 73 (55.3%) | 57 (43.2%) |
| 19 to 25 Years | 42 (76.4%) | 13 (23.6%) |
| 25 to 34 Years | 19 (12.9%) | 116 (78.9%) |
| 35 to 44 Years | 7 (4.8%) | 114 (78.6%) |
| 45 to 54 Years | 69 (40.4%) | 119 (69.6%) |
| 55 to 64 Years | 107 (37.4%) | 146 (51.0%) |
| 65 to 74 Years | 146 (97.3%) | 65 (43.3%) |
| 75 Years and over | 94 (100.0%) | 39 (41.5%) |
| Total | 658 (50.1%) | 701 (53.4%) |
Disability Status by Sex by Age in Locust Fork
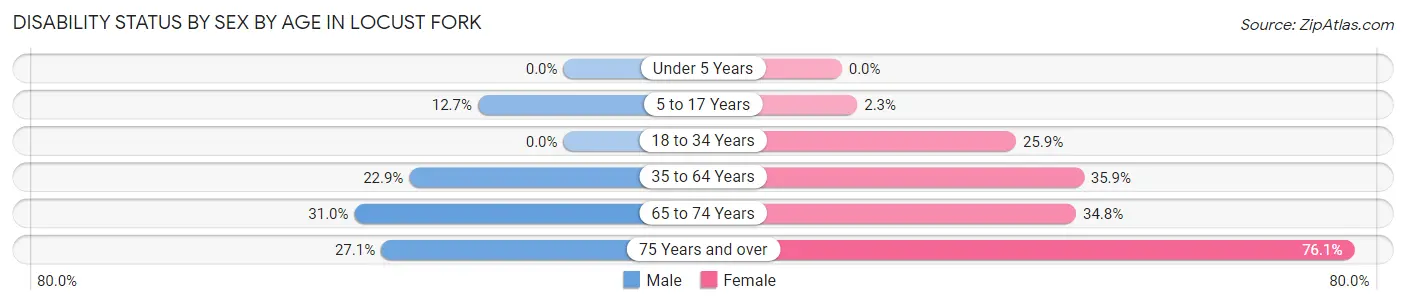
| Age Bracket | Male | Female |
| Under 5 Years | 0 (0.0%) | 0 (0.0%) |
| 5 to 17 Years | 8 (12.7%) | 2 (2.3%) |
| 18 to 34 Years | 0 (0.0%) | 44 (25.9%) |
| 35 to 64 Years | 76 (22.9%) | 97 (35.9%) |
| 65 to 74 Years | 18 (31.0%) | 32 (34.8%) |
| 75 Years and over | 13 (27.1%) | 35 (76.1%) |
Disability Class by Sex by Age in Locust Fork
Disability Class: Hearing Difficulty
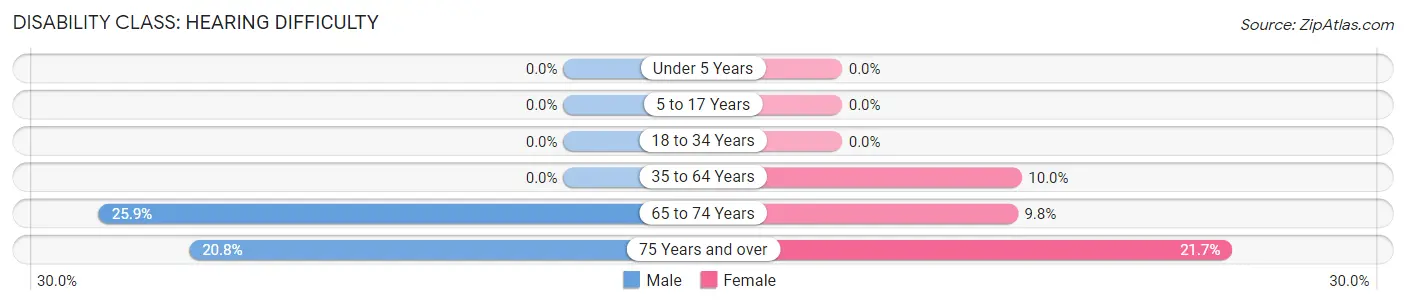
| Age Bracket | Male | Female |
| Under 5 Years | 0 (0.0%) | 0 (0.0%) |
| 5 to 17 Years | 0 (0.0%) | 0 (0.0%) |
| 18 to 34 Years | 0 (0.0%) | 0 (0.0%) |
| 35 to 64 Years | 0 (0.0%) | 27 (10.0%) |
| 65 to 74 Years | 15 (25.9%) | 9 (9.8%) |
| 75 Years and over | 10 (20.8%) | 10 (21.7%) |
Disability Class: Vision Difficulty
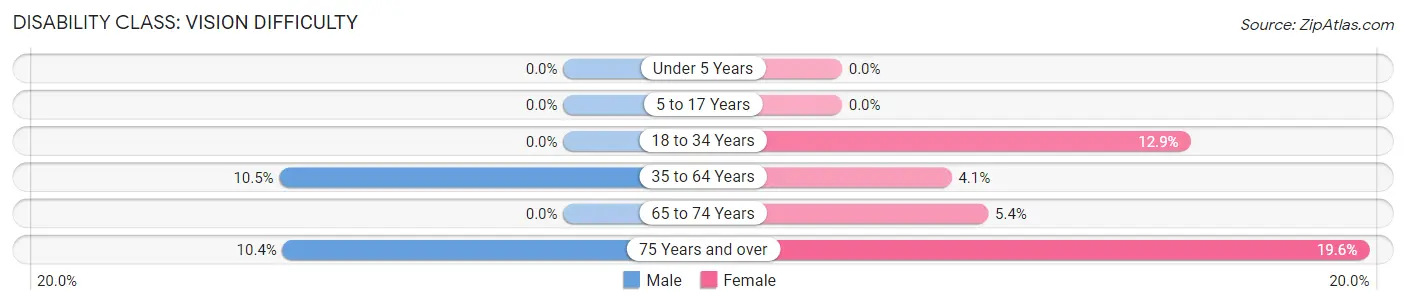
| Age Bracket | Male | Female |
| Under 5 Years | 0 (0.0%) | 0 (0.0%) |
| 5 to 17 Years | 0 (0.0%) | 0 (0.0%) |
| 18 to 34 Years | 0 (0.0%) | 22 (12.9%) |
| 35 to 64 Years | 35 (10.5%) | 11 (4.1%) |
| 65 to 74 Years | 0 (0.0%) | 5 (5.4%) |
| 75 Years and over | 5 (10.4%) | 9 (19.6%) |
Disability Class: Cognitive Difficulty
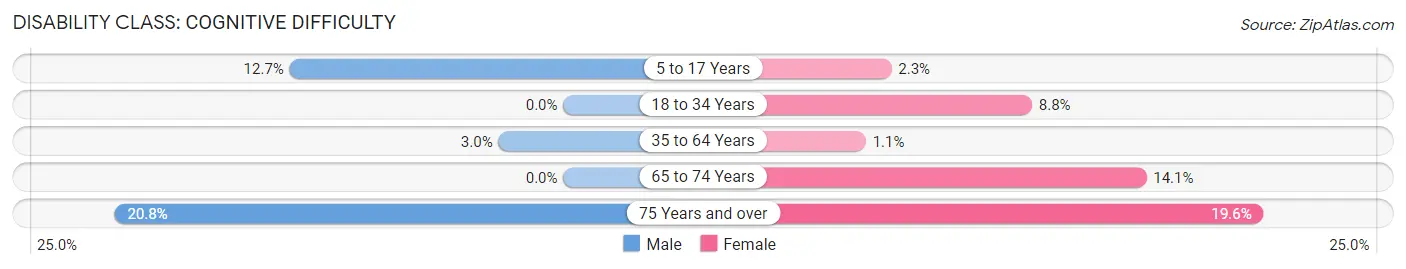
| Age Bracket | Male | Female |
| 5 to 17 Years | 8 (12.7%) | 2 (2.3%) |
| 18 to 34 Years | 0 (0.0%) | 15 (8.8%) |
| 35 to 64 Years | 10 (3.0%) | 3 (1.1%) |
| 65 to 74 Years | 0 (0.0%) | 13 (14.1%) |
| 75 Years and over | 10 (20.8%) | 9 (19.6%) |
Disability Class: Ambulatory Difficulty
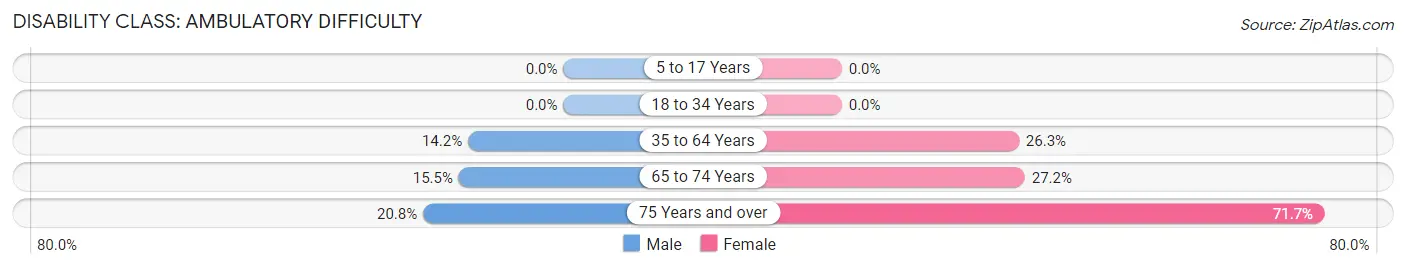
| Age Bracket | Male | Female |
| 5 to 17 Years | 0 (0.0%) | 0 (0.0%) |
| 18 to 34 Years | 0 (0.0%) | 0 (0.0%) |
| 35 to 64 Years | 47 (14.2%) | 71 (26.3%) |
| 65 to 74 Years | 9 (15.5%) | 25 (27.2%) |
| 75 Years and over | 10 (20.8%) | 33 (71.7%) |
Disability Class: Self-Care Difficulty
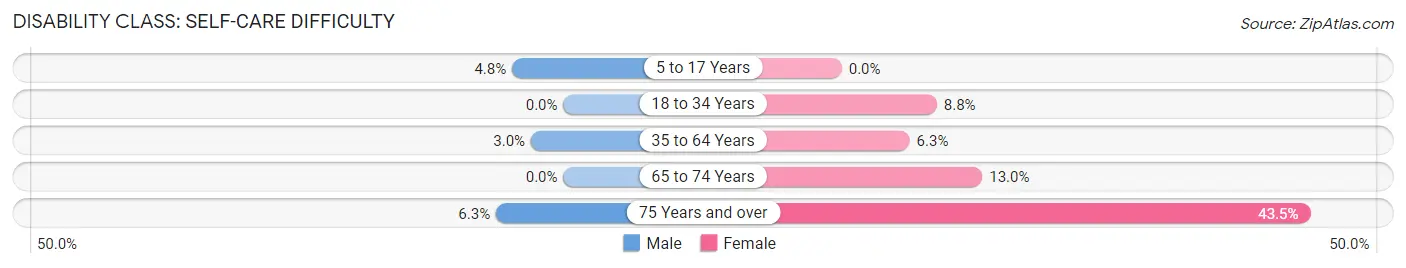
| Age Bracket | Male | Female |
| 5 to 17 Years | 3 (4.8%) | 0 (0.0%) |
| 18 to 34 Years | 0 (0.0%) | 15 (8.8%) |
| 35 to 64 Years | 10 (3.0%) | 17 (6.3%) |
| 65 to 74 Years | 0 (0.0%) | 12 (13.0%) |
| 75 Years and over | 3 (6.2%) | 20 (43.5%) |
Technology Access in Locust Fork
Computing Device Access in Locust Fork
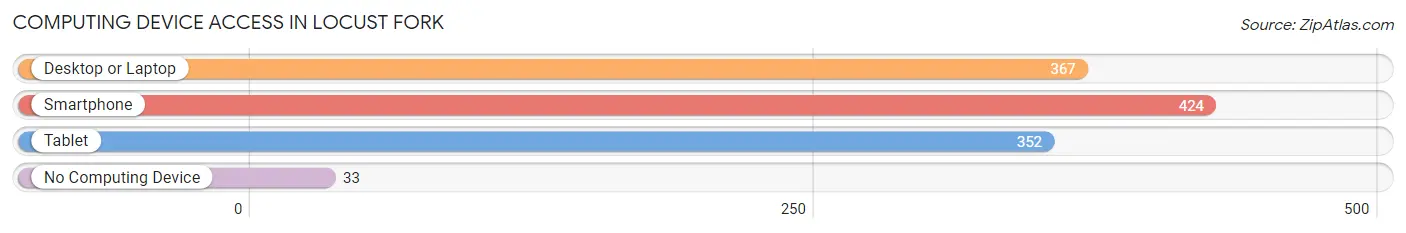
| Device Type | # Households | % Households |
| Desktop or Laptop | 367 | 71.8% |
| Smartphone | 424 | 83.0% |
| Tablet | 352 | 68.9% |
| No Computing Device | 33 | 6.5% |
| Total | 511 | 100.0% |
Internet Access in Locust Fork
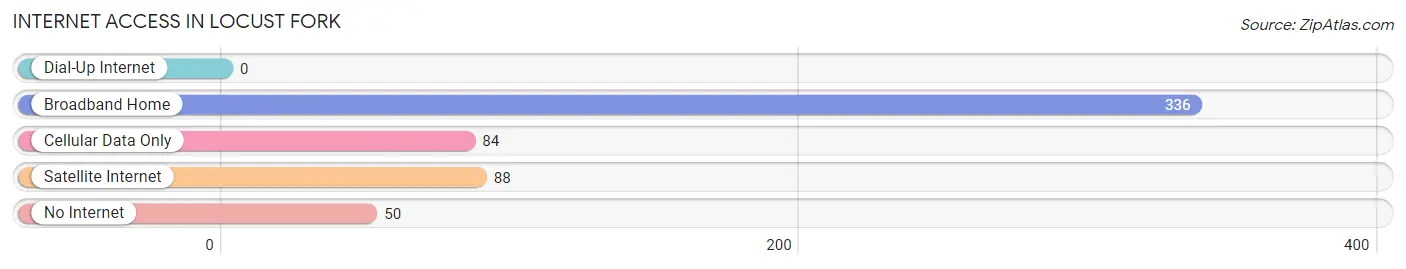
| Internet Type | # Households | % Households |
| Dial-Up Internet | 0 | 0.0% |
| Broadband Home | 336 | 65.7% |
| Cellular Data Only | 84 | 16.4% |
| Satellite Internet | 88 | 17.2% |
| No Internet | 50 | 9.8% |
| Total | 511 | 100.0% |
Locust Fork Summary
History
Locust Fork is a small unincorporated community located in Blount County, Alabama. It is situated along the Locust Fork of the Black Warrior River, and is part of the Birmingham-Hoover Metropolitan Statistical Area. The community was first settled in the early 1800s by settlers from North Carolina and Virginia. The town was originally known as “Locust Fork of the Black Warrior”, and was later shortened to its current name.
The town was officially incorporated in 1887, and the first post office was established in 1891. The town was home to a variety of businesses, including a general store, a grist mill, a sawmill, a cotton gin, and a blacksmith shop. The town also had a school, a church, and a cemetery.
The town was a popular destination for tourists in the early 1900s, and was known for its scenic beauty and outdoor activities. The town was also home to a number of resorts, including the Locust Fork Hotel, which was built in the late 1800s and was a popular destination for visitors from Birmingham and other nearby cities.
Geography
Locust Fork is located in Blount County, Alabama, and is situated along the Locust Fork of the Black Warrior River. The town is located approximately 25 miles northeast of Birmingham, and is part of the Birmingham-Hoover Metropolitan Statistical Area. The town is located in the foothills of the Appalachian Mountains, and is surrounded by rolling hills and forests.
The town has a total area of 1.2 square miles, all of which is land. The town is located at an elevation of 845 feet above sea level. The climate in the area is humid subtropical, with hot, humid summers and mild winters.
Economy
The economy of Locust Fork is largely based on agriculture and tourism. The town is home to a number of farms, which produce a variety of crops, including corn, soybeans, cotton, and hay. The town is also home to a number of tourist attractions, including the Locust Fork Hotel, which was built in the late 1800s and is a popular destination for visitors from Birmingham and other nearby cities.
The town is also home to a number of small businesses, including restaurants, convenience stores, and gas stations. The town is served by the Blount County School System, and is home to a number of churches.
Demographics
As of the 2010 census, the population of Locust Fork was 1,093. The racial makeup of the town was 97.3% White, 0.7% African American, 0.2% Native American, 0.2% Asian, 0.1% from other races, and 1.5% from two or more races. Hispanic or Latino of any race were 0.7% of the population.
The median household income in the town was $37,500, and the median family income was $45,000. The per capita income in the town was $18,000. About 11.3% of families and 14.2% of the population were below the poverty line, including 18.2% of those under age 18 and 8.3% of those age 65 or over.
Common Questions
What is Per Capita Income in Locust Fork?
Per Capita income in Locust Fork is $27,506.
What is the Median Family Income in Locust Fork?
Median Family Income in Locust Fork is $55,096.
What is the Median Household income in Locust Fork?
Median Household Income in Locust Fork is $44,688.
What is Income or Wage Gap in Locust Fork?
Income or Wage Gap in Locust Fork is 41.6%.
Women in Locust Fork earn 58.4 cents for every dollar earned by a man.
What is Family Income Deficit in Locust Fork?
Family Income Deficit in Locust Fork is $8,092.
Families that are below poverty line in Locust Fork earn $8,092 less on average than the poverty threshold level.
What is Inequality or Gini Index in Locust Fork?
Inequality or Gini Index in Locust Fork is 0.44.
What is the Total Population of Locust Fork?
Total Population of Locust Fork is 1,316.
What is the Total Male Population of Locust Fork?
Total Male Population of Locust Fork is 574.
What is the Total Female Population of Locust Fork?
Total Female Population of Locust Fork is 742.
What is the Ratio of Males per 100 Females in Locust Fork?
There are 77.36 Males per 100 Females in Locust Fork.
What is the Ratio of Females per 100 Males in Locust Fork?
There are 129.27 Females per 100 Males in Locust Fork.
What is the Median Population Age in Locust Fork?
Median Population Age in Locust Fork is 47.7 Years.
What is the Average Family Size in Locust Fork
Average Family Size in Locust Fork is 2.9 People.
What is the Average Household Size in Locust Fork
Average Household Size in Locust Fork is 2.6 People.
How Large is the Labor Force in Locust Fork?
There are 524 People in the Labor Forcein in Locust Fork.
What is the Percentage of People in the Labor Force in Locust Fork?
48.7% of People are in the Labor Force in Locust Fork.
What is the Unemployment Rate in Locust Fork?
Unemployment Rate in Locust Fork is 5.4%.