Russellville, AL Map & Demographics
Russellville Map
Russellville Overview
$23,410
PER CAPITA INCOME
$60,750
AVG FAMILY INCOME
$50,411
AVG HOUSEHOLD INCOME
39.0%
WAGE / INCOME GAP [ % ]
61.0¢/ $1
WAGE / INCOME GAP [ $ ]
0.44
INEQUALITY / GINI INDEX
10,767
TOTAL POPULATION
5,301
MALE POPULATION
5,466
FEMALE POPULATION
96.98
MALES / 100 FEMALES
103.11
FEMALES / 100 MALES
33.1
MEDIAN AGE
4.2
AVG FAMILY SIZE
3.0
AVG HOUSEHOLD SIZE
4,936
LABOR FORCE [ PEOPLE ]
62.4%
PERCENT IN LABOR FORCE
3.5%
UNEMPLOYMENT RATE
Russellville Area Codes
Income in Russellville
Income Overview in Russellville
Per Capita Income in Russellville is $23,410, while median incomes of families and households are $60,750 and $50,411 respectively.
| Characteristic | Number | Measure |
| Per Capita Income | 10,767 | $23,410 |
| Median Family Income | 2,118 | $60,750 |
| Mean Family Income | 2,118 | $72,734 |
| Median Household Income | 3,493 | $50,411 |
| Mean Household Income | 3,493 | $62,880 |
| Income Deficit | 2,118 | $0 |
| Wage / Income Gap (%) | 10,767 | 38.98% |
| Wage / Income Gap ($) | 10,767 | 61.02¢ per $1 |
| Gini / Inequality Index | 10,767 | 0.44 |
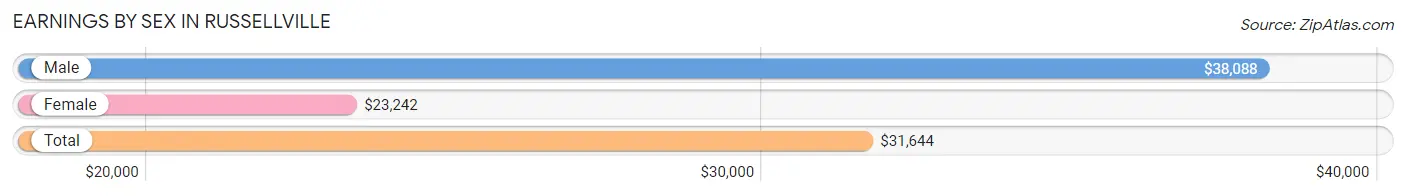
Earnings by Sex in Russellville
Average Earnings in Russellville are $31,644, $38,088 for men and $23,242 for women, a difference of 39.0%.
| Sex | Number | Average Earnings |
| Male | 2,834 (55.3%) | $38,088 |
| Female | 2,292 (44.7%) | $23,242 |
| Total | 5,126 (100.0%) | $31,644 |
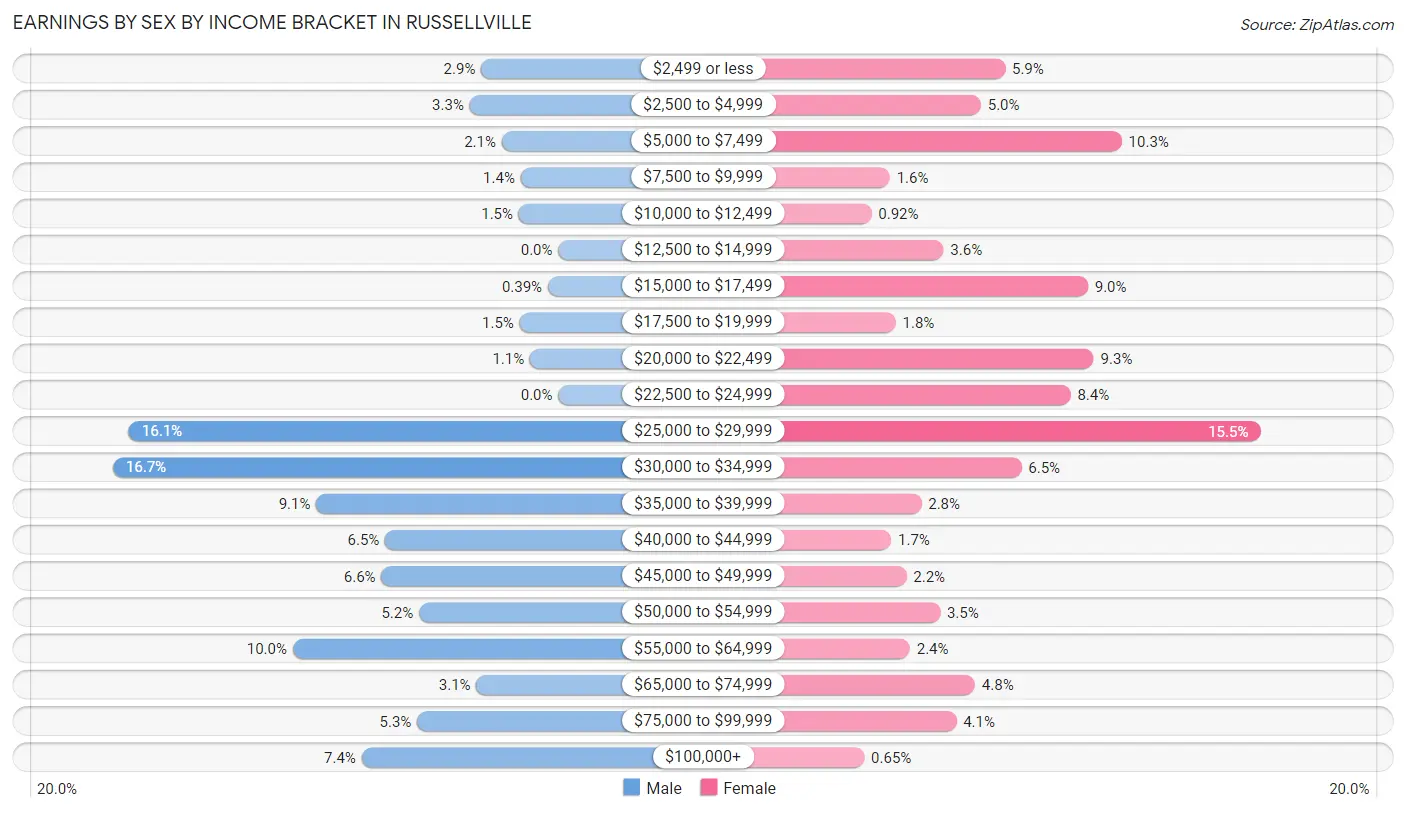
Earnings by Sex by Income Bracket in Russellville
The most common earnings brackets in Russellville are $30,000 to $34,999 for men (473 | 16.7%) and $25,000 to $29,999 for women (355 | 15.5%).
| Income | Male | Female |
| $2,499 or less | 82 (2.9%) | 136 (5.9%) |
| $2,500 to $4,999 | 94 (3.3%) | 115 (5.0%) |
| $5,000 to $7,499 | 60 (2.1%) | 236 (10.3%) |
| $7,500 to $9,999 | 40 (1.4%) | 37 (1.6%) |
| $10,000 to $12,499 | 42 (1.5%) | 21 (0.9%) |
| $12,500 to $14,999 | 0 (0.0%) | 83 (3.6%) |
| $15,000 to $17,499 | 11 (0.4%) | 207 (9.0%) |
| $17,500 to $19,999 | 41 (1.5%) | 42 (1.8%) |
| $20,000 to $22,499 | 30 (1.1%) | 212 (9.2%) |
| $22,500 to $24,999 | 0 (0.0%) | 192 (8.4%) |
| $25,000 to $29,999 | 456 (16.1%) | 355 (15.5%) |
| $30,000 to $34,999 | 473 (16.7%) | 150 (6.5%) |
| $35,000 to $39,999 | 257 (9.1%) | 64 (2.8%) |
| $40,000 to $44,999 | 184 (6.5%) | 38 (1.7%) |
| $45,000 to $49,999 | 188 (6.6%) | 51 (2.2%) |
| $50,000 to $54,999 | 148 (5.2%) | 80 (3.5%) |
| $55,000 to $64,999 | 282 (10.0%) | 54 (2.4%) |
| $65,000 to $74,999 | 87 (3.1%) | 110 (4.8%) |
| $75,000 to $99,999 | 150 (5.3%) | 94 (4.1%) |
| $100,000+ | 209 (7.4%) | 15 (0.6%) |
| Total | 2,834 (100.0%) | 2,292 (100.0%) |
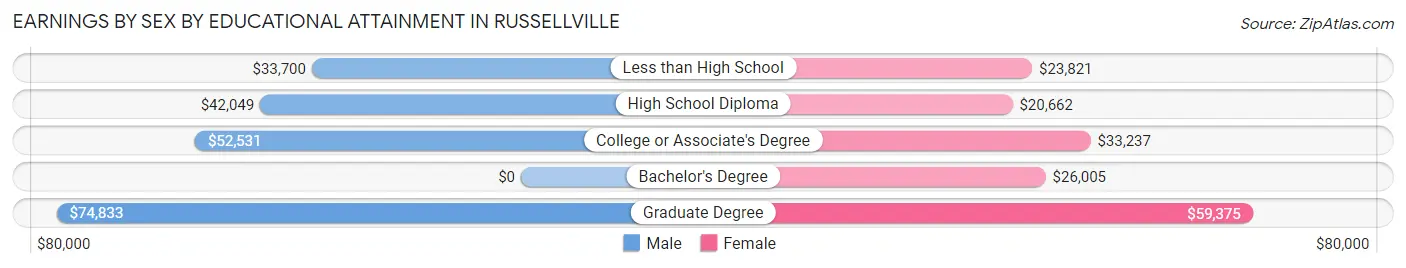
Earnings by Sex by Educational Attainment in Russellville
Average earnings in Russellville are $41,609 for men and $25,755 for women, a difference of 38.1%. Men with an educational attainment of graduate degree enjoy the highest average annual earnings of $74,833, while those with less than high school education earn the least with $33,700. Women with an educational attainment of graduate degree earn the most with the average annual earnings of $59,375, while those with high school diploma education have the smallest earnings of $20,662.
| Educational Attainment | Male Income | Female Income |
| Less than High School | $33,700 | $23,821 |
| High School Diploma | $42,049 | $20,662 |
| College or Associate's Degree | $52,531 | $33,237 |
| Bachelor's Degree | - | - |
| Graduate Degree | $74,833 | $59,375 |
| Total | $41,609 | $25,755 |
Family Income in Russellville
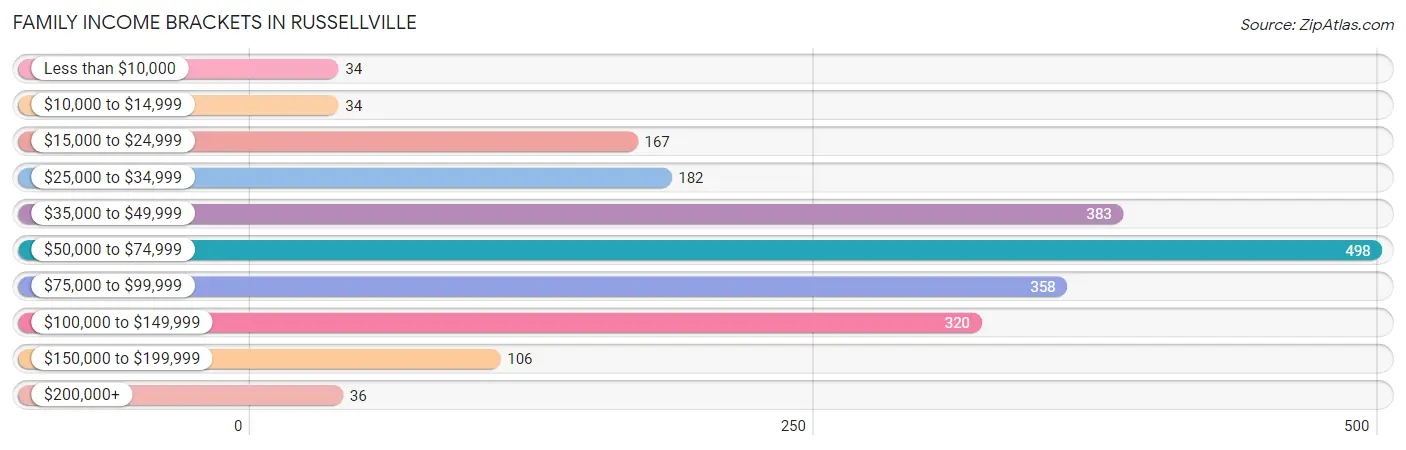
Family Income Brackets in Russellville
According to the Russellville family income data, there are 498 families falling into the $50,000 to $74,999 income range, which is the most common income bracket and makes up 23.5% of all families. Conversely, the less than $10,000 income bracket is the least frequent group with only 34 families (1.6%) belonging to this category.
| Income Bracket | # Families | % Families |
| Less than $10,000 | 34 | 1.6% |
| $10,000 to $14,999 | 34 | 1.6% |
| $15,000 to $24,999 | 167 | 7.9% |
| $25,000 to $34,999 | 182 | 8.6% |
| $35,000 to $49,999 | 383 | 18.1% |
| $50,000 to $74,999 | 498 | 23.5% |
| $75,000 to $99,999 | 358 | 16.9% |
| $100,000 to $149,999 | 320 | 15.1% |
| $150,000 to $199,999 | 106 | 5.0% |
| $200,000+ | 36 | 1.7% |
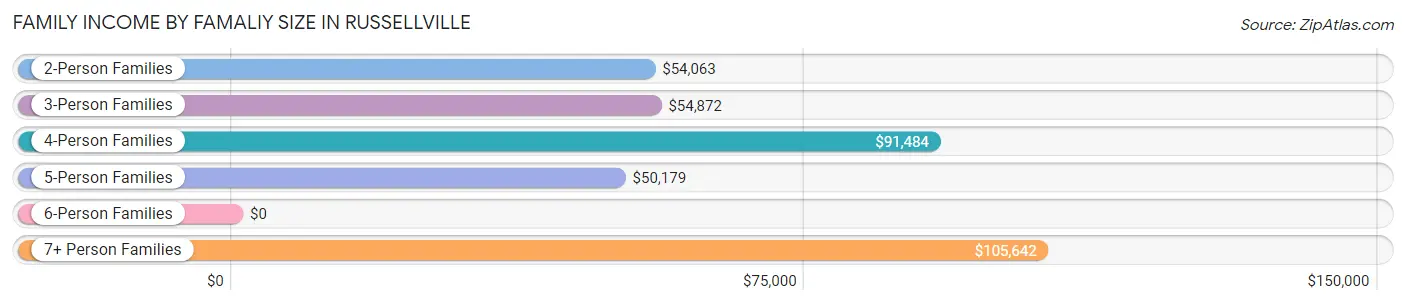
Family Income by Famaliy Size in Russellville
7+ person families (103 | 4.9%) account for the highest median family income in Russellville with $105,642 per family, while 2-person families (750 | 35.4%) have the highest median income of $27,032 per family member.
| Income Bracket | # Families | Median Income |
| 2-Person Families | 750 (35.4%) | $54,063 |
| 3-Person Families | 587 (27.7%) | $54,872 |
| 4-Person Families | 218 (10.3%) | $91,484 |
| 5-Person Families | 438 (20.7%) | $50,179 |
| 6-Person Families | 22 (1.0%) | $0 |
| 7+ Person Families | 103 (4.9%) | $105,642 |
| Total | 2,118 (100.0%) | $60,750 |
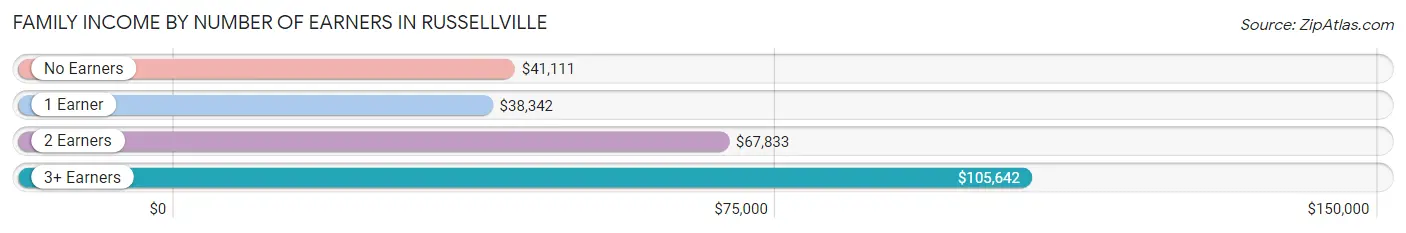
Family Income by Number of Earners in Russellville
The median family income in Russellville is $60,750, with families comprising 3+ earners (311) having the highest median family income of $105,642, while families with 1 earner (669) have the lowest median family income of $38,342, accounting for 14.7% and 31.6% of families, respectively.
| Number of Earners | # Families | Median Income |
| No Earners | 276 (13.0%) | $41,111 |
| 1 Earner | 669 (31.6%) | $38,342 |
| 2 Earners | 862 (40.7%) | $67,833 |
| 3+ Earners | 311 (14.7%) | $105,642 |
| Total | 2,118 (100.0%) | $60,750 |
Household Income in Russellville
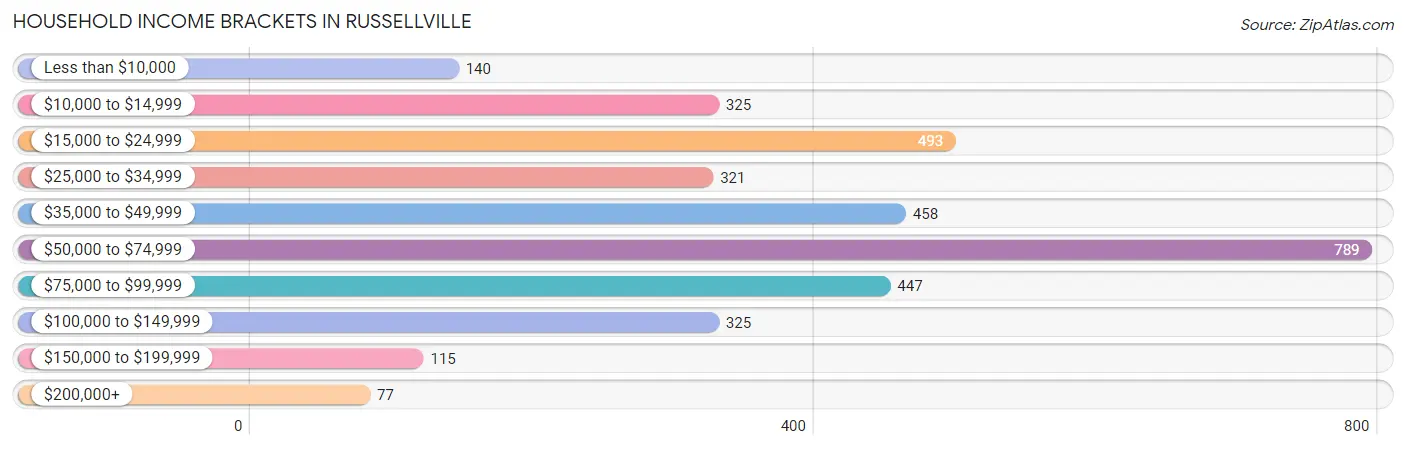
Household Income Brackets in Russellville
With 789 households falling in the category, the $50,000 to $74,999 income range is the most frequent in Russellville, accounting for 22.6% of all households. In contrast, only 77 households (2.2%) fall into the $200,000+ income bracket, making it the least populous group.
| Income Bracket | # Households | % Households |
| Less than $10,000 | 140 | 4.0% |
| $10,000 to $14,999 | 325 | 9.3% |
| $15,000 to $24,999 | 493 | 14.1% |
| $25,000 to $34,999 | 321 | 9.2% |
| $35,000 to $49,999 | 458 | 13.1% |
| $50,000 to $74,999 | 789 | 22.6% |
| $75,000 to $99,999 | 447 | 12.8% |
| $100,000 to $149,999 | 325 | 9.3% |
| $150,000 to $199,999 | 115 | 3.3% |
| $200,000+ | 77 | 2.2% |
Household Income by Householder Age in Russellville
The median household income in Russellville is $50,411, with the highest median household income of $64,887 found in the 25 to 44 years age bracket for the primary householder. A total of 1,272 households (36.4%) fall into this category. Meanwhile, the 15 to 24 years age bracket for the primary householder has the lowest median household income of $0, with 44 households (1.3%) in this group.
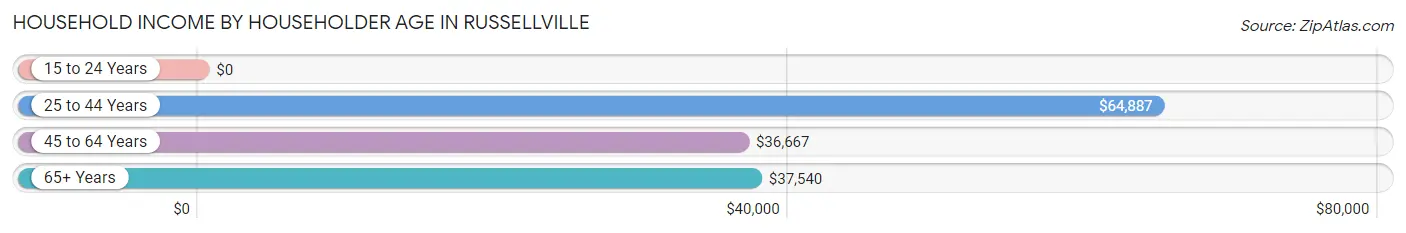
| Income Bracket | # Households | Median Income |
| 15 to 24 Years | 44 (1.3%) | $0 |
| 25 to 44 Years | 1,272 (36.4%) | $64,887 |
| 45 to 64 Years | 1,192 (34.1%) | $36,667 |
| 65+ Years | 985 (28.2%) | $37,540 |
| Total | 3,493 (100.0%) | $50,411 |
Poverty in Russellville
Income Below Poverty by Sex and Age in Russellville
With 13.0% poverty level for males and 13.2% for females among the residents of Russellville, 55 to 64 year old males and 6 to 11 year old females are the most vulnerable to poverty, with 122 males (28.6%) and 143 females (30.9%) in their respective age groups living below the poverty level.
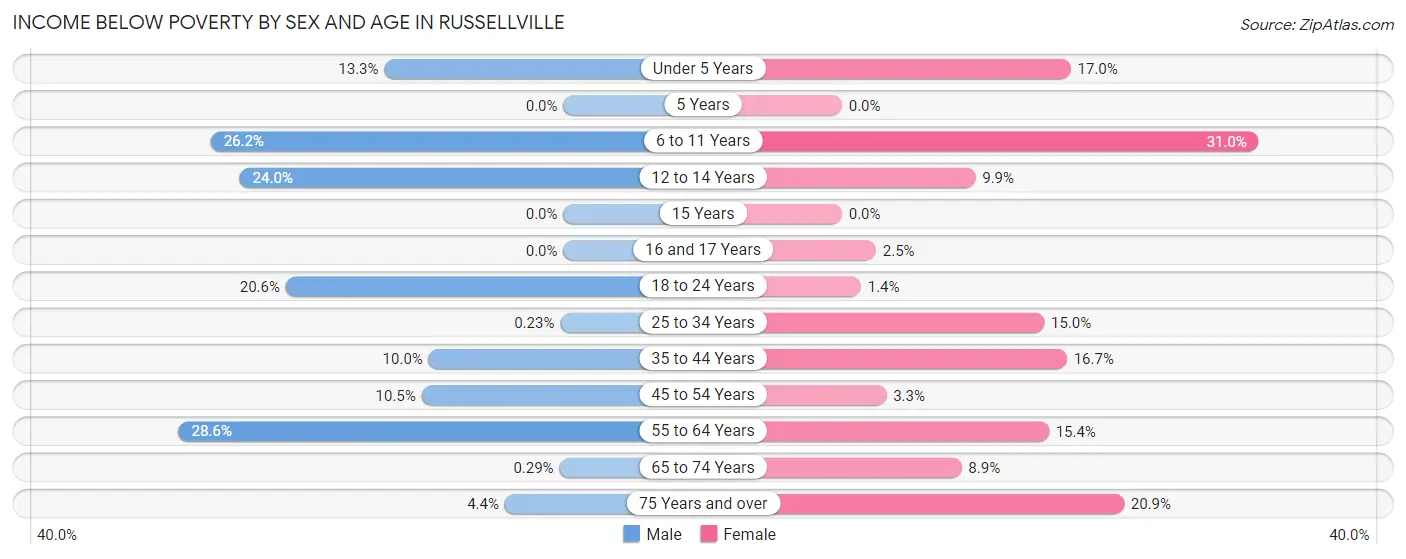
| Age Bracket | Male | Female |
| Under 5 Years | 67 (13.3%) | 96 (17.0%) |
| 5 Years | 0 (0.0%) | 0 (0.0%) |
| 6 to 11 Years | 172 (26.2%) | 143 (30.9%) |
| 12 to 14 Years | 62 (24.0%) | 23 (9.9%) |
| 15 Years | 0 (0.0%) | 0 (0.0%) |
| 16 and 17 Years | 0 (0.0%) | 5 (2.5%) |
| 18 to 24 Years | 121 (20.6%) | 7 (1.4%) |
| 25 to 34 Years | 2 (0.2%) | 99 (15.0%) |
| 35 to 44 Years | 65 (10.0%) | 94 (16.7%) |
| 45 to 54 Years | 54 (10.5%) | 18 (3.3%) |
| 55 to 64 Years | 122 (28.6%) | 86 (15.4%) |
| 65 to 74 Years | 1 (0.3%) | 46 (8.9%) |
| 75 Years and over | 11 (4.3%) | 89 (20.9%) |
| Total | 677 (13.0%) | 706 (13.2%) |
Income Above Poverty by Sex and Age in Russellville
According to the poverty statistics in Russellville, males aged 5 years and females aged 5 years are the age groups that are most secure financially, with 100.0% of males and 100.0% of females in these age groups living above the poverty line.
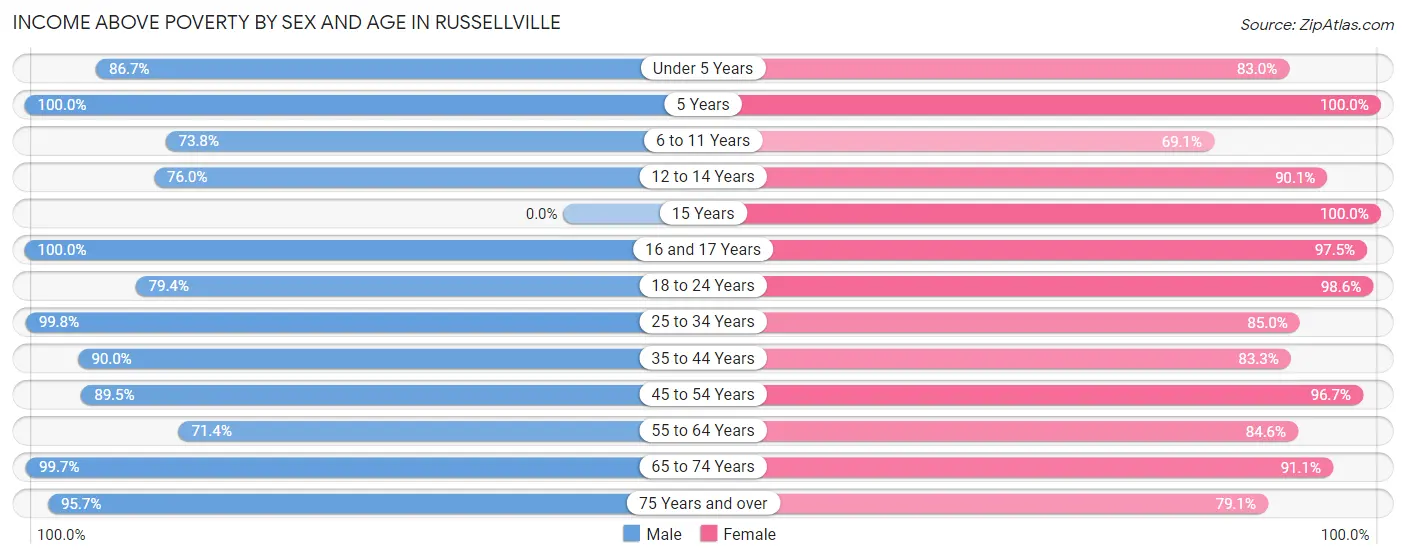
| Age Bracket | Male | Female |
| Under 5 Years | 437 (86.7%) | 469 (83.0%) |
| 5 Years | 63 (100.0%) | 18 (100.0%) |
| 6 to 11 Years | 485 (73.8%) | 319 (69.1%) |
| 12 to 14 Years | 196 (76.0%) | 209 (90.1%) |
| 15 Years | 0 (0.0%) | 98 (100.0%) |
| 16 and 17 Years | 96 (100.0%) | 193 (97.5%) |
| 18 to 24 Years | 466 (79.4%) | 490 (98.6%) |
| 25 to 34 Years | 856 (99.8%) | 560 (85.0%) |
| 35 to 44 Years | 585 (90.0%) | 469 (83.3%) |
| 45 to 54 Years | 459 (89.5%) | 527 (96.7%) |
| 55 to 64 Years | 305 (71.4%) | 474 (84.6%) |
| 65 to 74 Years | 346 (99.7%) | 472 (91.1%) |
| 75 Years and over | 242 (95.7%) | 336 (79.1%) |
| Total | 4,536 (87.0%) | 4,634 (86.8%) |
Income Below Poverty Among Married-Couple Families in Russellville
The poverty statistics for married-couple families in Russellville show that 5.7% or 81 of the total 1,425 families live below the poverty line. Families with 3 or 4 children have the highest poverty rate of 24.5%, comprising of 65 families. On the other hand, families with 1 or 2 children have the lowest poverty rate of 0.0%, which includes 0 families.
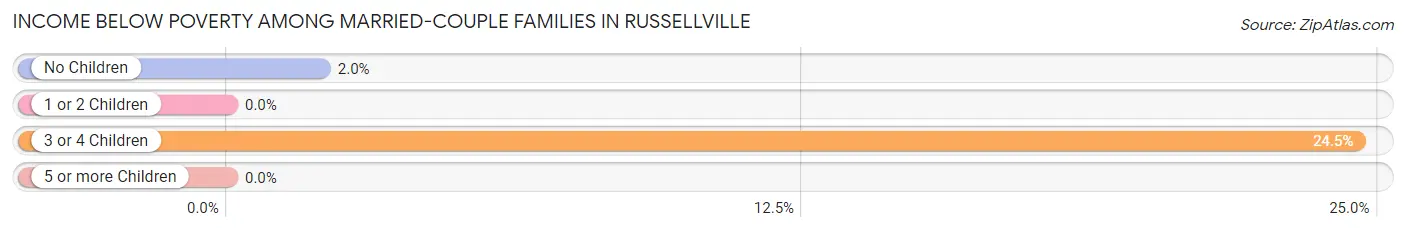
| Children | Above Poverty | Below Poverty |
| No Children | 775 (98.0%) | 16 (2.0%) |
| 1 or 2 Children | 369 (100.0%) | 0 (0.0%) |
| 3 or 4 Children | 200 (75.5%) | 65 (24.5%) |
| 5 or more Children | 0 (0.0%) | 0 (0.0%) |
| Total | 1,344 (94.3%) | 81 (5.7%) |
Income Below Poverty Among Single-Parent Households in Russellville
According to the poverty data in Russellville, 6.0% or 18 single-father households and 32.4% or 127 single-mother households are living below the poverty line. Among single-father households, those with 1 or 2 children have the highest poverty rate, with 18 households (11.5%) experiencing poverty. Likewise, among single-mother households, those with 3 or 4 children have the highest poverty rate, with 64 households (41.0%) falling below the poverty line.
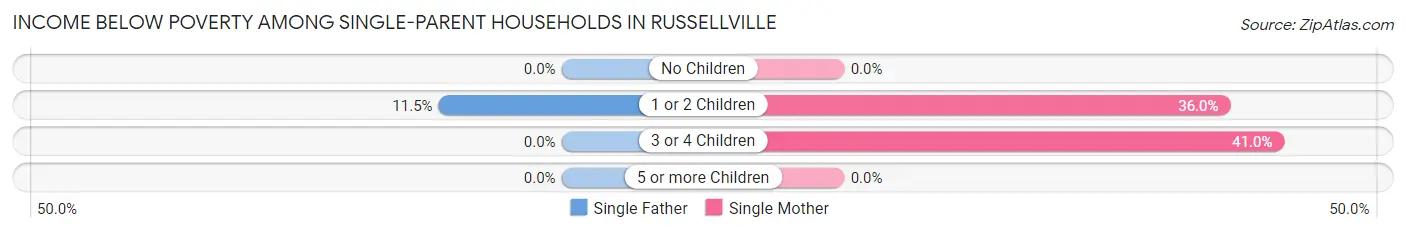
| Children | Single Father | Single Mother |
| No Children | 0 (0.0%) | 0 (0.0%) |
| 1 or 2 Children | 18 (11.5%) | 63 (36.0%) |
| 3 or 4 Children | 0 (0.0%) | 64 (41.0%) |
| 5 or more Children | 0 (0.0%) | 0 (0.0%) |
| Total | 18 (6.0%) | 127 (32.4%) |
Income Below Poverty Among Married-Couple vs Single-Parent Households in Russellville
The poverty data for Russellville shows that 81 of the married-couple family households (5.7%) and 145 of the single-parent households (20.9%) are living below the poverty level. Within the married-couple family households, those with 3 or 4 children have the highest poverty rate, with 65 households (24.5%) falling below the poverty line. Among the single-parent households, those with 3 or 4 children have the highest poverty rate, with 64 household (41.0%) living below poverty.
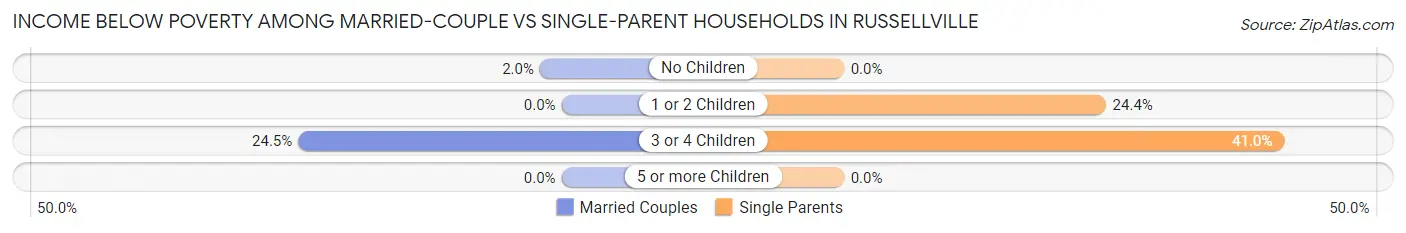
| Children | Married-Couple Families | Single-Parent Households |
| No Children | 16 (2.0%) | 0 (0.0%) |
| 1 or 2 Children | 0 (0.0%) | 81 (24.4%) |
| 3 or 4 Children | 65 (24.5%) | 64 (41.0%) |
| 5 or more Children | 0 (0.0%) | 0 (0.0%) |
| Total | 81 (5.7%) | 145 (20.9%) |
Race in Russellville
The most populous races in Russellville are White / Caucasian (5,487 | 51.0%), Hispanic or Latino (4,231 | 39.3%), and Some other Race (3,350 | 31.1%).
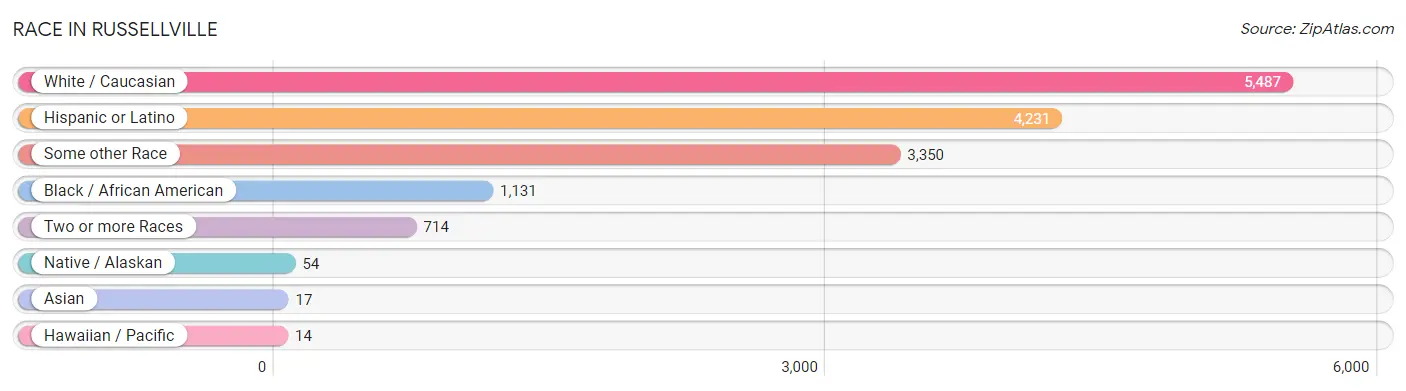
| Race | # Population | % Population |
| Asian | 17 | 0.2% |
| Black / African American | 1,131 | 10.5% |
| Hawaiian / Pacific | 14 | 0.1% |
| Hispanic or Latino | 4,231 | 39.3% |
| Native / Alaskan | 54 | 0.5% |
| White / Caucasian | 5,487 | 51.0% |
| Two or more Races | 714 | 6.6% |
| Some other Race | 3,350 | 31.1% |
| Total | 10,767 | 100.0% |
Ancestry in Russellville
The most populous ancestries reported in Russellville are Mexican (2,300 | 21.4%), American (2,239 | 20.8%), Central American (1,726 | 16.0%), Guatemalan (1,415 | 13.1%), and Irish (467 | 4.3%), together accounting for 75.7% of all Russellville residents.
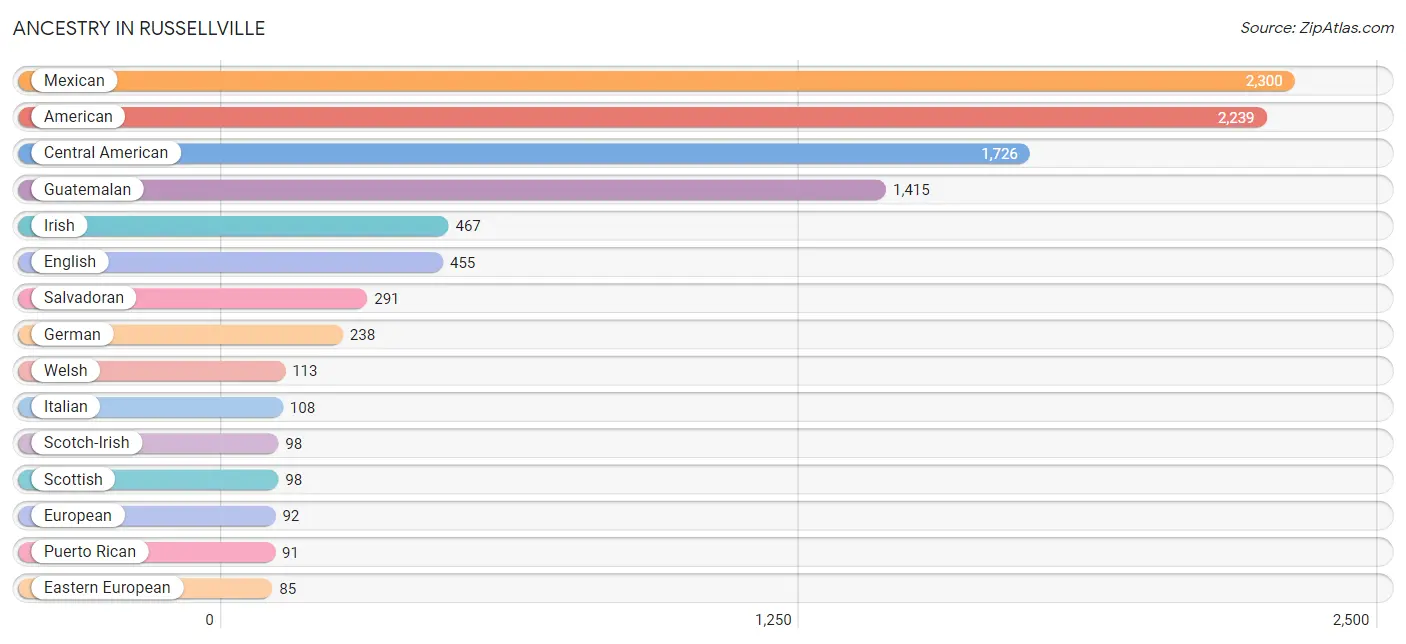
| Ancestry | # Population | % Population |
| American | 2,239 | 20.8% |
| Austrian | 19 | 0.2% |
| British | 11 | 0.1% |
| Bulgarian | 6 | 0.1% |
| Central American | 1,726 | 16.0% |
| Cherokee | 24 | 0.2% |
| Cuban | 79 | 0.7% |
| Czech | 5 | 0.1% |
| Dutch | 37 | 0.3% |
| Eastern European | 85 | 0.8% |
| English | 455 | 4.2% |
| European | 92 | 0.9% |
| French | 46 | 0.4% |
| German | 238 | 2.2% |
| Guatemalan | 1,415 | 13.1% |
| Irish | 467 | 4.3% |
| Italian | 108 | 1.0% |
| Korean | 9 | 0.1% |
| Mexican | 2,300 | 21.4% |
| Native Hawaiian | 23 | 0.2% |
| Panamanian | 20 | 0.2% |
| Puerto Rican | 91 | 0.9% |
| Salvadoran | 291 | 2.7% |
| Scotch-Irish | 98 | 0.9% |
| Scottish | 98 | 0.9% |
| Serbian | 8 | 0.1% |
| Sioux | 1 | 0.0% |
| Thai | 22 | 0.2% |
| Welsh | 113 | 1.1% |
| Yugoslavian | 14 | 0.1% | View All 30 Rows |
Immigrants in Russellville
The most numerous immigrant groups reported in Russellville came from Latin America (1,969 | 18.3%), Central America (1,914 | 17.8%), Guatemala (841 | 7.8%), Mexico (837 | 7.8%), and El Salvador (236 | 2.2%), together accounting for 53.8% of all Russellville residents.
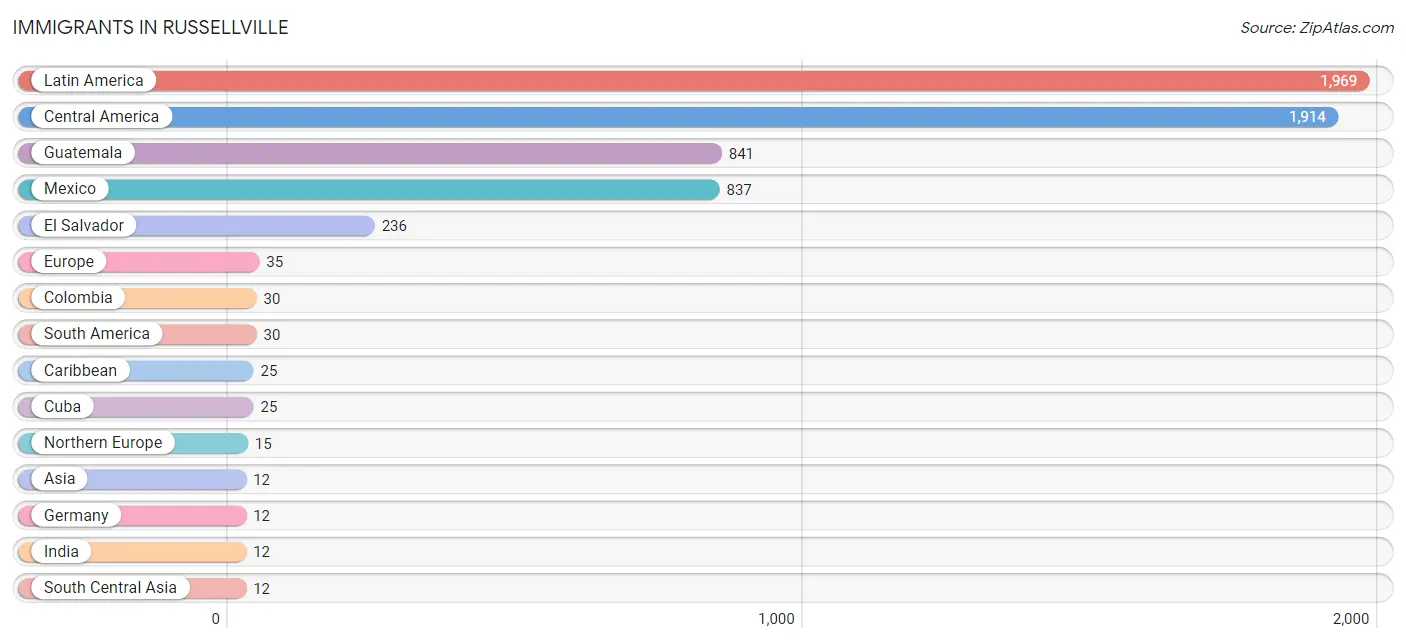
| Immigration Origin | # Population | % Population |
| Asia | 12 | 0.1% |
| Bosnia and Herzegovina | 8 | 0.1% |
| Caribbean | 25 | 0.2% |
| Central America | 1,914 | 17.8% |
| Colombia | 30 | 0.3% |
| Cuba | 25 | 0.2% |
| Eastern Europe | 8 | 0.1% |
| El Salvador | 236 | 2.2% |
| Europe | 35 | 0.3% |
| Germany | 12 | 0.1% |
| Guatemala | 841 | 7.8% |
| India | 12 | 0.1% |
| Latin America | 1,969 | 18.3% |
| Mexico | 837 | 7.8% |
| Northern Europe | 15 | 0.1% |
| South America | 30 | 0.3% |
| South Central Asia | 12 | 0.1% |
| Western Europe | 12 | 0.1% | View All 18 Rows |
Sex and Age in Russellville
Sex and Age in Russellville
The most populous age groups in Russellville are 10 to 14 Years (612 | 11.5%) for men and Under 5 Years (565 | 10.3%) for women.
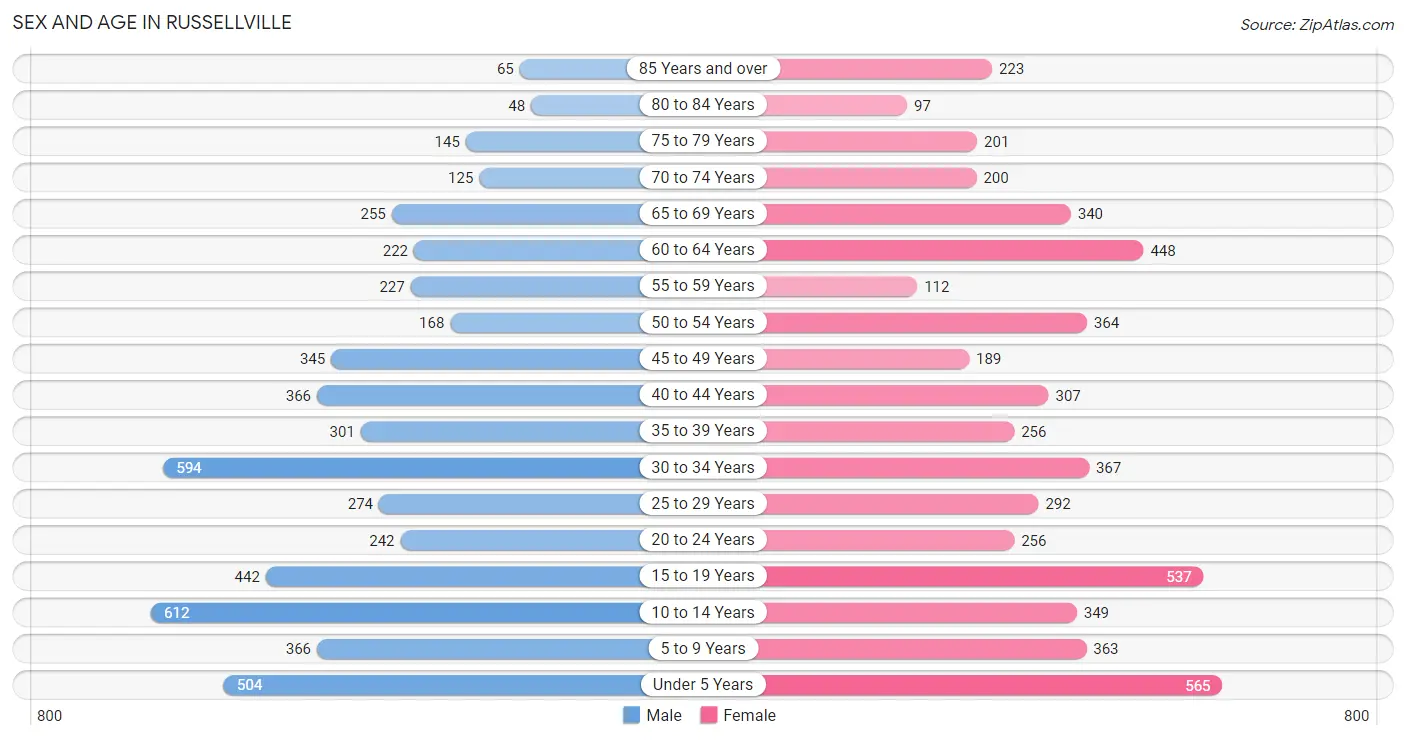
| Age Bracket | Male | Female |
| Under 5 Years | 504 (9.5%) | 565 (10.3%) |
| 5 to 9 Years | 366 (6.9%) | 363 (6.6%) |
| 10 to 14 Years | 612 (11.5%) | 349 (6.4%) |
| 15 to 19 Years | 442 (8.3%) | 537 (9.8%) |
| 20 to 24 Years | 242 (4.6%) | 256 (4.7%) |
| 25 to 29 Years | 274 (5.2%) | 292 (5.3%) |
| 30 to 34 Years | 594 (11.2%) | 367 (6.7%) |
| 35 to 39 Years | 301 (5.7%) | 256 (4.7%) |
| 40 to 44 Years | 366 (6.9%) | 307 (5.6%) |
| 45 to 49 Years | 345 (6.5%) | 189 (3.5%) |
| 50 to 54 Years | 168 (3.2%) | 364 (6.7%) |
| 55 to 59 Years | 227 (4.3%) | 112 (2.1%) |
| 60 to 64 Years | 222 (4.2%) | 448 (8.2%) |
| 65 to 69 Years | 255 (4.8%) | 340 (6.2%) |
| 70 to 74 Years | 125 (2.4%) | 200 (3.7%) |
| 75 to 79 Years | 145 (2.7%) | 201 (3.7%) |
| 80 to 84 Years | 48 (0.9%) | 97 (1.8%) |
| 85 Years and over | 65 (1.2%) | 223 (4.1%) |
| Total | 5,301 (100.0%) | 5,466 (100.0%) |
Families and Households in Russellville
Median Family Size in Russellville
The median family size in Russellville is 4.18 persons per family, with single female/mother families (392 | 18.5%) accounting for the largest median family size of 4.85 persons per family. On the other hand, married-couple families (1,425 | 67.3%) represent the smallest median family size with 3.93 persons per family.
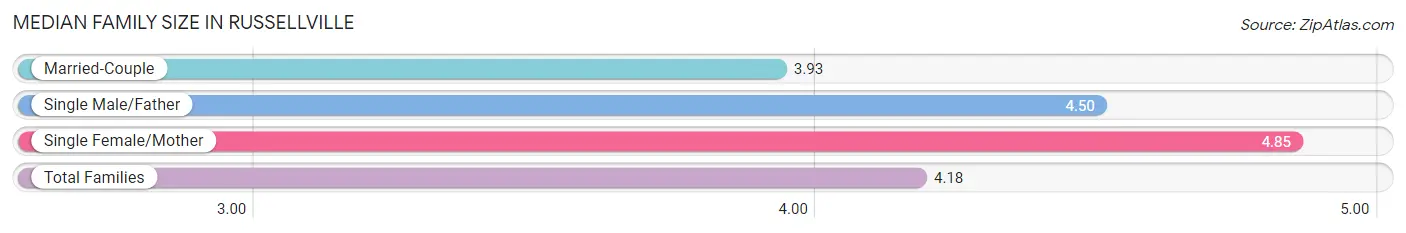
| Family Type | # Families | Family Size |
| Married-Couple | 1,425 (67.3%) | 3.93 |
| Single Male/Father | 301 (14.2%) | 4.50 |
| Single Female/Mother | 392 (18.5%) | 4.85 |
| Total Families | 2,118 (100.0%) | 4.18 |
Median Household Size in Russellville
The median household size in Russellville is 3.02 persons per household, with single female/mother households (392 | 11.2%) accounting for the largest median household size of 5.13 persons per household. non-family households (1,375 | 39.4%) represent the smallest median household size with 1.06 persons per household.
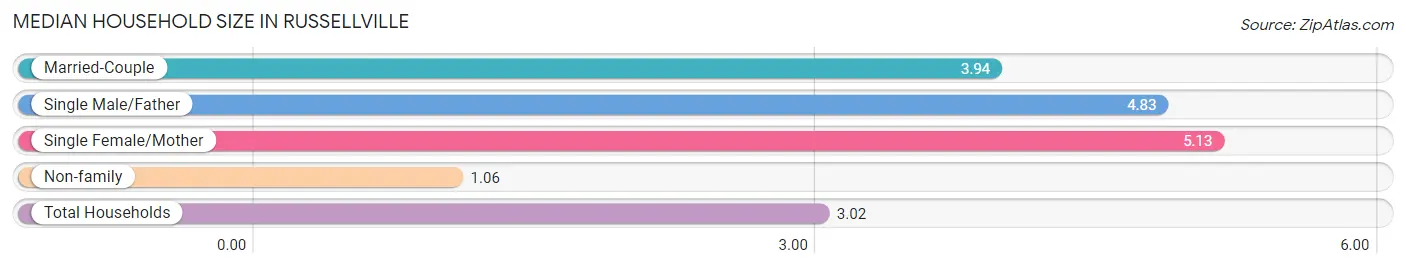
| Household Type | # Households | Household Size |
| Married-Couple | 1,425 (40.8%) | 3.94 |
| Single Male/Father | 301 (8.6%) | 4.83 |
| Single Female/Mother | 392 (11.2%) | 5.13 |
| Non-family | 1,375 (39.4%) | 1.06 |
| Total Households | 3,493 (100.0%) | 3.02 |
Household Size by Marriage Status in Russellville
Out of a total of 3,493 households in Russellville, 2,118 (60.6%) are family households, while 1,375 (39.4%) are nonfamily households. The most numerous type of family households are 2-person households, comprising 709, and the most common type of nonfamily households are 1-person households, comprising 1,272.
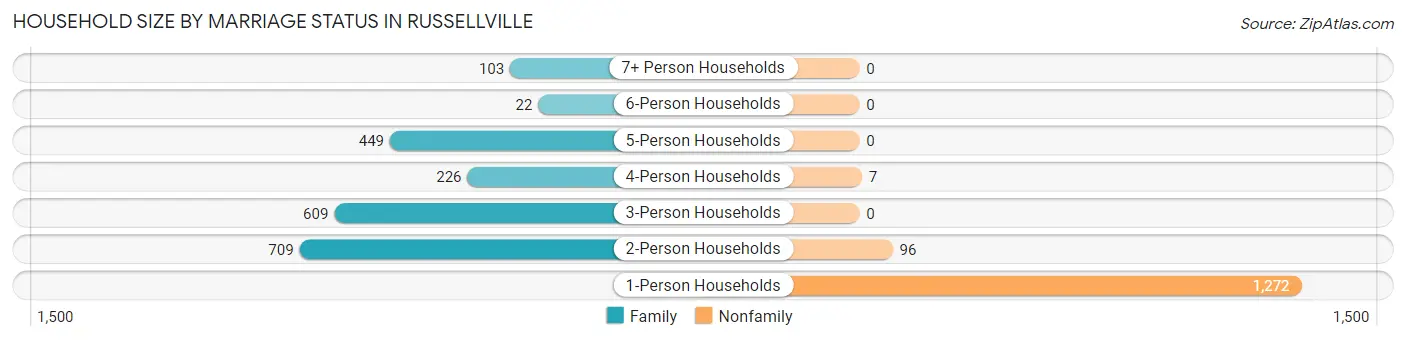
| Household Size | Family Households | Nonfamily Households |
| 1-Person Households | - | 1,272 (36.4%) |
| 2-Person Households | 709 (20.3%) | 96 (2.8%) |
| 3-Person Households | 609 (17.4%) | 0 (0.0%) |
| 4-Person Households | 226 (6.5%) | 7 (0.2%) |
| 5-Person Households | 449 (12.9%) | 0 (0.0%) |
| 6-Person Households | 22 (0.6%) | 0 (0.0%) |
| 7+ Person Households | 103 (2.9%) | 0 (0.0%) |
| Total | 2,118 (60.6%) | 1,375 (39.4%) |
Female Fertility in Russellville
Fertility by Age in Russellville
Average fertility rate in Russellville is 78.0 births per 1,000 women. Women in the age bracket of 20 to 34 years have the highest fertility rate with 174.0 births per 1,000 women. Women in the age bracket of 20 to 34 years acount for 91.4% of all women with births.
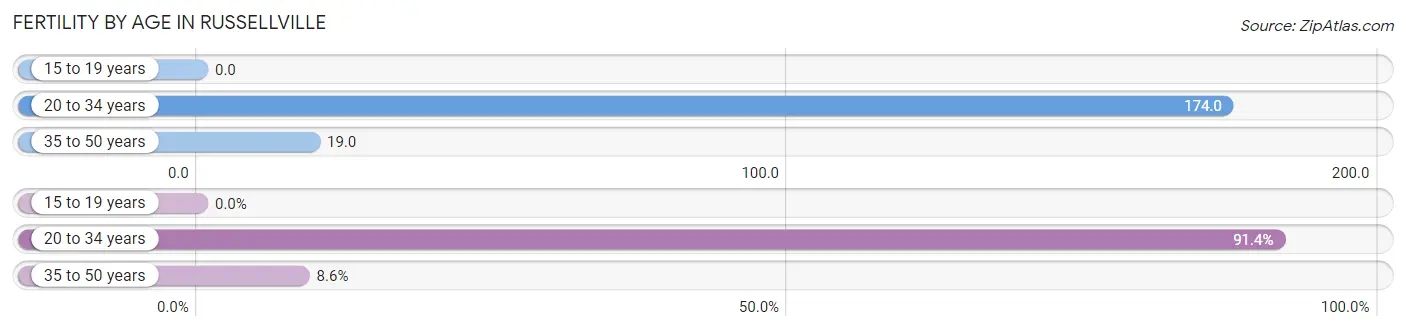
| Age Bracket | Women with Births | Births / 1,000 Women |
| 15 to 19 years | 0 (0.0%) | 0.0 |
| 20 to 34 years | 159 (91.4%) | 174.0 |
| 35 to 50 years | 15 (8.6%) | 19.0 |
| Total | 174 (100.0%) | 78.0 |
Fertility by Age by Marriage Status in Russellville
41.4% of women with births (174) in Russellville are married. The highest percentage of unmarried women with births falls into 35 to 50 years age bracket with 100.0% of them unmarried at the time of birth, while the lowest percentage of unmarried women with births belong to 20 to 34 years age bracket with 54.7% of them unmarried.
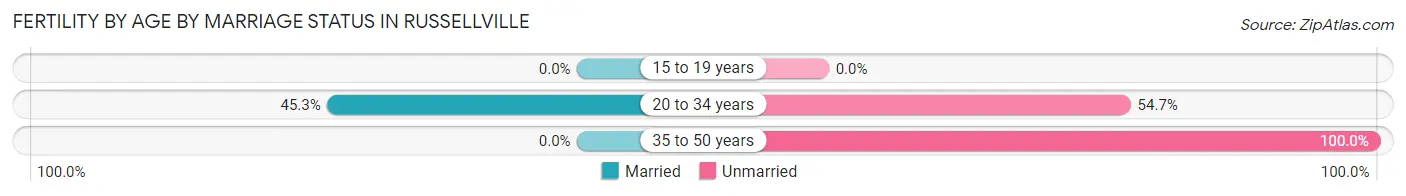
| Age Bracket | Married | Unmarried |
| 15 to 19 years | 0 (0.0%) | 0 (0.0%) |
| 20 to 34 years | 72 (45.3%) | 87 (54.7%) |
| 35 to 50 years | 0 (0.0%) | 15 (100.0%) |
| Total | 72 (41.4%) | 102 (58.6%) |
Fertility by Education in Russellville
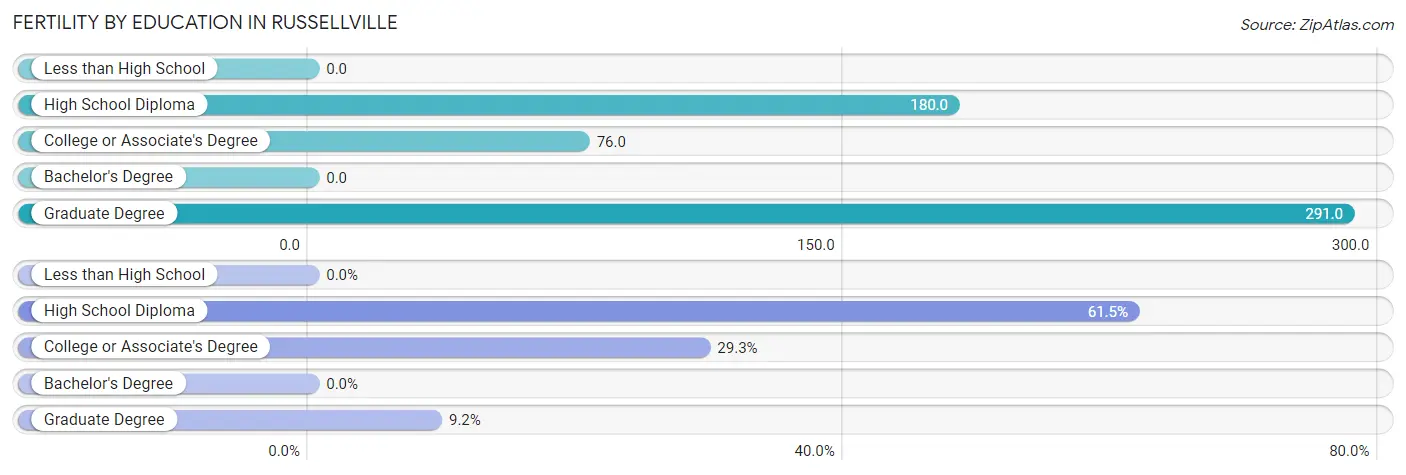
| Educational Attainment | Women with Births | Births / 1,000 Women |
| Less than High School | 0 (0.0%) | 0.0 |
| High School Diploma | 107 (61.5%) | 180.0 |
| College or Associate's Degree | 51 (29.3%) | 76.0 |
| Bachelor's Degree | 0 (0.0%) | 0.0 |
| Graduate Degree | 16 (9.2%) | 291.0 |
| Total | 174 (100.0%) | 78.0 |
Fertility by Education by Marriage Status in Russellville
58.6% of women with births in Russellville are unmarried. Women with the educational attainment of graduate degree are most likely to be married with 100.0% of them married at childbirth, while women with the educational attainment of college or associate's degree are least likely to be married with 86.3% of them unmarried at childbirth.
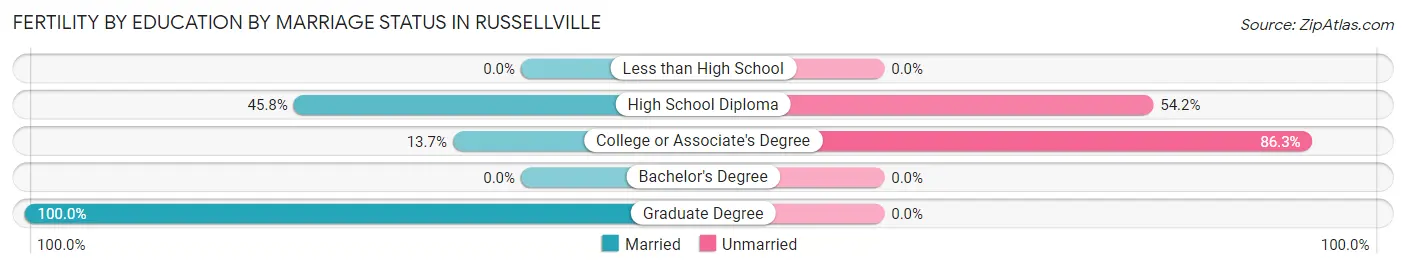
| Educational Attainment | Married | Unmarried |
| Less than High School | 0 (0.0%) | 0 (0.0%) |
| High School Diploma | 49 (45.8%) | 58 (54.2%) |
| College or Associate's Degree | 7 (13.7%) | 44 (86.3%) |
| Bachelor's Degree | 0 (0.0%) | 0 (0.0%) |
| Graduate Degree | 16 (100.0%) | 0 (0.0%) |
| Total | 72 (41.4%) | 102 (58.6%) |
Employment Characteristics in Russellville
Employment by Class of Employer in Russellville
Among the 4,754 employed individuals in Russellville, private company employees (3,755 | 79.0%), self-employed (not incorporated) (449 | 9.4%), and not-for-profit organizations (171 | 3.6%) make up the most common classes of employment.
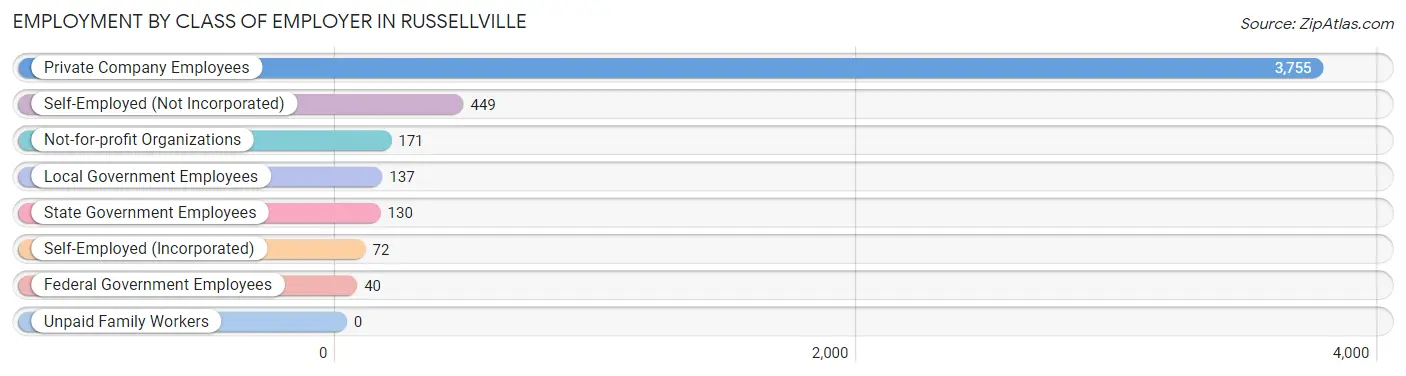
| Employer Class | # Employees | % Employees |
| Private Company Employees | 3,755 | 79.0% |
| Self-Employed (Incorporated) | 72 | 1.5% |
| Self-Employed (Not Incorporated) | 449 | 9.4% |
| Not-for-profit Organizations | 171 | 3.6% |
| Local Government Employees | 137 | 2.9% |
| State Government Employees | 130 | 2.7% |
| Federal Government Employees | 40 | 0.8% |
| Unpaid Family Workers | 0 | 0.0% |
| Total | 4,754 | 100.0% |
Employment Status by Age in Russellville
According to the labor force statistics for Russellville, out of the total population over 16 years of age (7,910), 62.4% or 4,936 individuals are in the labor force, with 3.5% or 173 of them unemployed. The age group with the highest labor force participation rate is 30 to 34 years, with 92.5% or 889 individuals in the labor force. Within the labor force, the 16 to 19 years age range has the highest percentage of unemployed individuals, with 19.8% or 93 of them being unemployed.
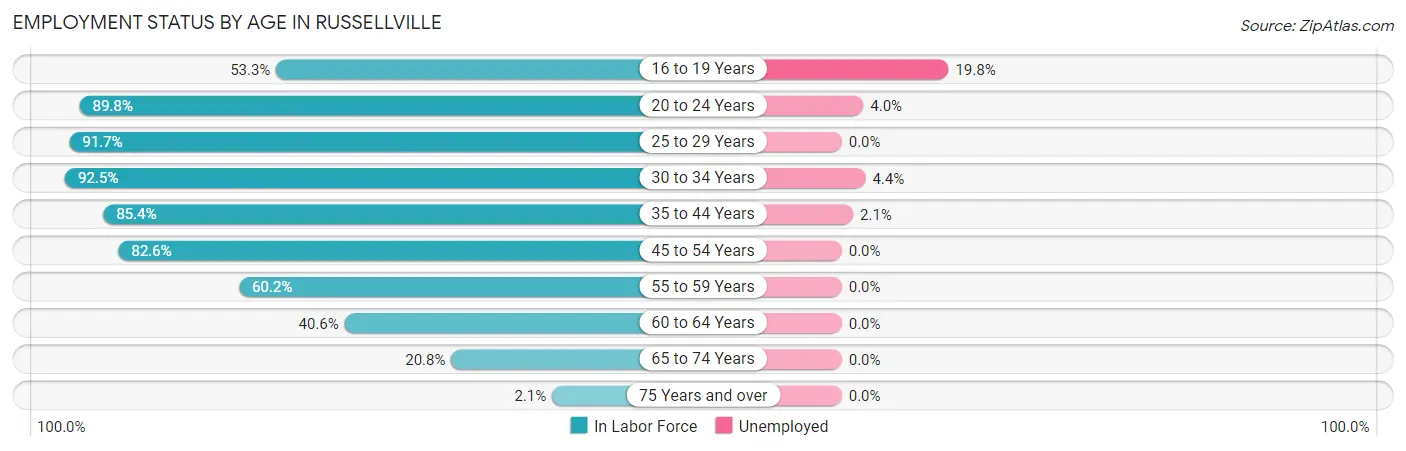
| Age Bracket | In Labor Force | Unemployed |
| 16 to 19 Years | 470 (53.3%) | 93 (19.8%) |
| 20 to 24 Years | 447 (89.8%) | 18 (4.0%) |
| 25 to 29 Years | 519 (91.7%) | 0 (0.0%) |
| 30 to 34 Years | 889 (92.5%) | 39 (4.4%) |
| 35 to 44 Years | 1,050 (85.4%) | 22 (2.1%) |
| 45 to 54 Years | 881 (82.6%) | 0 (0.0%) |
| 55 to 59 Years | 204 (60.2%) | 0 (0.0%) |
| 60 to 64 Years | 272 (40.6%) | 0 (0.0%) |
| 65 to 74 Years | 191 (20.8%) | 0 (0.0%) |
| 75 Years and over | 16 (2.1%) | 0 (0.0%) |
| Total | 4,936 (62.4%) | 173 (3.5%) |
Employment Status by Educational Attainment in Russellville
According to labor force statistics for Russellville, 78.9% of individuals (3,812) out of the total population between 25 and 64 years of age (4,832) are in the labor force, with 1.6% or 61 of them being unemployed. The group with the highest labor force participation rate are those with the educational attainment of bachelor's degree or higher, with 88.2% or 657 individuals in the labor force. Within the labor force, individuals with bachelor's degree or higher education have the highest percentage of unemployment, with 2.6% or 17 of them being unemployed.
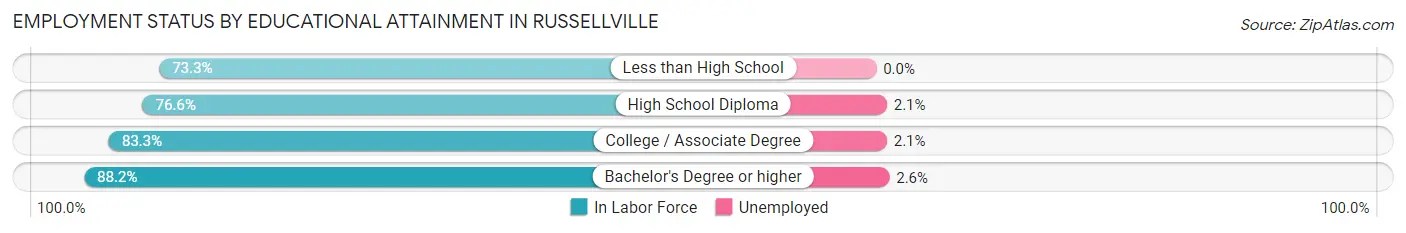
| Educational Attainment | In Labor Force | Unemployed |
| Less than High School | 1,083 (73.3%) | 0 (0.0%) |
| High School Diploma | 1,136 (76.6%) | 31 (2.1%) |
| College / Associate Degree | 938 (83.3%) | 24 (2.1%) |
| Bachelor's Degree or higher | 657 (88.2%) | 19 (2.6%) |
| Total | 3,812 (78.9%) | 77 (1.6%) |
Employment Occupations by Sex in Russellville
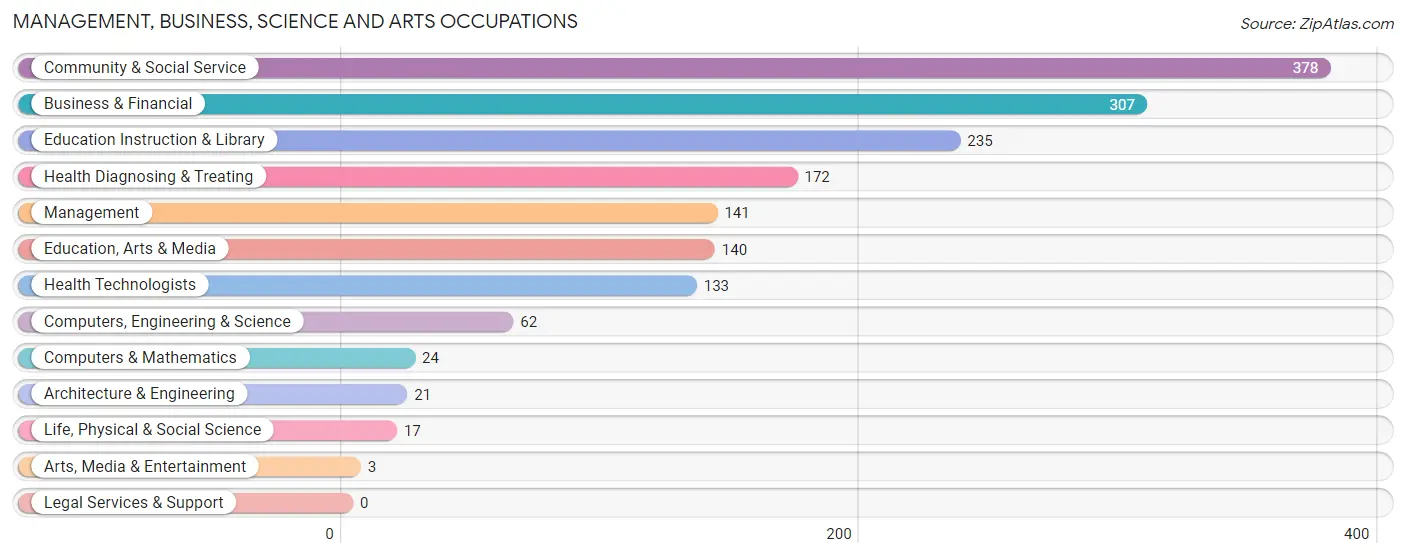
Management, Business, Science and Arts Occupations
The most common Management, Business, Science and Arts occupations in Russellville are Community & Social Service (378 | 7.9%), Business & Financial (307 | 6.4%), Education Instruction & Library (235 | 4.9%), Health Diagnosing & Treating (172 | 3.6%), and Management (141 | 3.0%).
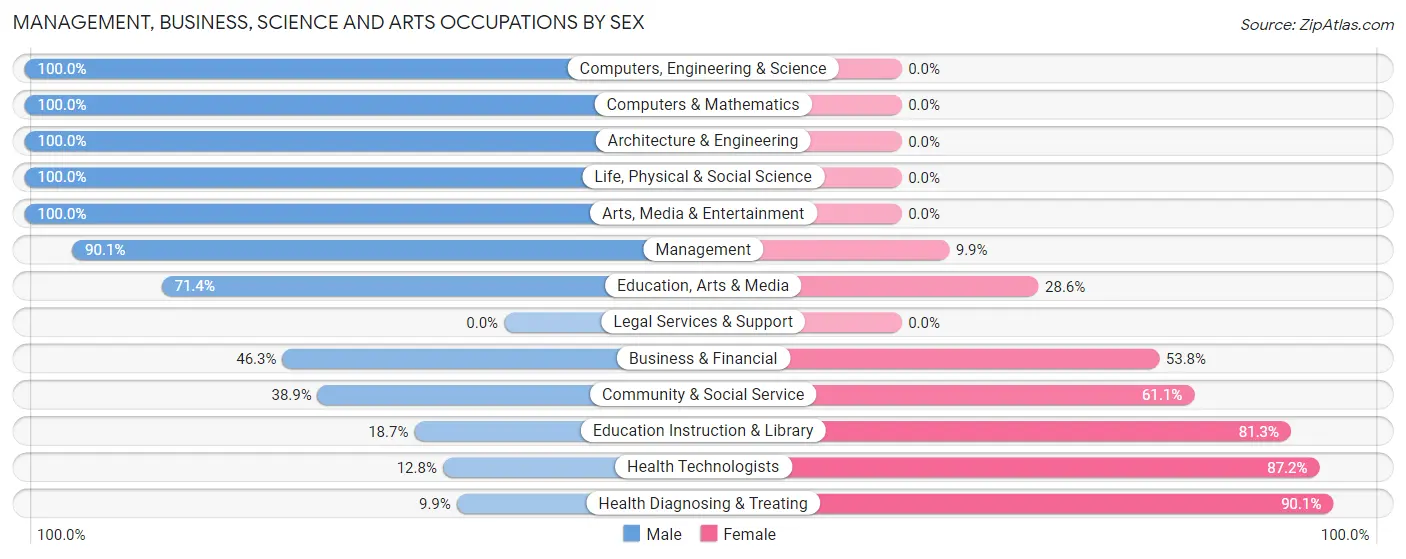
Management, Business, Science and Arts Occupations by Sex
Within the Management, Business, Science and Arts occupations in Russellville, the most male-oriented occupations are Computers, Engineering & Science (100.0%), Computers & Mathematics (100.0%), and Architecture & Engineering (100.0%), while the most female-oriented occupations are Health Diagnosing & Treating (90.1%), Health Technologists (87.2%), and Education Instruction & Library (81.3%).
| Occupation | Male | Female |
| Management | 127 (90.1%) | 14 (9.9%) |
| Business & Financial | 142 (46.3%) | 165 (53.7%) |
| Computers, Engineering & Science | 62 (100.0%) | 0 (0.0%) |
| Computers & Mathematics | 24 (100.0%) | 0 (0.0%) |
| Architecture & Engineering | 21 (100.0%) | 0 (0.0%) |
| Life, Physical & Social Science | 17 (100.0%) | 0 (0.0%) |
| Community & Social Service | 147 (38.9%) | 231 (61.1%) |
| Education, Arts & Media | 100 (71.4%) | 40 (28.6%) |
| Legal Services & Support | 0 (0.0%) | 0 (0.0%) |
| Education Instruction & Library | 44 (18.7%) | 191 (81.3%) |
| Arts, Media & Entertainment | 3 (100.0%) | 0 (0.0%) |
| Health Diagnosing & Treating | 17 (9.9%) | 155 (90.1%) |
| Health Technologists | 17 (12.8%) | 116 (87.2%) |
| Total (Category) | 495 (46.7%) | 565 (53.3%) |
| Total (Overall) | 2,652 (55.6%) | 2,114 (44.4%) |
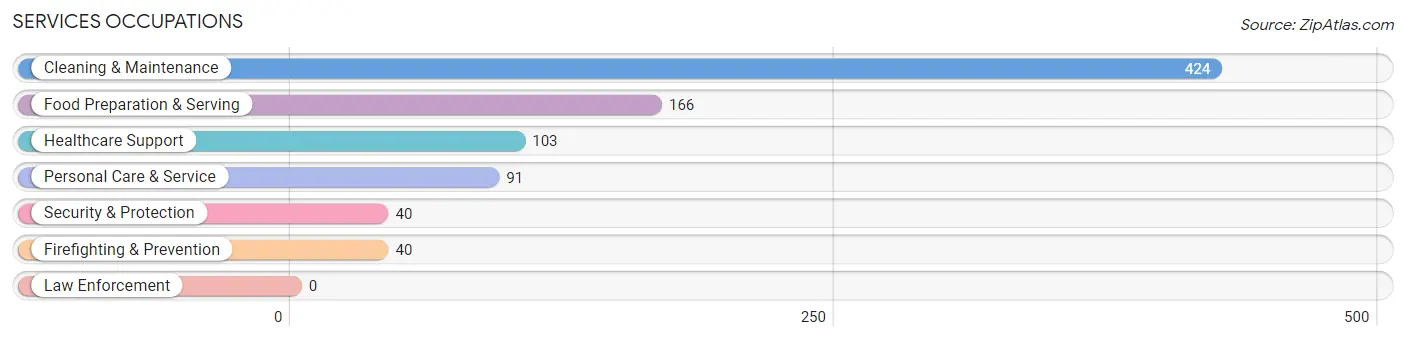
Services Occupations
The most common Services occupations in Russellville are Cleaning & Maintenance (424 | 8.9%), Food Preparation & Serving (166 | 3.5%), Healthcare Support (103 | 2.2%), Personal Care & Service (91 | 1.9%), and Security & Protection (40 | 0.8%).
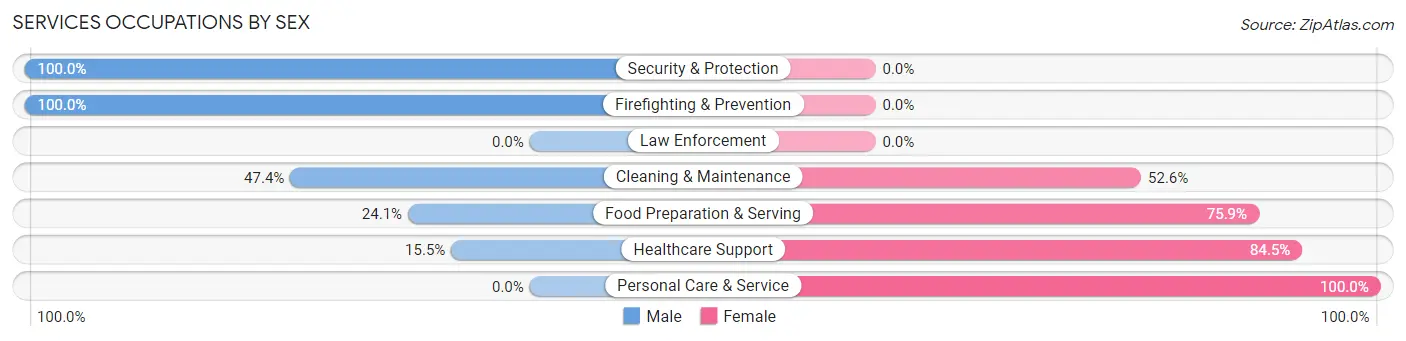
Services Occupations by Sex
Within the Services occupations in Russellville, the most male-oriented occupations are Security & Protection (100.0%), Firefighting & Prevention (100.0%), and Cleaning & Maintenance (47.4%), while the most female-oriented occupations are Personal Care & Service (100.0%), Healthcare Support (84.5%), and Food Preparation & Serving (75.9%).
| Occupation | Male | Female |
| Healthcare Support | 16 (15.5%) | 87 (84.5%) |
| Security & Protection | 40 (100.0%) | 0 (0.0%) |
| Firefighting & Prevention | 40 (100.0%) | 0 (0.0%) |
| Law Enforcement | 0 (0.0%) | 0 (0.0%) |
| Food Preparation & Serving | 40 (24.1%) | 126 (75.9%) |
| Cleaning & Maintenance | 201 (47.4%) | 223 (52.6%) |
| Personal Care & Service | 0 (0.0%) | 91 (100.0%) |
| Total (Category) | 297 (36.0%) | 527 (64.0%) |
| Total (Overall) | 2,652 (55.6%) | 2,114 (44.4%) |
Sales and Office Occupations
The most common Sales and Office occupations in Russellville are Office & Administration (324 | 6.8%), and Sales & Related (292 | 6.1%).

Sales and Office Occupations by Sex
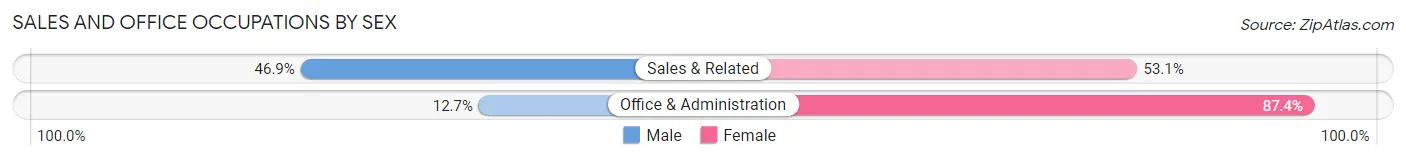
| Occupation | Male | Female |
| Sales & Related | 137 (46.9%) | 155 (53.1%) |
| Office & Administration | 41 (12.7%) | 283 (87.4%) |
| Total (Category) | 178 (28.9%) | 438 (71.1%) |
| Total (Overall) | 2,652 (55.6%) | 2,114 (44.4%) |
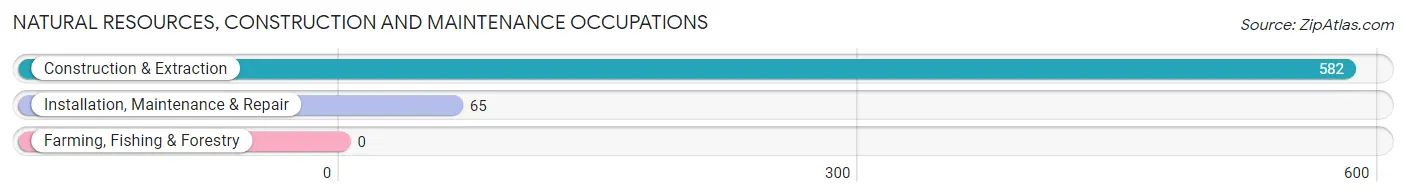
Natural Resources, Construction and Maintenance Occupations
The most common Natural Resources, Construction and Maintenance occupations in Russellville are Construction & Extraction (582 | 12.2%), and Installation, Maintenance & Repair (65 | 1.4%).
Natural Resources, Construction and Maintenance Occupations by Sex
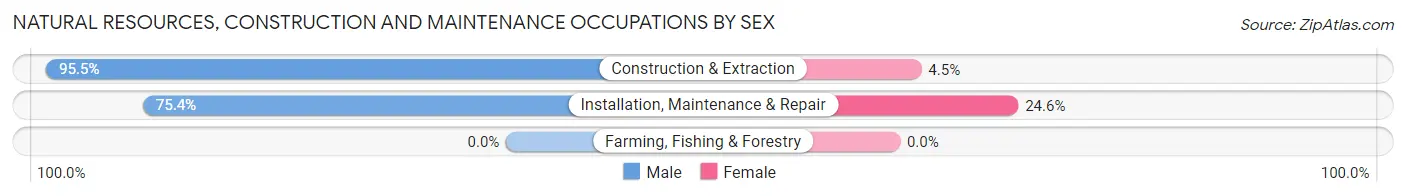
| Occupation | Male | Female |
| Farming, Fishing & Forestry | 0 (0.0%) | 0 (0.0%) |
| Construction & Extraction | 556 (95.5%) | 26 (4.5%) |
| Installation, Maintenance & Repair | 49 (75.4%) | 16 (24.6%) |
| Total (Category) | 605 (93.5%) | 42 (6.5%) |
| Total (Overall) | 2,652 (55.6%) | 2,114 (44.4%) |
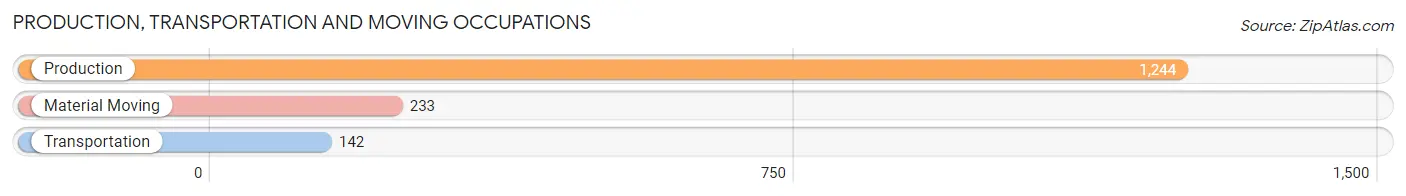
Production, Transportation and Moving Occupations
The most common Production, Transportation and Moving occupations in Russellville are Production (1,244 | 26.1%), Material Moving (233 | 4.9%), and Transportation (142 | 3.0%).
Production, Transportation and Moving Occupations by Sex
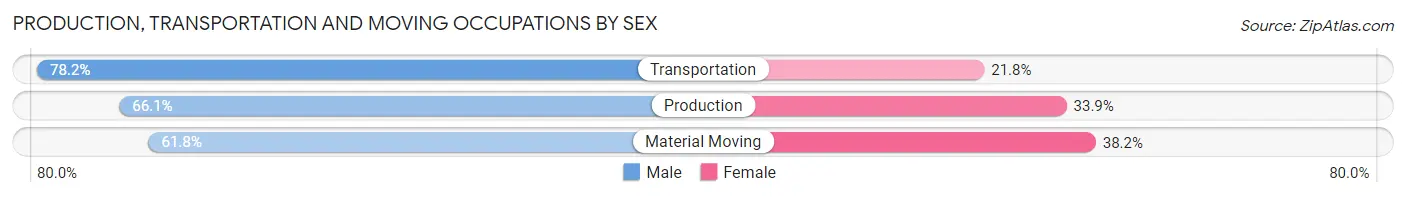
| Occupation | Male | Female |
| Production | 822 (66.1%) | 422 (33.9%) |
| Transportation | 111 (78.2%) | 31 (21.8%) |
| Material Moving | 144 (61.8%) | 89 (38.2%) |
| Total (Category) | 1,077 (66.5%) | 542 (33.5%) |
| Total (Overall) | 2,652 (55.6%) | 2,114 (44.4%) |
Employment Industries by Sex in Russellville
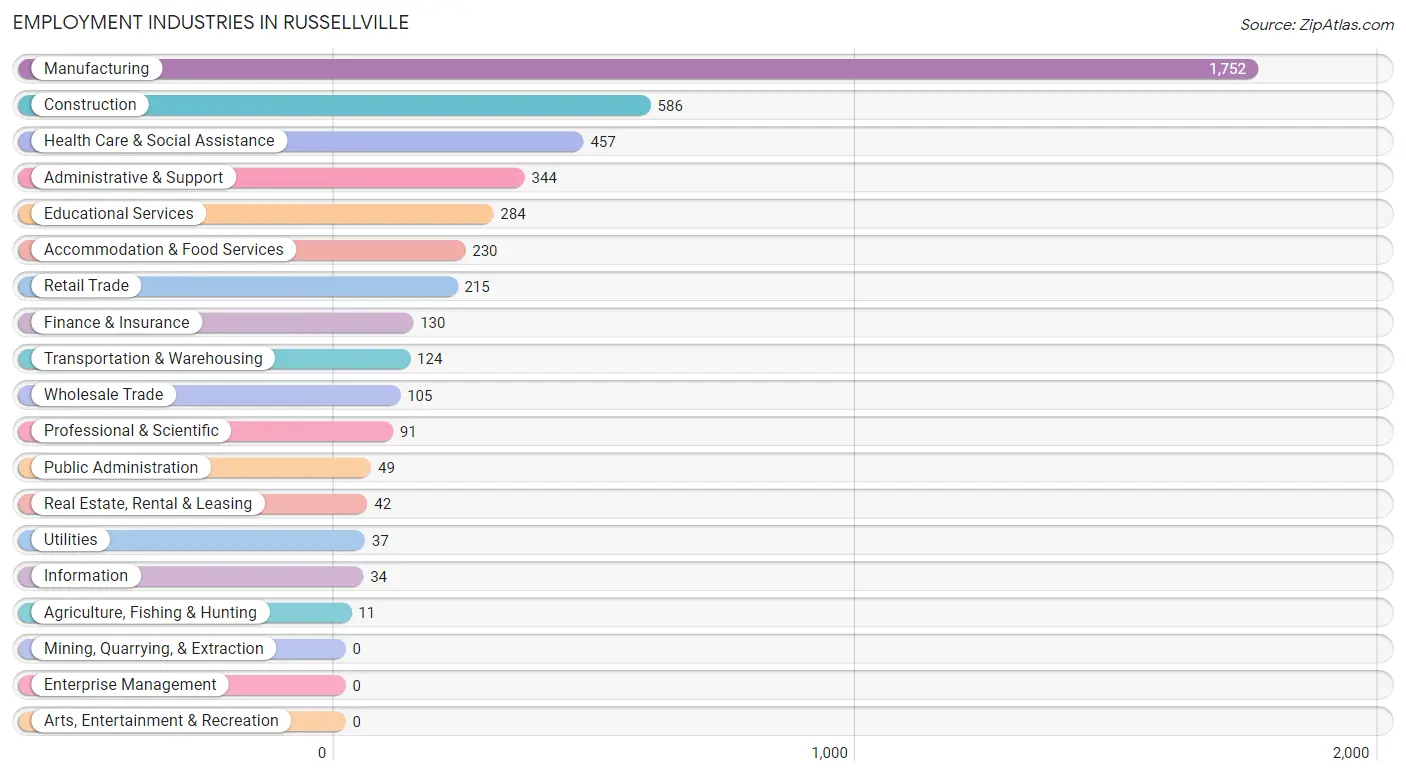
Employment Industries in Russellville
The major employment industries in Russellville include Manufacturing (1,752 | 36.8%), Construction (586 | 12.3%), Health Care & Social Assistance (457 | 9.6%), Administrative & Support (344 | 7.2%), and Educational Services (284 | 6.0%).
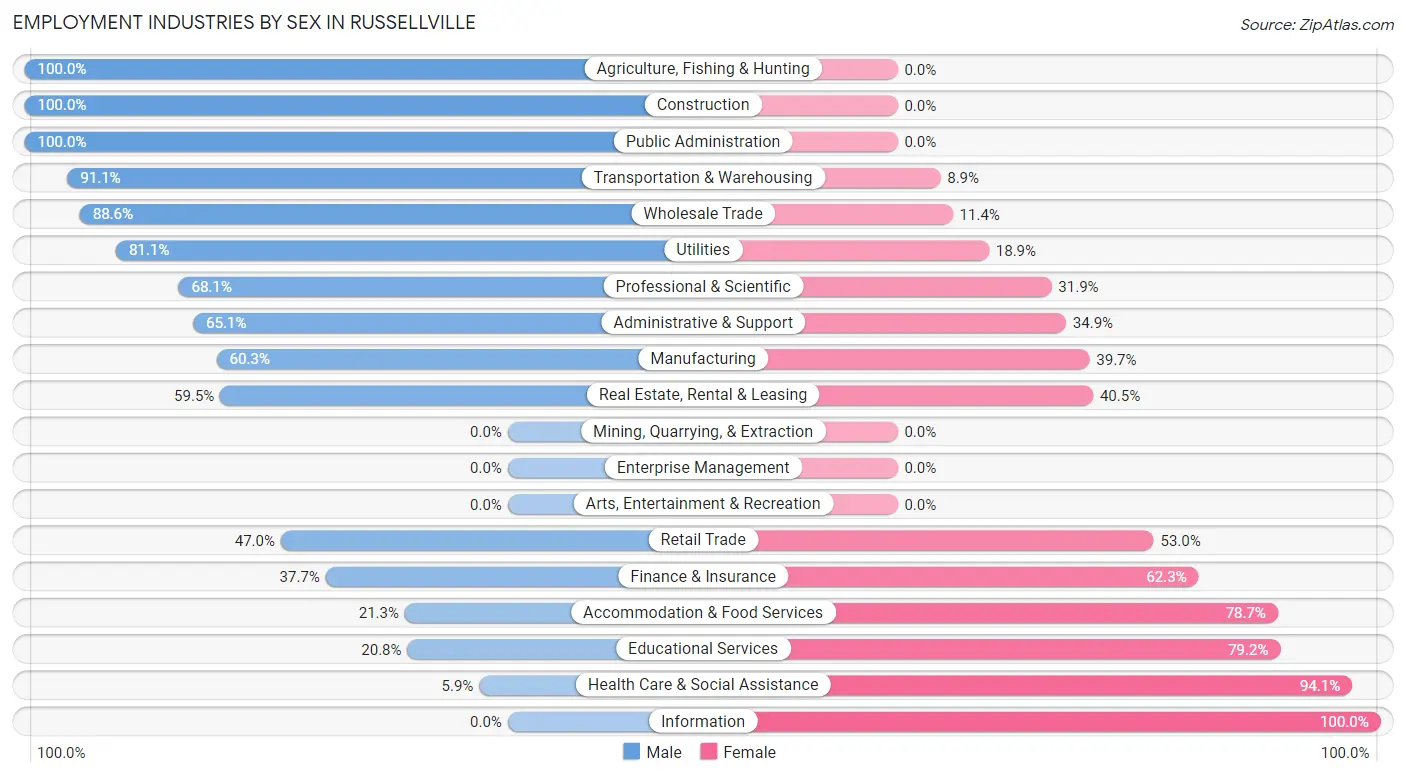
Employment Industries by Sex in Russellville
The Russellville industries that see more men than women are Agriculture, Fishing & Hunting (100.0%), Construction (100.0%), and Public Administration (100.0%), whereas the industries that tend to have a higher number of women are Information (100.0%), Health Care & Social Assistance (94.1%), and Educational Services (79.2%).
| Industry | Male | Female |
| Agriculture, Fishing & Hunting | 11 (100.0%) | 0 (0.0%) |
| Mining, Quarrying, & Extraction | 0 (0.0%) | 0 (0.0%) |
| Construction | 586 (100.0%) | 0 (0.0%) |
| Manufacturing | 1,056 (60.3%) | 696 (39.7%) |
| Wholesale Trade | 93 (88.6%) | 12 (11.4%) |
| Retail Trade | 101 (47.0%) | 114 (53.0%) |
| Transportation & Warehousing | 113 (91.1%) | 11 (8.9%) |
| Utilities | 30 (81.1%) | 7 (18.9%) |
| Information | 0 (0.0%) | 34 (100.0%) |
| Finance & Insurance | 49 (37.7%) | 81 (62.3%) |
| Real Estate, Rental & Leasing | 25 (59.5%) | 17 (40.5%) |
| Professional & Scientific | 62 (68.1%) | 29 (31.9%) |
| Enterprise Management | 0 (0.0%) | 0 (0.0%) |
| Administrative & Support | 224 (65.1%) | 120 (34.9%) |
| Educational Services | 59 (20.8%) | 225 (79.2%) |
| Health Care & Social Assistance | 27 (5.9%) | 430 (94.1%) |
| Arts, Entertainment & Recreation | 0 (0.0%) | 0 (0.0%) |
| Accommodation & Food Services | 49 (21.3%) | 181 (78.7%) |
| Public Administration | 49 (100.0%) | 0 (0.0%) |
| Total | 2,652 (55.6%) | 2,114 (44.4%) |
Education in Russellville
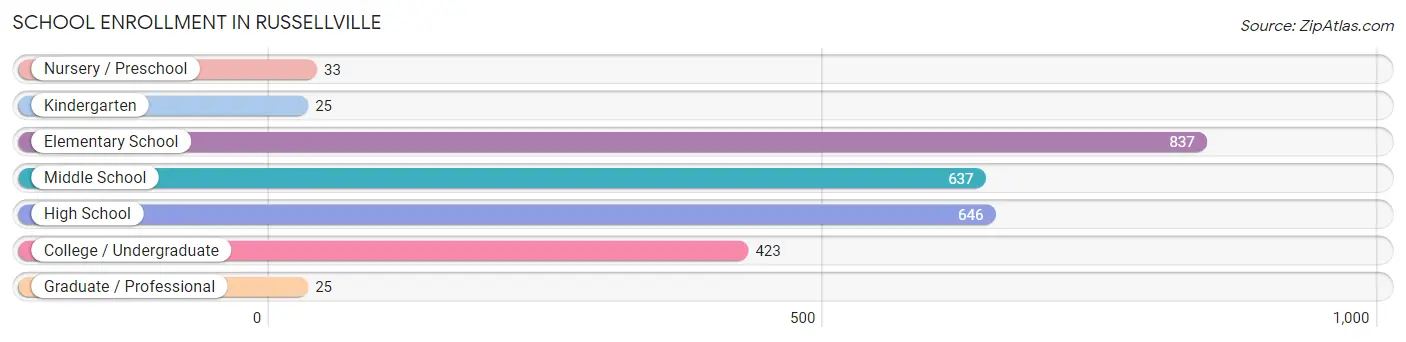
School Enrollment in Russellville
The most common levels of schooling among the 2,626 students in Russellville are elementary school (837 | 31.9%), high school (646 | 24.6%), and middle school (637 | 24.3%).
| School Level | # Students | % Students |
| Nursery / Preschool | 33 | 1.3% |
| Kindergarten | 25 | 0.9% |
| Elementary School | 837 | 31.9% |
| Middle School | 637 | 24.3% |
| High School | 646 | 24.6% |
| College / Undergraduate | 423 | 16.1% |
| Graduate / Professional | 25 | 0.9% |
| Total | 2,626 | 100.0% |
School Enrollment by Age by Funding Source in Russellville
Out of a total of 2,626 students who are enrolled in schools in Russellville, 189 (7.2%) attend a private institution, while the remaining 2,437 (92.8%) are enrolled in public schools. The age group of 20 to 24 year olds has the highest likelihood of being enrolled in private schools, with 75 (58.1% in the age bracket) enrolled. Conversely, the age group of 10 to 14 year olds has the lowest likelihood of being enrolled in a private school, with 961 (100.0% in the age bracket) attending a public institution.
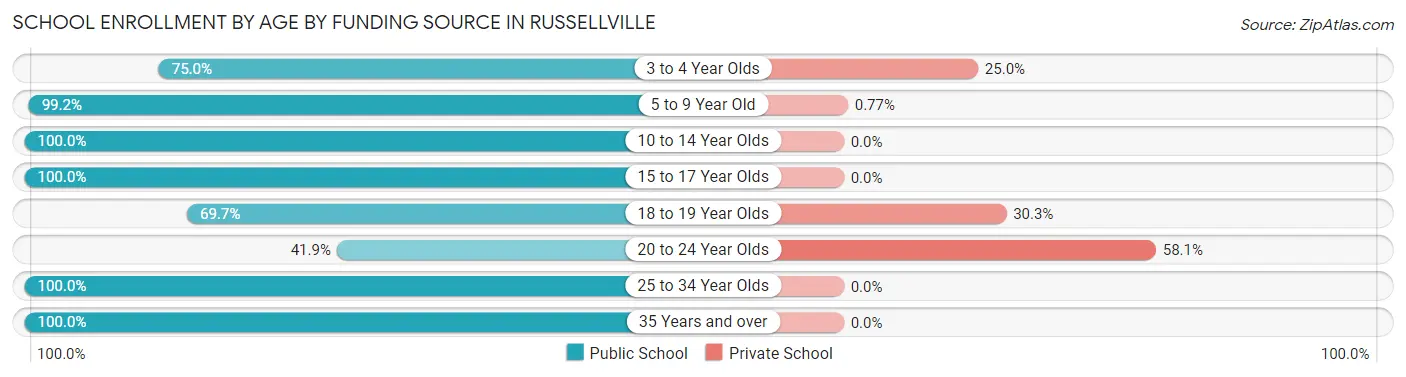
| Age Bracket | Public School | Private School |
| 3 to 4 Year Olds | 21 (75.0%) | 7 (25.0%) |
| 5 to 9 Year Old | 647 (99.2%) | 5 (0.8%) |
| 10 to 14 Year Olds | 961 (100.0%) | 0 (0.0%) |
| 15 to 17 Year Olds | 378 (100.0%) | 0 (0.0%) |
| 18 to 19 Year Olds | 235 (69.7%) | 102 (30.3%) |
| 20 to 24 Year Olds | 54 (41.9%) | 75 (58.1%) |
| 25 to 34 Year Olds | 75 (100.0%) | 0 (0.0%) |
| 35 Years and over | 66 (100.0%) | 0 (0.0%) |
| Total | 2,437 (92.8%) | 189 (7.2%) |
Educational Attainment by Field of Study in Russellville
Literature & languages (244 | 25.4%), education (221 | 23.0%), science & technology (138 | 14.4%), business (101 | 10.5%), and visual & performing arts (72 | 7.5%) are the most common fields of study among 961 individuals in Russellville who have obtained a bachelor's degree or higher.
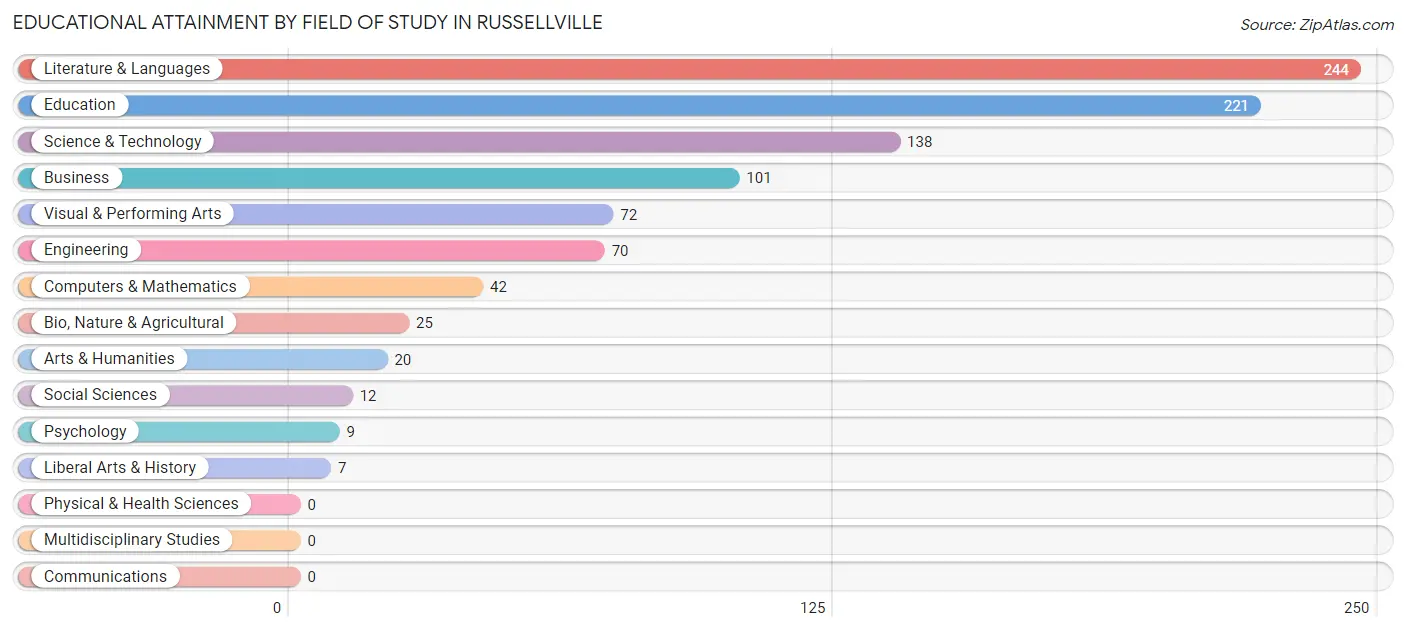
| Field of Study | # Graduates | % Graduates |
| Computers & Mathematics | 42 | 4.4% |
| Bio, Nature & Agricultural | 25 | 2.6% |
| Physical & Health Sciences | 0 | 0.0% |
| Psychology | 9 | 0.9% |
| Social Sciences | 12 | 1.3% |
| Engineering | 70 | 7.3% |
| Multidisciplinary Studies | 0 | 0.0% |
| Science & Technology | 138 | 14.4% |
| Business | 101 | 10.5% |
| Education | 221 | 23.0% |
| Literature & Languages | 244 | 25.4% |
| Liberal Arts & History | 7 | 0.7% |
| Visual & Performing Arts | 72 | 7.5% |
| Communications | 0 | 0.0% |
| Arts & Humanities | 20 | 2.1% |
| Total | 961 | 100.0% |
Transportation & Commute in Russellville
Vehicle Availability by Sex in Russellville
The most prevalent vehicle ownership categories in Russellville are males with 2 vehicles (1,028, accounting for 38.9%) and females with 2 vehicles (742, making up 48.6%).
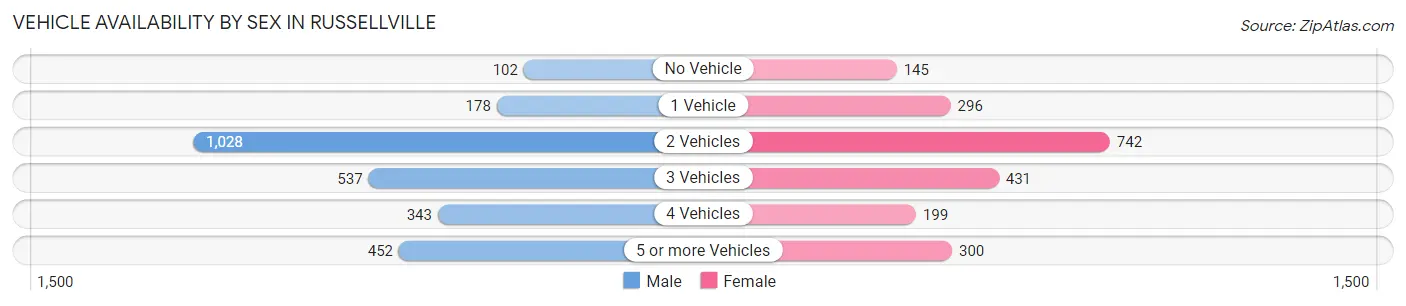
| Vehicles Available | Male | Female |
| No Vehicle | 102 (3.9%) | 145 (6.9%) |
| 1 Vehicle | 178 (6.7%) | 296 (14.0%) |
| 2 Vehicles | 1,028 (38.9%) | 742 (35.1%) |
| 3 Vehicles | 537 (20.3%) | 431 (20.4%) |
| 4 Vehicles | 343 (13.0%) | 199 (9.4%) |
| 5 or more Vehicles | 452 (17.1%) | 300 (14.2%) |
| Total | 2,640 (100.0%) | 2,113 (100.0%) |
Commute Time in Russellville
The most frequently occuring commute durations in Russellville are 10 to 14 minutes (1,240 commuters, 26.6%), 15 to 19 minutes (679 commuters, 14.6%), and 20 to 24 minutes (616 commuters, 13.2%).
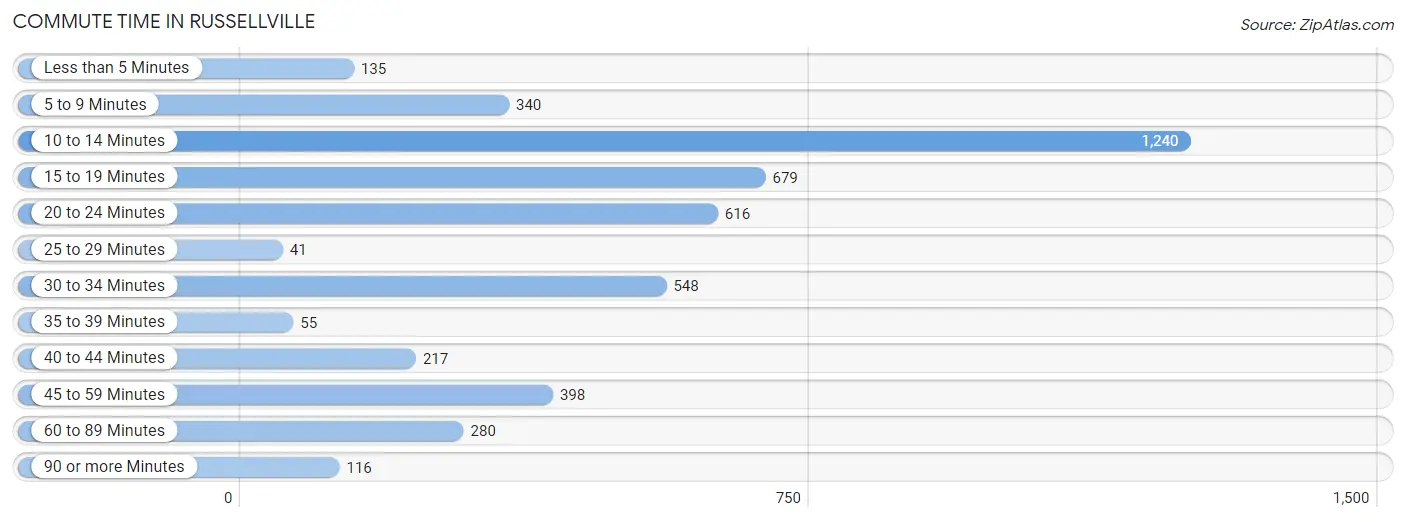
| Commute Time | # Commuters | % Commuters |
| Less than 5 Minutes | 135 | 2.9% |
| 5 to 9 Minutes | 340 | 7.3% |
| 10 to 14 Minutes | 1,240 | 26.6% |
| 15 to 19 Minutes | 679 | 14.6% |
| 20 to 24 Minutes | 616 | 13.2% |
| 25 to 29 Minutes | 41 | 0.9% |
| 30 to 34 Minutes | 548 | 11.7% |
| 35 to 39 Minutes | 55 | 1.2% |
| 40 to 44 Minutes | 217 | 4.6% |
| 45 to 59 Minutes | 398 | 8.5% |
| 60 to 89 Minutes | 280 | 6.0% |
| 90 or more Minutes | 116 | 2.5% |
Commute Time by Sex in Russellville
The most common commute times in Russellville are 10 to 14 minutes (742 commuters, 28.7%) for males and 10 to 14 minutes (498 commuters, 23.9%) for females.
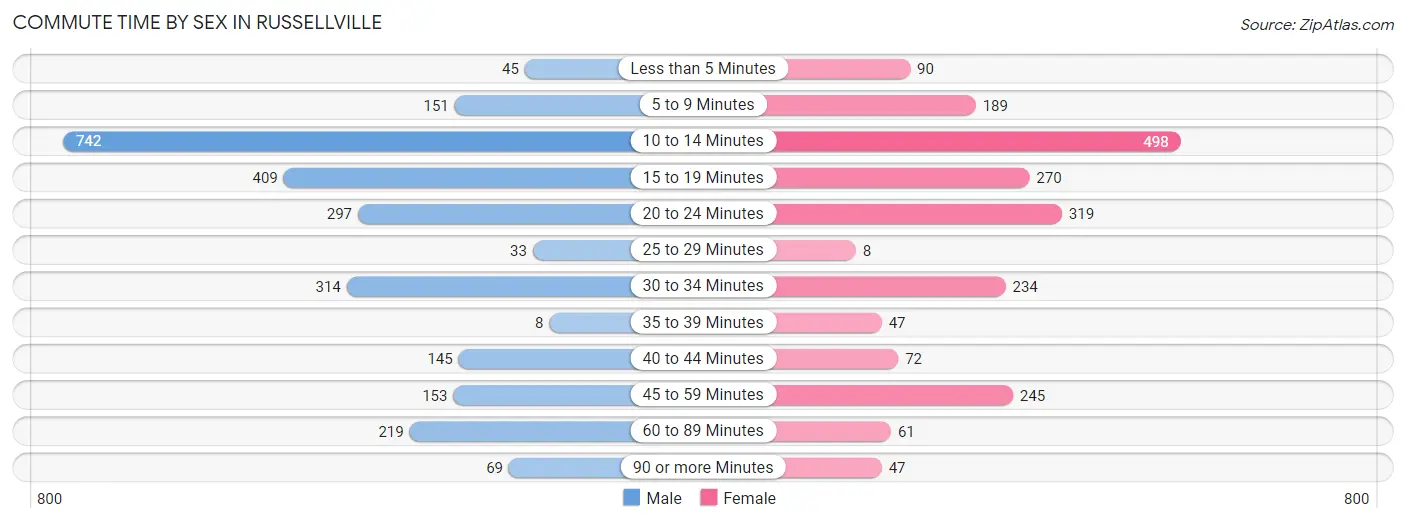
| Commute Time | Male | Female |
| Less than 5 Minutes | 45 (1.7%) | 90 (4.3%) |
| 5 to 9 Minutes | 151 (5.8%) | 189 (9.1%) |
| 10 to 14 Minutes | 742 (28.7%) | 498 (23.9%) |
| 15 to 19 Minutes | 409 (15.8%) | 270 (13.0%) |
| 20 to 24 Minutes | 297 (11.5%) | 319 (15.3%) |
| 25 to 29 Minutes | 33 (1.3%) | 8 (0.4%) |
| 30 to 34 Minutes | 314 (12.1%) | 234 (11.3%) |
| 35 to 39 Minutes | 8 (0.3%) | 47 (2.3%) |
| 40 to 44 Minutes | 145 (5.6%) | 72 (3.5%) |
| 45 to 59 Minutes | 153 (5.9%) | 245 (11.8%) |
| 60 to 89 Minutes | 219 (8.5%) | 61 (2.9%) |
| 90 or more Minutes | 69 (2.7%) | 47 (2.3%) |
Time of Departure to Work by Sex in Russellville
The most frequent times of departure to work in Russellville are 6:30 AM to 6:59 AM (523, 20.2%) for males and 7:00 AM to 7:29 AM (465, 22.4%) for females.
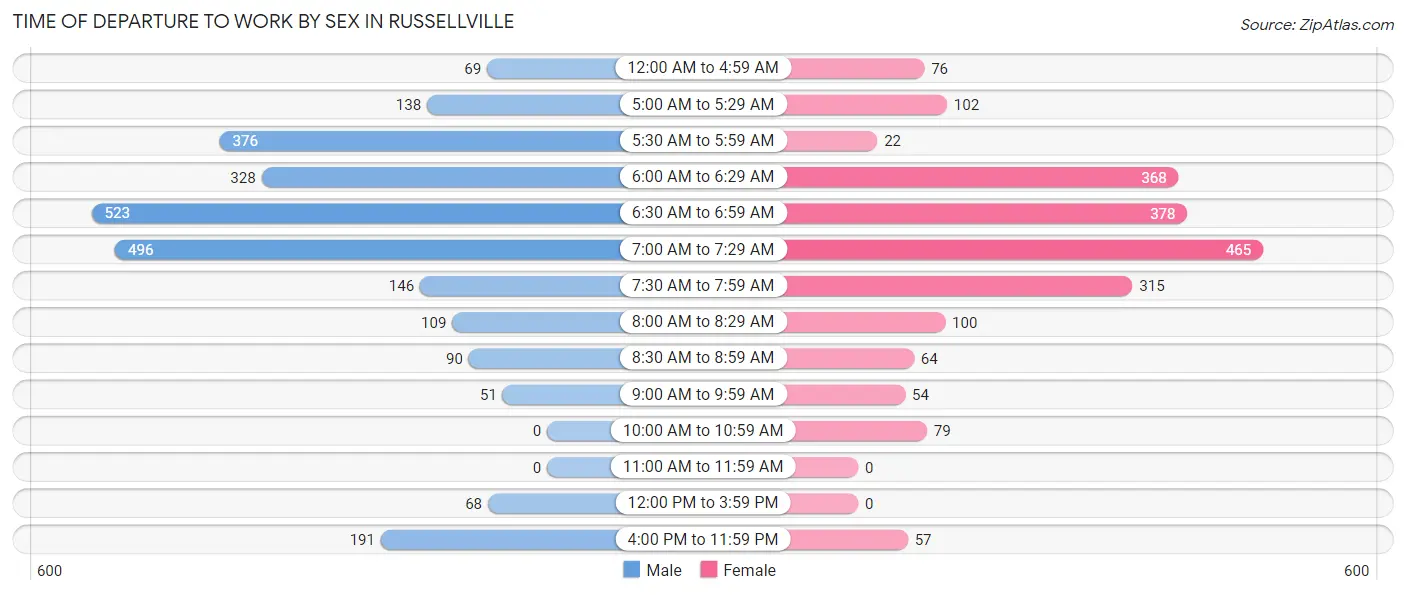
| Time of Departure | Male | Female |
| 12:00 AM to 4:59 AM | 69 (2.7%) | 76 (3.6%) |
| 5:00 AM to 5:29 AM | 138 (5.3%) | 102 (4.9%) |
| 5:30 AM to 5:59 AM | 376 (14.5%) | 22 (1.1%) |
| 6:00 AM to 6:29 AM | 328 (12.7%) | 368 (17.7%) |
| 6:30 AM to 6:59 AM | 523 (20.2%) | 378 (18.2%) |
| 7:00 AM to 7:29 AM | 496 (19.2%) | 465 (22.4%) |
| 7:30 AM to 7:59 AM | 146 (5.7%) | 315 (15.1%) |
| 8:00 AM to 8:29 AM | 109 (4.2%) | 100 (4.8%) |
| 8:30 AM to 8:59 AM | 90 (3.5%) | 64 (3.1%) |
| 9:00 AM to 9:59 AM | 51 (2.0%) | 54 (2.6%) |
| 10:00 AM to 10:59 AM | 0 (0.0%) | 79 (3.8%) |
| 11:00 AM to 11:59 AM | 0 (0.0%) | 0 (0.0%) |
| 12:00 PM to 3:59 PM | 68 (2.6%) | 0 (0.0%) |
| 4:00 PM to 11:59 PM | 191 (7.4%) | 57 (2.7%) |
| Total | 2,585 (100.0%) | 2,080 (100.0%) |
Housing Occupancy in Russellville
Occupancy by Ownership in Russellville
Of the total 3,493 dwellings in Russellville, owner-occupied units account for 2,262 (64.8%), while renter-occupied units make up 1,231 (35.2%).
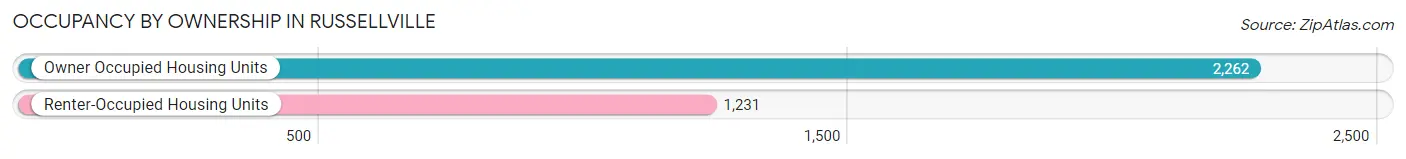
| Occupancy | # Housing Units | % Housing Units |
| Owner Occupied Housing Units | 2,262 | 64.8% |
| Renter-Occupied Housing Units | 1,231 | 35.2% |
| Total Occupied Housing Units | 3,493 | 100.0% |
Occupancy by Household Size in Russellville
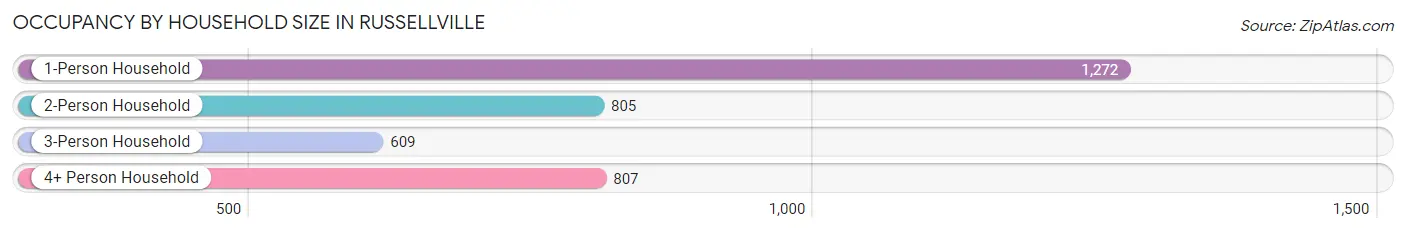
| Household Size | # Housing Units | % Housing Units |
| 1-Person Household | 1,272 | 36.4% |
| 2-Person Household | 805 | 23.1% |
| 3-Person Household | 609 | 17.4% |
| 4+ Person Household | 807 | 23.1% |
| Total Housing Units | 3,493 | 100.0% |
Occupancy by Ownership by Household Size in Russellville
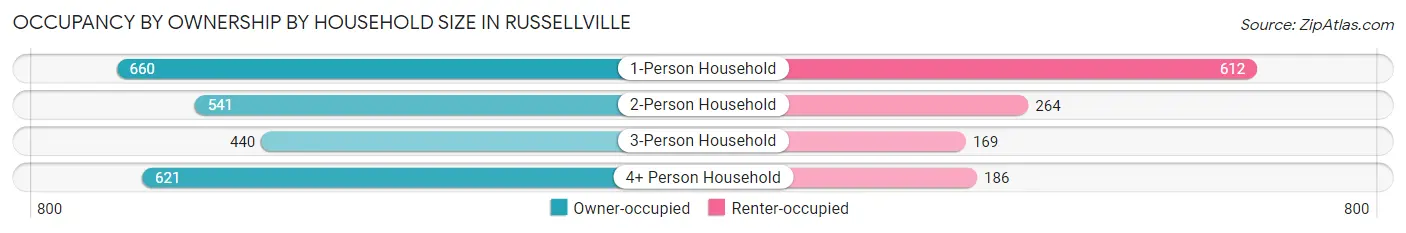
| Household Size | Owner-occupied | Renter-occupied |
| 1-Person Household | 660 (51.9%) | 612 (48.1%) |
| 2-Person Household | 541 (67.2%) | 264 (32.8%) |
| 3-Person Household | 440 (72.3%) | 169 (27.8%) |
| 4+ Person Household | 621 (76.9%) | 186 (23.1%) |
| Total Housing Units | 2,262 (64.8%) | 1,231 (35.2%) |
Occupancy by Educational Attainment in Russellville
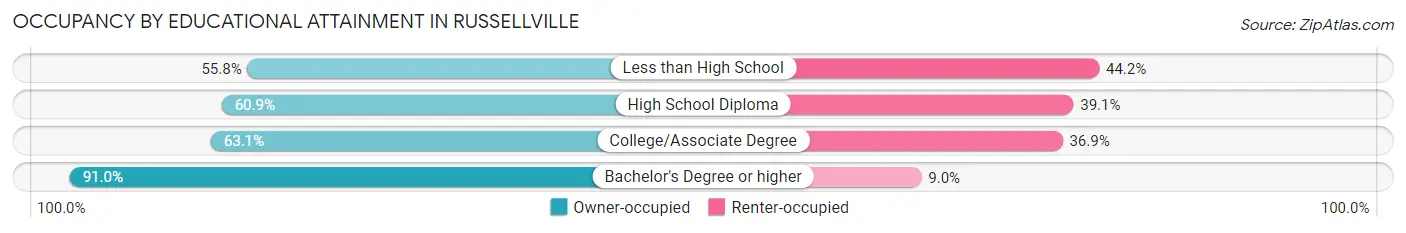
| Household Size | Owner-occupied | Renter-occupied |
| Less than High School | 490 (55.8%) | 388 (44.2%) |
| High School Diploma | 765 (60.9%) | 491 (39.1%) |
| College/Associate Degree | 519 (63.1%) | 304 (36.9%) |
| Bachelor's Degree or higher | 488 (91.0%) | 48 (9.0%) |
Occupancy by Age of Householder in Russellville
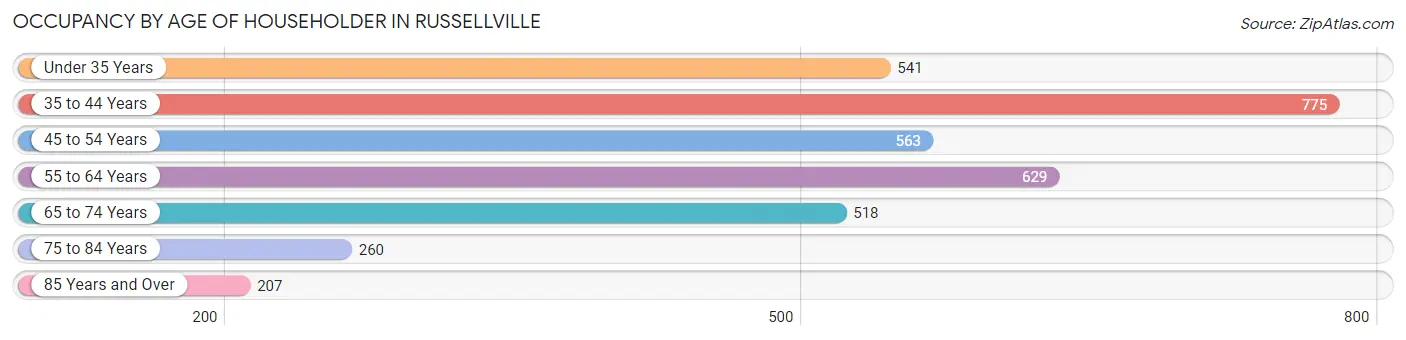
| Age Bracket | # Households | % Households |
| Under 35 Years | 541 | 15.5% |
| 35 to 44 Years | 775 | 22.2% |
| 45 to 54 Years | 563 | 16.1% |
| 55 to 64 Years | 629 | 18.0% |
| 65 to 74 Years | 518 | 14.8% |
| 75 to 84 Years | 260 | 7.4% |
| 85 Years and Over | 207 | 5.9% |
| Total | 3,493 | 100.0% |
Housing Finances in Russellville
Median Income by Occupancy in Russellville
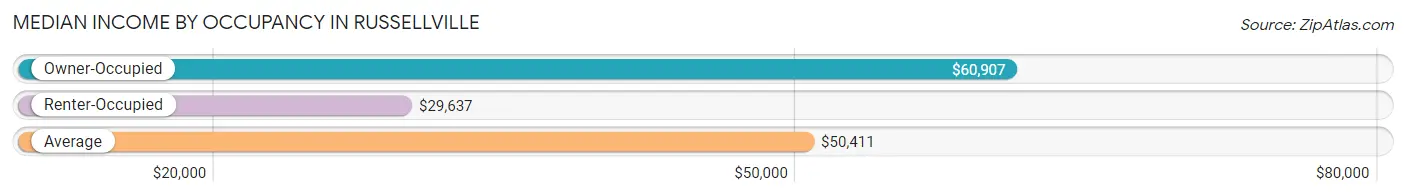
| Occupancy Type | # Households | Median Income |
| Owner-Occupied | 2,262 (64.8%) | $60,907 |
| Renter-Occupied | 1,231 (35.2%) | $29,637 |
| Average | 3,493 (100.0%) | $50,411 |
Occupancy by Householder Income Bracket in Russellville
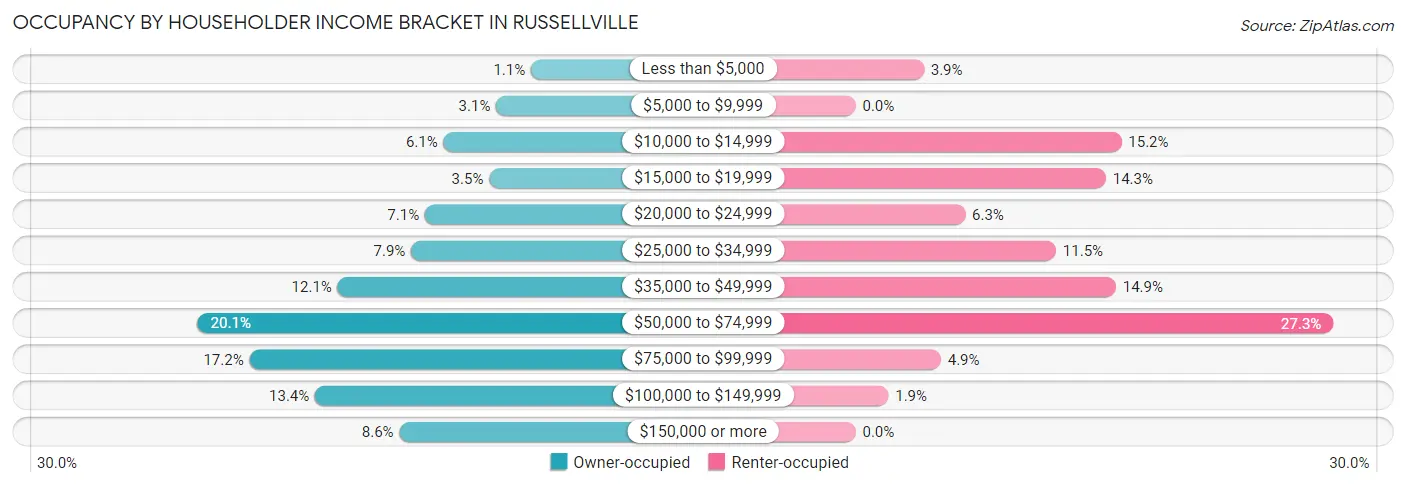
| Income Bracket | Owner-occupied | Renter-occupied |
| Less than $5,000 | 24 (1.1%) | 48 (3.9%) |
| $5,000 to $9,999 | 69 (3.0%) | 0 (0.0%) |
| $10,000 to $14,999 | 137 (6.1%) | 187 (15.2%) |
| $15,000 to $19,999 | 78 (3.5%) | 176 (14.3%) |
| $20,000 to $24,999 | 161 (7.1%) | 77 (6.3%) |
| $25,000 to $34,999 | 179 (7.9%) | 141 (11.5%) |
| $35,000 to $49,999 | 274 (12.1%) | 183 (14.9%) |
| $50,000 to $74,999 | 455 (20.1%) | 336 (27.3%) |
| $75,000 to $99,999 | 388 (17.2%) | 60 (4.9%) |
| $100,000 to $149,999 | 303 (13.4%) | 23 (1.9%) |
| $150,000 or more | 194 (8.6%) | 0 (0.0%) |
| Total | 2,262 (100.0%) | 1,231 (100.0%) |
Monthly Housing Cost Tiers in Russellville
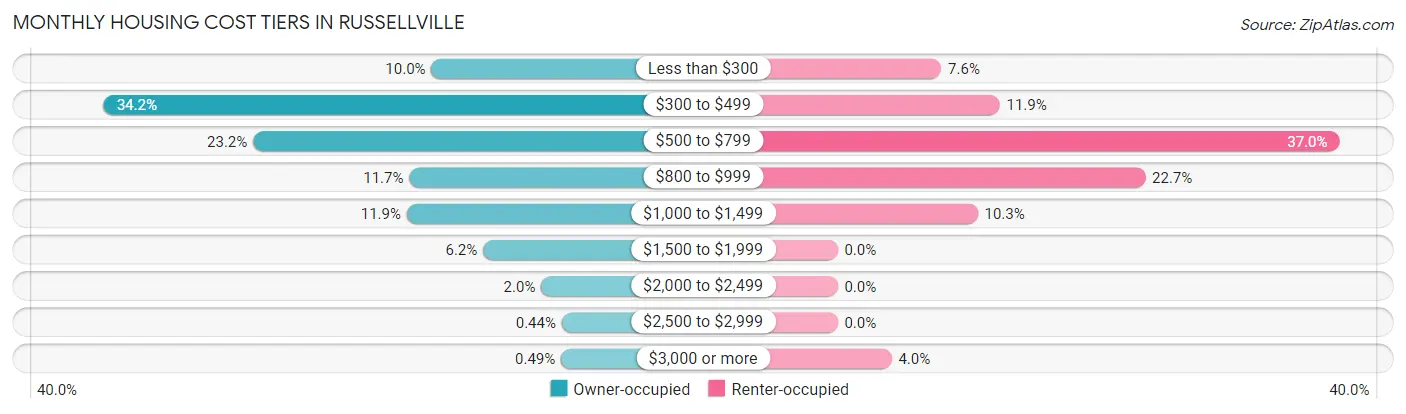
| Monthly Cost | Owner-occupied | Renter-occupied |
| Less than $300 | 227 (10.0%) | 94 (7.6%) |
| $300 to $499 | 773 (34.2%) | 147 (11.9%) |
| $500 to $799 | 524 (23.2%) | 455 (37.0%) |
| $800 to $999 | 264 (11.7%) | 279 (22.7%) |
| $1,000 to $1,499 | 268 (11.8%) | 127 (10.3%) |
| $1,500 to $1,999 | 141 (6.2%) | 0 (0.0%) |
| $2,000 to $2,499 | 44 (1.9%) | 0 (0.0%) |
| $2,500 to $2,999 | 10 (0.4%) | 0 (0.0%) |
| $3,000 or more | 11 (0.5%) | 49 (4.0%) |
| Total | 2,262 (100.0%) | 1,231 (100.0%) |
Physical Housing Characteristics in Russellville
Housing Structures in Russellville
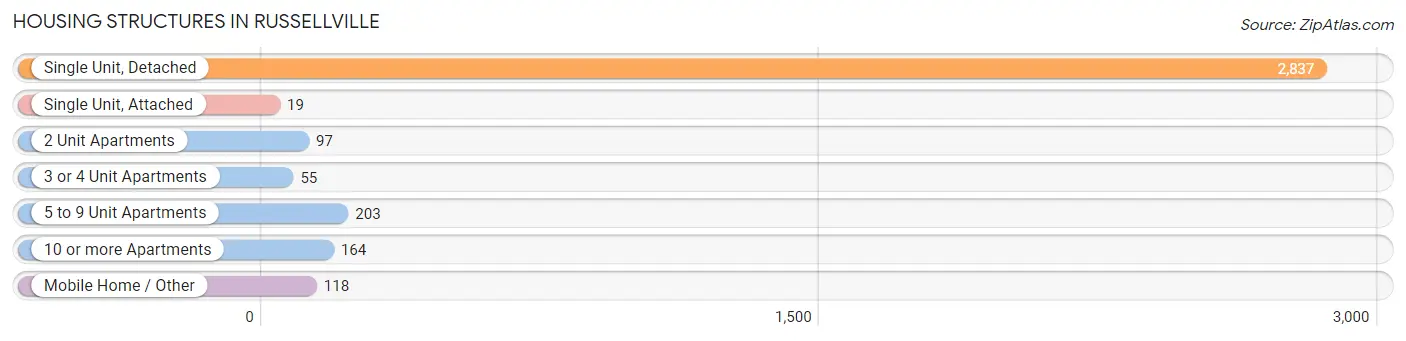
| Structure Type | # Housing Units | % Housing Units |
| Single Unit, Detached | 2,837 | 81.2% |
| Single Unit, Attached | 19 | 0.5% |
| 2 Unit Apartments | 97 | 2.8% |
| 3 or 4 Unit Apartments | 55 | 1.6% |
| 5 to 9 Unit Apartments | 203 | 5.8% |
| 10 or more Apartments | 164 | 4.7% |
| Mobile Home / Other | 118 | 3.4% |
| Total | 3,493 | 100.0% |
Housing Structures by Occupancy in Russellville
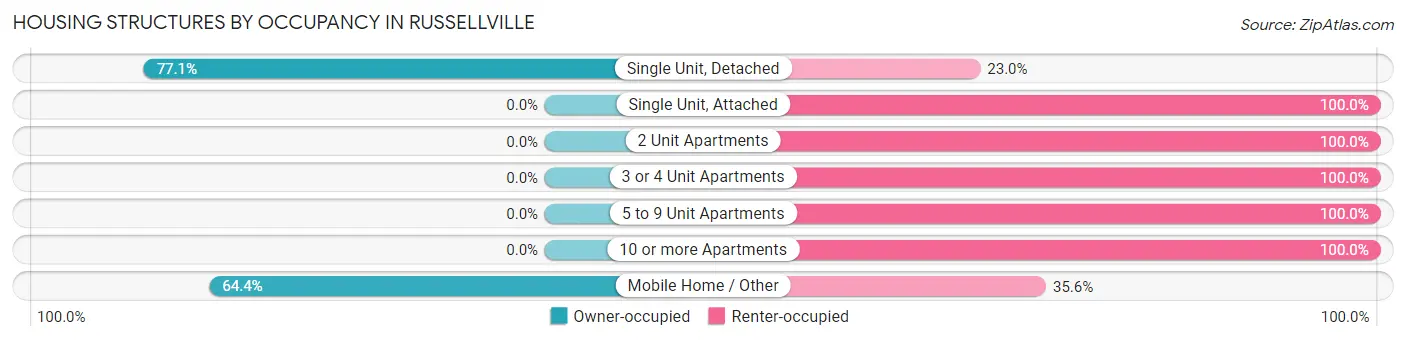
| Structure Type | Owner-occupied | Renter-occupied |
| Single Unit, Detached | 2,186 (77.0%) | 651 (23.0%) |
| Single Unit, Attached | 0 (0.0%) | 19 (100.0%) |
| 2 Unit Apartments | 0 (0.0%) | 97 (100.0%) |
| 3 or 4 Unit Apartments | 0 (0.0%) | 55 (100.0%) |
| 5 to 9 Unit Apartments | 0 (0.0%) | 203 (100.0%) |
| 10 or more Apartments | 0 (0.0%) | 164 (100.0%) |
| Mobile Home / Other | 76 (64.4%) | 42 (35.6%) |
| Total | 2,262 (64.8%) | 1,231 (35.2%) |
Housing Structures by Number of Rooms in Russellville
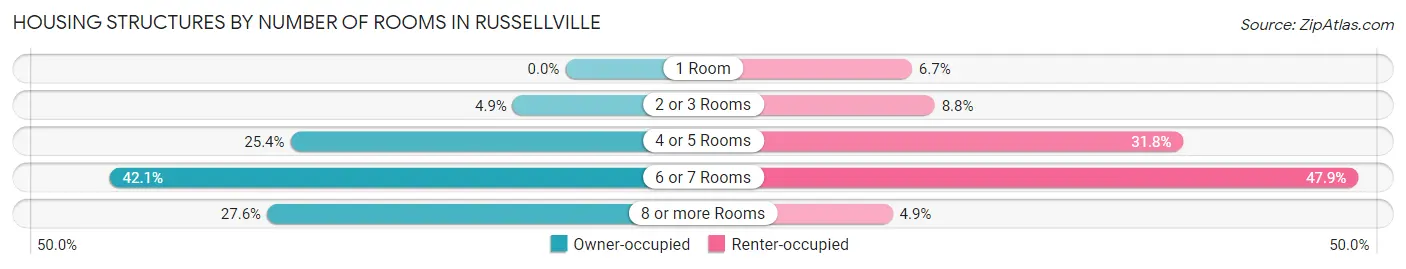
| Number of Rooms | Owner-occupied | Renter-occupied |
| 1 Room | 0 (0.0%) | 82 (6.7%) |
| 2 or 3 Rooms | 110 (4.9%) | 108 (8.8%) |
| 4 or 5 Rooms | 575 (25.4%) | 391 (31.8%) |
| 6 or 7 Rooms | 953 (42.1%) | 590 (47.9%) |
| 8 or more Rooms | 624 (27.6%) | 60 (4.9%) |
| Total | 2,262 (100.0%) | 1,231 (100.0%) |
Housing Structure by Heating Type in Russellville
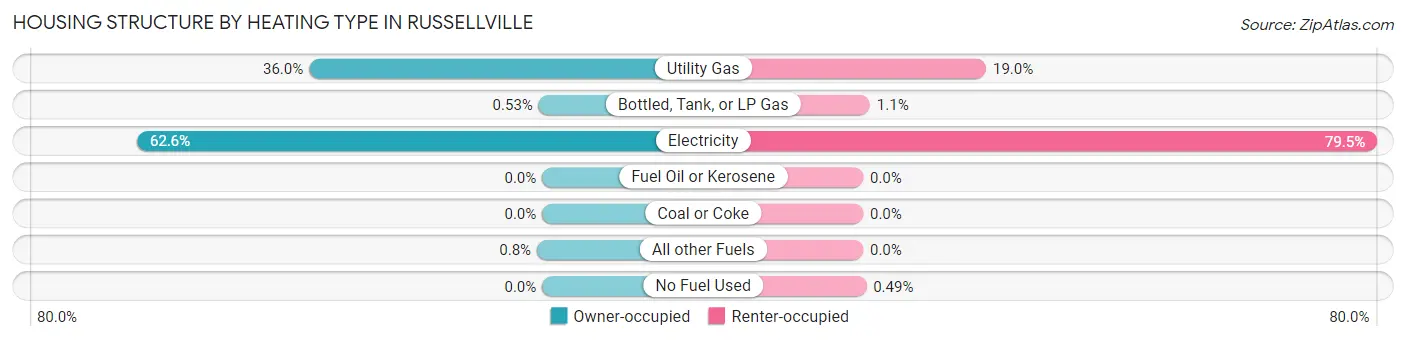
| Heating Type | Owner-occupied | Renter-occupied |
| Utility Gas | 815 (36.0%) | 234 (19.0%) |
| Bottled, Tank, or LP Gas | 12 (0.5%) | 13 (1.1%) |
| Electricity | 1,417 (62.6%) | 978 (79.4%) |
| Fuel Oil or Kerosene | 0 (0.0%) | 0 (0.0%) |
| Coal or Coke | 0 (0.0%) | 0 (0.0%) |
| All other Fuels | 18 (0.8%) | 0 (0.0%) |
| No Fuel Used | 0 (0.0%) | 6 (0.5%) |
| Total | 2,262 (100.0%) | 1,231 (100.0%) |
Household Vehicle Usage in Russellville
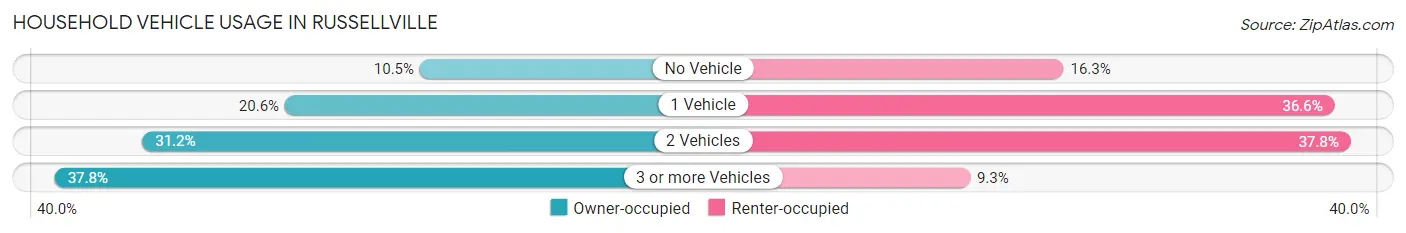
| Vehicles per Household | Owner-occupied | Renter-occupied |
| No Vehicle | 237 (10.5%) | 201 (16.3%) |
| 1 Vehicle | 465 (20.6%) | 450 (36.6%) |
| 2 Vehicles | 706 (31.2%) | 465 (37.8%) |
| 3 or more Vehicles | 854 (37.8%) | 115 (9.3%) |
| Total | 2,262 (100.0%) | 1,231 (100.0%) |
Real Estate & Mortgages in Russellville
Real Estate and Mortgage Overview in Russellville
| Characteristic | Without Mortgage | With Mortgage |
| Housing Units | 1,375 | 887 |
| Median Property Value | $94,000 | $131,100 |
| Median Household Income | $43,485 | $108 |
| Monthly Housing Costs | $402 | $11 |
| Real Estate Taxes | $330 | $46 |
Property Value by Mortgage Status in Russellville
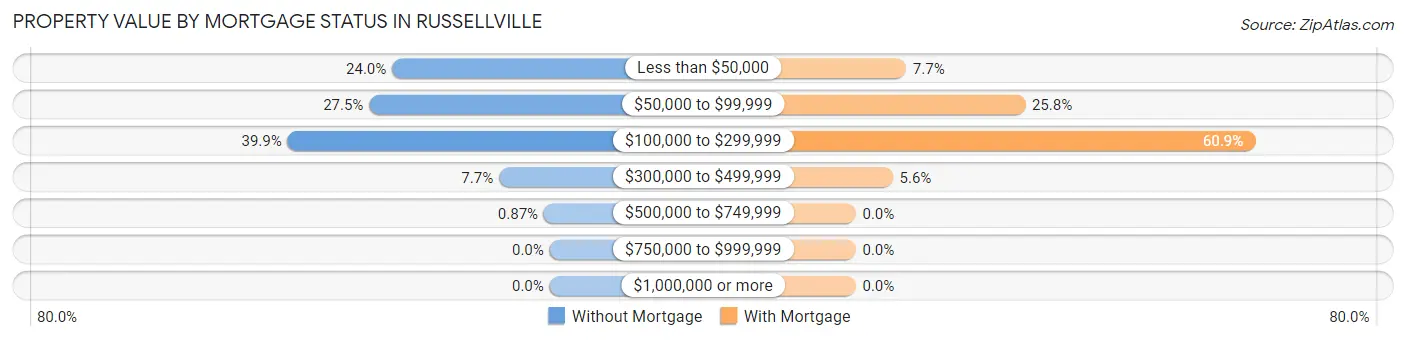
| Property Value | Without Mortgage | With Mortgage |
| Less than $50,000 | 330 (24.0%) | 68 (7.7%) |
| $50,000 to $99,999 | 378 (27.5%) | 229 (25.8%) |
| $100,000 to $299,999 | 549 (39.9%) | 540 (60.9%) |
| $300,000 to $499,999 | 106 (7.7%) | 50 (5.6%) |
| $500,000 to $749,999 | 12 (0.9%) | 0 (0.0%) |
| $750,000 to $999,999 | 0 (0.0%) | 0 (0.0%) |
| $1,000,000 or more | 0 (0.0%) | 0 (0.0%) |
| Total | 1,375 (100.0%) | 887 (100.0%) |
Household Income by Mortgage Status in Russellville
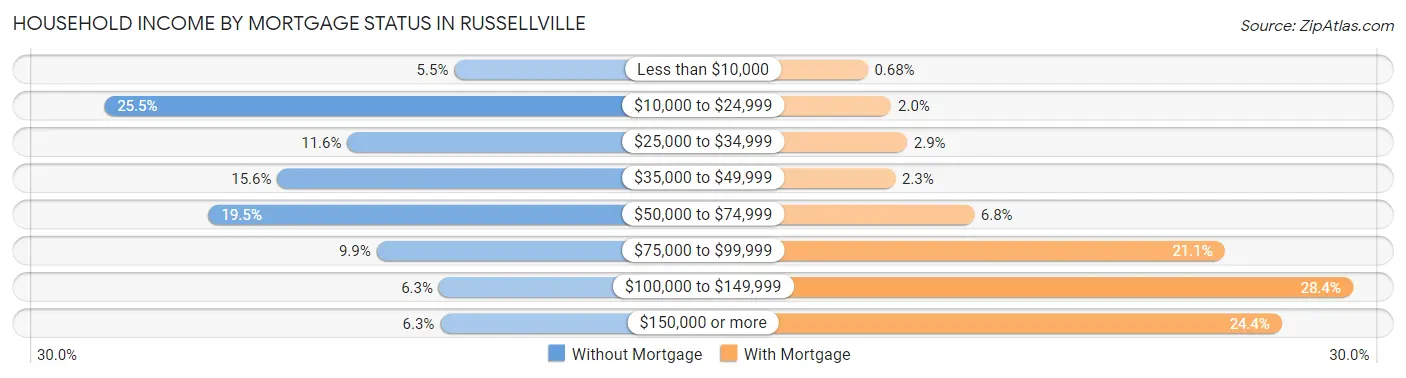
| Household Income | Without Mortgage | With Mortgage |
| Less than $10,000 | 75 (5.4%) | 6 (0.7%) |
| $10,000 to $24,999 | 350 (25.5%) | 18 (2.0%) |
| $25,000 to $34,999 | 159 (11.6%) | 26 (2.9%) |
| $35,000 to $49,999 | 214 (15.6%) | 20 (2.2%) |
| $50,000 to $74,999 | 268 (19.5%) | 60 (6.8%) |
| $75,000 to $99,999 | 136 (9.9%) | 187 (21.1%) |
| $100,000 to $149,999 | 87 (6.3%) | 252 (28.4%) |
| $150,000 or more | 86 (6.2%) | 216 (24.3%) |
| Total | 1,375 (100.0%) | 887 (100.0%) |
Property Value to Household Income Ratio in Russellville
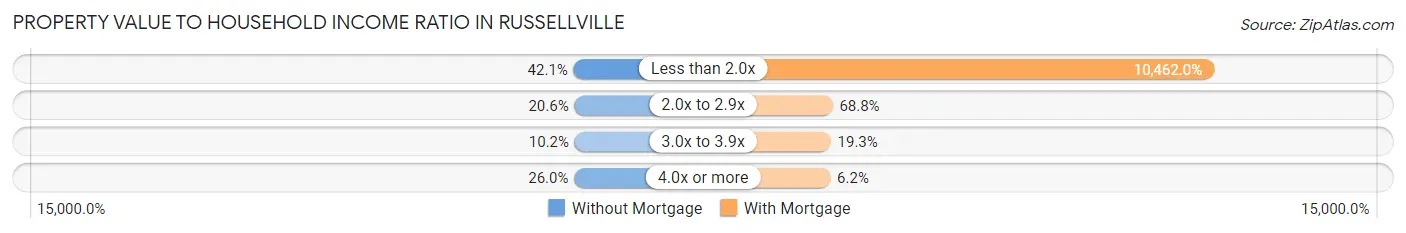
| Value-to-Income Ratio | Without Mortgage | With Mortgage |
| Less than 2.0x | 579 (42.1%) | 92,798 (10,462.0%) |
| 2.0x to 2.9x | 283 (20.6%) | 610 (68.8%) |
| 3.0x to 3.9x | 140 (10.2%) | 171 (19.3%) |
| 4.0x or more | 357 (26.0%) | 55 (6.2%) |
| Total | 1,375 (100.0%) | 887 (100.0%) |
Real Estate Taxes by Mortgage Status in Russellville
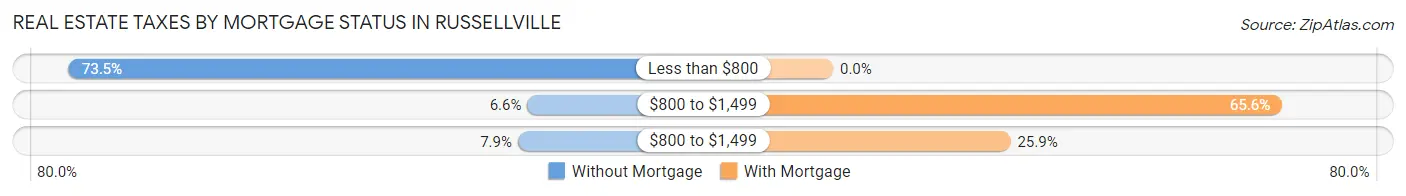
| Property Taxes | Without Mortgage | With Mortgage |
| Less than $800 | 1,011 (73.5%) | 0 (0.0%) |
| $800 to $1,499 | 90 (6.6%) | 582 (65.6%) |
| $800 to $1,499 | 109 (7.9%) | 230 (25.9%) |
| Total | 1,375 (100.0%) | 887 (100.0%) |
Health & Disability in Russellville
Health Insurance Coverage by Age in Russellville
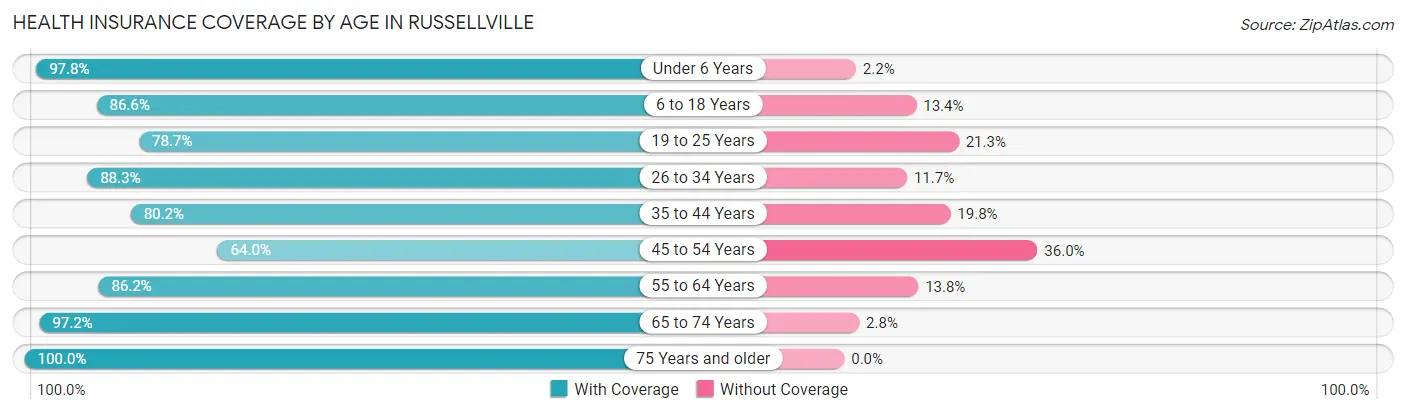
| Age Bracket | With Coverage | Without Coverage |
| Under 6 Years | 1,125 (97.8%) | 25 (2.2%) |
| 6 to 18 Years | 2,097 (86.6%) | 325 (13.4%) |
| 19 to 25 Years | 564 (78.7%) | 153 (21.3%) |
| 26 to 34 Years | 1,292 (88.3%) | 171 (11.7%) |
| 35 to 44 Years | 973 (80.2%) | 240 (19.8%) |
| 45 to 54 Years | 677 (64.0%) | 381 (36.0%) |
| 55 to 64 Years | 851 (86.2%) | 136 (13.8%) |
| 65 to 74 Years | 841 (97.2%) | 24 (2.8%) |
| 75 Years and older | 678 (100.0%) | 0 (0.0%) |
| Total | 9,098 (86.2%) | 1,455 (13.8%) |
Health Insurance Coverage by Citizenship Status in Russellville
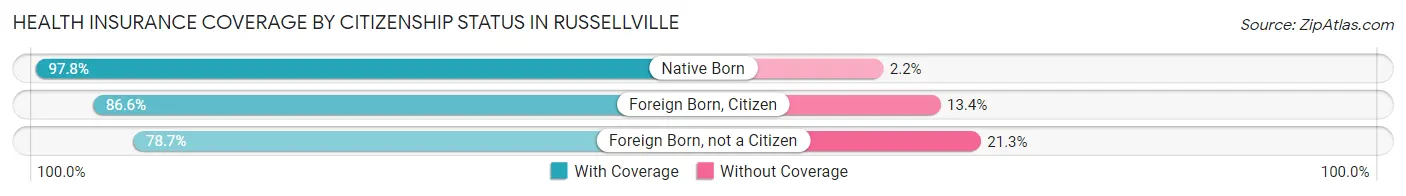
| Citizenship Status | With Coverage | Without Coverage |
| Native Born | 1,125 (97.8%) | 25 (2.2%) |
| Foreign Born, Citizen | 2,097 (86.6%) | 325 (13.4%) |
| Foreign Born, not a Citizen | 564 (78.7%) | 153 (21.3%) |
Health Insurance Coverage by Household Income in Russellville
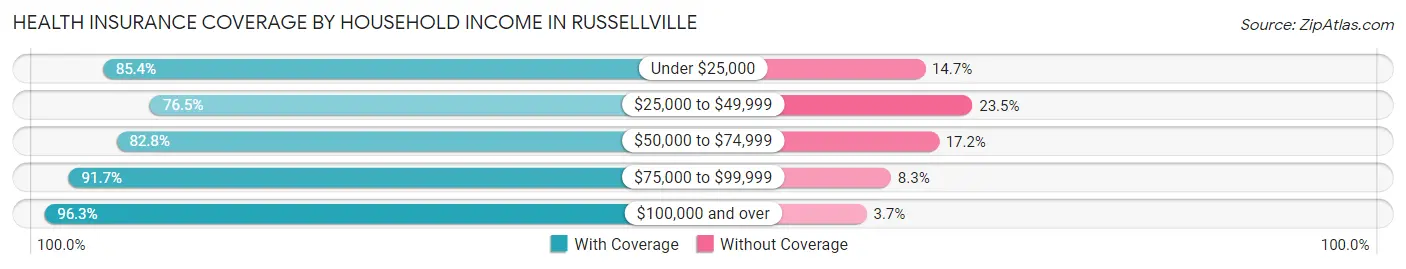
| Household Income | With Coverage | Without Coverage |
| Under $25,000 | 1,276 (85.4%) | 219 (14.6%) |
| $25,000 to $49,999 | 1,897 (76.5%) | 583 (23.5%) |
| $50,000 to $74,999 | 2,028 (82.8%) | 422 (17.2%) |
| $75,000 to $99,999 | 1,488 (91.7%) | 134 (8.3%) |
| $100,000 and over | 2,396 (96.3%) | 92 (3.7%) |
Public vs Private Health Insurance Coverage by Age in Russellville
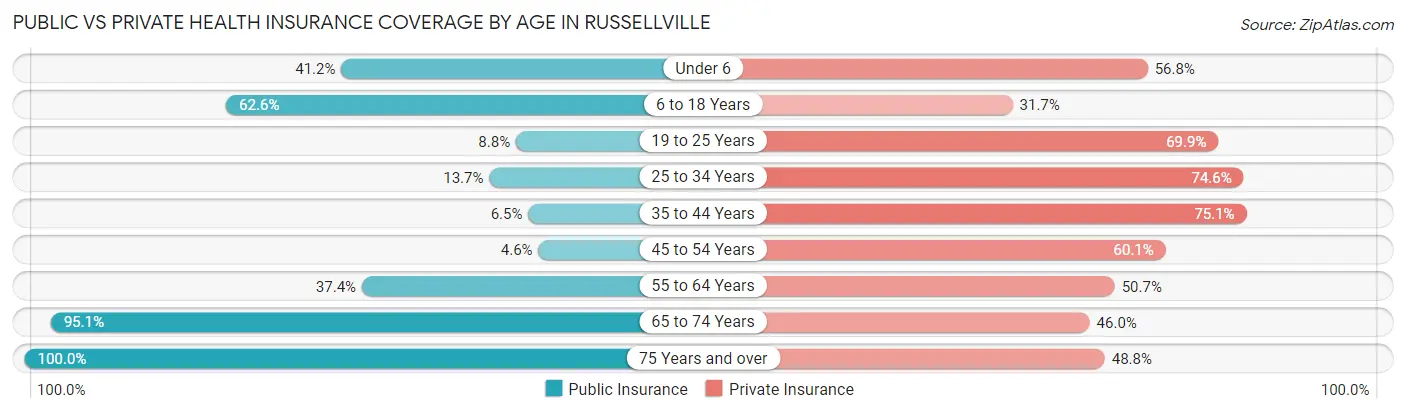
| Age Bracket | Public Insurance | Private Insurance |
| Under 6 | 474 (41.2%) | 653 (56.8%) |
| 6 to 18 Years | 1,516 (62.6%) | 768 (31.7%) |
| 19 to 25 Years | 63 (8.8%) | 501 (69.9%) |
| 25 to 34 Years | 201 (13.7%) | 1,091 (74.6%) |
| 35 to 44 Years | 79 (6.5%) | 911 (75.1%) |
| 45 to 54 Years | 49 (4.6%) | 636 (60.1%) |
| 55 to 64 Years | 369 (37.4%) | 500 (50.7%) |
| 65 to 74 Years | 823 (95.1%) | 398 (46.0%) |
| 75 Years and over | 678 (100.0%) | 331 (48.8%) |
| Total | 4,252 (40.3%) | 5,789 (54.9%) |
Disability Status by Sex by Age in Russellville
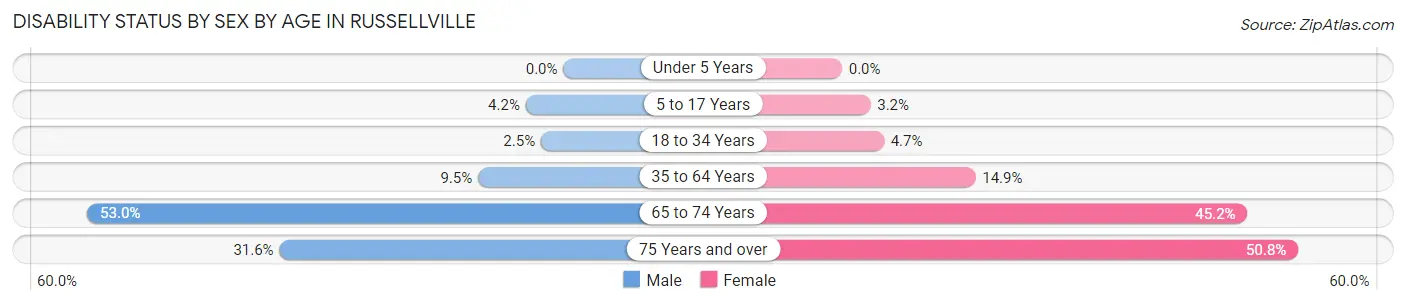
| Age Bracket | Male | Female |
| Under 5 Years | 0 (0.0%) | 0 (0.0%) |
| 5 to 17 Years | 45 (4.2%) | 32 (3.2%) |
| 18 to 34 Years | 36 (2.5%) | 54 (4.7%) |
| 35 to 64 Years | 151 (9.5%) | 248 (14.9%) |
| 65 to 74 Years | 184 (53.0%) | 234 (45.2%) |
| 75 Years and over | 80 (31.6%) | 216 (50.8%) |
Disability Class by Sex by Age in Russellville
Disability Class: Hearing Difficulty
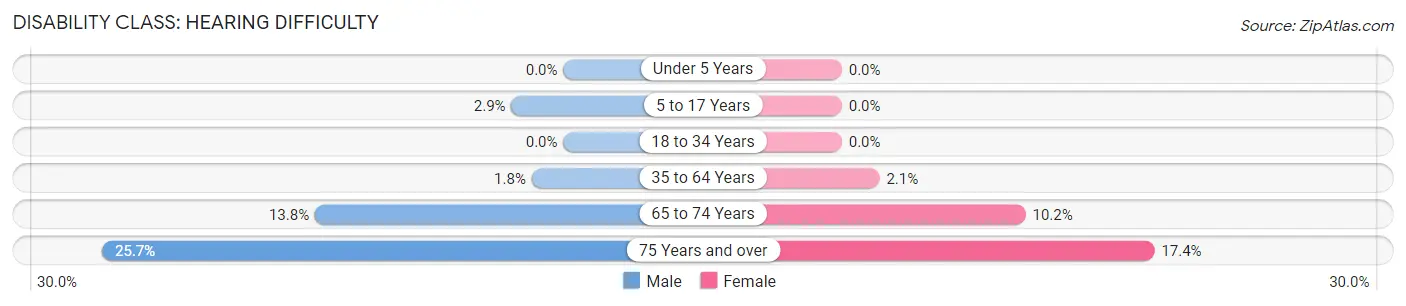
| Age Bracket | Male | Female |
| Under 5 Years | 0 (0.0%) | 0 (0.0%) |
| 5 to 17 Years | 31 (2.9%) | 0 (0.0%) |
| 18 to 34 Years | 0 (0.0%) | 0 (0.0%) |
| 35 to 64 Years | 28 (1.8%) | 35 (2.1%) |
| 65 to 74 Years | 48 (13.8%) | 53 (10.2%) |
| 75 Years and over | 65 (25.7%) | 74 (17.4%) |
Disability Class: Vision Difficulty
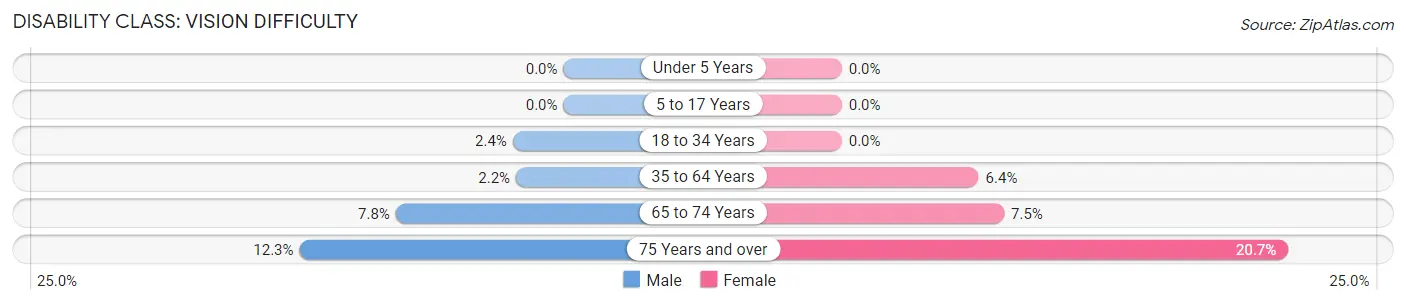
| Age Bracket | Male | Female |
| Under 5 Years | 0 (0.0%) | 0 (0.0%) |
| 5 to 17 Years | 0 (0.0%) | 0 (0.0%) |
| 18 to 34 Years | 34 (2.4%) | 0 (0.0%) |
| 35 to 64 Years | 35 (2.2%) | 106 (6.4%) |
| 65 to 74 Years | 27 (7.8%) | 39 (7.5%) |
| 75 Years and over | 31 (12.2%) | 88 (20.7%) |
Disability Class: Cognitive Difficulty
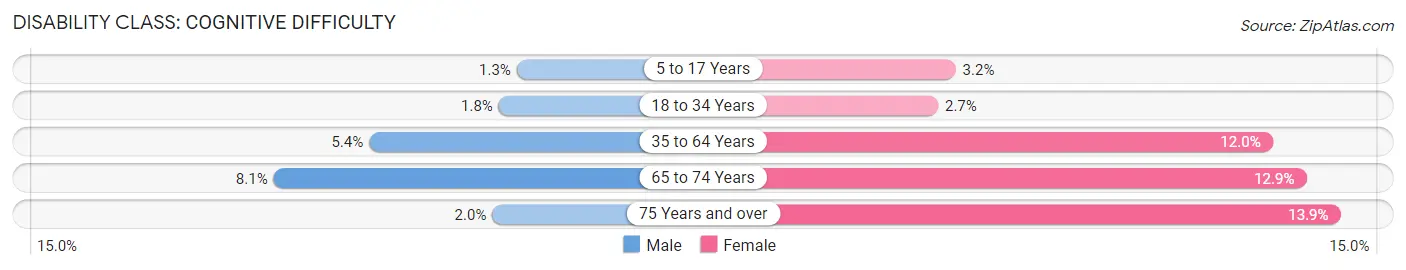
| Age Bracket | Male | Female |
| 5 to 17 Years | 14 (1.3%) | 32 (3.2%) |
| 18 to 34 Years | 26 (1.8%) | 31 (2.7%) |
| 35 to 64 Years | 86 (5.4%) | 200 (12.0%) |
| 65 to 74 Years | 28 (8.1%) | 67 (12.9%) |
| 75 Years and over | 5 (2.0%) | 59 (13.9%) |
Disability Class: Ambulatory Difficulty
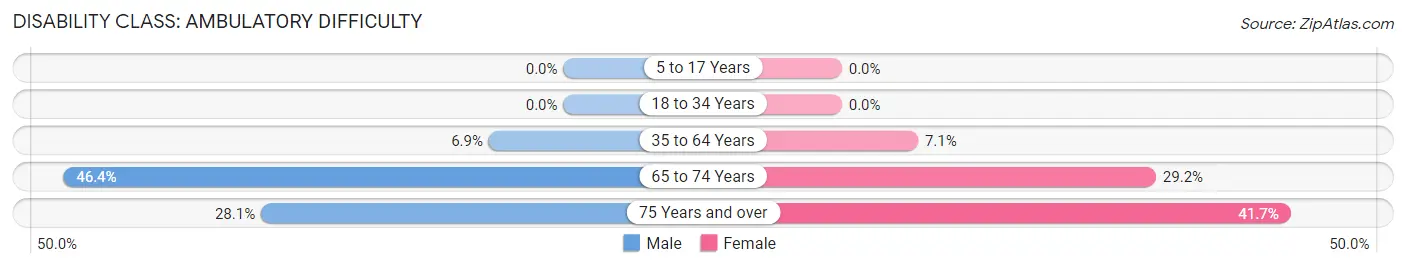
| Age Bracket | Male | Female |
| 5 to 17 Years | 0 (0.0%) | 0 (0.0%) |
| 18 to 34 Years | 0 (0.0%) | 0 (0.0%) |
| 35 to 64 Years | 110 (6.9%) | 118 (7.1%) |
| 65 to 74 Years | 161 (46.4%) | 151 (29.1%) |
| 75 Years and over | 71 (28.1%) | 177 (41.6%) |
Disability Class: Self-Care Difficulty
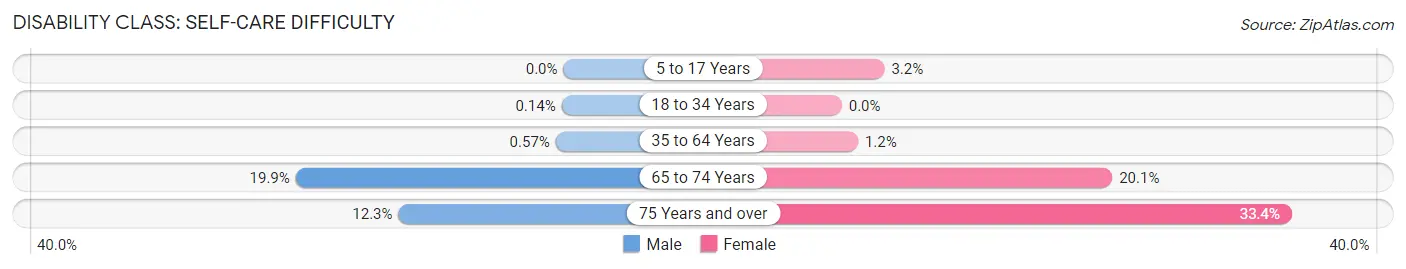
| Age Bracket | Male | Female |
| 5 to 17 Years | 0 (0.0%) | 32 (3.2%) |
| 18 to 34 Years | 2 (0.1%) | 0 (0.0%) |
| 35 to 64 Years | 9 (0.6%) | 20 (1.2%) |
| 65 to 74 Years | 69 (19.9%) | 104 (20.1%) |
| 75 Years and over | 31 (12.2%) | 142 (33.4%) |
Technology Access in Russellville
Computing Device Access in Russellville
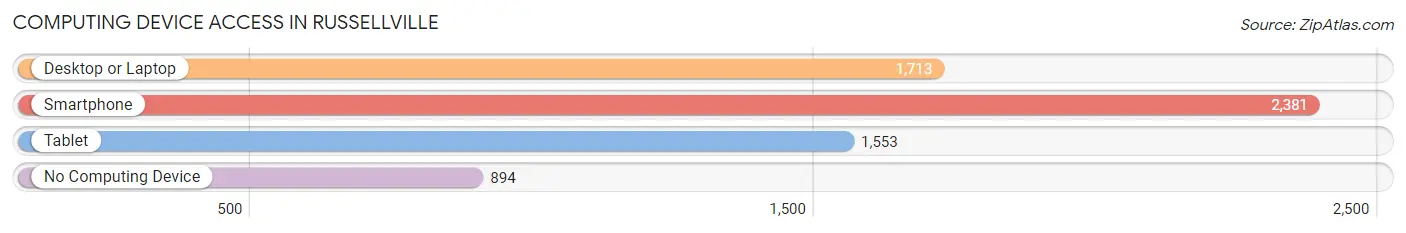
| Device Type | # Households | % Households |
| Desktop or Laptop | 1,713 | 49.0% |
| Smartphone | 2,381 | 68.2% |
| Tablet | 1,553 | 44.5% |
| No Computing Device | 894 | 25.6% |
| Total | 3,493 | 100.0% |
Internet Access in Russellville
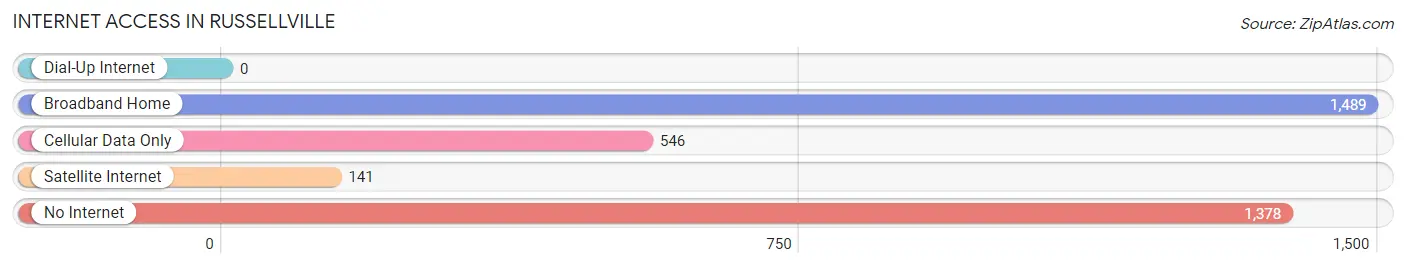
| Internet Type | # Households | % Households |
| Dial-Up Internet | 0 | 0.0% |
| Broadband Home | 1,489 | 42.6% |
| Cellular Data Only | 546 | 15.6% |
| Satellite Internet | 141 | 4.0% |
| No Internet | 1,378 | 39.5% |
| Total | 3,493 | 100.0% |
Russellville Summary
Introduction
Russellville, Alabama is a small city located in Franklin County, Alabama. It is the county seat of Franklin County and is located in the northwest corner of the state. The city has a population of 9,830 according to the 2010 census. It is part of the Huntsville-Decatur Combined Statistical Area and is located about 50 miles northwest of Huntsville. The city is known for its historic downtown area, which is listed on the National Register of Historic Places.
History
The area that is now Russellville was first settled in the early 1800s by settlers from North Carolina and Virginia. The town was originally known as Chisholm’s Stand, named after a local storekeeper. In 1821, the town was renamed Russellville after Major William Russell, a local landowner. The town was officially incorporated in 1839.
During the Civil War, Russellville was a major supply center for the Confederate Army. The town was also the site of a major battle in 1863, when Union forces attempted to capture the town. The Union forces were unsuccessful and the town remained in Confederate hands.
After the war, the town began to grow and prosper. The railroad arrived in 1872, bringing with it new industry and economic growth. The town was also home to several cotton mills, which provided employment for many of the town’s residents.
In the early 20th century, the town began to decline as the cotton industry moved away. The town’s population began to decline as well, and by the 1950s the town had become a small, rural community.
In the late 20th century, the town began to experience a resurgence. The downtown area was revitalized and new businesses began to move into the area. The town also began to attract new residents, and the population began to grow again.
Geography
Russellville is located in the northwest corner of Alabama, in Franklin County. The city is located at the intersection of US Highway 43 and State Highway 24. The city is located about 50 miles northwest of Huntsville and about 100 miles south of Nashville, Tennessee.
The city is located in the foothills of the Appalachian Mountains and is surrounded by rolling hills and forests. The city is located on the banks of the Tennessee River, which provides a scenic backdrop for the city.
Economy
The economy of Russellville is largely based on manufacturing and agriculture. The city is home to several manufacturing plants, including a paper mill, a furniture factory, and a plastics plant. The city is also home to several agricultural businesses, including a poultry processing plant and a cotton gin.
The city is also home to several retail businesses, including several antique stores and a variety of restaurants. The city is also home to several small businesses, including a variety of professional services.
Demographics
According to the 2010 census, the population of Russellville was 9,830. The population is largely white (86.3%) and African American (11.2%). The median household income is $35,945 and the median age is 38.7.
Conclusion
Russellville, Alabama is a small city located in Franklin County, Alabama. It is the county seat of Franklin County and is located in the northwest corner of the state. The city has a population of 9,830 according to the 2010 census. It is part of the Huntsville-Decatur Combined Statistical Area and is located about 50 miles northwest of Huntsville. The city is known for its historic downtown area, which is listed on the National Register of Historic Places. The economy of Russellville is largely based on manufacturing and agriculture, and the population is largely white and African American.
Common Questions
What is Per Capita Income in Russellville?
Per Capita income in Russellville is $23,410.
What is the Median Family Income in Russellville?
Median Family Income in Russellville is $60,750.
What is the Median Household income in Russellville?
Median Household Income in Russellville is $50,411.
What is Income or Wage Gap in Russellville?
Income or Wage Gap in Russellville is 39.0%.
Women in Russellville earn 61.0 cents for every dollar earned by a man.
What is Inequality or Gini Index in Russellville?
Inequality or Gini Index in Russellville is 0.44.
What is the Total Population of Russellville?
Total Population of Russellville is 10,767.
What is the Total Male Population of Russellville?
Total Male Population of Russellville is 5,301.
What is the Total Female Population of Russellville?
Total Female Population of Russellville is 5,466.
What is the Ratio of Males per 100 Females in Russellville?
There are 96.98 Males per 100 Females in Russellville.
What is the Ratio of Females per 100 Males in Russellville?
There are 103.11 Females per 100 Males in Russellville.
What is the Median Population Age in Russellville?
Median Population Age in Russellville is 33.1 Years.
What is the Average Family Size in Russellville
Average Family Size in Russellville is 4.2 People.
What is the Average Household Size in Russellville
Average Household Size in Russellville is 3.0 People.
How Large is the Labor Force in Russellville?
There are 4,936 People in the Labor Forcein in Russellville.
What is the Percentage of People in the Labor Force in Russellville?
62.4% of People are in the Labor Force in Russellville.
What is the Unemployment Rate in Russellville?
Unemployment Rate in Russellville is 3.5%.