Babbie, AL Map & Demographics
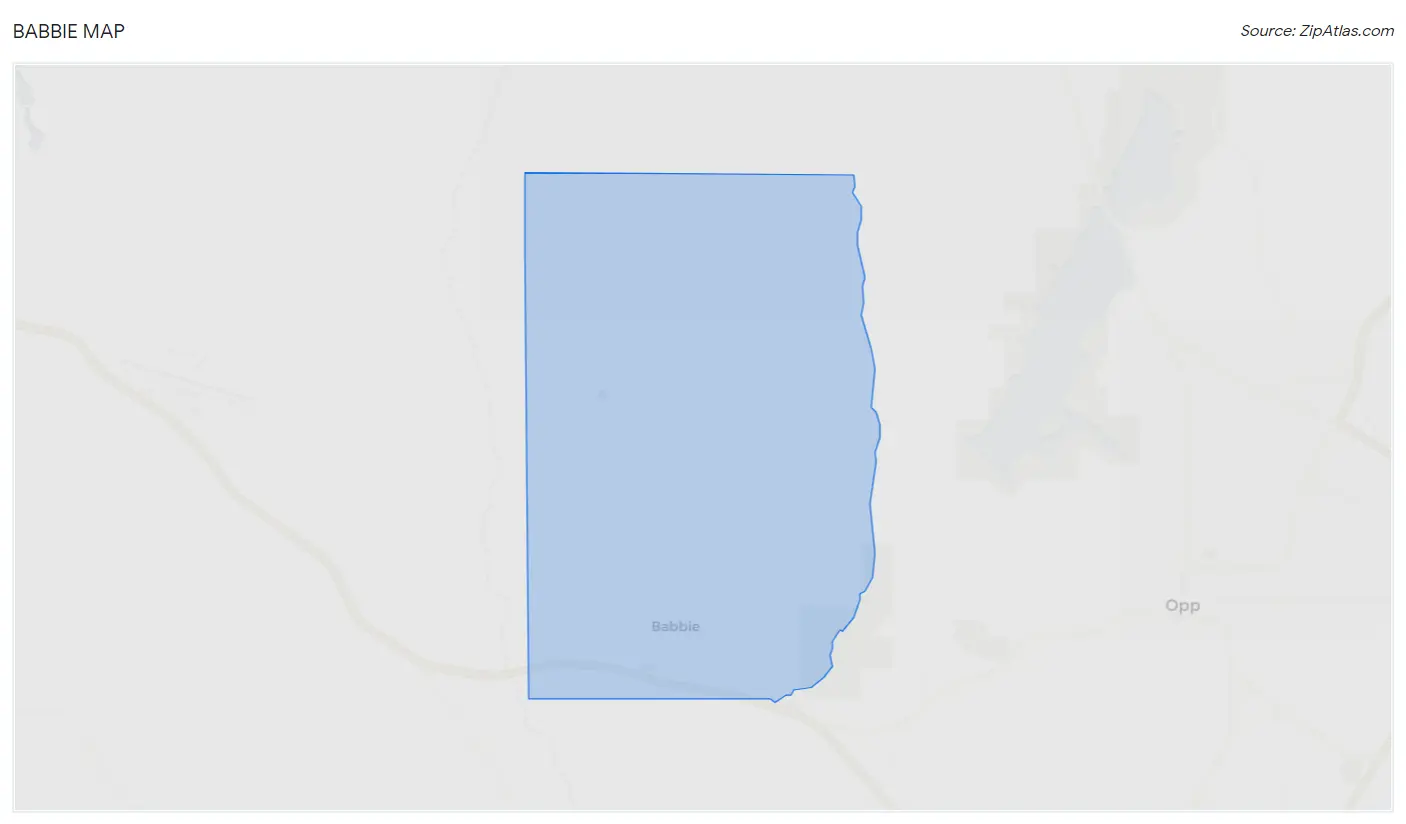
Babbie Map
Babbie Overview
$23,765
PER CAPITA INCOME
$63,750
AVG FAMILY INCOME
$59,712
AVG HOUSEHOLD INCOME
37.5%
WAGE / INCOME GAP [ % ]
62.5¢/ $1
WAGE / INCOME GAP [ $ ]
0.33
INEQUALITY / GINI INDEX
575
TOTAL POPULATION
294
MALE POPULATION
281
FEMALE POPULATION
104.63
MALES / 100 FEMALES
95.58
FEMALES / 100 MALES
33.8
MEDIAN AGE
2.9
AVG FAMILY SIZE
2.8
AVG HOUSEHOLD SIZE
273
LABOR FORCE [ PEOPLE ]
58.6%
PERCENT IN LABOR FORCE
Babbie Area Codes
Income in Babbie
Income Overview in Babbie
Per Capita Income in Babbie is $23,765, while median incomes of families and households are $63,750 and $59,712 respectively.
| Characteristic | Number | Measure |
| Per Capita Income | 575 | $23,765 |
| Median Family Income | 180 | $63,750 |
| Mean Family Income | 180 | $69,797 |
| Median Household Income | 205 | $59,712 |
| Mean Household Income | 205 | $64,782 |
| Income Deficit | 180 | $0 |
| Wage / Income Gap (%) | 575 | 37.54% |
| Wage / Income Gap ($) | 575 | 62.46¢ per $1 |
| Gini / Inequality Index | 575 | 0.33 |
Earnings by Sex in Babbie
Average Earnings in Babbie are $28,676, $40,948 for men and $25,577 for women, a difference of 37.5%.
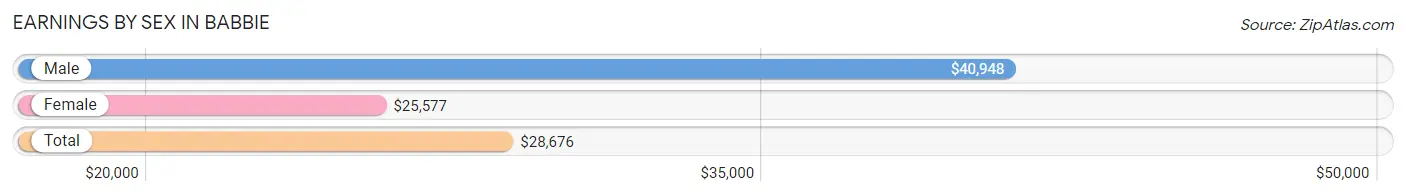
| Sex | Number | Average Earnings |
| Male | 158 (53.7%) | $40,948 |
| Female | 136 (46.3%) | $25,577 |
| Total | 294 (100.0%) | $28,676 |
Earnings by Sex by Income Bracket in Babbie
The most common earnings brackets in Babbie are $40,000 to $44,999 for men (31 | 19.6%) and $25,000 to $29,999 for women (47 | 34.6%).
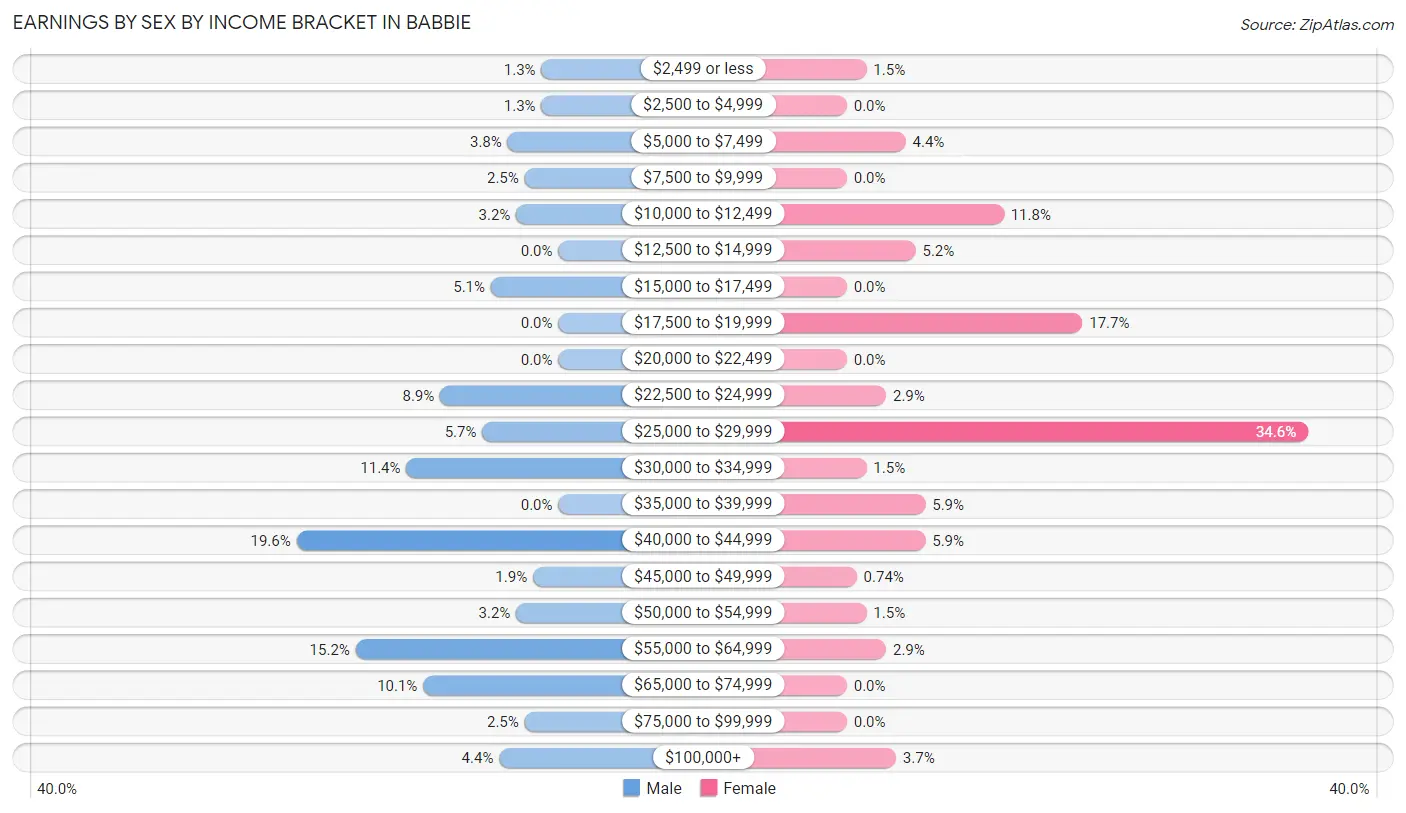
| Income | Male | Female |
| $2,499 or less | 2 (1.3%) | 2 (1.5%) |
| $2,500 to $4,999 | 2 (1.3%) | 0 (0.0%) |
| $5,000 to $7,499 | 6 (3.8%) | 6 (4.4%) |
| $7,500 to $9,999 | 4 (2.5%) | 0 (0.0%) |
| $10,000 to $12,499 | 5 (3.2%) | 16 (11.8%) |
| $12,500 to $14,999 | 0 (0.0%) | 7 (5.1%) |
| $15,000 to $17,499 | 8 (5.1%) | 0 (0.0%) |
| $17,500 to $19,999 | 0 (0.0%) | 24 (17.6%) |
| $20,000 to $22,499 | 0 (0.0%) | 0 (0.0%) |
| $22,500 to $24,999 | 14 (8.9%) | 4 (2.9%) |
| $25,000 to $29,999 | 9 (5.7%) | 47 (34.6%) |
| $30,000 to $34,999 | 18 (11.4%) | 2 (1.5%) |
| $35,000 to $39,999 | 0 (0.0%) | 8 (5.9%) |
| $40,000 to $44,999 | 31 (19.6%) | 8 (5.9%) |
| $45,000 to $49,999 | 3 (1.9%) | 1 (0.7%) |
| $50,000 to $54,999 | 5 (3.2%) | 2 (1.5%) |
| $55,000 to $64,999 | 24 (15.2%) | 4 (2.9%) |
| $65,000 to $74,999 | 16 (10.1%) | 0 (0.0%) |
| $75,000 to $99,999 | 4 (2.5%) | 0 (0.0%) |
| $100,000+ | 7 (4.4%) | 5 (3.7%) |
| Total | 158 (100.0%) | 136 (100.0%) |
Earnings by Sex by Educational Attainment in Babbie
Average earnings in Babbie are $41,950 for men and $25,705 for women, a difference of 38.7%. Men with an educational attainment of college or associate's degree enjoy the highest average annual earnings of $55,417, while those with high school diploma education earn the least with $41,413. Women with an educational attainment of bachelor's degree earn the most with the average annual earnings of $44,063, while those with college or associate's degree education have the smallest earnings of $25,888.
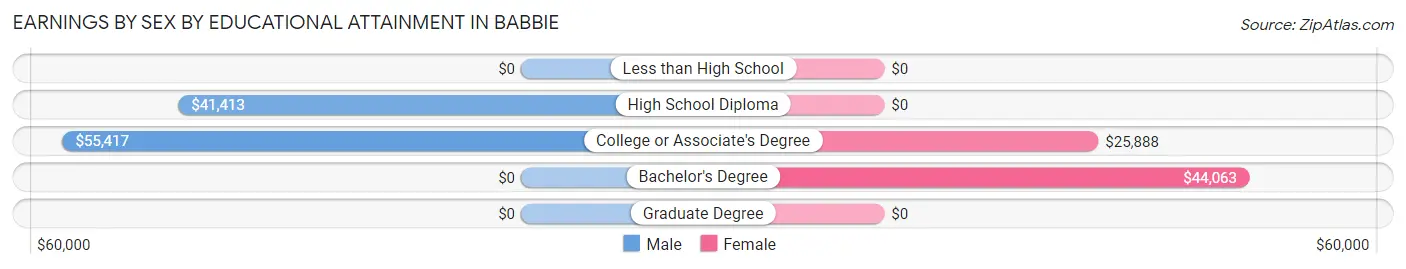
| Educational Attainment | Male Income | Female Income |
| Less than High School | - | - |
| High School Diploma | $41,413 | $0 |
| College or Associate's Degree | $55,417 | $25,888 |
| Bachelor's Degree | - | - |
| Graduate Degree | - | - |
| Total | $41,950 | $25,705 |
Family Income in Babbie
Family Income Brackets in Babbie
According to the Babbie family income data, there are 64 families falling into the $50,000 to $74,999 income range, which is the most common income bracket and makes up 35.6% of all families.
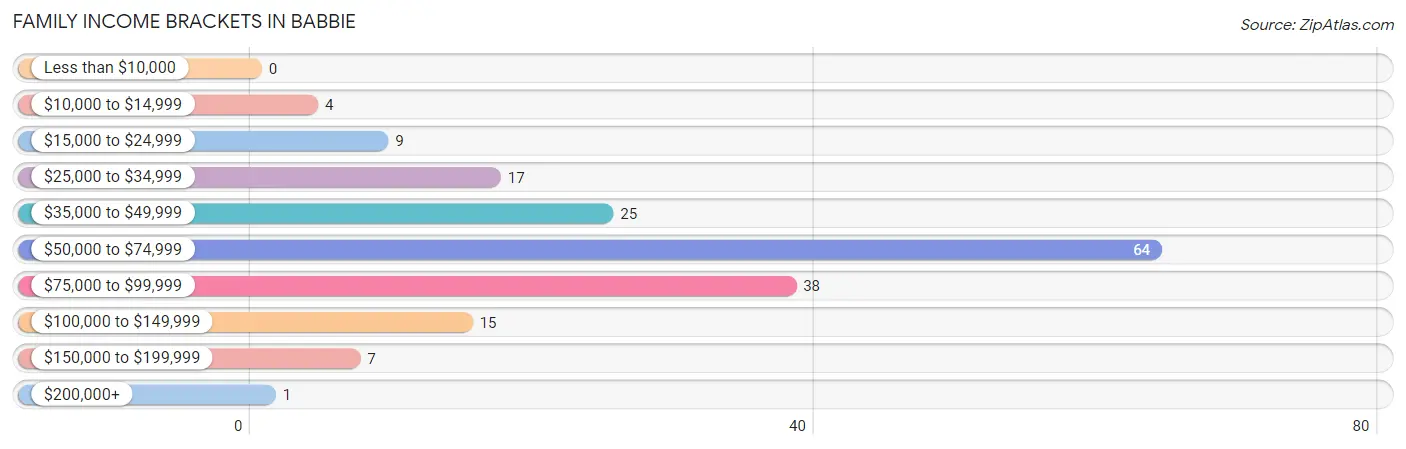
| Income Bracket | # Families | % Families |
| Less than $10,000 | 0 | 0.0% |
| $10,000 to $14,999 | 4 | 2.2% |
| $15,000 to $24,999 | 9 | 5.0% |
| $25,000 to $34,999 | 17 | 9.4% |
| $35,000 to $49,999 | 25 | 13.9% |
| $50,000 to $74,999 | 64 | 35.6% |
| $75,000 to $99,999 | 38 | 21.1% |
| $100,000 to $149,999 | 15 | 8.3% |
| $150,000 to $199,999 | 7 | 3.9% |
| $200,000+ | 1 | 0.6% |
Family Income by Famaliy Size in Babbie
2-person families (94 | 52.2%) account for the highest median family income in Babbie with $65,288 per family, while 2-person families (94 | 52.2%) have the highest median income of $32,644 per family member.
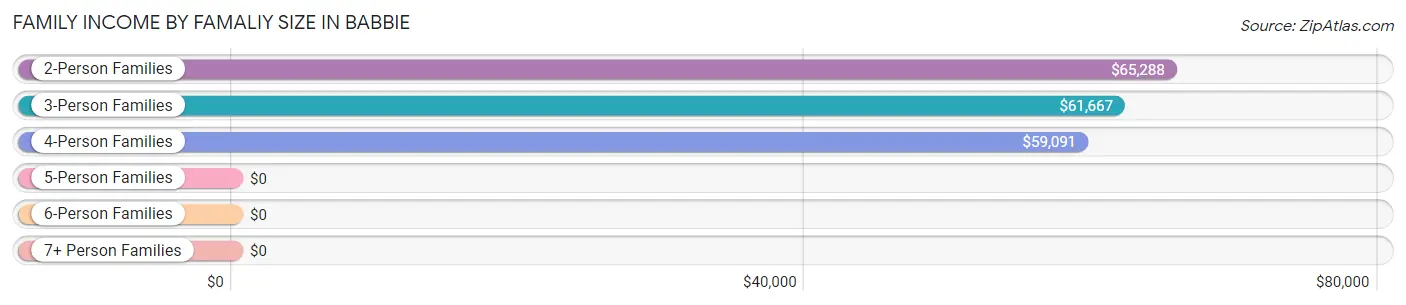
| Income Bracket | # Families | Median Income |
| 2-Person Families | 94 (52.2%) | $65,288 |
| 3-Person Families | 46 (25.6%) | $61,667 |
| 4-Person Families | 38 (21.1%) | $59,091 |
| 5-Person Families | 1 (0.6%) | $0 |
| 6-Person Families | 0 (0.0%) | $0 |
| 7+ Person Families | 1 (0.6%) | $0 |
| Total | 180 (100.0%) | $63,750 |
Family Income by Number of Earners in Babbie
The median family income in Babbie is $63,750, with families comprising 3+ earners (12) having the highest median family income of $79,500, while families with no earners (35) have the lowest median family income of $46,750, accounting for 6.7% and 19.4% of families, respectively.
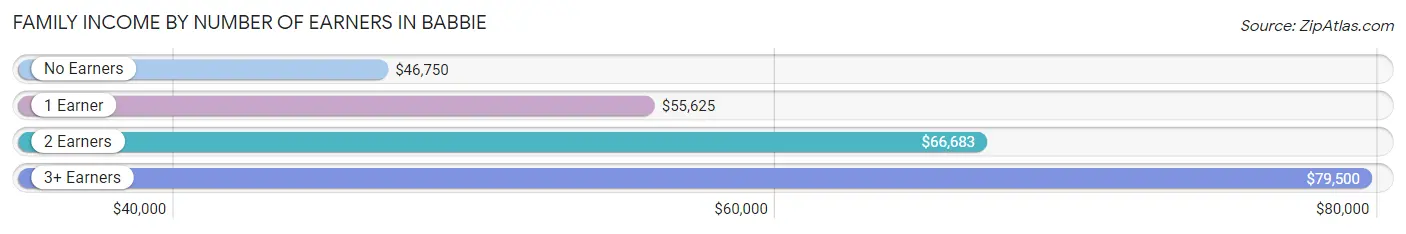
| Number of Earners | # Families | Median Income |
| No Earners | 35 (19.4%) | $46,750 |
| 1 Earner | 38 (21.1%) | $55,625 |
| 2 Earners | 95 (52.8%) | $66,683 |
| 3+ Earners | 12 (6.7%) | $79,500 |
| Total | 180 (100.0%) | $63,750 |
Household Income in Babbie
Household Income Brackets in Babbie
With 64 households falling in the category, the $50,000 to $74,999 income range is the most frequent in Babbie, accounting for 31.2% of all households. In contrast, only 1 households (0.5%) fall into the $200,000+ income bracket, making it the least populous group.
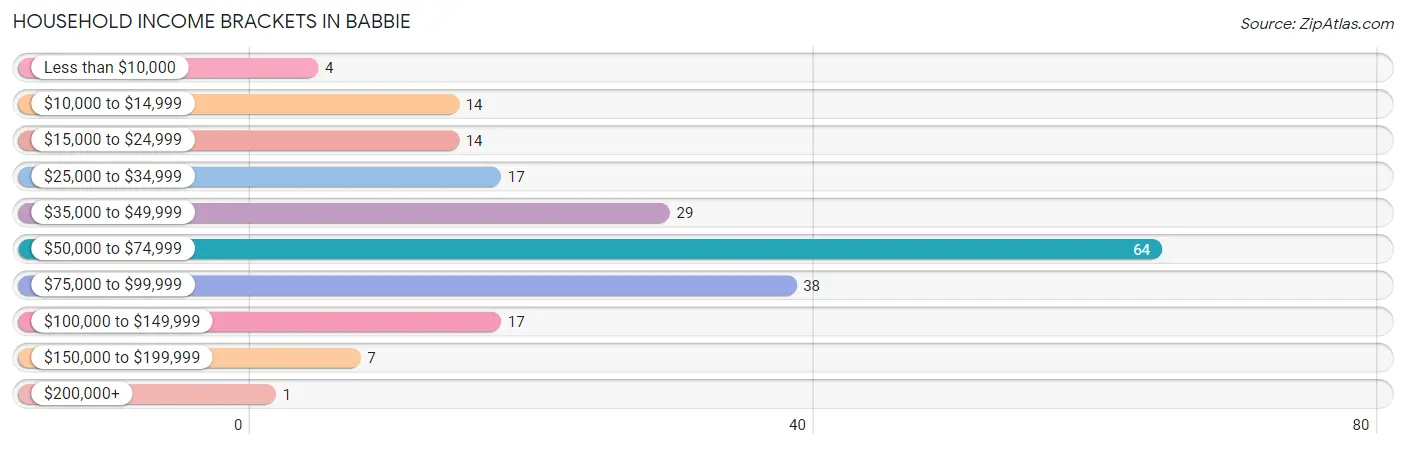
| Income Bracket | # Households | % Households |
| Less than $10,000 | 4 | 2.0% |
| $10,000 to $14,999 | 14 | 6.8% |
| $15,000 to $24,999 | 14 | 6.8% |
| $25,000 to $34,999 | 17 | 8.3% |
| $35,000 to $49,999 | 29 | 14.1% |
| $50,000 to $74,999 | 64 | 31.2% |
| $75,000 to $99,999 | 38 | 18.5% |
| $100,000 to $149,999 | 17 | 8.3% |
| $150,000 to $199,999 | 7 | 3.4% |
| $200,000+ | 1 | 0.5% |
Household Income by Householder Age in Babbie
The median household income in Babbie is $59,712, with the highest median household income of $65,865 found in the 25 to 44 years age bracket for the primary householder. A total of 78 households (38.1%) fall into this category.
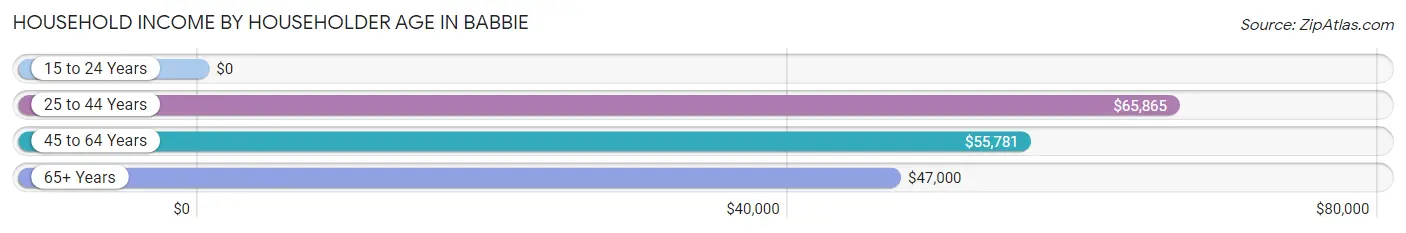
| Income Bracket | # Households | Median Income |
| 15 to 24 Years | 0 (0.0%) | $0 |
| 25 to 44 Years | 78 (38.1%) | $65,865 |
| 45 to 64 Years | 83 (40.5%) | $55,781 |
| 65+ Years | 44 (21.5%) | $47,000 |
| Total | 205 (100.0%) | $59,712 |
Poverty in Babbie
Income Below Poverty by Sex and Age in Babbie
With 7.8% poverty level for males and 13.7% for females among the residents of Babbie, 35 to 44 year old males and 15 year old females are the most vulnerable to poverty, with 4 males (28.6%) and 2 females (100.0%) in their respective age groups living below the poverty level.
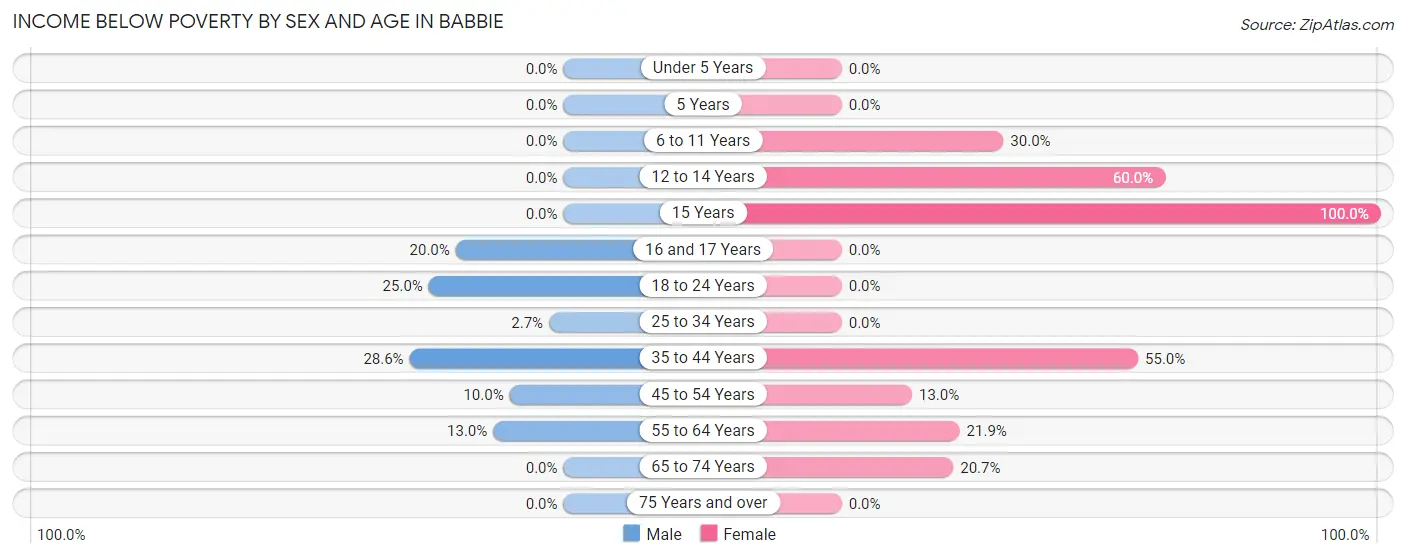
| Age Bracket | Male | Female |
| Under 5 Years | 0 (0.0%) | 0 (0.0%) |
| 5 Years | 0 (0.0%) | 0 (0.0%) |
| 6 to 11 Years | 0 (0.0%) | 3 (30.0%) |
| 12 to 14 Years | 0 (0.0%) | 3 (60.0%) |
| 15 Years | 0 (0.0%) | 2 (100.0%) |
| 16 and 17 Years | 2 (20.0%) | 0 (0.0%) |
| 18 to 24 Years | 7 (25.0%) | 0 (0.0%) |
| 25 to 34 Years | 2 (2.7%) | 0 (0.0%) |
| 35 to 44 Years | 4 (28.6%) | 11 (55.0%) |
| 45 to 54 Years | 5 (10.0%) | 6 (13.0%) |
| 55 to 64 Years | 3 (13.0%) | 7 (21.9%) |
| 65 to 74 Years | 0 (0.0%) | 6 (20.7%) |
| 75 Years and over | 0 (0.0%) | 0 (0.0%) |
| Total | 23 (7.8%) | 38 (13.7%) |
Income Above Poverty by Sex and Age in Babbie
According to the poverty statistics in Babbie, males aged under 5 years and females aged under 5 years are the age groups that are most secure financially, with 100.0% of males and 100.0% of females in these age groups living above the poverty line.
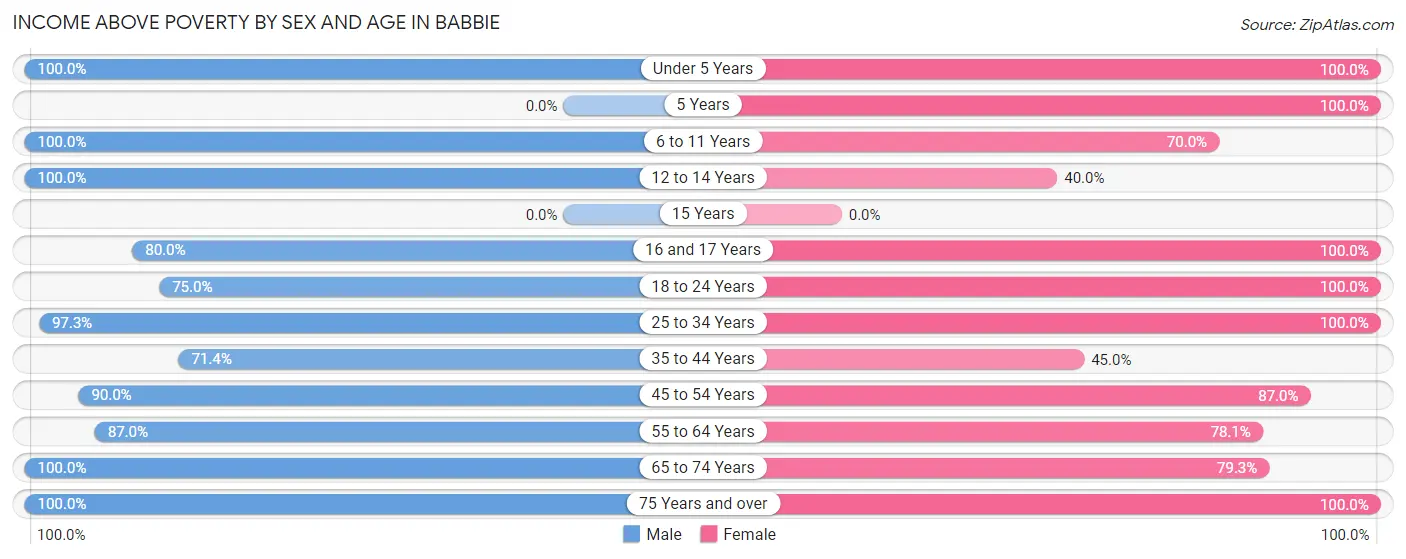
| Age Bracket | Male | Female |
| Under 5 Years | 47 (100.0%) | 26 (100.0%) |
| 5 Years | 0 (0.0%) | 6 (100.0%) |
| 6 to 11 Years | 2 (100.0%) | 7 (70.0%) |
| 12 to 14 Years | 7 (100.0%) | 2 (40.0%) |
| 15 Years | 0 (0.0%) | 0 (0.0%) |
| 16 and 17 Years | 8 (80.0%) | 8 (100.0%) |
| 18 to 24 Years | 21 (75.0%) | 18 (100.0%) |
| 25 to 34 Years | 73 (97.3%) | 59 (100.0%) |
| 35 to 44 Years | 10 (71.4%) | 9 (45.0%) |
| 45 to 54 Years | 45 (90.0%) | 40 (87.0%) |
| 55 to 64 Years | 20 (87.0%) | 25 (78.1%) |
| 65 to 74 Years | 25 (100.0%) | 23 (79.3%) |
| 75 Years and over | 13 (100.0%) | 16 (100.0%) |
| Total | 271 (92.2%) | 239 (86.3%) |
Income Below Poverty Among Married-Couple Families in Babbie
The poverty statistics for married-couple families in Babbie show that 4.6% or 7 of the total 152 families live below the poverty line. Families with 1 or 2 children have the highest poverty rate of 14.0%, comprising of 7 families. On the other hand, families with no children have the lowest poverty rate of 0.0%, which includes 0 families.
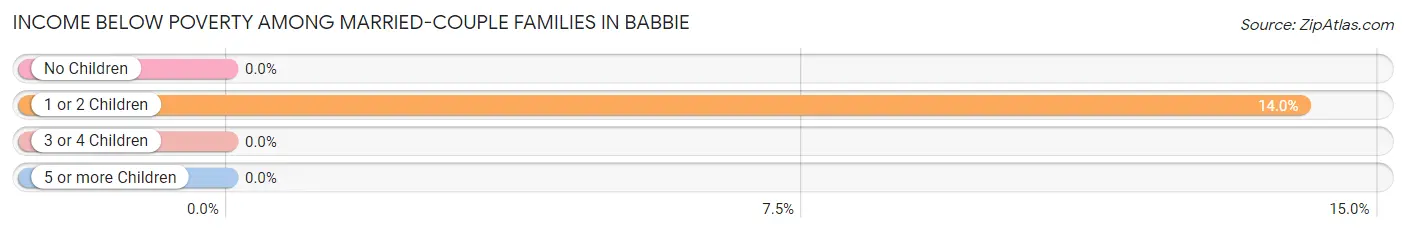
| Children | Above Poverty | Below Poverty |
| No Children | 101 (100.0%) | 0 (0.0%) |
| 1 or 2 Children | 43 (86.0%) | 7 (14.0%) |
| 3 or 4 Children | 1 (100.0%) | 0 (0.0%) |
| 5 or more Children | 0 (0.0%) | 0 (0.0%) |
| Total | 145 (95.4%) | 7 (4.6%) |
Income Below Poverty Among Single-Parent Households in Babbie
According to the poverty data in Babbie, 10.0% or 2 single-father households and 25.0% or 2 single-mother households are living below the poverty line. Among single-father households, those with no children have the highest poverty rate, with 2 households (20.0%) experiencing poverty. Likewise, among single-mother households, those with 1 or 2 children have the highest poverty rate, with 2 households (40.0%) falling below the poverty line.
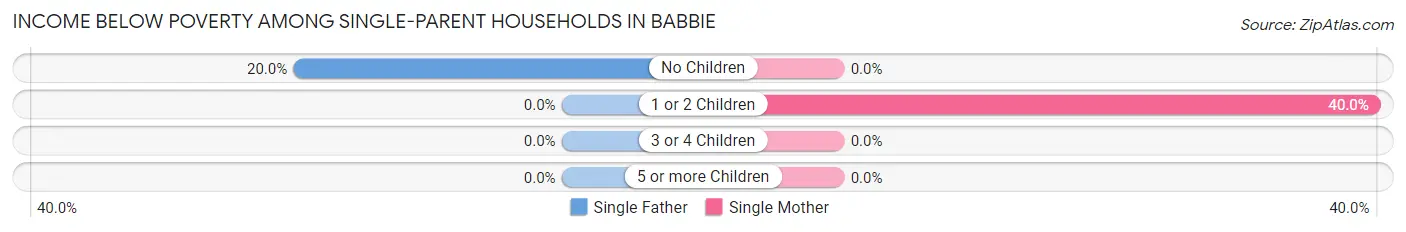
| Children | Single Father | Single Mother |
| No Children | 2 (20.0%) | 0 (0.0%) |
| 1 or 2 Children | 0 (0.0%) | 2 (40.0%) |
| 3 or 4 Children | 0 (0.0%) | 0 (0.0%) |
| 5 or more Children | 0 (0.0%) | 0 (0.0%) |
| Total | 2 (10.0%) | 2 (25.0%) |
Income Below Poverty Among Married-Couple vs Single-Parent Households in Babbie
The poverty data for Babbie shows that 7 of the married-couple family households (4.6%) and 4 of the single-parent households (14.3%) are living below the poverty level. Within the married-couple family households, those with 1 or 2 children have the highest poverty rate, with 7 households (14.0%) falling below the poverty line. Among the single-parent households, those with 1 or 2 children have the highest poverty rate, with 2 household (28.6%) living below poverty.
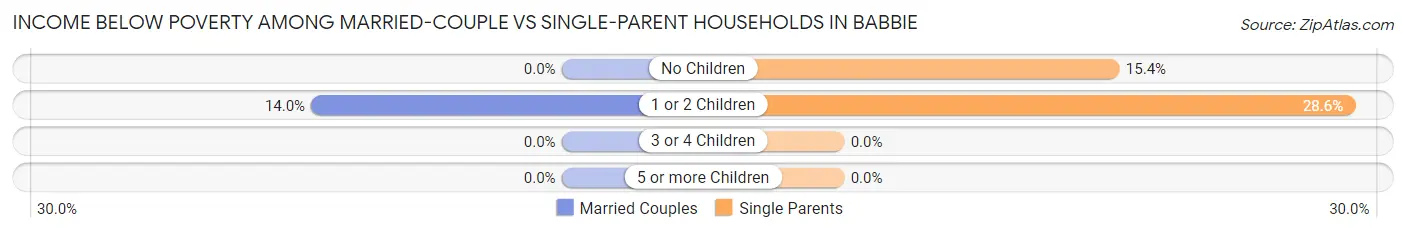
| Children | Married-Couple Families | Single-Parent Households |
| No Children | 0 (0.0%) | 2 (15.4%) |
| 1 or 2 Children | 7 (14.0%) | 2 (28.6%) |
| 3 or 4 Children | 0 (0.0%) | 0 (0.0%) |
| 5 or more Children | 0 (0.0%) | 0 (0.0%) |
| Total | 7 (4.6%) | 4 (14.3%) |
Race in Babbie
The most populous races in Babbie are White / Caucasian (564 | 98.1%), Two or more Races (8 | 1.4%), and Black / African American (3 | 0.5%).
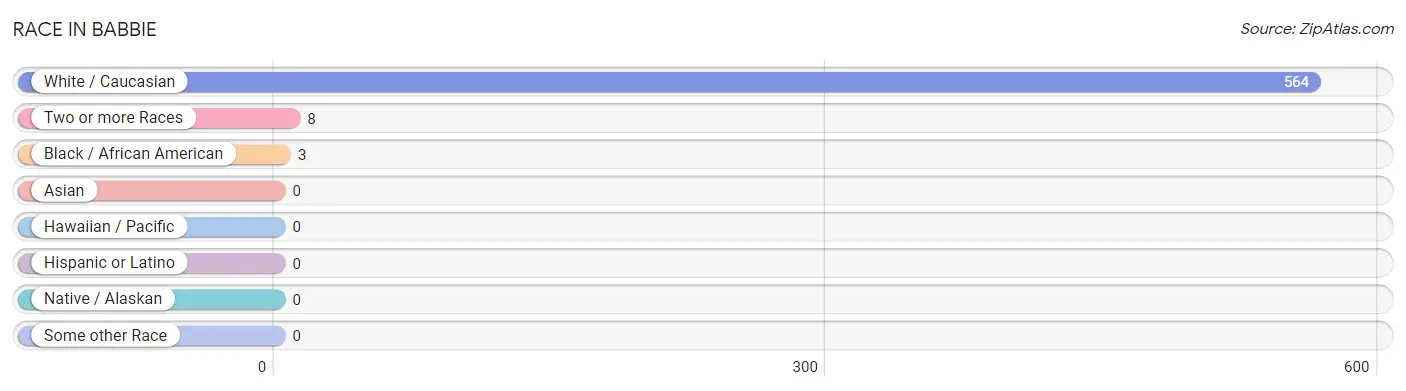
| Race | # Population | % Population |
| Asian | 0 | 0.0% |
| Black / African American | 3 | 0.5% |
| Hawaiian / Pacific | 0 | 0.0% |
| Hispanic or Latino | 0 | 0.0% |
| Native / Alaskan | 0 | 0.0% |
| White / Caucasian | 564 | 98.1% |
| Two or more Races | 8 | 1.4% |
| Some other Race | 0 | 0.0% |
| Total | 575 | 100.0% |
Ancestry in Babbie
The most populous ancestries reported in Babbie are American (114 | 19.8%), English (63 | 11.0%), Irish (27 | 4.7%), Welsh (9 | 1.6%), and German (7 | 1.2%), together accounting for 38.3% of all Babbie residents.
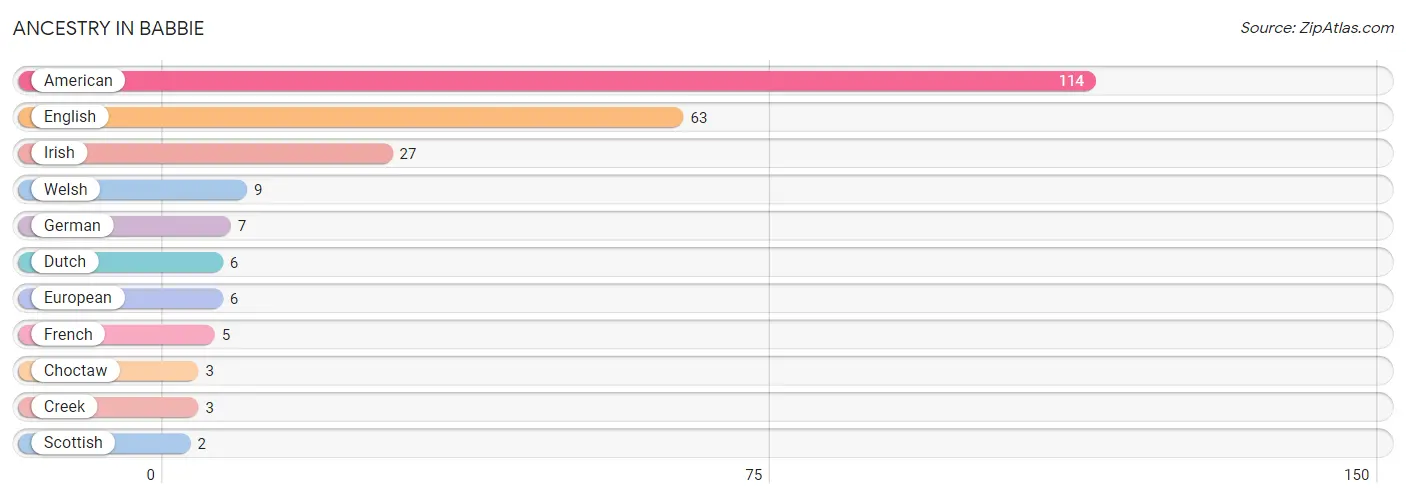
| Ancestry | # Population | % Population |
| American | 114 | 19.8% |
| Choctaw | 3 | 0.5% |
| Creek | 3 | 0.5% |
| Dutch | 6 | 1.0% |
| English | 63 | 11.0% |
| European | 6 | 1.0% |
| French | 5 | 0.9% |
| German | 7 | 1.2% |
| Irish | 27 | 4.7% |
| Scottish | 2 | 0.4% |
| Welsh | 9 | 1.6% | View All 11 Rows |
Immigrants in Babbie

| Immigration Origin | # Population | % Population | View All 0 Rows |
Sex and Age in Babbie
Sex and Age in Babbie
The most populous age groups in Babbie are Under 5 Years (47 | 16.0%) for men and 30 to 34 Years (52 | 18.5%) for women.
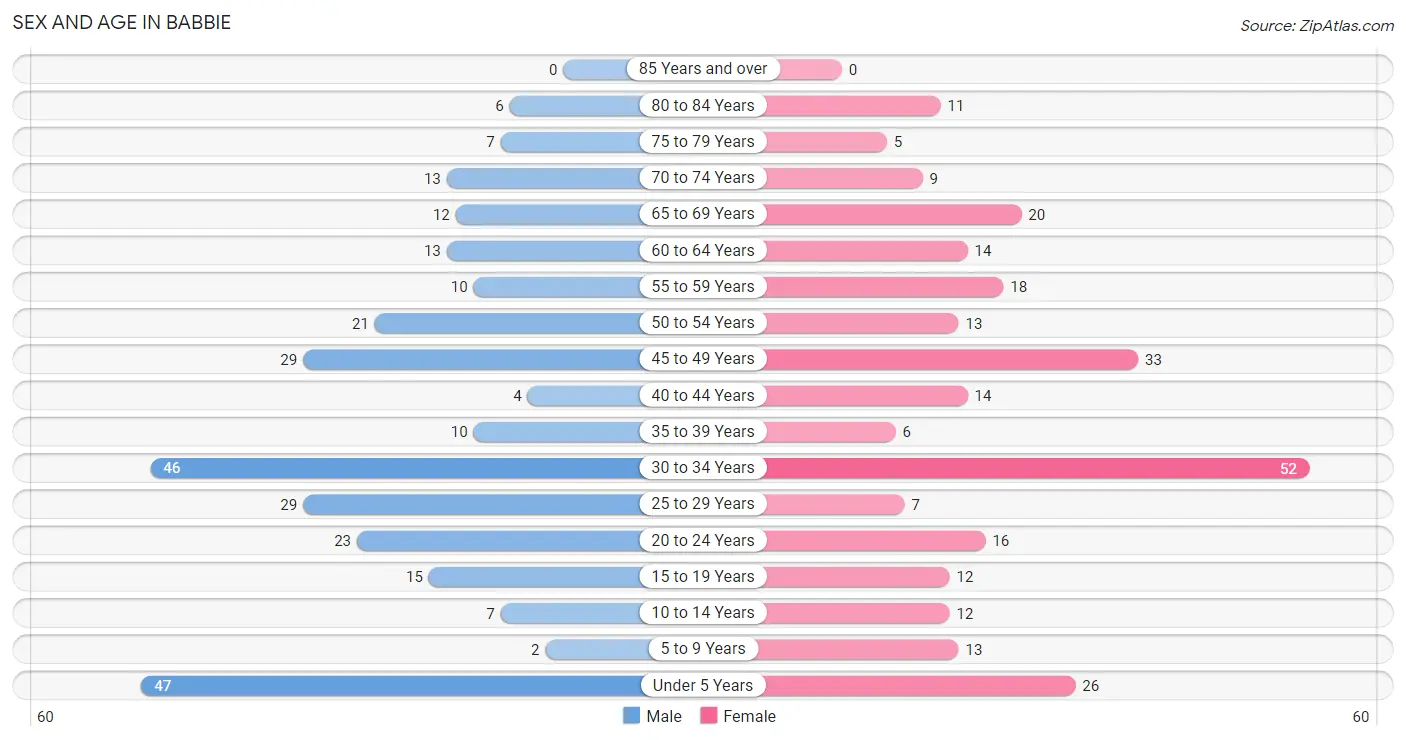
| Age Bracket | Male | Female |
| Under 5 Years | 47 (16.0%) | 26 (9.2%) |
| 5 to 9 Years | 2 (0.7%) | 13 (4.6%) |
| 10 to 14 Years | 7 (2.4%) | 12 (4.3%) |
| 15 to 19 Years | 15 (5.1%) | 12 (4.3%) |
| 20 to 24 Years | 23 (7.8%) | 16 (5.7%) |
| 25 to 29 Years | 29 (9.9%) | 7 (2.5%) |
| 30 to 34 Years | 46 (15.7%) | 52 (18.5%) |
| 35 to 39 Years | 10 (3.4%) | 6 (2.1%) |
| 40 to 44 Years | 4 (1.4%) | 14 (5.0%) |
| 45 to 49 Years | 29 (9.9%) | 33 (11.7%) |
| 50 to 54 Years | 21 (7.1%) | 13 (4.6%) |
| 55 to 59 Years | 10 (3.4%) | 18 (6.4%) |
| 60 to 64 Years | 13 (4.4%) | 14 (5.0%) |
| 65 to 69 Years | 12 (4.1%) | 20 (7.1%) |
| 70 to 74 Years | 13 (4.4%) | 9 (3.2%) |
| 75 to 79 Years | 7 (2.4%) | 5 (1.8%) |
| 80 to 84 Years | 6 (2.0%) | 11 (3.9%) |
| 85 Years and over | 0 (0.0%) | 0 (0.0%) |
| Total | 294 (100.0%) | 281 (100.0%) |
Families and Households in Babbie
Median Family Size in Babbie
The median family size in Babbie is 2.90 persons per family, with single male/father families (20 | 11.1%) accounting for the largest median family size of 3.5 persons per family. On the other hand, single female/mother families (8 | 4.4%) represent the smallest median family size with 2.50 persons per family.
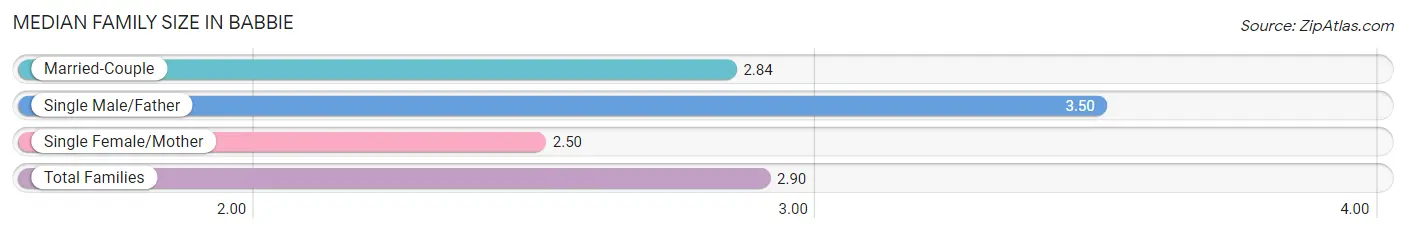
| Family Type | # Families | Family Size |
| Married-Couple | 152 (84.4%) | 2.84 |
| Single Male/Father | 20 (11.1%) | 3.50 |
| Single Female/Mother | 8 (4.4%) | 2.50 |
| Total Families | 180 (100.0%) | 2.90 |
Median Household Size in Babbie
The median household size in Babbie is 2.80 persons per household, with single male/father households (20 | 9.8%) accounting for the largest median household size of 4.6 persons per household. non-family households (25 | 12.2%) represent the smallest median household size with 1.24 persons per household.
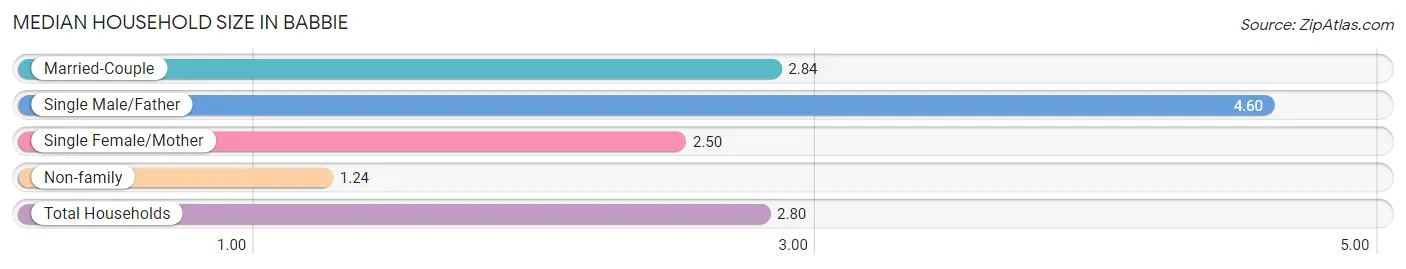
| Household Type | # Households | Household Size |
| Married-Couple | 152 (74.2%) | 2.84 |
| Single Male/Father | 20 (9.8%) | 4.60 |
| Single Female/Mother | 8 (3.9%) | 2.50 |
| Non-family | 25 (12.2%) | 1.24 |
| Total Households | 205 (100.0%) | 2.80 |
Household Size by Marriage Status in Babbie
Out of a total of 205 households in Babbie, 180 (87.8%) are family households, while 25 (12.2%) are nonfamily households. The most numerous type of family households are 2-person households, comprising 91, and the most common type of nonfamily households are 1-person households, comprising 23.
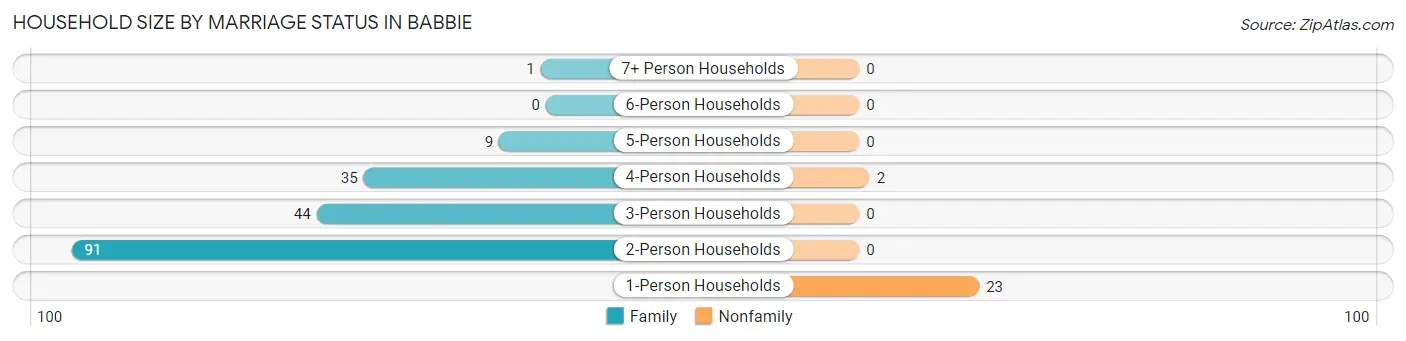
| Household Size | Family Households | Nonfamily Households |
| 1-Person Households | - | 23 (11.2%) |
| 2-Person Households | 91 (44.4%) | 0 (0.0%) |
| 3-Person Households | 44 (21.5%) | 0 (0.0%) |
| 4-Person Households | 35 (17.1%) | 2 (1.0%) |
| 5-Person Households | 9 (4.4%) | 0 (0.0%) |
| 6-Person Households | 0 (0.0%) | 0 (0.0%) |
| 7+ Person Households | 1 (0.5%) | 0 (0.0%) |
| Total | 180 (87.8%) | 25 (12.2%) |
Female Fertility in Babbie
Fertility by Age in Babbie
Average fertility rate in Babbie is 64.0 births per 1,000 women. Women in the age bracket of 35 to 50 years have the highest fertility rate with 130.0 births per 1,000 women. Women in the age bracket of 35 to 50 years acount for 77.8% of all women with births.
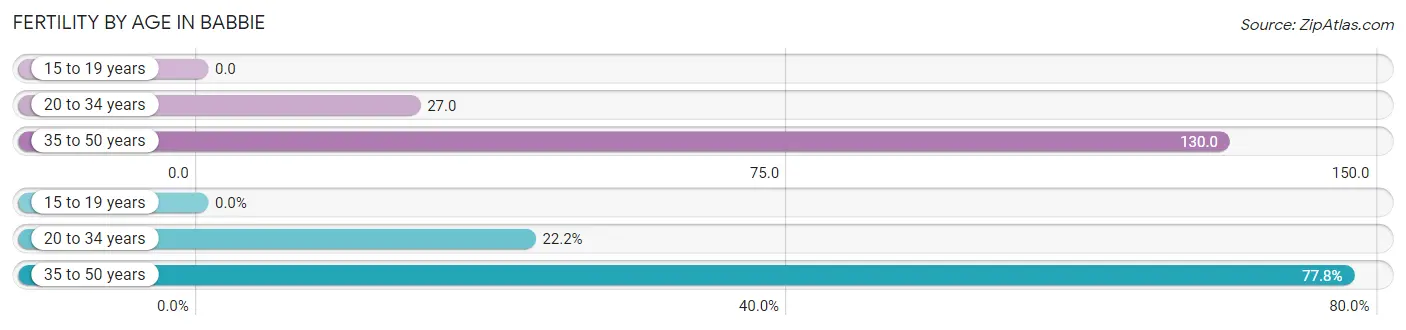
| Age Bracket | Women with Births | Births / 1,000 Women |
| 15 to 19 years | 0 (0.0%) | 0.0 |
| 20 to 34 years | 2 (22.2%) | 27.0 |
| 35 to 50 years | 7 (77.8%) | 130.0 |
| Total | 9 (100.0%) | 64.0 |
Fertility by Age by Marriage Status in Babbie
22.2% of women with births (9) in Babbie are married. The highest percentage of unmarried women with births falls into 35 to 50 years age bracket with 100.0% of them unmarried at the time of birth, while the lowest percentage of unmarried women with births belong to 20 to 34 years age bracket with 0.0% of them unmarried.
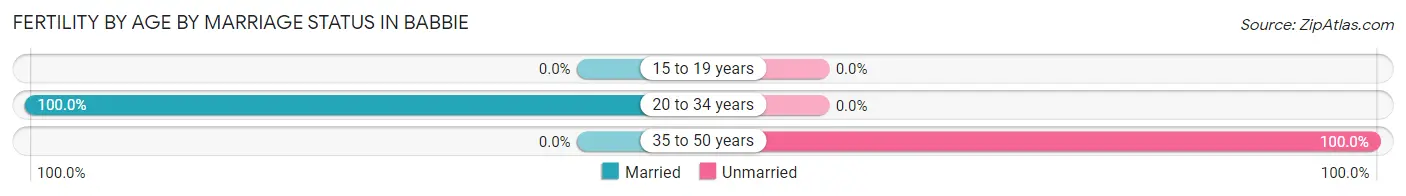
| Age Bracket | Married | Unmarried |
| 15 to 19 years | 0 (0.0%) | 0 (0.0%) |
| 20 to 34 years | 2 (100.0%) | 0 (0.0%) |
| 35 to 50 years | 0 (0.0%) | 7 (100.0%) |
| Total | 2 (22.2%) | 7 (77.8%) |
Fertility by Education in Babbie
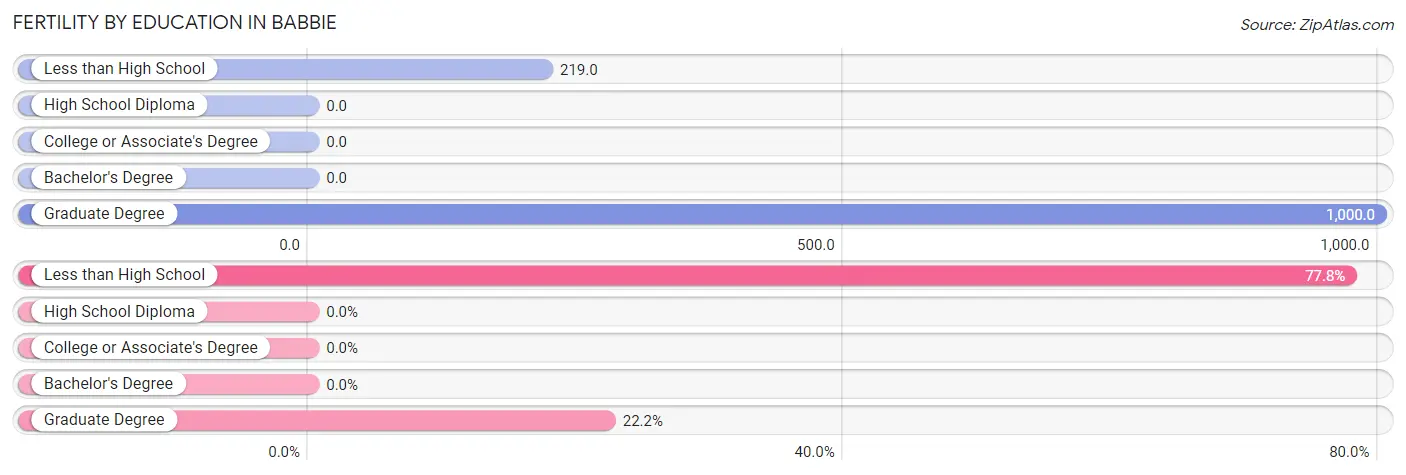
| Educational Attainment | Women with Births | Births / 1,000 Women |
| Less than High School | 7 (77.8%) | 219.0 |
| High School Diploma | 0 (0.0%) | 0.0 |
| College or Associate's Degree | 0 (0.0%) | 0.0 |
| Bachelor's Degree | 0 (0.0%) | 0.0 |
| Graduate Degree | 2 (22.2%) | 1,000.0 |
| Total | 9 (100.0%) | 64.0 |
Fertility by Education by Marriage Status in Babbie
77.8% of women with births in Babbie are unmarried. Women with the educational attainment of graduate degree are most likely to be married with 100.0% of them married at childbirth, while women with the educational attainment of less than high school are least likely to be married with 100.0% of them unmarried at childbirth.
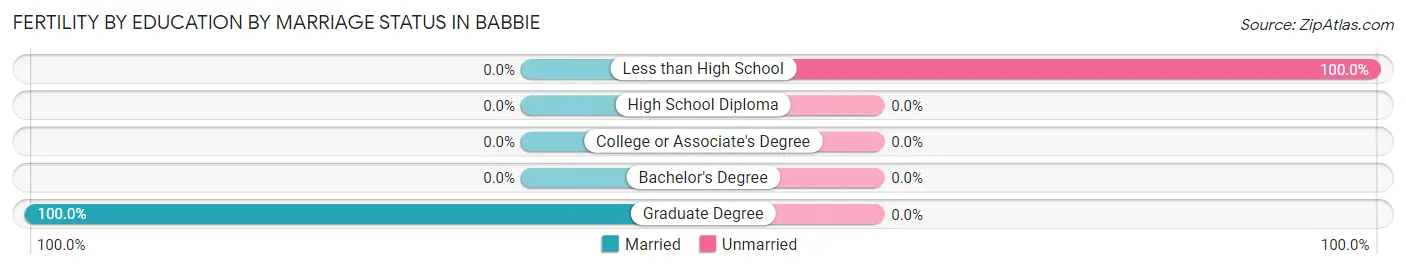
| Educational Attainment | Married | Unmarried |
| Less than High School | 0 (0.0%) | 7 (100.0%) |
| High School Diploma | 0 (0.0%) | 0 (0.0%) |
| College or Associate's Degree | 0 (0.0%) | 0 (0.0%) |
| Bachelor's Degree | 0 (0.0%) | 0 (0.0%) |
| Graduate Degree | 2 (100.0%) | 0 (0.0%) |
| Total | 2 (22.2%) | 7 (77.8%) |
Employment Characteristics in Babbie
Employment by Class of Employer in Babbie
Among the 267 employed individuals in Babbie, private company employees (152 | 56.9%), not-for-profit organizations (33 | 12.4%), and self-employed (incorporated) (30 | 11.2%) make up the most common classes of employment.
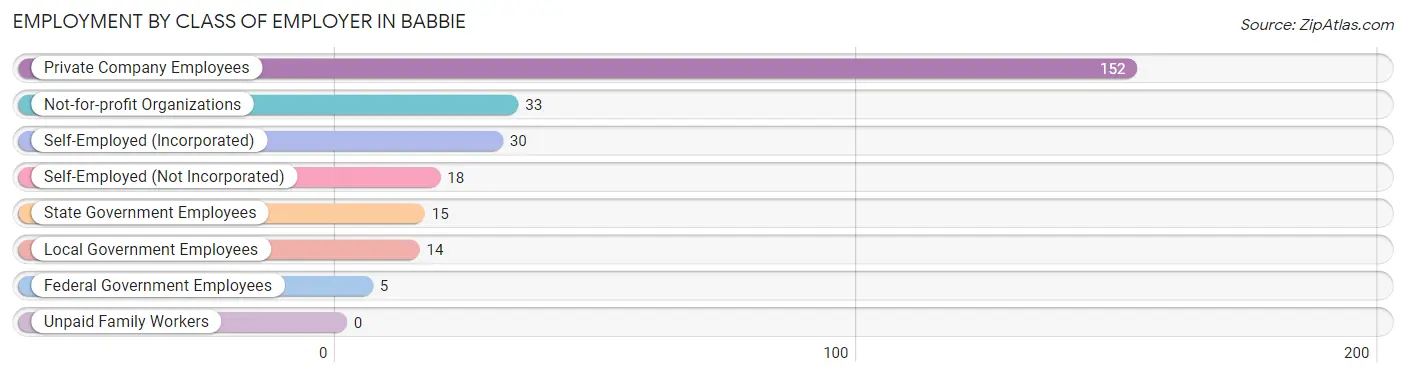
| Employer Class | # Employees | % Employees |
| Private Company Employees | 152 | 56.9% |
| Self-Employed (Incorporated) | 30 | 11.2% |
| Self-Employed (Not Incorporated) | 18 | 6.7% |
| Not-for-profit Organizations | 33 | 12.4% |
| Local Government Employees | 14 | 5.2% |
| State Government Employees | 15 | 5.6% |
| Federal Government Employees | 5 | 1.9% |
| Unpaid Family Workers | 0 | 0.0% |
| Total | 267 | 100.0% |
Employment Status by Age in Babbie
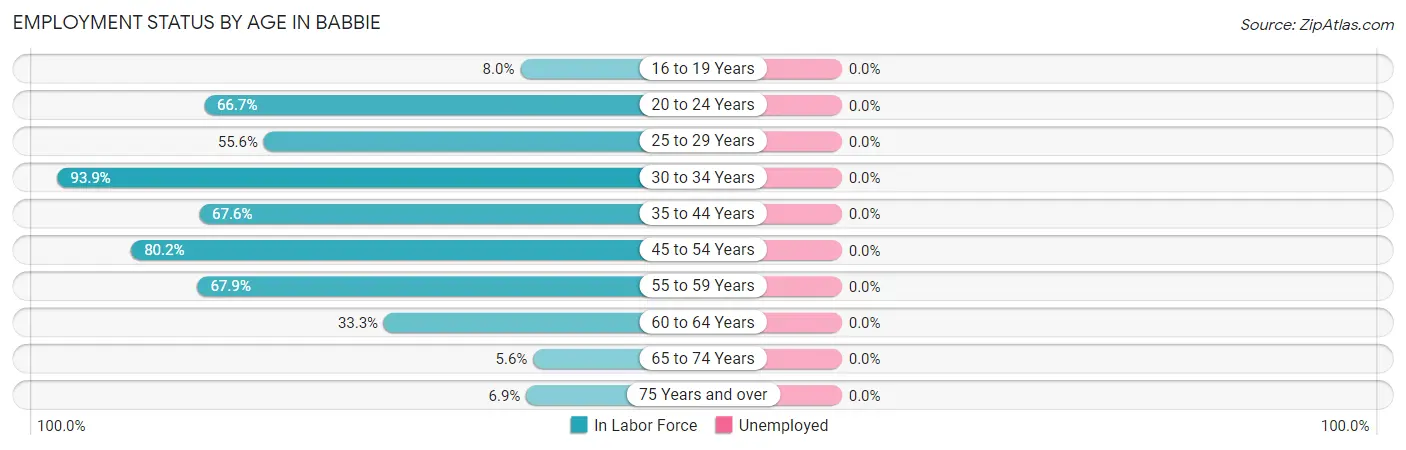
| Age Bracket | In Labor Force | Unemployed |
| 16 to 19 Years | 2 (8.0%) | 0 (0.0%) |
| 20 to 24 Years | 26 (66.7%) | 0 (0.0%) |
| 25 to 29 Years | 20 (55.6%) | 0 (0.0%) |
| 30 to 34 Years | 92 (93.9%) | 0 (0.0%) |
| 35 to 44 Years | 23 (67.6%) | 0 (0.0%) |
| 45 to 54 Years | 77 (80.2%) | 0 (0.0%) |
| 55 to 59 Years | 19 (67.9%) | 0 (0.0%) |
| 60 to 64 Years | 9 (33.3%) | 0 (0.0%) |
| 65 to 74 Years | 3 (5.6%) | 0 (0.0%) |
| 75 Years and over | 2 (6.9%) | 0 (0.0%) |
| Total | 273 (58.6%) | 0 (0.0%) |
Employment Status by Educational Attainment in Babbie
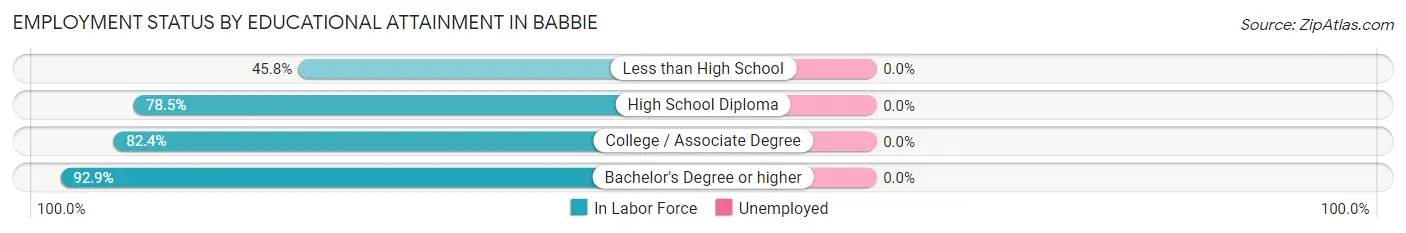
| Educational Attainment | In Labor Force | Unemployed |
| Less than High School | 27 (45.8%) | 0 (0.0%) |
| High School Diploma | 84 (78.5%) | 0 (0.0%) |
| College / Associate Degree | 103 (82.4%) | 0 (0.0%) |
| Bachelor's Degree or higher | 26 (92.9%) | 0 (0.0%) |
| Total | 240 (75.2%) | 0 (0.0%) |
Employment Occupations by Sex in Babbie
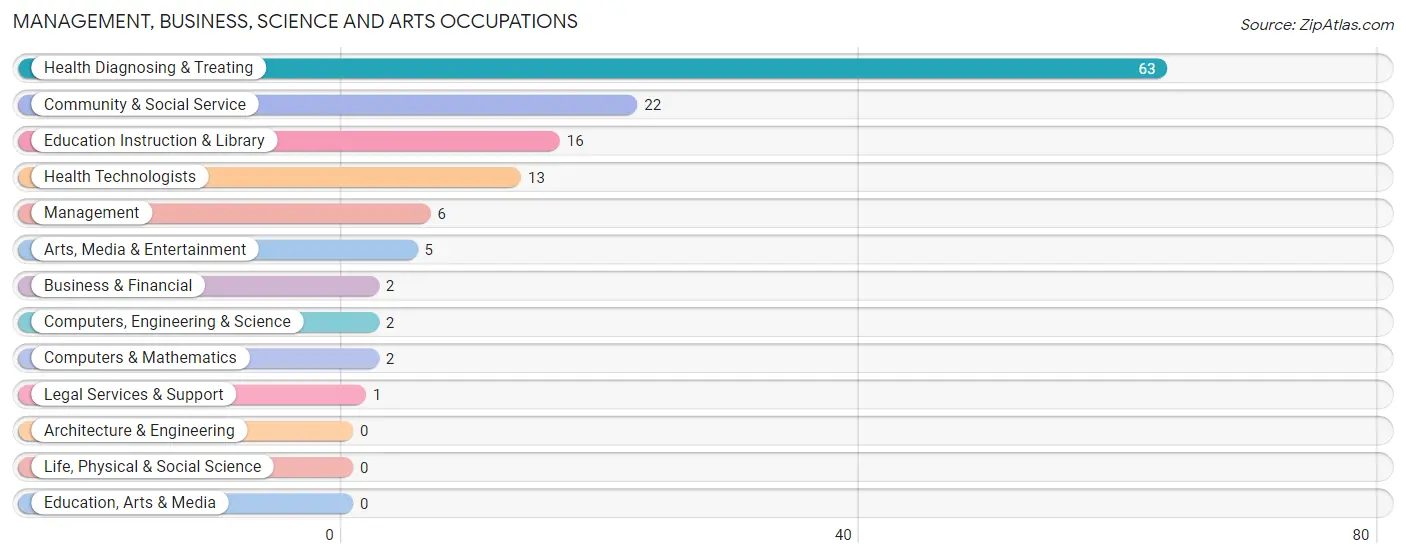
Management, Business, Science and Arts Occupations
The most common Management, Business, Science and Arts occupations in Babbie are Health Diagnosing & Treating (63 | 23.1%), Community & Social Service (22 | 8.1%), Education Instruction & Library (16 | 5.9%), Health Technologists (13 | 4.8%), and Management (6 | 2.2%).
Management, Business, Science and Arts Occupations by Sex
Within the Management, Business, Science and Arts occupations in Babbie, the most male-oriented occupations are Computers, Engineering & Science (100.0%), Computers & Mathematics (100.0%), and Management (66.7%), while the most female-oriented occupations are Business & Financial (100.0%), Legal Services & Support (100.0%), and Health Diagnosing & Treating (92.1%).
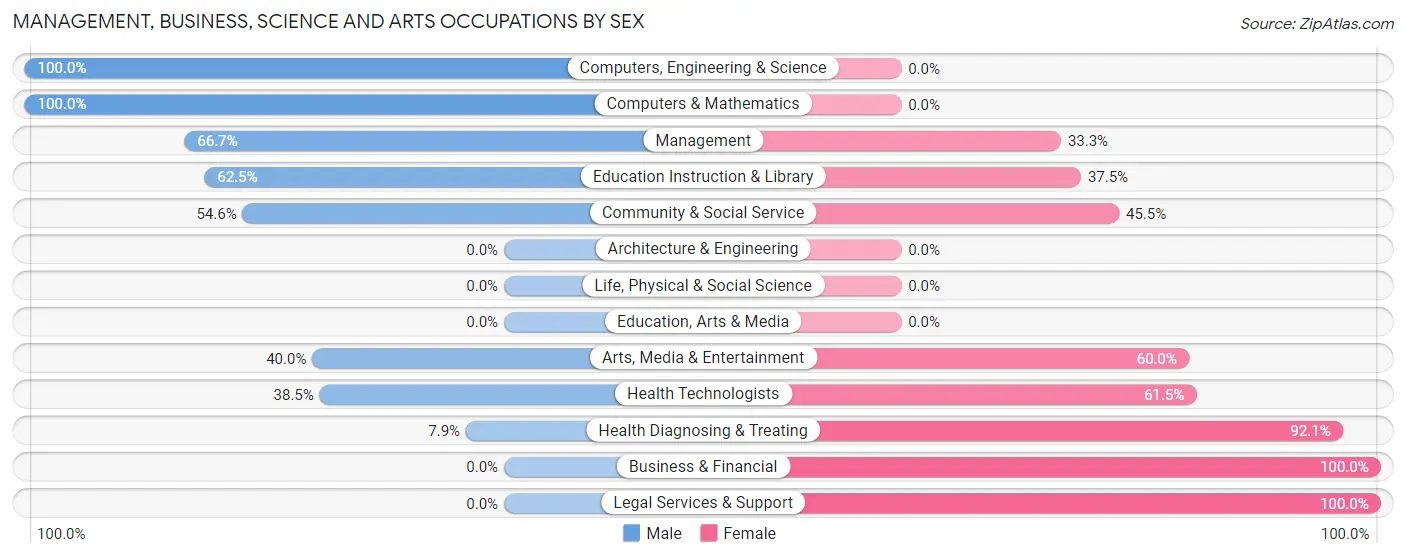
| Occupation | Male | Female |
| Management | 4 (66.7%) | 2 (33.3%) |
| Business & Financial | 0 (0.0%) | 2 (100.0%) |
| Computers, Engineering & Science | 2 (100.0%) | 0 (0.0%) |
| Computers & Mathematics | 2 (100.0%) | 0 (0.0%) |
| Architecture & Engineering | 0 (0.0%) | 0 (0.0%) |
| Life, Physical & Social Science | 0 (0.0%) | 0 (0.0%) |
| Community & Social Service | 12 (54.5%) | 10 (45.5%) |
| Education, Arts & Media | 0 (0.0%) | 0 (0.0%) |
| Legal Services & Support | 0 (0.0%) | 1 (100.0%) |
| Education Instruction & Library | 10 (62.5%) | 6 (37.5%) |
| Arts, Media & Entertainment | 2 (40.0%) | 3 (60.0%) |
| Health Diagnosing & Treating | 5 (7.9%) | 58 (92.1%) |
| Health Technologists | 5 (38.5%) | 8 (61.5%) |
| Total (Category) | 23 (24.2%) | 72 (75.8%) |
| Total (Overall) | 141 (51.6%) | 132 (48.3%) |
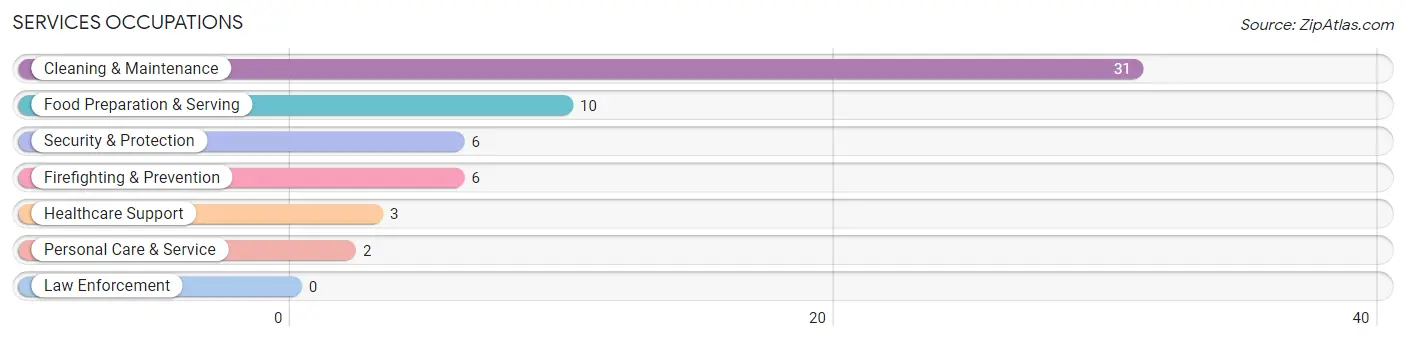
Services Occupations
The most common Services occupations in Babbie are Cleaning & Maintenance (31 | 11.4%), Food Preparation & Serving (10 | 3.7%), Security & Protection (6 | 2.2%), Firefighting & Prevention (6 | 2.2%), and Healthcare Support (3 | 1.1%).
Services Occupations by Sex
Within the Services occupations in Babbie, the most male-oriented occupations are Cleaning & Maintenance (58.1%), and Food Preparation & Serving (20.0%), while the most female-oriented occupations are Healthcare Support (100.0%), Security & Protection (100.0%), and Firefighting & Prevention (100.0%).
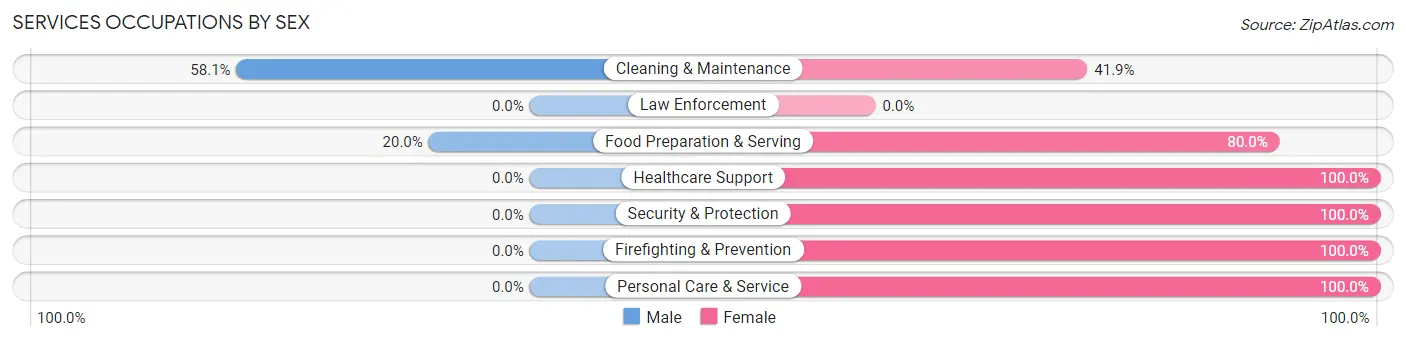
| Occupation | Male | Female |
| Healthcare Support | 0 (0.0%) | 3 (100.0%) |
| Security & Protection | 0 (0.0%) | 6 (100.0%) |
| Firefighting & Prevention | 0 (0.0%) | 6 (100.0%) |
| Law Enforcement | 0 (0.0%) | 0 (0.0%) |
| Food Preparation & Serving | 2 (20.0%) | 8 (80.0%) |
| Cleaning & Maintenance | 18 (58.1%) | 13 (41.9%) |
| Personal Care & Service | 0 (0.0%) | 2 (100.0%) |
| Total (Category) | 20 (38.5%) | 32 (61.5%) |
| Total (Overall) | 141 (51.6%) | 132 (48.3%) |
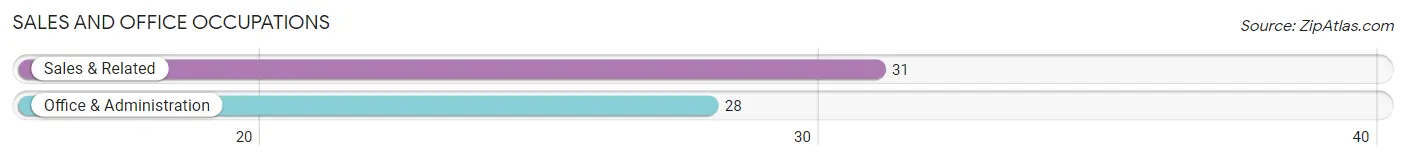
Sales and Office Occupations
The most common Sales and Office occupations in Babbie are Sales & Related (31 | 11.4%), and Office & Administration (28 | 10.3%).
Sales and Office Occupations by Sex
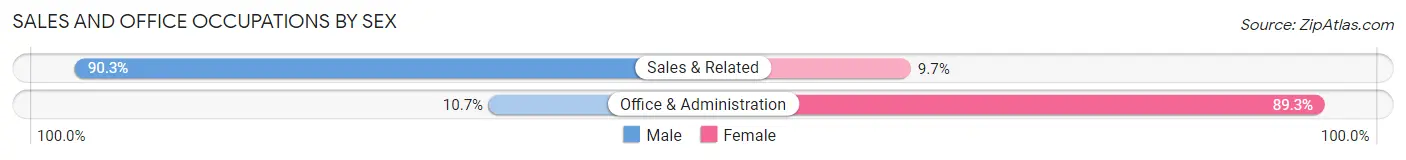
| Occupation | Male | Female |
| Sales & Related | 28 (90.3%) | 3 (9.7%) |
| Office & Administration | 3 (10.7%) | 25 (89.3%) |
| Total (Category) | 31 (52.5%) | 28 (47.5%) |
| Total (Overall) | 141 (51.6%) | 132 (48.3%) |
Natural Resources, Construction and Maintenance Occupations
The most common Natural Resources, Construction and Maintenance occupations in Babbie are Construction & Extraction (18 | 6.6%), and Installation, Maintenance & Repair (8 | 2.9%).
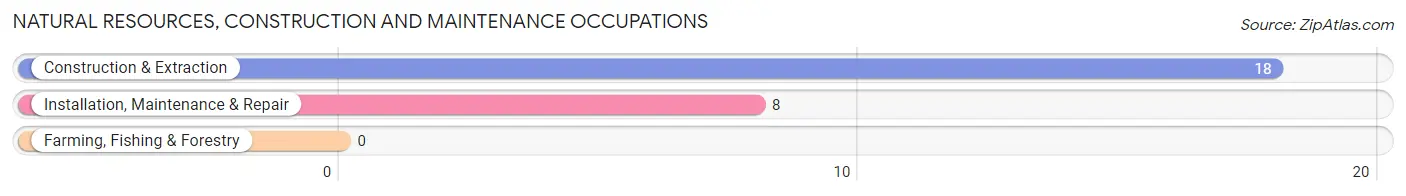
Natural Resources, Construction and Maintenance Occupations by Sex
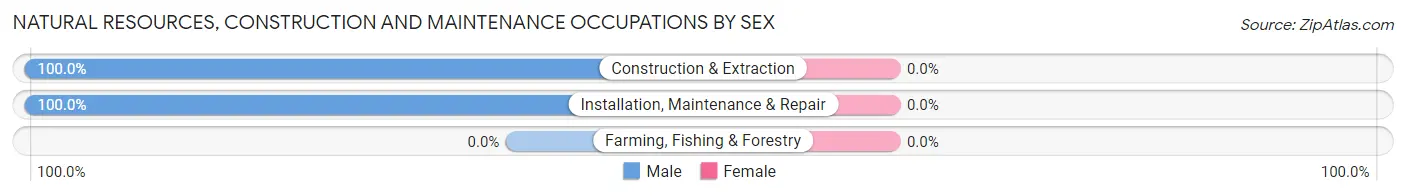
| Occupation | Male | Female |
| Farming, Fishing & Forestry | 0 (0.0%) | 0 (0.0%) |
| Construction & Extraction | 18 (100.0%) | 0 (0.0%) |
| Installation, Maintenance & Repair | 8 (100.0%) | 0 (0.0%) |
| Total (Category) | 26 (100.0%) | 0 (0.0%) |
| Total (Overall) | 141 (51.6%) | 132 (48.3%) |
Production, Transportation and Moving Occupations
The most common Production, Transportation and Moving occupations in Babbie are Transportation (22 | 8.1%), Production (17 | 6.2%), and Material Moving (2 | 0.7%).
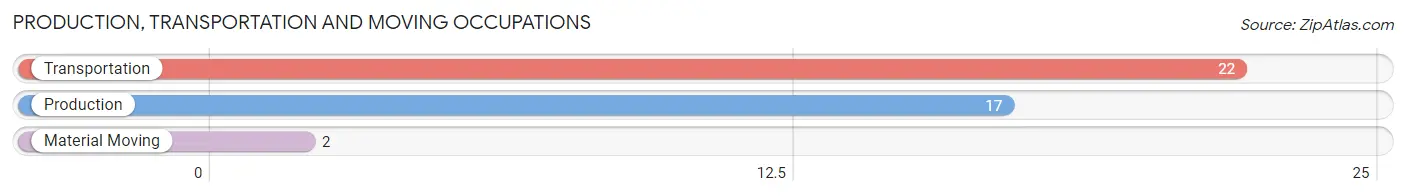
Production, Transportation and Moving Occupations by Sex
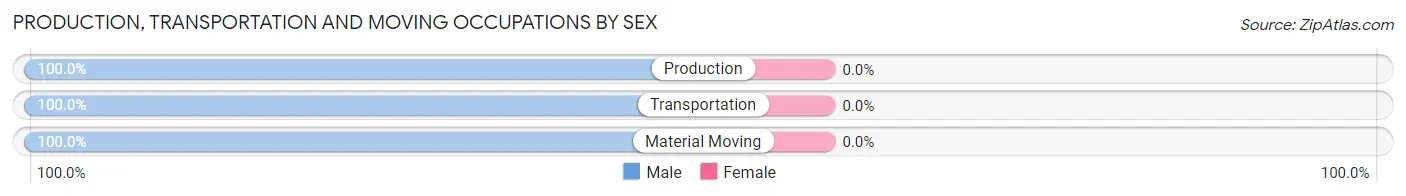
| Occupation | Male | Female |
| Production | 17 (100.0%) | 0 (0.0%) |
| Transportation | 22 (100.0%) | 0 (0.0%) |
| Material Moving | 2 (100.0%) | 0 (0.0%) |
| Total (Category) | 41 (100.0%) | 0 (0.0%) |
| Total (Overall) | 141 (51.6%) | 132 (48.3%) |
Employment Industries by Sex in Babbie
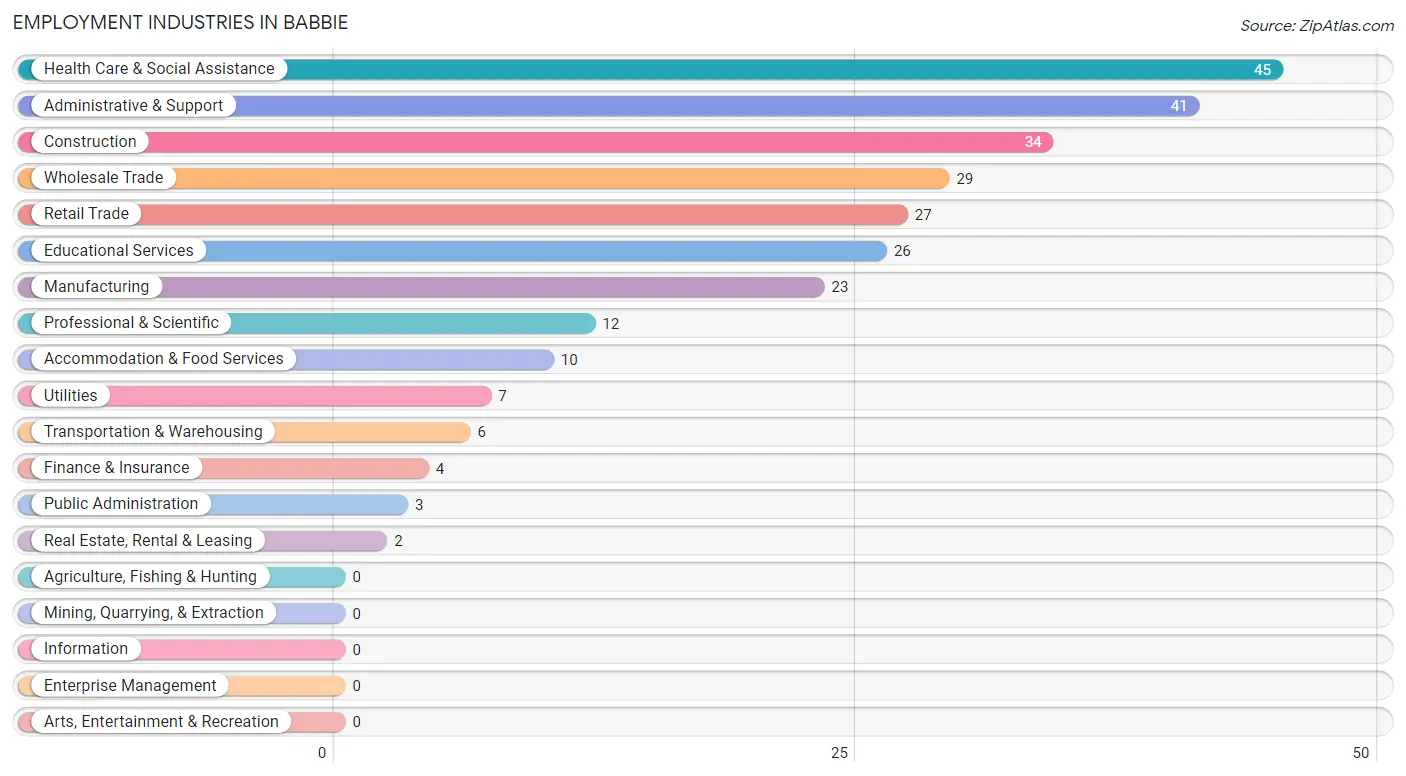
Employment Industries in Babbie
The major employment industries in Babbie include Health Care & Social Assistance (45 | 16.5%), Administrative & Support (41 | 15.0%), Construction (34 | 12.4%), Wholesale Trade (29 | 10.6%), and Retail Trade (27 | 9.9%).
Employment Industries by Sex in Babbie
The Babbie industries that see more men than women are Wholesale Trade (100.0%), Transportation & Warehousing (100.0%), and Utilities (100.0%), whereas the industries that tend to have a higher number of women are Finance & Insurance (100.0%), Real Estate, Rental & Leasing (100.0%), and Public Administration (100.0%).
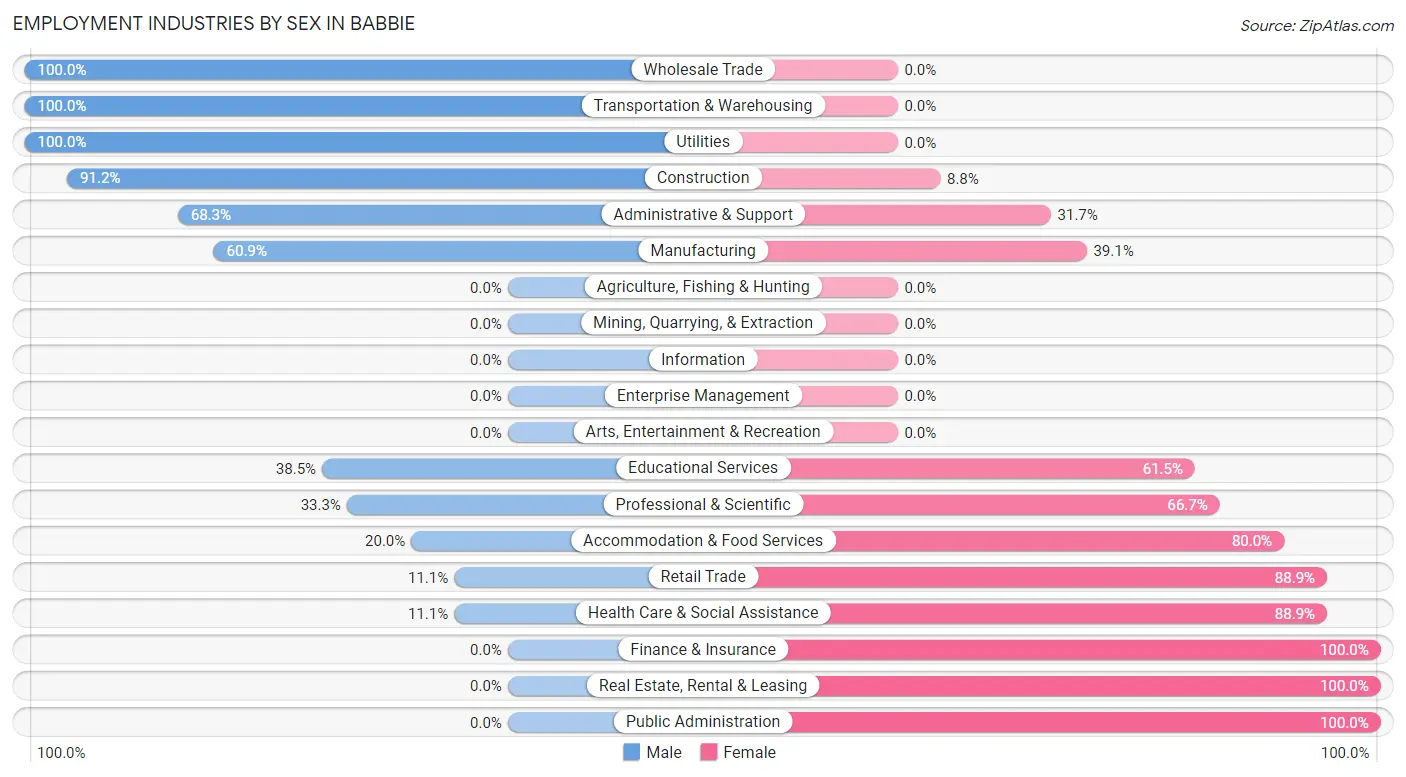
| Industry | Male | Female |
| Agriculture, Fishing & Hunting | 0 (0.0%) | 0 (0.0%) |
| Mining, Quarrying, & Extraction | 0 (0.0%) | 0 (0.0%) |
| Construction | 31 (91.2%) | 3 (8.8%) |
| Manufacturing | 14 (60.9%) | 9 (39.1%) |
| Wholesale Trade | 29 (100.0%) | 0 (0.0%) |
| Retail Trade | 3 (11.1%) | 24 (88.9%) |
| Transportation & Warehousing | 6 (100.0%) | 0 (0.0%) |
| Utilities | 7 (100.0%) | 0 (0.0%) |
| Information | 0 (0.0%) | 0 (0.0%) |
| Finance & Insurance | 0 (0.0%) | 4 (100.0%) |
| Real Estate, Rental & Leasing | 0 (0.0%) | 2 (100.0%) |
| Professional & Scientific | 4 (33.3%) | 8 (66.7%) |
| Enterprise Management | 0 (0.0%) | 0 (0.0%) |
| Administrative & Support | 28 (68.3%) | 13 (31.7%) |
| Educational Services | 10 (38.5%) | 16 (61.5%) |
| Health Care & Social Assistance | 5 (11.1%) | 40 (88.9%) |
| Arts, Entertainment & Recreation | 0 (0.0%) | 0 (0.0%) |
| Accommodation & Food Services | 2 (20.0%) | 8 (80.0%) |
| Public Administration | 0 (0.0%) | 3 (100.0%) |
| Total | 141 (51.6%) | 132 (48.3%) |
Education in Babbie
School Enrollment in Babbie
The most common levels of schooling among the 77 students in Babbie are high school (30 | 39.0%), college / undergraduate (17 | 22.1%), and elementary school (12 | 15.6%).
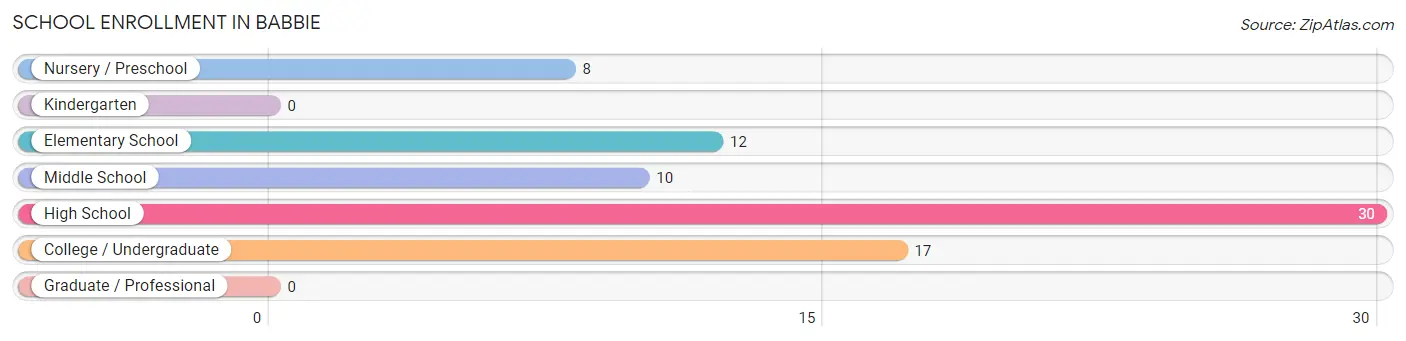
| School Level | # Students | % Students |
| Nursery / Preschool | 8 | 10.4% |
| Kindergarten | 0 | 0.0% |
| Elementary School | 12 | 15.6% |
| Middle School | 10 | 13.0% |
| High School | 30 | 39.0% |
| College / Undergraduate | 17 | 22.1% |
| Graduate / Professional | 0 | 0.0% |
| Total | 77 | 100.0% |
School Enrollment by Age by Funding Source in Babbie
Out of a total of 77 students who are enrolled in schools in Babbie, 16 (20.8%) attend a private institution, while the remaining 61 (79.2%) are enrolled in public schools. The age group of 35 years and over has the highest likelihood of being enrolled in private schools, with 4 (100.0% in the age bracket) enrolled. Conversely, the age group of 3 to 4 year olds has the lowest likelihood of being enrolled in a private school, with 3 (100.0% in the age bracket) attending a public institution.
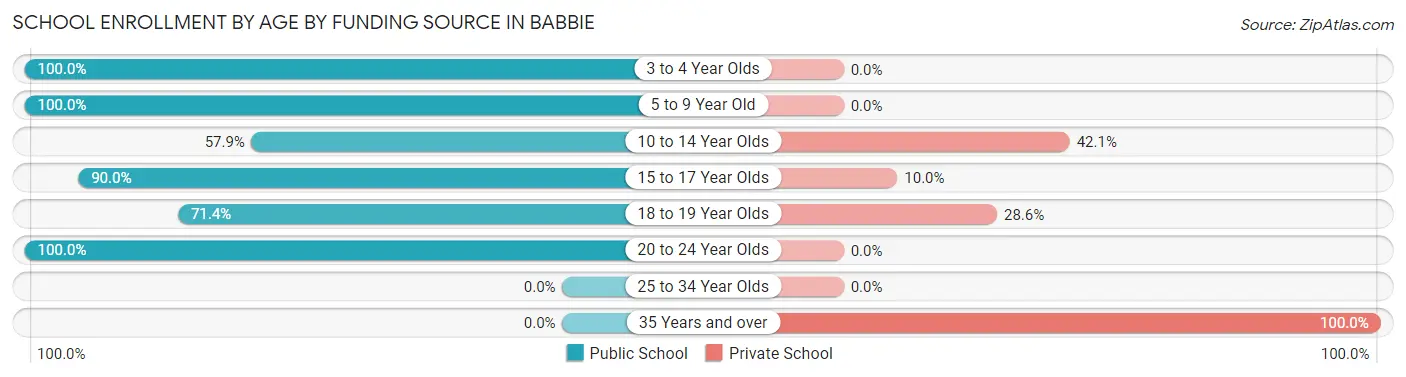
| Age Bracket | Public School | Private School |
| 3 to 4 Year Olds | 3 (100.0%) | 0 (0.0%) |
| 5 to 9 Year Old | 14 (100.0%) | 0 (0.0%) |
| 10 to 14 Year Olds | 11 (57.9%) | 8 (42.1%) |
| 15 to 17 Year Olds | 18 (90.0%) | 2 (10.0%) |
| 18 to 19 Year Olds | 5 (71.4%) | 2 (28.6%) |
| 20 to 24 Year Olds | 10 (100.0%) | 0 (0.0%) |
| 25 to 34 Year Olds | 0 (0.0%) | 0 (0.0%) |
| 35 Years and over | 0 (0.0%) | 4 (100.0%) |
| Total | 61 (79.2%) | 16 (20.8%) |
Educational Attainment by Field of Study in Babbie
Bio, nature & agricultural (10 | 31.2%), education (9 | 28.1%), arts & humanities (5 | 15.6%), science & technology (4 | 12.5%), and business (4 | 12.5%) are the most common fields of study among 32 individuals in Babbie who have obtained a bachelor's degree or higher.
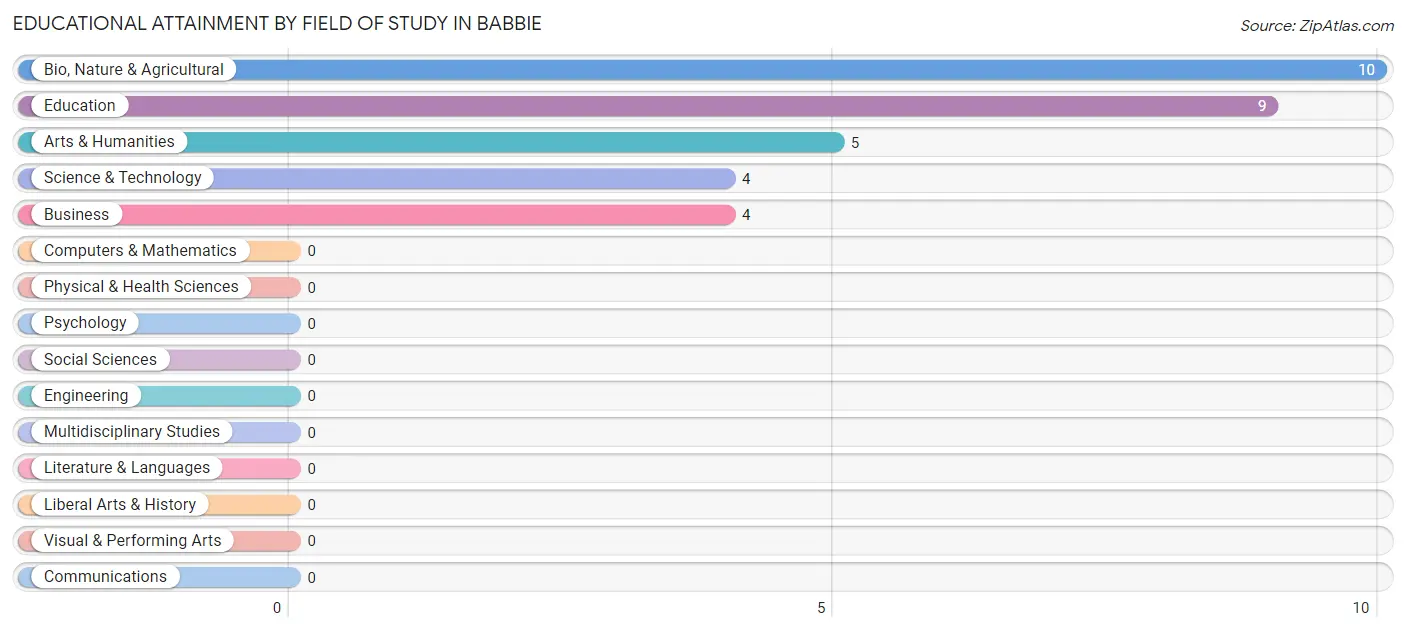
| Field of Study | # Graduates | % Graduates |
| Computers & Mathematics | 0 | 0.0% |
| Bio, Nature & Agricultural | 10 | 31.2% |
| Physical & Health Sciences | 0 | 0.0% |
| Psychology | 0 | 0.0% |
| Social Sciences | 0 | 0.0% |
| Engineering | 0 | 0.0% |
| Multidisciplinary Studies | 0 | 0.0% |
| Science & Technology | 4 | 12.5% |
| Business | 4 | 12.5% |
| Education | 9 | 28.1% |
| Literature & Languages | 0 | 0.0% |
| Liberal Arts & History | 0 | 0.0% |
| Visual & Performing Arts | 0 | 0.0% |
| Communications | 0 | 0.0% |
| Arts & Humanities | 5 | 15.6% |
| Total | 32 | 100.0% |
Transportation & Commute in Babbie
Vehicle Availability by Sex in Babbie
The most prevalent vehicle ownership categories in Babbie are males with 2 vehicles (56, accounting for 40.9%) and females with 2 vehicles (72, making up 43.1%).
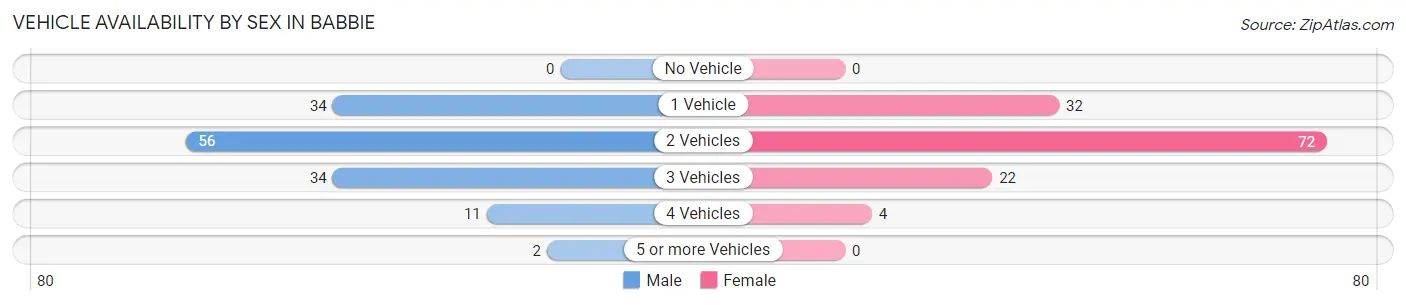
| Vehicles Available | Male | Female |
| No Vehicle | 0 (0.0%) | 0 (0.0%) |
| 1 Vehicle | 34 (24.8%) | 32 (24.6%) |
| 2 Vehicles | 56 (40.9%) | 72 (55.4%) |
| 3 Vehicles | 34 (24.8%) | 22 (16.9%) |
| 4 Vehicles | 11 (8.0%) | 4 (3.1%) |
| 5 or more Vehicles | 2 (1.5%) | 0 (0.0%) |
| Total | 137 (100.0%) | 130 (100.0%) |
Commute Time in Babbie
The most frequently occuring commute durations in Babbie are 10 to 14 minutes (82 commuters, 31.5%), 45 to 59 minutes (48 commuters, 18.5%), and 15 to 19 minutes (40 commuters, 15.4%).
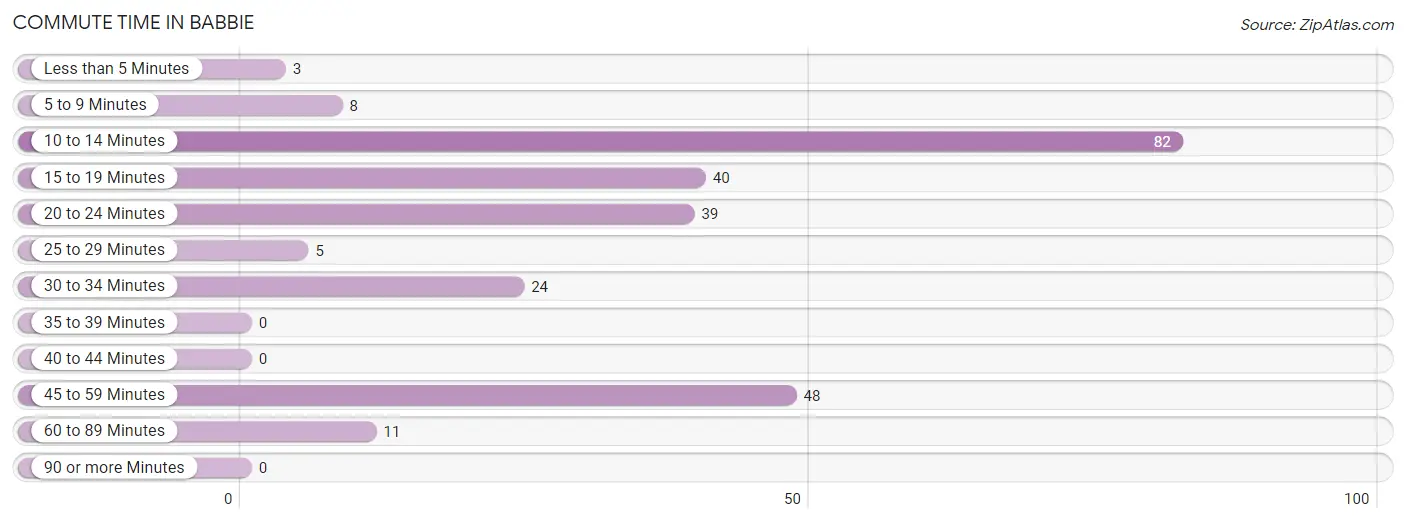
| Commute Time | # Commuters | % Commuters |
| Less than 5 Minutes | 3 | 1.1% |
| 5 to 9 Minutes | 8 | 3.1% |
| 10 to 14 Minutes | 82 | 31.5% |
| 15 to 19 Minutes | 40 | 15.4% |
| 20 to 24 Minutes | 39 | 15.0% |
| 25 to 29 Minutes | 5 | 1.9% |
| 30 to 34 Minutes | 24 | 9.2% |
| 35 to 39 Minutes | 0 | 0.0% |
| 40 to 44 Minutes | 0 | 0.0% |
| 45 to 59 Minutes | 48 | 18.5% |
| 60 to 89 Minutes | 11 | 4.2% |
| 90 or more Minutes | 0 | 0.0% |
Commute Time by Sex in Babbie
The most common commute times in Babbie are 45 to 59 minutes (40 commuters, 30.5%) for males and 10 to 14 minutes (69 commuters, 53.5%) for females.
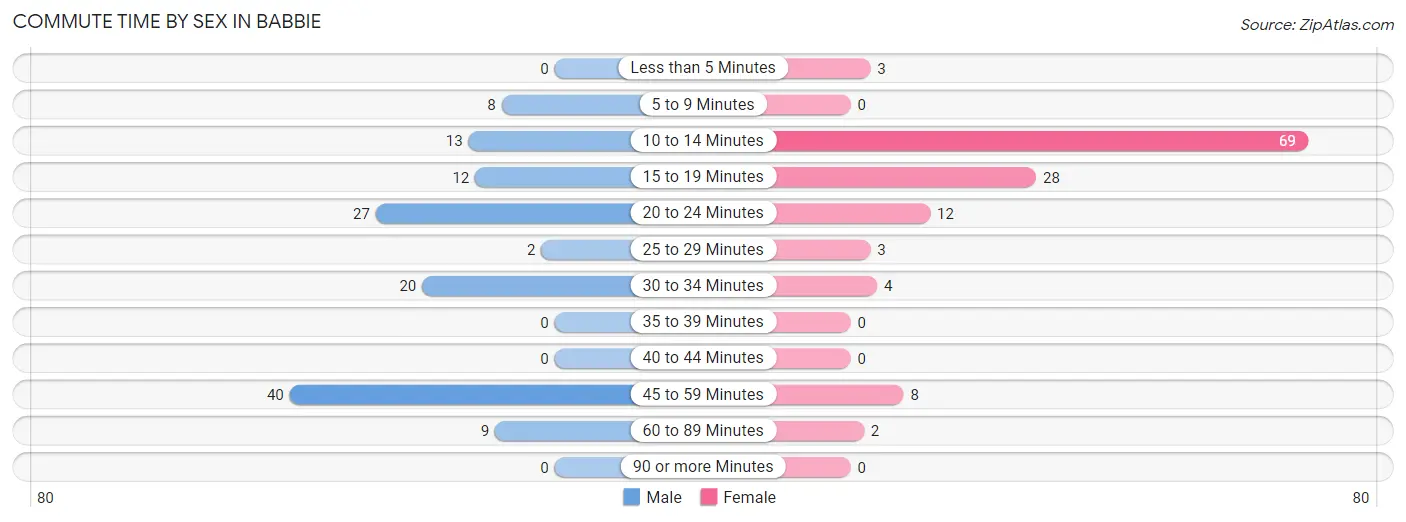
| Commute Time | Male | Female |
| Less than 5 Minutes | 0 (0.0%) | 3 (2.3%) |
| 5 to 9 Minutes | 8 (6.1%) | 0 (0.0%) |
| 10 to 14 Minutes | 13 (9.9%) | 69 (53.5%) |
| 15 to 19 Minutes | 12 (9.2%) | 28 (21.7%) |
| 20 to 24 Minutes | 27 (20.6%) | 12 (9.3%) |
| 25 to 29 Minutes | 2 (1.5%) | 3 (2.3%) |
| 30 to 34 Minutes | 20 (15.3%) | 4 (3.1%) |
| 35 to 39 Minutes | 0 (0.0%) | 0 (0.0%) |
| 40 to 44 Minutes | 0 (0.0%) | 0 (0.0%) |
| 45 to 59 Minutes | 40 (30.5%) | 8 (6.2%) |
| 60 to 89 Minutes | 9 (6.9%) | 2 (1.5%) |
| 90 or more Minutes | 0 (0.0%) | 0 (0.0%) |
Time of Departure to Work by Sex in Babbie
The most frequent times of departure to work in Babbie are 7:00 AM to 7:29 AM (51, 38.9%) for males and 7:30 AM to 7:59 AM (45, 34.9%) for females.
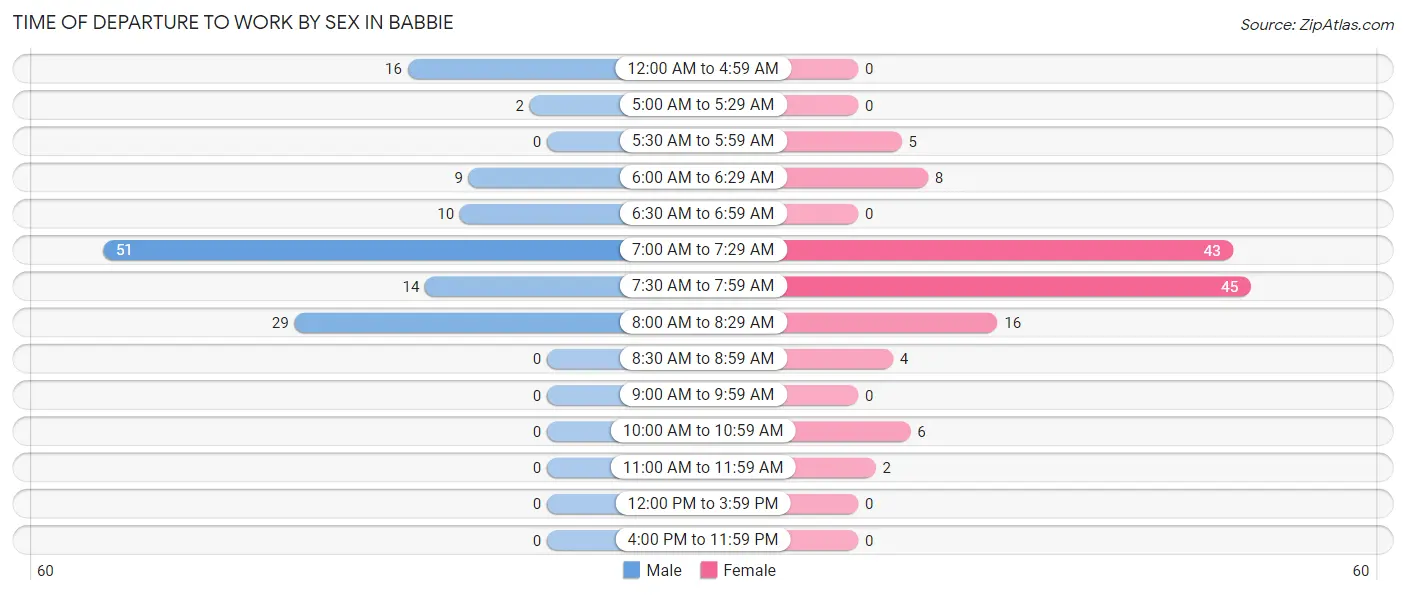
| Time of Departure | Male | Female |
| 12:00 AM to 4:59 AM | 16 (12.2%) | 0 (0.0%) |
| 5:00 AM to 5:29 AM | 2 (1.5%) | 0 (0.0%) |
| 5:30 AM to 5:59 AM | 0 (0.0%) | 5 (3.9%) |
| 6:00 AM to 6:29 AM | 9 (6.9%) | 8 (6.2%) |
| 6:30 AM to 6:59 AM | 10 (7.6%) | 0 (0.0%) |
| 7:00 AM to 7:29 AM | 51 (38.9%) | 43 (33.3%) |
| 7:30 AM to 7:59 AM | 14 (10.7%) | 45 (34.9%) |
| 8:00 AM to 8:29 AM | 29 (22.1%) | 16 (12.4%) |
| 8:30 AM to 8:59 AM | 0 (0.0%) | 4 (3.1%) |
| 9:00 AM to 9:59 AM | 0 (0.0%) | 0 (0.0%) |
| 10:00 AM to 10:59 AM | 0 (0.0%) | 6 (4.6%) |
| 11:00 AM to 11:59 AM | 0 (0.0%) | 2 (1.5%) |
| 12:00 PM to 3:59 PM | 0 (0.0%) | 0 (0.0%) |
| 4:00 PM to 11:59 PM | 0 (0.0%) | 0 (0.0%) |
| Total | 131 (100.0%) | 129 (100.0%) |
Housing Occupancy in Babbie
Occupancy by Ownership in Babbie
Of the total 205 dwellings in Babbie, owner-occupied units account for 186 (90.7%), while renter-occupied units make up 19 (9.3%).
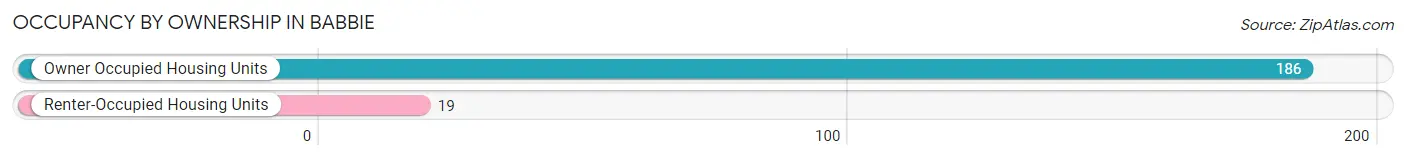
| Occupancy | # Housing Units | % Housing Units |
| Owner Occupied Housing Units | 186 | 90.7% |
| Renter-Occupied Housing Units | 19 | 9.3% |
| Total Occupied Housing Units | 205 | 100.0% |
Occupancy by Household Size in Babbie
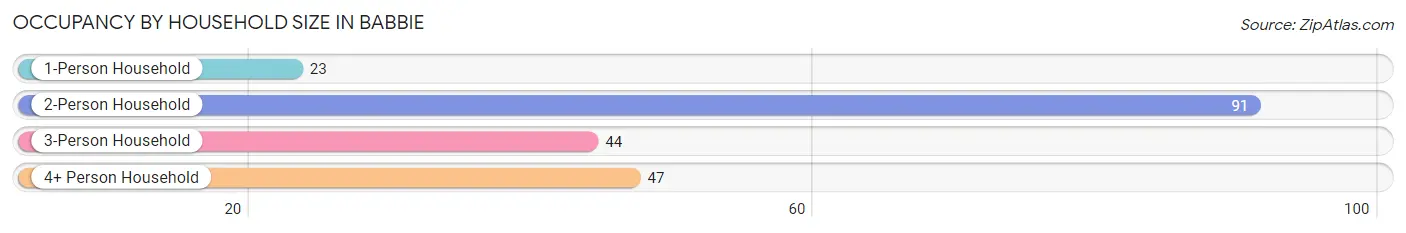
| Household Size | # Housing Units | % Housing Units |
| 1-Person Household | 23 | 11.2% |
| 2-Person Household | 91 | 44.4% |
| 3-Person Household | 44 | 21.5% |
| 4+ Person Household | 47 | 22.9% |
| Total Housing Units | 205 | 100.0% |
Occupancy by Ownership by Household Size in Babbie
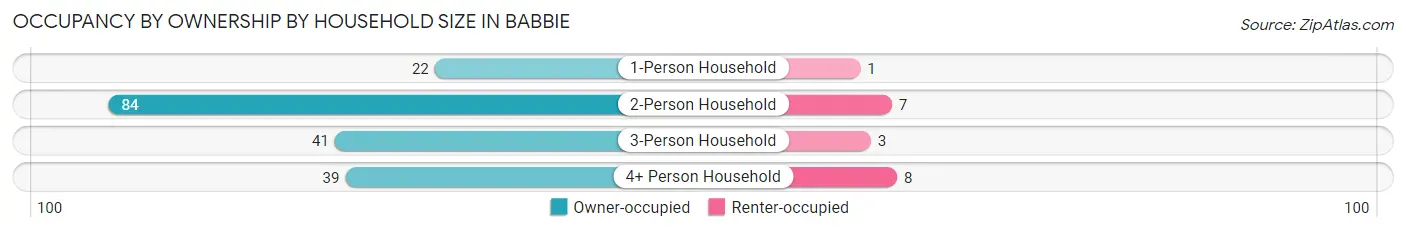
| Household Size | Owner-occupied | Renter-occupied |
| 1-Person Household | 22 (95.7%) | 1 (4.3%) |
| 2-Person Household | 84 (92.3%) | 7 (7.7%) |
| 3-Person Household | 41 (93.2%) | 3 (6.8%) |
| 4+ Person Household | 39 (83.0%) | 8 (17.0%) |
| Total Housing Units | 186 (90.7%) | 19 (9.3%) |
Occupancy by Educational Attainment in Babbie
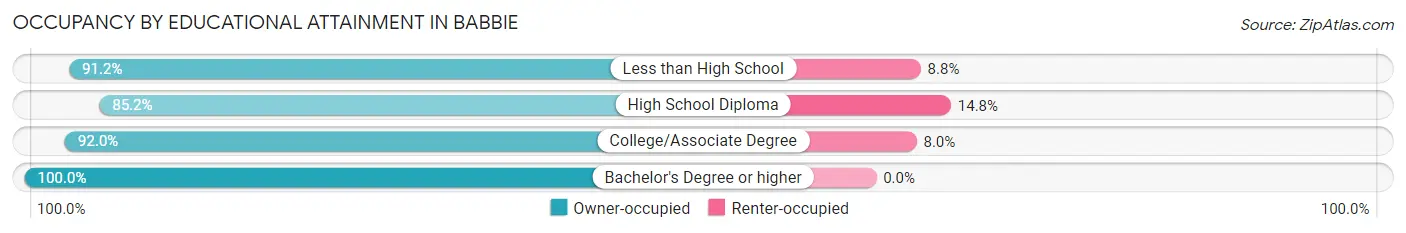
| Household Size | Owner-occupied | Renter-occupied |
| Less than High School | 31 (91.2%) | 3 (8.8%) |
| High School Diploma | 46 (85.2%) | 8 (14.8%) |
| College/Associate Degree | 92 (92.0%) | 8 (8.0%) |
| Bachelor's Degree or higher | 17 (100.0%) | 0 (0.0%) |
Occupancy by Age of Householder in Babbie
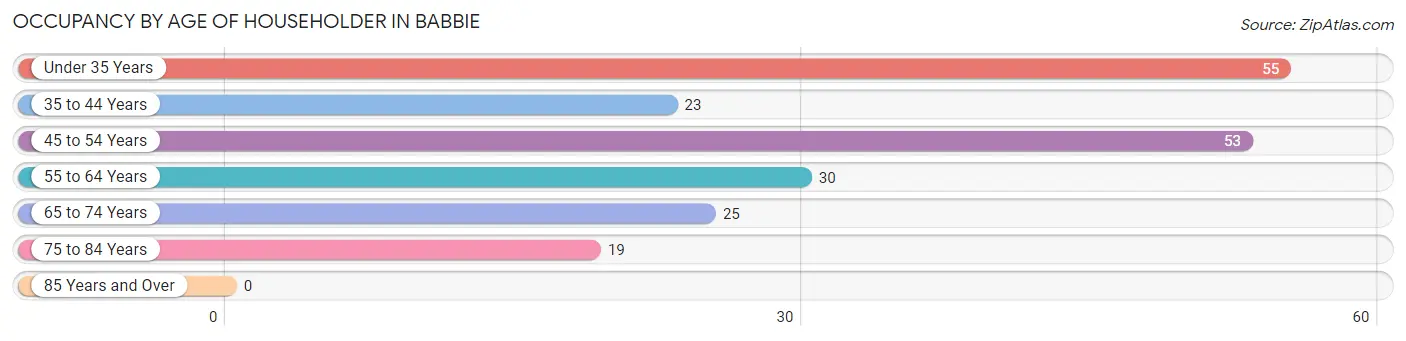
| Age Bracket | # Households | % Households |
| Under 35 Years | 55 | 26.8% |
| 35 to 44 Years | 23 | 11.2% |
| 45 to 54 Years | 53 | 25.9% |
| 55 to 64 Years | 30 | 14.6% |
| 65 to 74 Years | 25 | 12.2% |
| 75 to 84 Years | 19 | 9.3% |
| 85 Years and Over | 0 | 0.0% |
| Total | 205 | 100.0% |
Housing Finances in Babbie
Median Income by Occupancy in Babbie
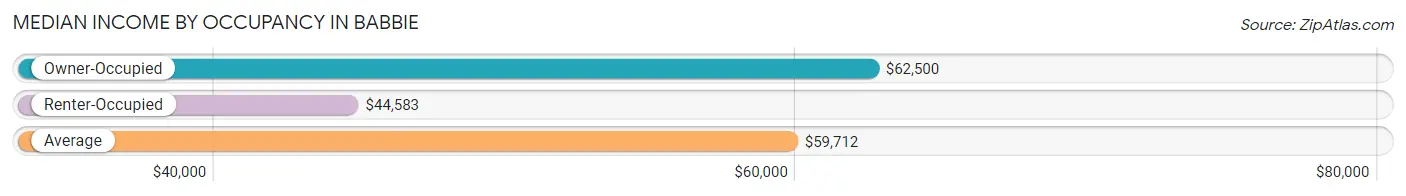
| Occupancy Type | # Households | Median Income |
| Owner-Occupied | 186 (90.7%) | $62,500 |
| Renter-Occupied | 19 (9.3%) | $44,583 |
| Average | 205 (100.0%) | $59,712 |
Occupancy by Householder Income Bracket in Babbie
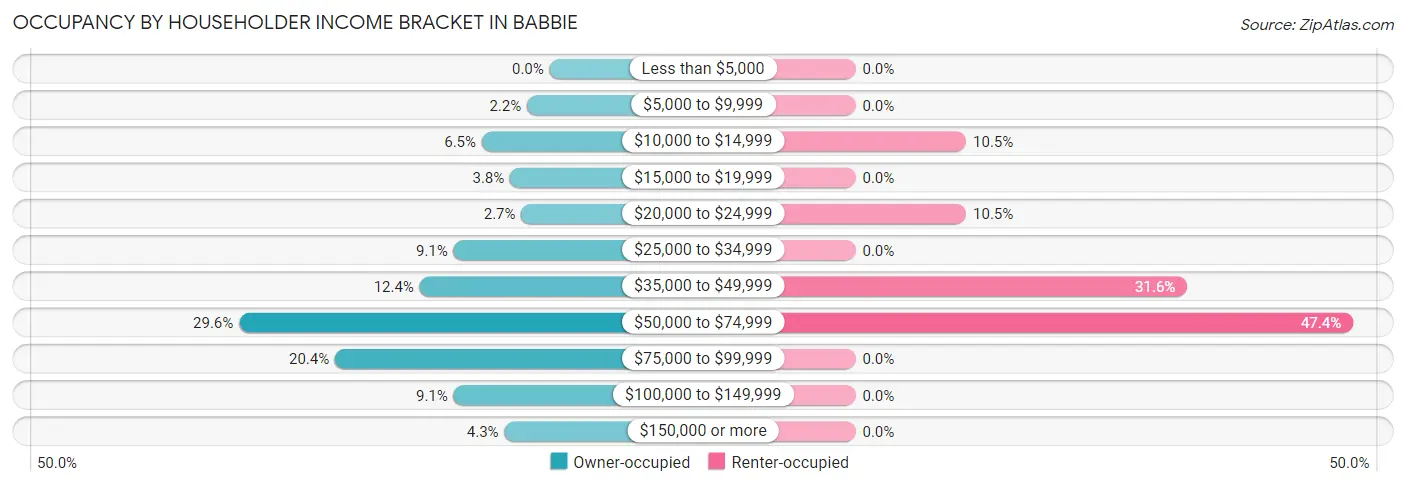
| Income Bracket | Owner-occupied | Renter-occupied |
| Less than $5,000 | 0 (0.0%) | 0 (0.0%) |
| $5,000 to $9,999 | 4 (2.1%) | 0 (0.0%) |
| $10,000 to $14,999 | 12 (6.5%) | 2 (10.5%) |
| $15,000 to $19,999 | 7 (3.8%) | 0 (0.0%) |
| $20,000 to $24,999 | 5 (2.7%) | 2 (10.5%) |
| $25,000 to $34,999 | 17 (9.1%) | 0 (0.0%) |
| $35,000 to $49,999 | 23 (12.4%) | 6 (31.6%) |
| $50,000 to $74,999 | 55 (29.6%) | 9 (47.4%) |
| $75,000 to $99,999 | 38 (20.4%) | 0 (0.0%) |
| $100,000 to $149,999 | 17 (9.1%) | 0 (0.0%) |
| $150,000 or more | 8 (4.3%) | 0 (0.0%) |
| Total | 186 (100.0%) | 19 (100.0%) |
Monthly Housing Cost Tiers in Babbie
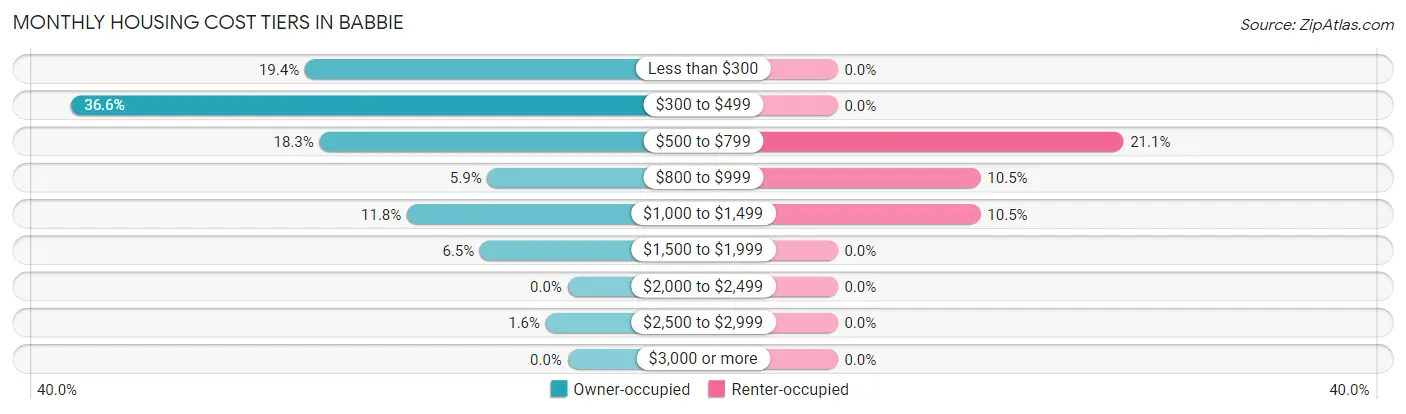
| Monthly Cost | Owner-occupied | Renter-occupied |
| Less than $300 | 36 (19.4%) | 0 (0.0%) |
| $300 to $499 | 68 (36.6%) | 0 (0.0%) |
| $500 to $799 | 34 (18.3%) | 4 (21.0%) |
| $800 to $999 | 11 (5.9%) | 2 (10.5%) |
| $1,000 to $1,499 | 22 (11.8%) | 2 (10.5%) |
| $1,500 to $1,999 | 12 (6.5%) | 0 (0.0%) |
| $2,000 to $2,499 | 0 (0.0%) | 0 (0.0%) |
| $2,500 to $2,999 | 3 (1.6%) | 0 (0.0%) |
| $3,000 or more | 0 (0.0%) | 0 (0.0%) |
| Total | 186 (100.0%) | 19 (100.0%) |
Physical Housing Characteristics in Babbie
Housing Structures in Babbie
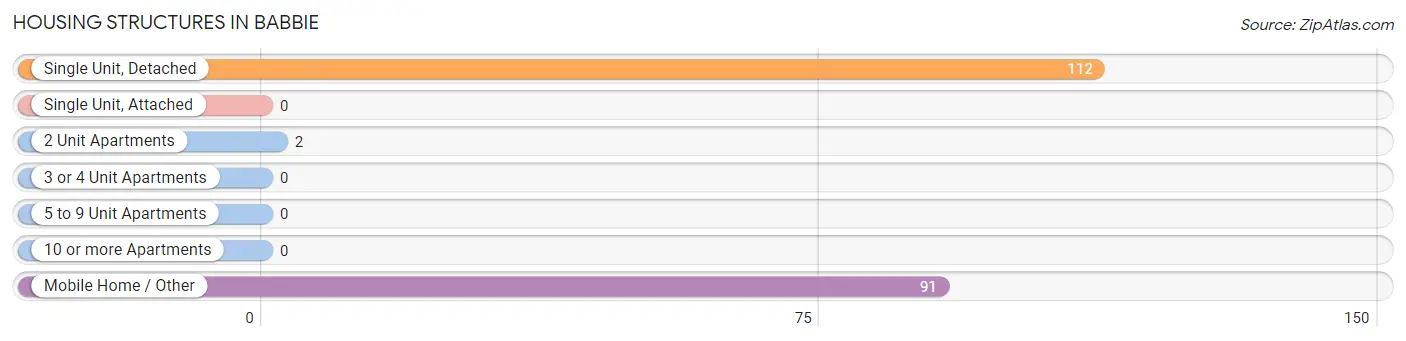
| Structure Type | # Housing Units | % Housing Units |
| Single Unit, Detached | 112 | 54.6% |
| Single Unit, Attached | 0 | 0.0% |
| 2 Unit Apartments | 2 | 1.0% |
| 3 or 4 Unit Apartments | 0 | 0.0% |
| 5 to 9 Unit Apartments | 0 | 0.0% |
| 10 or more Apartments | 0 | 0.0% |
| Mobile Home / Other | 91 | 44.4% |
| Total | 205 | 100.0% |
Housing Structures by Occupancy in Babbie
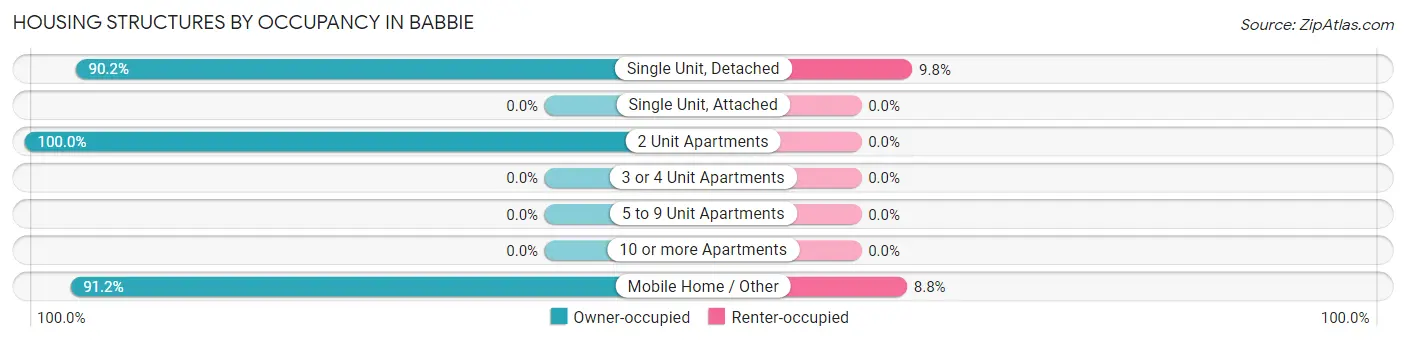
| Structure Type | Owner-occupied | Renter-occupied |
| Single Unit, Detached | 101 (90.2%) | 11 (9.8%) |
| Single Unit, Attached | 0 (0.0%) | 0 (0.0%) |
| 2 Unit Apartments | 2 (100.0%) | 0 (0.0%) |
| 3 or 4 Unit Apartments | 0 (0.0%) | 0 (0.0%) |
| 5 to 9 Unit Apartments | 0 (0.0%) | 0 (0.0%) |
| 10 or more Apartments | 0 (0.0%) | 0 (0.0%) |
| Mobile Home / Other | 83 (91.2%) | 8 (8.8%) |
| Total | 186 (90.7%) | 19 (9.3%) |
Housing Structures by Number of Rooms in Babbie
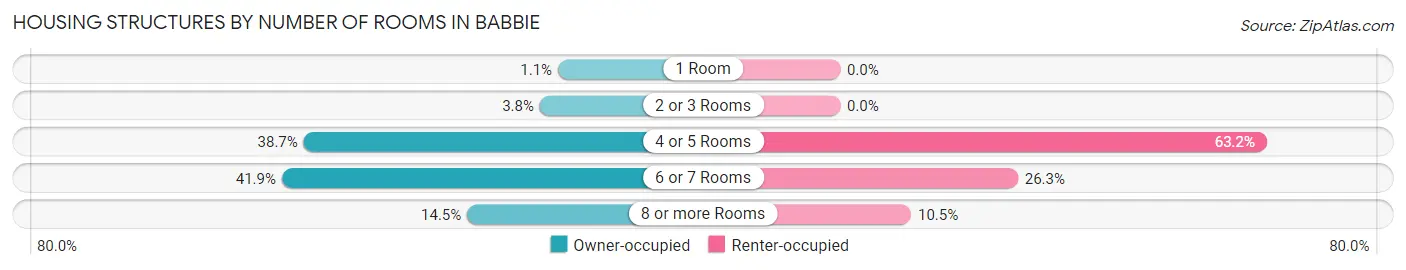
| Number of Rooms | Owner-occupied | Renter-occupied |
| 1 Room | 2 (1.1%) | 0 (0.0%) |
| 2 or 3 Rooms | 7 (3.8%) | 0 (0.0%) |
| 4 or 5 Rooms | 72 (38.7%) | 12 (63.2%) |
| 6 or 7 Rooms | 78 (41.9%) | 5 (26.3%) |
| 8 or more Rooms | 27 (14.5%) | 2 (10.5%) |
| Total | 186 (100.0%) | 19 (100.0%) |
Housing Structure by Heating Type in Babbie
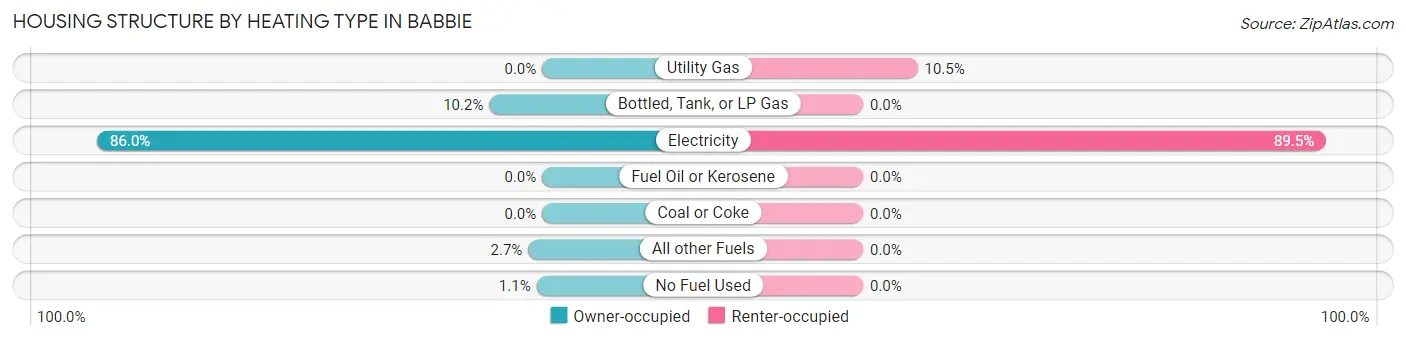
| Heating Type | Owner-occupied | Renter-occupied |
| Utility Gas | 0 (0.0%) | 2 (10.5%) |
| Bottled, Tank, or LP Gas | 19 (10.2%) | 0 (0.0%) |
| Electricity | 160 (86.0%) | 17 (89.5%) |
| Fuel Oil or Kerosene | 0 (0.0%) | 0 (0.0%) |
| Coal or Coke | 0 (0.0%) | 0 (0.0%) |
| All other Fuels | 5 (2.7%) | 0 (0.0%) |
| No Fuel Used | 2 (1.1%) | 0 (0.0%) |
| Total | 186 (100.0%) | 19 (100.0%) |
Household Vehicle Usage in Babbie
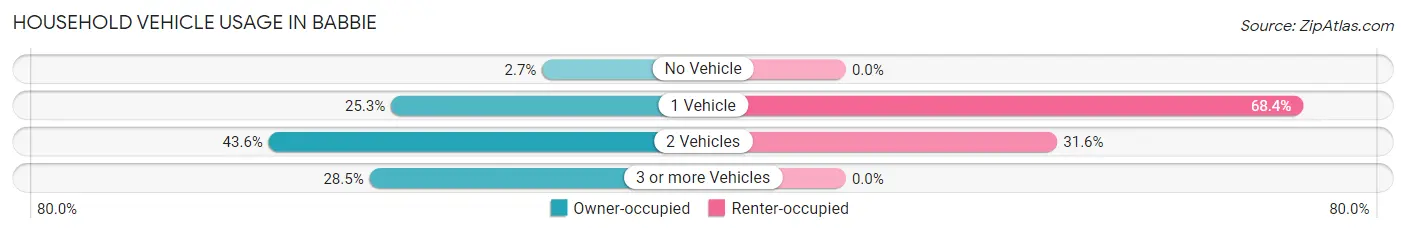
| Vehicles per Household | Owner-occupied | Renter-occupied |
| No Vehicle | 5 (2.7%) | 0 (0.0%) |
| 1 Vehicle | 47 (25.3%) | 13 (68.4%) |
| 2 Vehicles | 81 (43.5%) | 6 (31.6%) |
| 3 or more Vehicles | 53 (28.5%) | 0 (0.0%) |
| Total | 186 (100.0%) | 19 (100.0%) |
Real Estate & Mortgages in Babbie
Real Estate and Mortgage Overview in Babbie
| Characteristic | Without Mortgage | With Mortgage |
| Housing Units | 120 | 66 |
| Median Property Value | $90,000 | $185,700 |
| Median Household Income | $61,786 | $6 |
| Monthly Housing Costs | $355 | $0 |
| Real Estate Taxes | $375 | $6 |
Property Value by Mortgage Status in Babbie
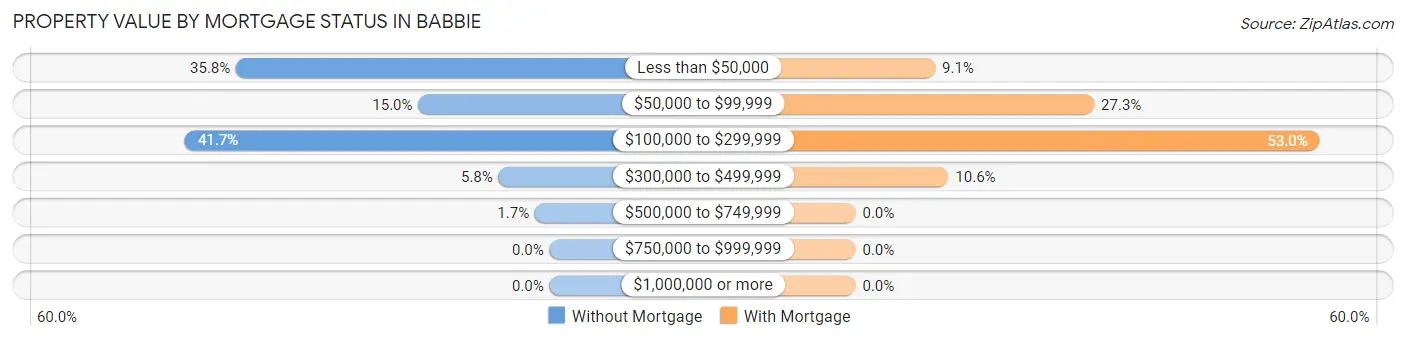
| Property Value | Without Mortgage | With Mortgage |
| Less than $50,000 | 43 (35.8%) | 6 (9.1%) |
| $50,000 to $99,999 | 18 (15.0%) | 18 (27.3%) |
| $100,000 to $299,999 | 50 (41.7%) | 35 (53.0%) |
| $300,000 to $499,999 | 7 (5.8%) | 7 (10.6%) |
| $500,000 to $749,999 | 2 (1.7%) | 0 (0.0%) |
| $750,000 to $999,999 | 0 (0.0%) | 0 (0.0%) |
| $1,000,000 or more | 0 (0.0%) | 0 (0.0%) |
| Total | 120 (100.0%) | 66 (100.0%) |
Household Income by Mortgage Status in Babbie
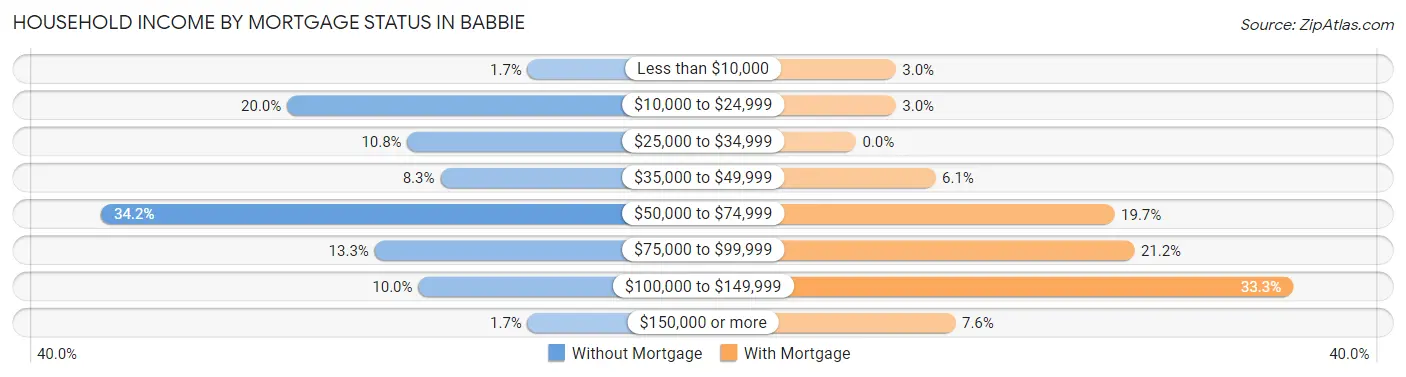
| Household Income | Without Mortgage | With Mortgage |
| Less than $10,000 | 2 (1.7%) | 2 (3.0%) |
| $10,000 to $24,999 | 24 (20.0%) | 2 (3.0%) |
| $25,000 to $34,999 | 13 (10.8%) | 0 (0.0%) |
| $35,000 to $49,999 | 10 (8.3%) | 4 (6.1%) |
| $50,000 to $74,999 | 41 (34.2%) | 13 (19.7%) |
| $75,000 to $99,999 | 16 (13.3%) | 14 (21.2%) |
| $100,000 to $149,999 | 12 (10.0%) | 22 (33.3%) |
| $150,000 or more | 2 (1.7%) | 5 (7.6%) |
| Total | 120 (100.0%) | 66 (100.0%) |
Property Value to Household Income Ratio in Babbie
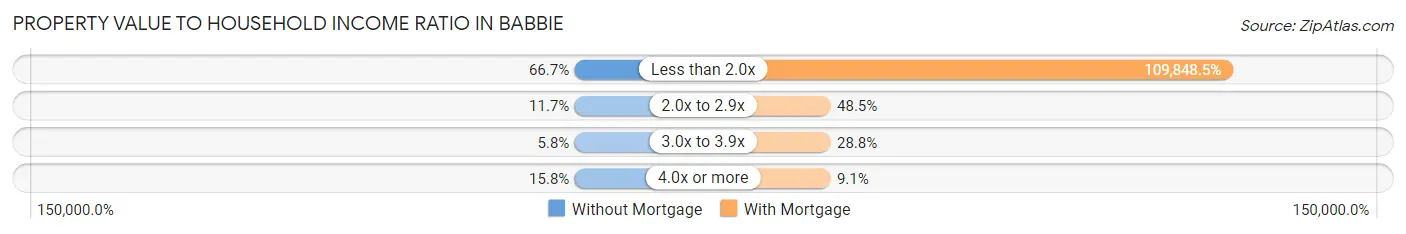
| Value-to-Income Ratio | Without Mortgage | With Mortgage |
| Less than 2.0x | 80 (66.7%) | 72,500 (109,848.5%) |
| 2.0x to 2.9x | 14 (11.7%) | 32 (48.5%) |
| 3.0x to 3.9x | 7 (5.8%) | 19 (28.8%) |
| 4.0x or more | 19 (15.8%) | 6 (9.1%) |
| Total | 120 (100.0%) | 66 (100.0%) |
Real Estate Taxes by Mortgage Status in Babbie
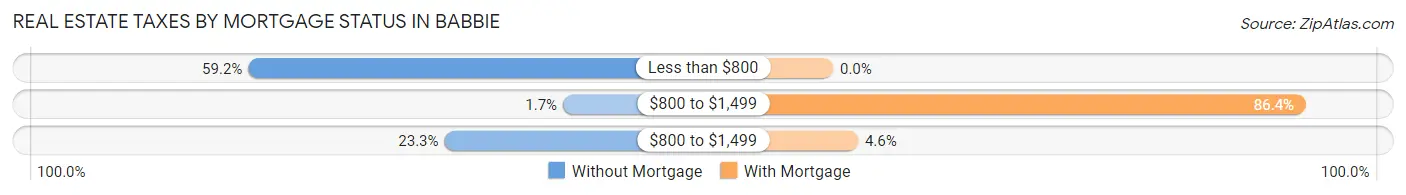
| Property Taxes | Without Mortgage | With Mortgage |
| Less than $800 | 71 (59.2%) | 0 (0.0%) |
| $800 to $1,499 | 2 (1.7%) | 57 (86.4%) |
| $800 to $1,499 | 28 (23.3%) | 3 (4.5%) |
| Total | 120 (100.0%) | 66 (100.0%) |
Health & Disability in Babbie
Health Insurance Coverage by Age in Babbie
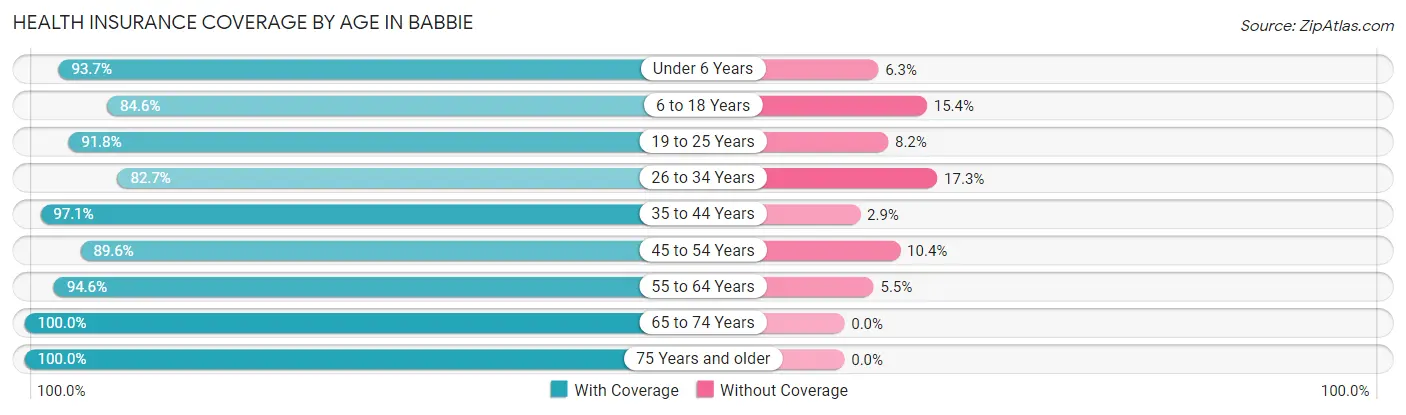
| Age Bracket | With Coverage | Without Coverage |
| Under 6 Years | 74 (93.7%) | 5 (6.3%) |
| 6 to 18 Years | 44 (84.6%) | 8 (15.4%) |
| 19 to 25 Years | 45 (91.8%) | 4 (8.2%) |
| 26 to 34 Years | 105 (82.7%) | 22 (17.3%) |
| 35 to 44 Years | 33 (97.1%) | 1 (2.9%) |
| 45 to 54 Years | 86 (89.6%) | 10 (10.4%) |
| 55 to 64 Years | 52 (94.6%) | 3 (5.4%) |
| 65 to 74 Years | 54 (100.0%) | 0 (0.0%) |
| 75 Years and older | 29 (100.0%) | 0 (0.0%) |
| Total | 522 (90.8%) | 53 (9.2%) |
Health Insurance Coverage by Citizenship Status in Babbie
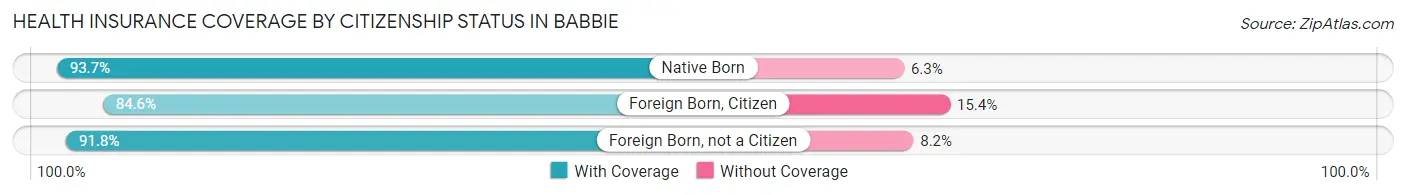
| Citizenship Status | With Coverage | Without Coverage |
| Native Born | 74 (93.7%) | 5 (6.3%) |
| Foreign Born, Citizen | 44 (84.6%) | 8 (15.4%) |
| Foreign Born, not a Citizen | 45 (91.8%) | 4 (8.2%) |
Health Insurance Coverage by Household Income in Babbie
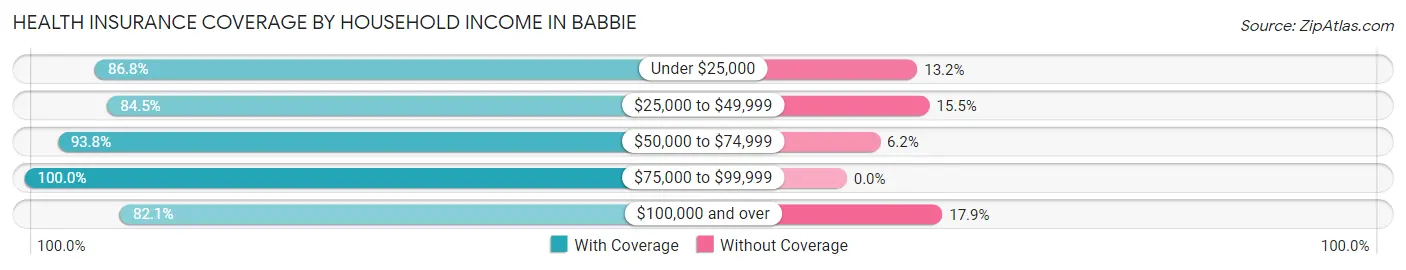
| Household Income | With Coverage | Without Coverage |
| Under $25,000 | 46 (86.8%) | 7 (13.2%) |
| $25,000 to $49,999 | 98 (84.5%) | 18 (15.5%) |
| $50,000 to $74,999 | 166 (93.8%) | 11 (6.2%) |
| $75,000 to $99,999 | 134 (100.0%) | 0 (0.0%) |
| $100,000 and over | 78 (82.1%) | 17 (17.9%) |
Public vs Private Health Insurance Coverage by Age in Babbie
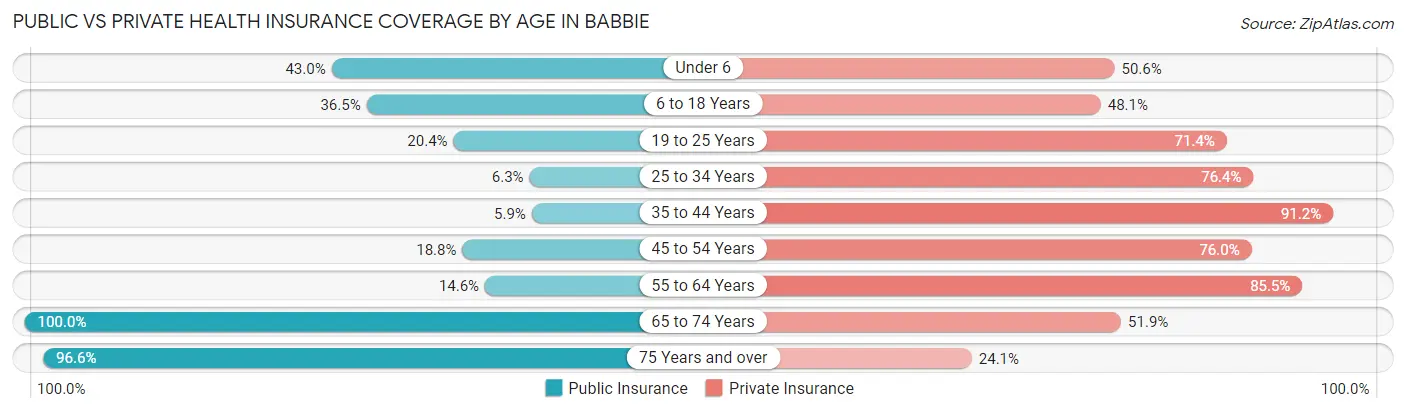
| Age Bracket | Public Insurance | Private Insurance |
| Under 6 | 34 (43.0%) | 40 (50.6%) |
| 6 to 18 Years | 19 (36.5%) | 25 (48.1%) |
| 19 to 25 Years | 10 (20.4%) | 35 (71.4%) |
| 25 to 34 Years | 8 (6.3%) | 97 (76.4%) |
| 35 to 44 Years | 2 (5.9%) | 31 (91.2%) |
| 45 to 54 Years | 18 (18.8%) | 73 (76.0%) |
| 55 to 64 Years | 8 (14.5%) | 47 (85.5%) |
| 65 to 74 Years | 54 (100.0%) | 28 (51.8%) |
| 75 Years and over | 28 (96.6%) | 7 (24.1%) |
| Total | 181 (31.5%) | 383 (66.6%) |
Disability Status by Sex by Age in Babbie
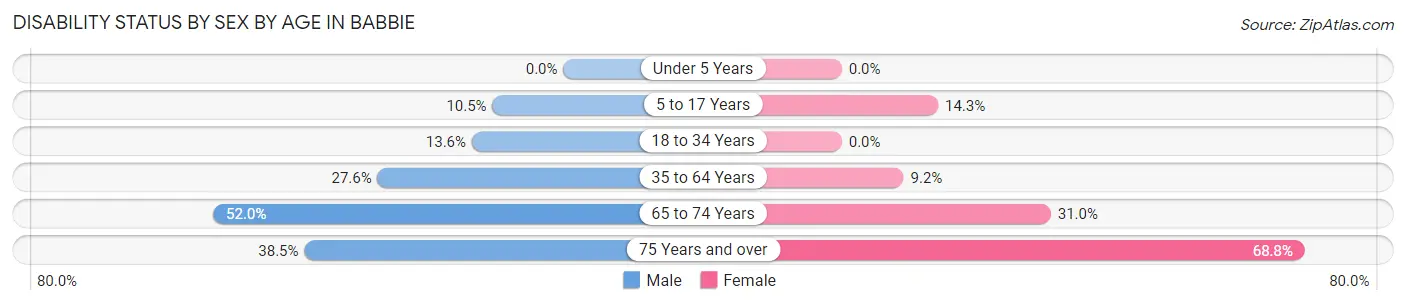
| Age Bracket | Male | Female |
| Under 5 Years | 0 (0.0%) | 0 (0.0%) |
| 5 to 17 Years | 2 (10.5%) | 5 (14.3%) |
| 18 to 34 Years | 14 (13.6%) | 0 (0.0%) |
| 35 to 64 Years | 24 (27.6%) | 9 (9.2%) |
| 65 to 74 Years | 13 (52.0%) | 9 (31.0%) |
| 75 Years and over | 5 (38.5%) | 11 (68.8%) |
Disability Class by Sex by Age in Babbie
Disability Class: Hearing Difficulty
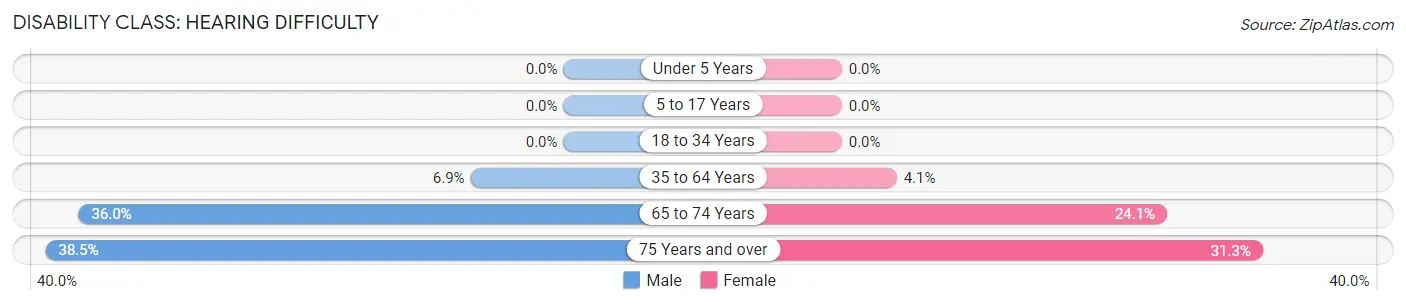
| Age Bracket | Male | Female |
| Under 5 Years | 0 (0.0%) | 0 (0.0%) |
| 5 to 17 Years | 0 (0.0%) | 0 (0.0%) |
| 18 to 34 Years | 0 (0.0%) | 0 (0.0%) |
| 35 to 64 Years | 6 (6.9%) | 4 (4.1%) |
| 65 to 74 Years | 9 (36.0%) | 7 (24.1%) |
| 75 Years and over | 5 (38.5%) | 5 (31.2%) |
Disability Class: Vision Difficulty
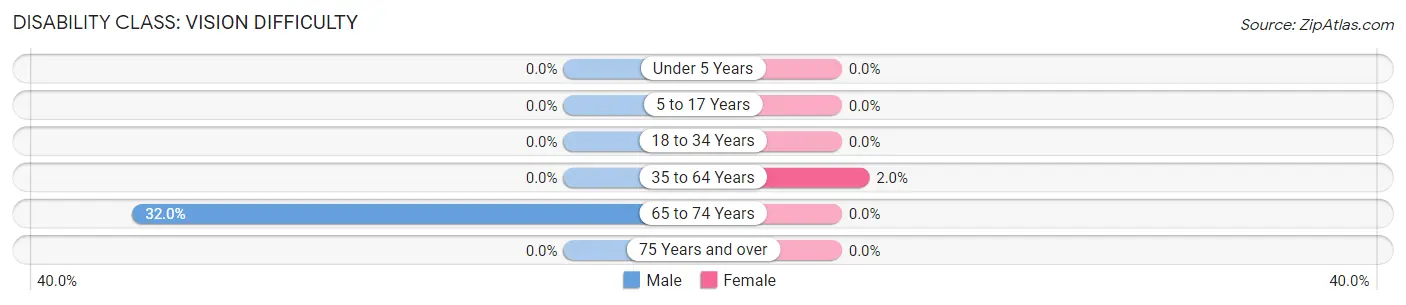
| Age Bracket | Male | Female |
| Under 5 Years | 0 (0.0%) | 0 (0.0%) |
| 5 to 17 Years | 0 (0.0%) | 0 (0.0%) |
| 18 to 34 Years | 0 (0.0%) | 0 (0.0%) |
| 35 to 64 Years | 0 (0.0%) | 2 (2.0%) |
| 65 to 74 Years | 8 (32.0%) | 0 (0.0%) |
| 75 Years and over | 0 (0.0%) | 0 (0.0%) |
Disability Class: Cognitive Difficulty
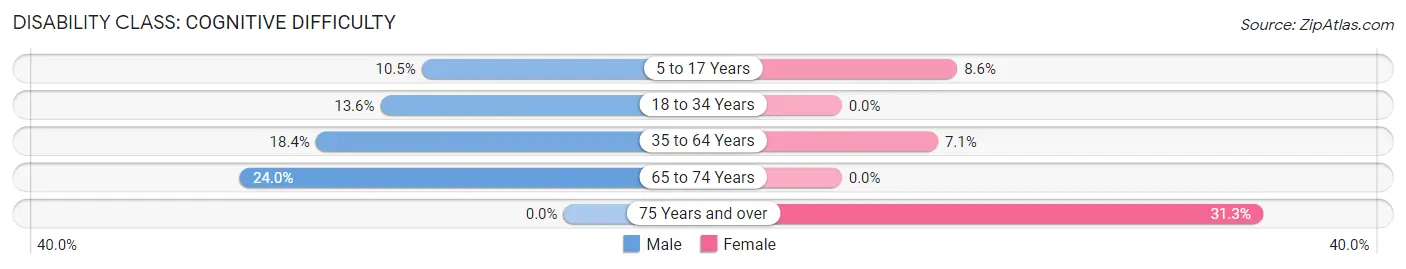
| Age Bracket | Male | Female |
| 5 to 17 Years | 2 (10.5%) | 3 (8.6%) |
| 18 to 34 Years | 14 (13.6%) | 0 (0.0%) |
| 35 to 64 Years | 16 (18.4%) | 7 (7.1%) |
| 65 to 74 Years | 6 (24.0%) | 0 (0.0%) |
| 75 Years and over | 0 (0.0%) | 5 (31.2%) |
Disability Class: Ambulatory Difficulty
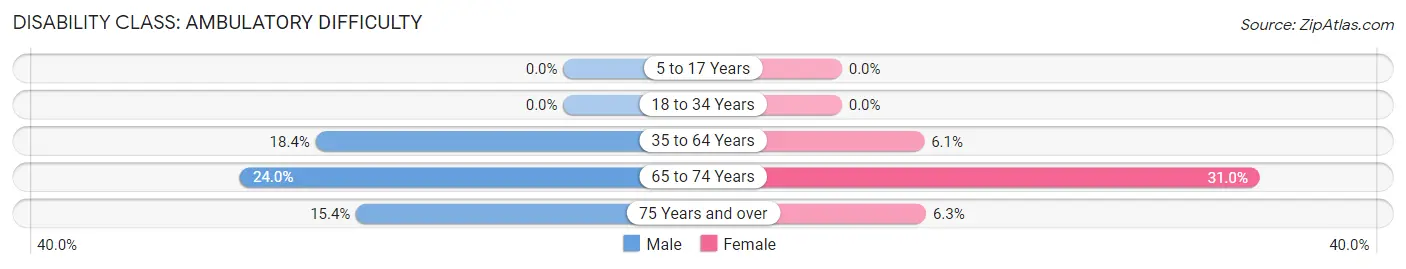
| Age Bracket | Male | Female |
| 5 to 17 Years | 0 (0.0%) | 0 (0.0%) |
| 18 to 34 Years | 0 (0.0%) | 0 (0.0%) |
| 35 to 64 Years | 16 (18.4%) | 6 (6.1%) |
| 65 to 74 Years | 6 (24.0%) | 9 (31.0%) |
| 75 Years and over | 2 (15.4%) | 1 (6.2%) |
Disability Class: Self-Care Difficulty
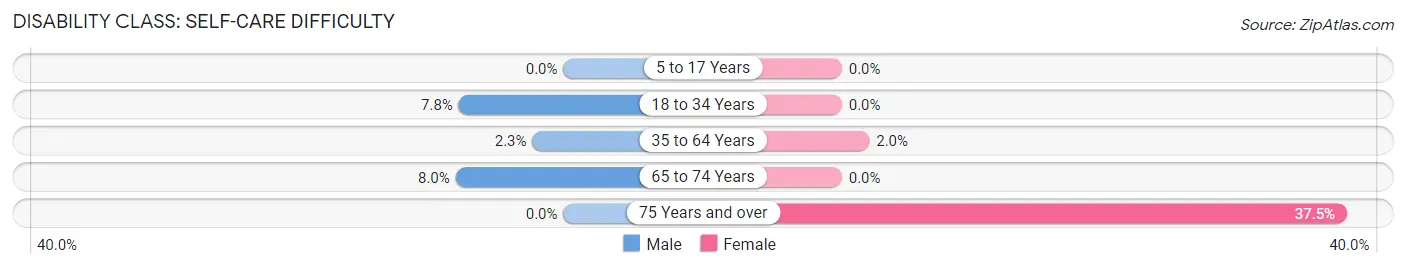
| Age Bracket | Male | Female |
| 5 to 17 Years | 0 (0.0%) | 0 (0.0%) |
| 18 to 34 Years | 8 (7.8%) | 0 (0.0%) |
| 35 to 64 Years | 2 (2.3%) | 2 (2.0%) |
| 65 to 74 Years | 2 (8.0%) | 0 (0.0%) |
| 75 Years and over | 0 (0.0%) | 6 (37.5%) |
Technology Access in Babbie
Computing Device Access in Babbie
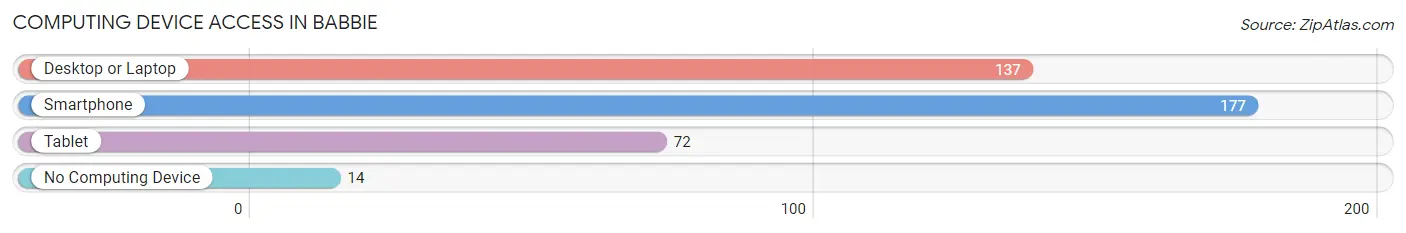
| Device Type | # Households | % Households |
| Desktop or Laptop | 137 | 66.8% |
| Smartphone | 177 | 86.3% |
| Tablet | 72 | 35.1% |
| No Computing Device | 14 | 6.8% |
| Total | 205 | 100.0% |
Internet Access in Babbie
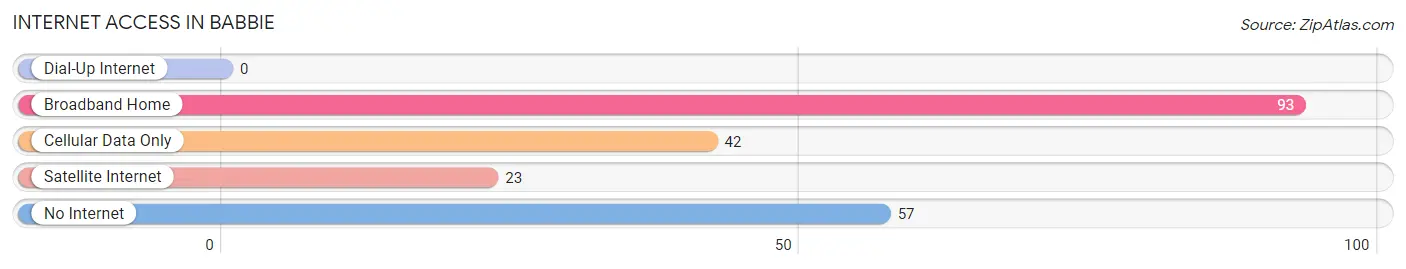
| Internet Type | # Households | % Households |
| Dial-Up Internet | 0 | 0.0% |
| Broadband Home | 93 | 45.4% |
| Cellular Data Only | 42 | 20.5% |
| Satellite Internet | 23 | 11.2% |
| No Internet | 57 | 27.8% |
| Total | 205 | 100.0% |
Babbie Summary
Babbie is an unincorporated community located in Covington County, Alabama. It is situated in the southeastern corner of the state, approximately 10 miles south of Andalusia and 25 miles north of the Florida state line. The community is part of the Dothan Metropolitan Statistical Area and is home to a population of approximately 500 people.
History
The area that is now Babbie was first settled in the early 1800s by a group of settlers from Georgia. The community was originally known as “Babbs”, after the family of William Babbs, who was one of the first settlers. The name was later changed to “Babbie”, and the community was officially incorporated in 1887.
In the early 1900s, Babbie was a thriving agricultural community, with cotton, corn, and peanuts being the primary crops. The town also had a sawmill, a gristmill, and a cotton gin. In the 1920s, the town was home to a number of stores, including a general store, a drug store, and a hardware store.
Geography
Babbie is located in the southeastern corner of Covington County, Alabama. It is situated approximately 10 miles south of Andalusia and 25 miles north of the Florida state line. The community is part of the Dothan Metropolitan Statistical Area and is home to a population of approximately 500 people.
The terrain in the area is mostly flat, with some rolling hills. The area is mostly covered in pine and hardwood forests, with some open fields. The climate in the area is humid subtropical, with hot, humid summers and mild winters.
Economy
The economy of Babbie is largely based on agriculture. Cotton, corn, and peanuts are the primary crops grown in the area. The town also has a number of small businesses, including a general store, a drug store, and a hardware store.
Demographics
As of the 2010 census, the population of Babbie was 498. The racial makeup of the town was 97.2% White, 0.6% African American, 0.2% Native American, 0.2% Asian, 0.2% from other races, and 1.8% from two or more races. Hispanic or Latino of any race were 1.2% of the population.
The median household income in Babbie was $30,000, and the median family income was $35,000. The per capita income for the town was $14,000. About 17.5% of the population was below the poverty line.
Common Questions
What is Per Capita Income in Babbie?
Per Capita income in Babbie is $23,765.
What is the Median Family Income in Babbie?
Median Family Income in Babbie is $63,750.
What is the Median Household income in Babbie?
Median Household Income in Babbie is $59,712.
What is Income or Wage Gap in Babbie?
Income or Wage Gap in Babbie is 37.5%.
Women in Babbie earn 62.5 cents for every dollar earned by a man.
What is Inequality or Gini Index in Babbie?
Inequality or Gini Index in Babbie is 0.33.
What is the Total Population of Babbie?
Total Population of Babbie is 575.
What is the Total Male Population of Babbie?
Total Male Population of Babbie is 294.
What is the Total Female Population of Babbie?
Total Female Population of Babbie is 281.
What is the Ratio of Males per 100 Females in Babbie?
There are 104.63 Males per 100 Females in Babbie.
What is the Ratio of Females per 100 Males in Babbie?
There are 95.58 Females per 100 Males in Babbie.
What is the Median Population Age in Babbie?
Median Population Age in Babbie is 33.8 Years.
What is the Average Family Size in Babbie
Average Family Size in Babbie is 2.9 People.
What is the Average Household Size in Babbie
Average Household Size in Babbie is 2.8 People.
How Large is the Labor Force in Babbie?
There are 273 People in the Labor Forcein in Babbie.
What is the Percentage of People in the Labor Force in Babbie?
58.6% of People are in the Labor Force in Babbie.