Zip Codes with the Highest Percentage of Population Employed in Administrative & Support Services in Pell City, AL
RELATED REPORTS & OPTIONS
Administrative & Support Services
Pell City
Compare Zip Codes
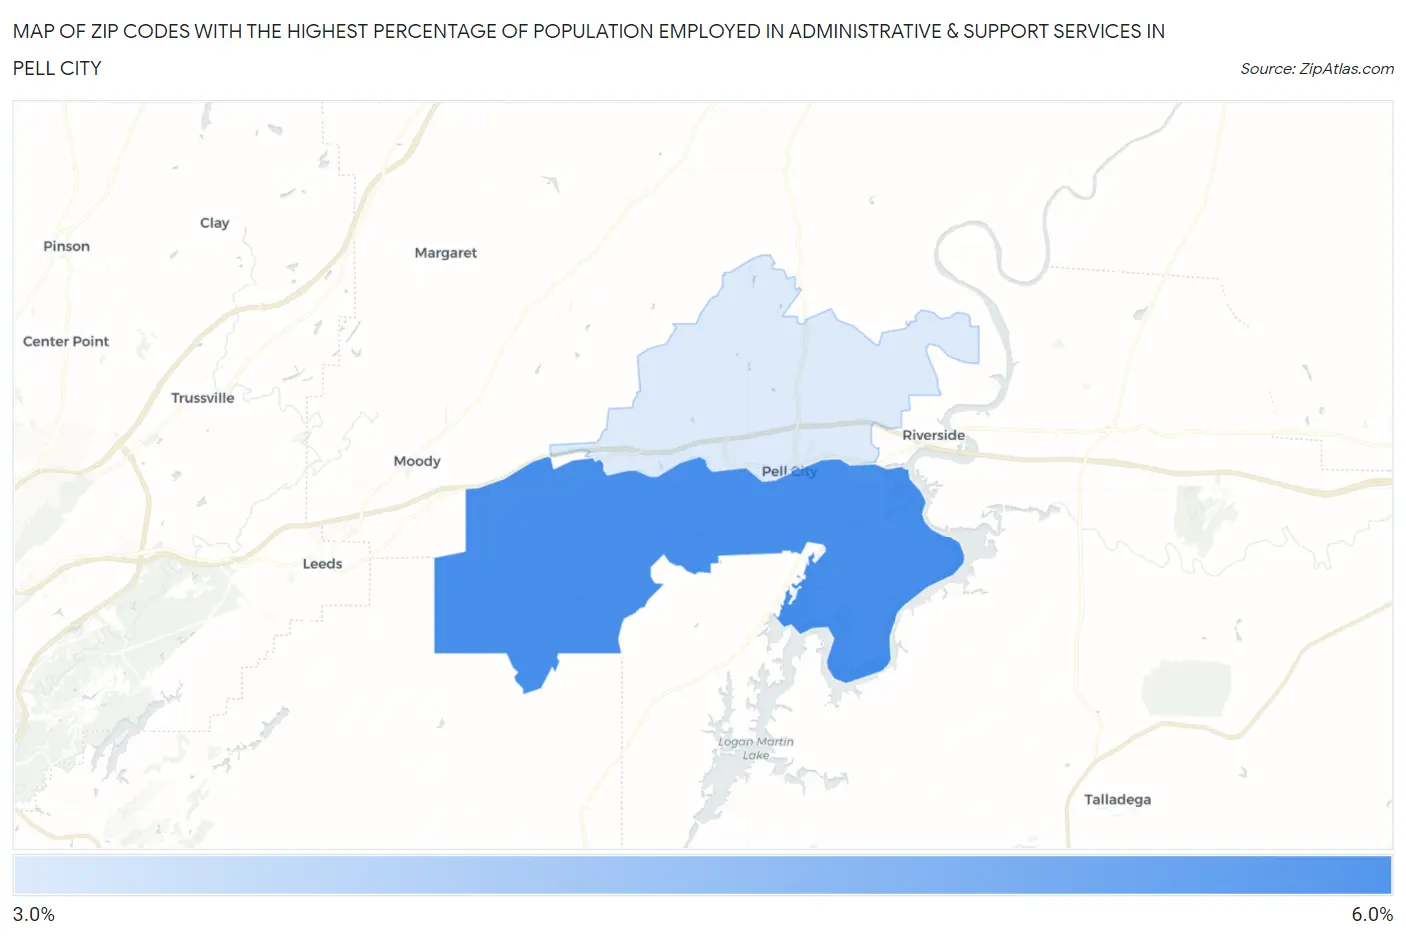
Map of Zip Codes with the Highest Percentage of Population Employed in Administrative & Support Services in Pell City
3.4%
5.7%
Zip Codes with the Highest Percentage of Population Employed in Administrative & Support Services in Pell City, AL
| Zip Code | % Employed | vs State | vs National | |
| 1. | 35128 | 5.7% | 4.0%(+1.72)#109 | 4.1%(+1.54)#5,369 |
| 2. | 35125 | 3.4% | 4.0%(-0.598)#286 | 4.1%(-0.779)#13,586 |
1
Common Questions
What are the Top Zip Codes with the Highest Percentage of Population Employed in Administrative & Support Services in Pell City, AL?
Top Zip Codes with the Highest Percentage of Population Employed in Administrative & Support Services in Pell City, AL are:
What zip code has the Highest Percentage of Population Employed in Administrative & Support Services in Pell City, AL?
35128 has the Highest Percentage of Population Employed in Administrative & Support Services in Pell City, AL with 5.7%.
What is the Percentage of Population Employed in Administrative & Support Services in Pell City, AL?
Percentage of Population Employed in Administrative & Support Services in Pell City is 3.6%.
What is the Percentage of Population Employed in Administrative & Support Services in Alabama?
Percentage of Population Employed in Administrative & Support Services in Alabama is 4.0%.
What is the Percentage of Population Employed in Administrative & Support Services in the United States?
Percentage of Population Employed in Administrative & Support Services in the United States is 4.1%.