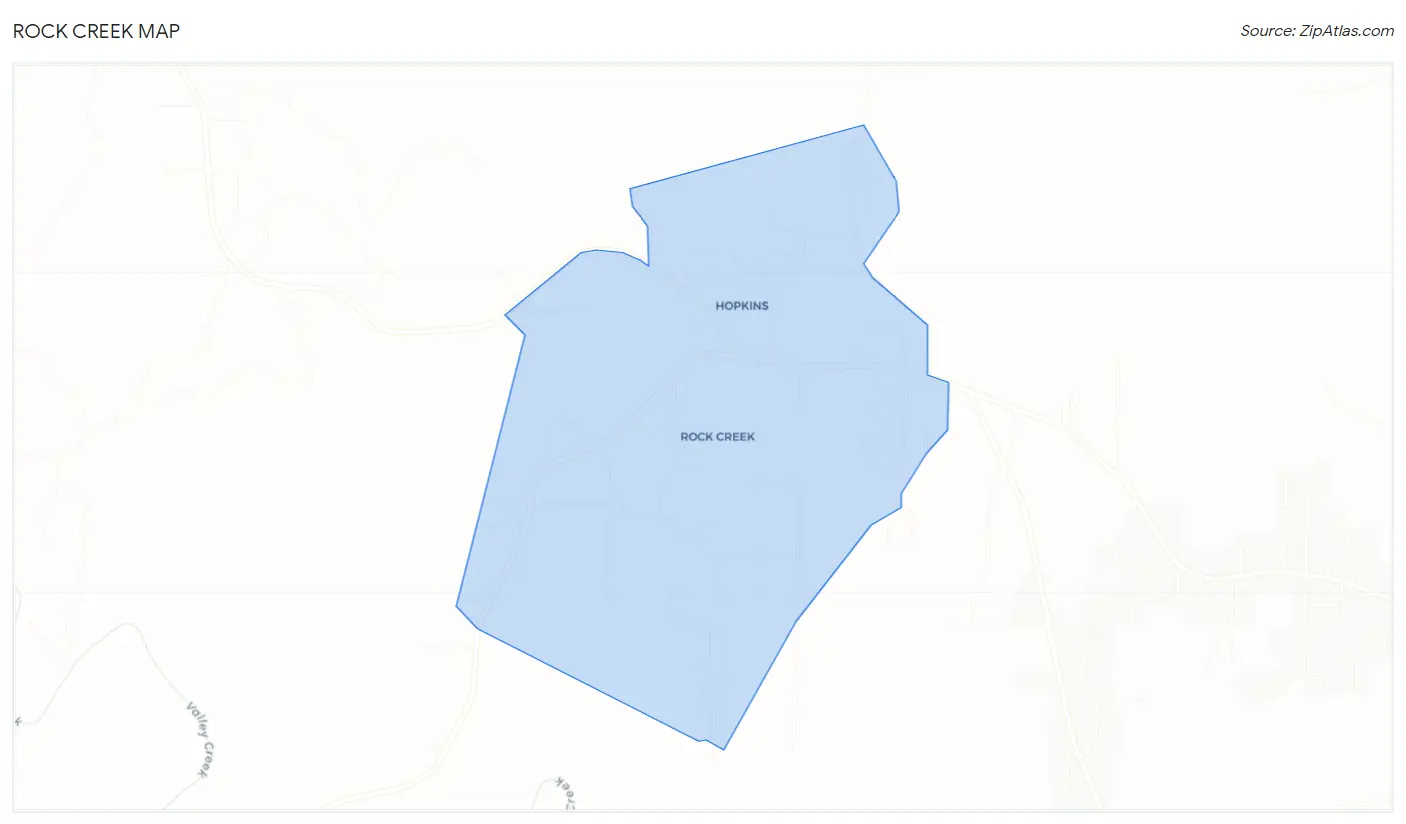
Rock Creek, AL Map & Demographics
Rock Creek Map
Rock Creek Overview
$37,597
PER CAPITA INCOME
$69,688
AVG FAMILY INCOME
$71,106
AVG HOUSEHOLD INCOME
0.46
INEQUALITY / GINI INDEX
1,446
TOTAL POPULATION
678
MALE POPULATION
768
FEMALE POPULATION
88.28
MALES / 100 FEMALES
113.27
FEMALES / 100 MALES
53.7
MEDIAN AGE
2.8
AVG FAMILY SIZE
2.5
AVG HOUSEHOLD SIZE
733
LABOR FORCE [ PEOPLE ]
55.1%
PERCENT IN LABOR FORCE
3.8%
UNEMPLOYMENT RATE
Income in Rock Creek
Income Overview in Rock Creek
Per Capita Income in Rock Creek is $37,597, while median incomes of families and households are $69,688 and $71,106 respectively.
| Characteristic | Number | Measure |
| Per Capita Income | 1,446 | $37,597 |
| Median Family Income | 442 | $69,688 |
| Mean Family Income | 442 | $97,825 |
| Median Household Income | 591 | $71,106 |
| Mean Household Income | 591 | $90,702 |
| Income Deficit | 442 | $0 |
| Wage / Income Gap (%) | 1,446 | 0.00% |
| Wage / Income Gap ($) | 1,446 | 100.00¢ per $1 |
| Gini / Inequality Index | 1,446 | 0.46 |
Earnings by Sex in Rock Creek
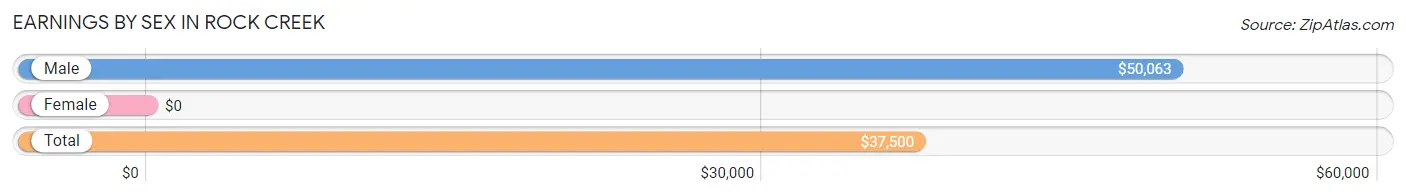
| Sex | Number | Average Earnings |
| Male | 365 (47.9%) | $50,063 |
| Female | 397 (52.1%) | $0 |
| Total | 762 (100.0%) | $37,500 |
Earnings by Sex by Income Bracket in Rock Creek
The most common earnings brackets in Rock Creek are $10,000 to $12,499 for men (98 | 26.9%) and $45,000 to $49,999 for women (72 | 18.1%).
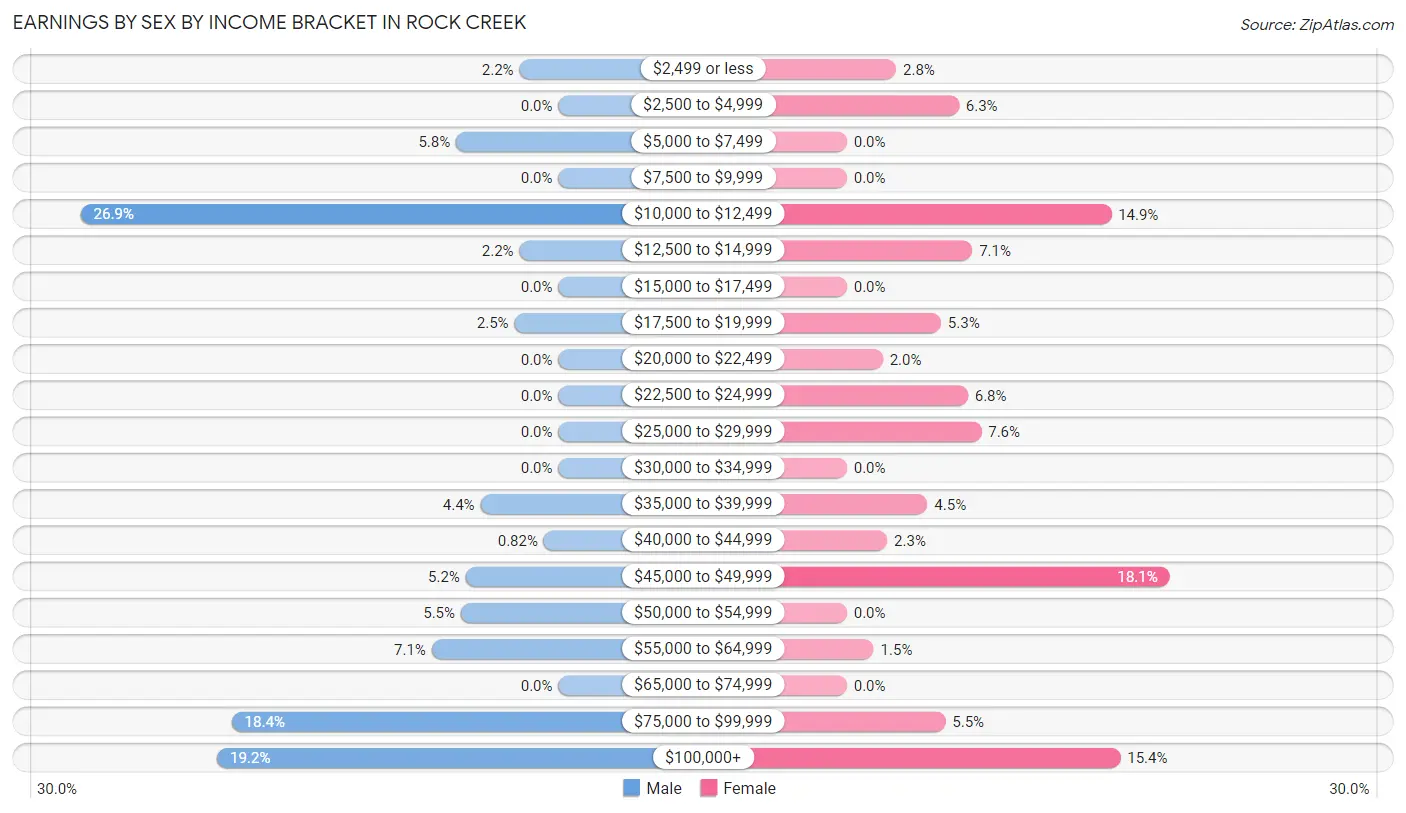
| Income | Male | Female |
| $2,499 or less | 8 (2.2%) | 11 (2.8%) |
| $2,500 to $4,999 | 0 (0.0%) | 25 (6.3%) |
| $5,000 to $7,499 | 21 (5.8%) | 0 (0.0%) |
| $7,500 to $9,999 | 0 (0.0%) | 0 (0.0%) |
| $10,000 to $12,499 | 98 (26.9%) | 59 (14.9%) |
| $12,500 to $14,999 | 8 (2.2%) | 28 (7.0%) |
| $15,000 to $17,499 | 0 (0.0%) | 0 (0.0%) |
| $17,500 to $19,999 | 9 (2.5%) | 21 (5.3%) |
| $20,000 to $22,499 | 0 (0.0%) | 8 (2.0%) |
| $22,500 to $24,999 | 0 (0.0%) | 27 (6.8%) |
| $25,000 to $29,999 | 0 (0.0%) | 30 (7.6%) |
| $30,000 to $34,999 | 0 (0.0%) | 0 (0.0%) |
| $35,000 to $39,999 | 16 (4.4%) | 18 (4.5%) |
| $40,000 to $44,999 | 3 (0.8%) | 9 (2.3%) |
| $45,000 to $49,999 | 19 (5.2%) | 72 (18.1%) |
| $50,000 to $54,999 | 20 (5.5%) | 0 (0.0%) |
| $55,000 to $64,999 | 26 (7.1%) | 6 (1.5%) |
| $65,000 to $74,999 | 0 (0.0%) | 0 (0.0%) |
| $75,000 to $99,999 | 67 (18.4%) | 22 (5.5%) |
| $100,000+ | 70 (19.2%) | 61 (15.4%) |
| Total | 365 (100.0%) | 397 (100.0%) |
Earnings by Sex by Educational Attainment in Rock Creek
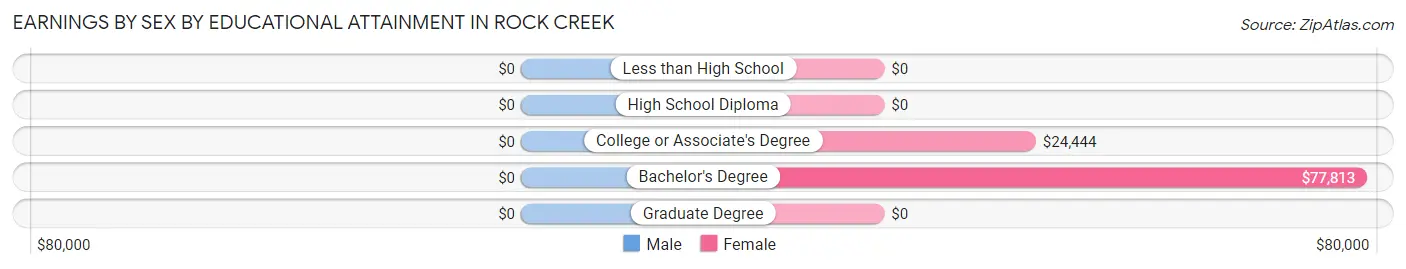
| Educational Attainment | Male Income | Female Income |
| Less than High School | - | - |
| High School Diploma | - | - |
| College or Associate's Degree | - | - |
| Bachelor's Degree | - | - |
| Graduate Degree | - | - |
| Total | $51,375 | $42,778 |
Family Income in Rock Creek
Family Income Brackets in Rock Creek
According to the Rock Creek family income data, there are 109 families falling into the $50,000 to $74,999 income range, which is the most common income bracket and makes up 24.7% of all families.
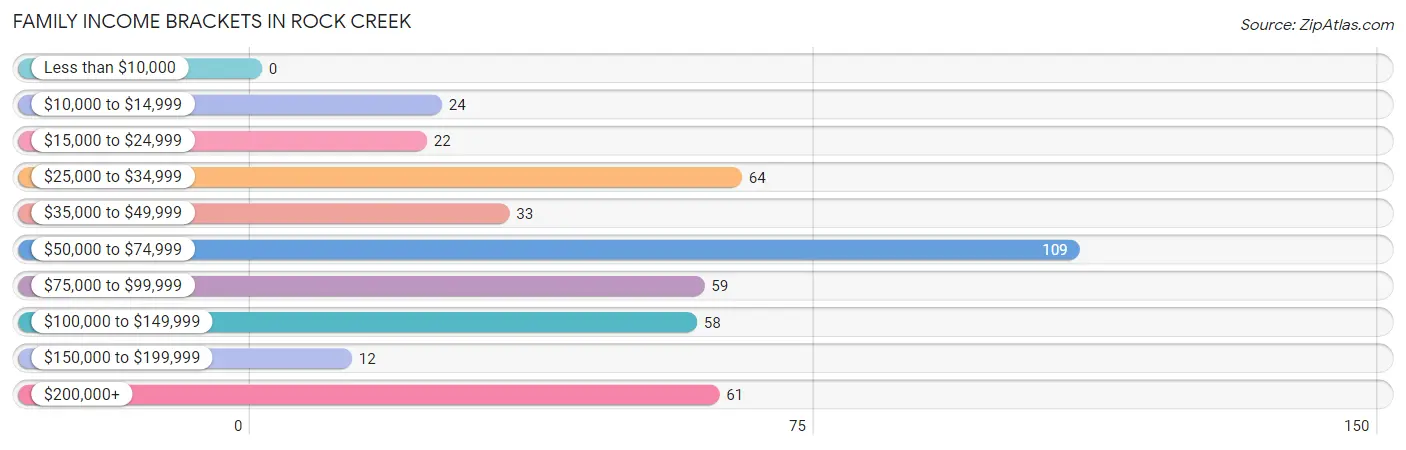
| Income Bracket | # Families | % Families |
| Less than $10,000 | 0 | 0.0% |
| $10,000 to $14,999 | 24 | 5.4% |
| $15,000 to $24,999 | 22 | 5.0% |
| $25,000 to $34,999 | 64 | 14.5% |
| $35,000 to $49,999 | 33 | 7.5% |
| $50,000 to $74,999 | 109 | 24.7% |
| $75,000 to $99,999 | 59 | 13.3% |
| $100,000 to $149,999 | 58 | 13.1% |
| $150,000 to $199,999 | 12 | 2.7% |
| $200,000+ | 61 | 13.8% |
Family Income by Famaliy Size in Rock Creek
2-person families (289 | 65.4%) account for the highest median family income in Rock Creek with $70,913 per family, while 2-person families (289 | 65.4%) have the highest median income of $35,456 per family member.
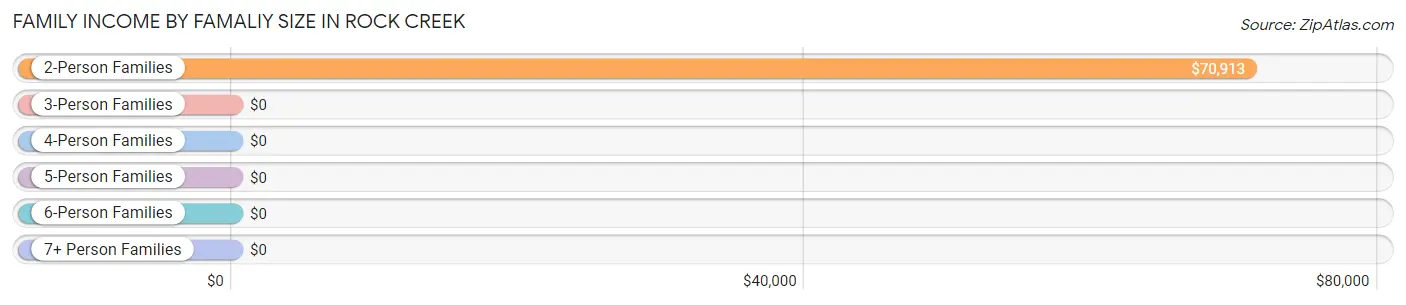
| Income Bracket | # Families | Median Income |
| 2-Person Families | 289 (65.4%) | $70,913 |
| 3-Person Families | 97 (22.0%) | $0 |
| 4-Person Families | 22 (5.0%) | $0 |
| 5-Person Families | 34 (7.7%) | $0 |
| 6-Person Families | 0 (0.0%) | $0 |
| 7+ Person Families | 0 (0.0%) | $0 |
| Total | 442 (100.0%) | $69,688 |
Family Income by Number of Earners in Rock Creek
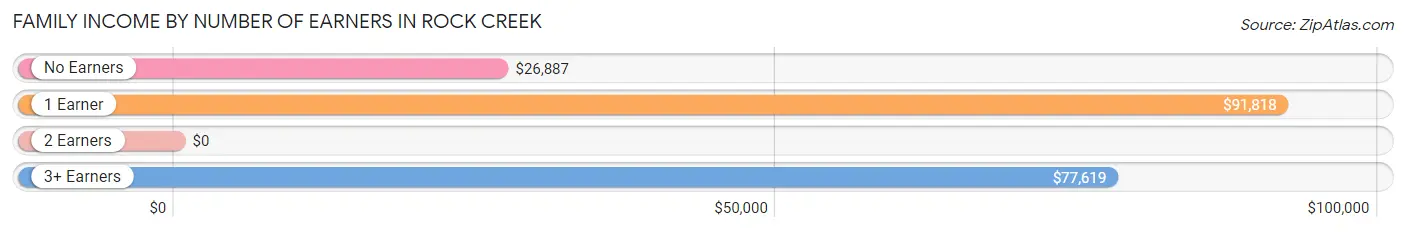
| Number of Earners | # Families | Median Income |
| No Earners | 157 (35.5%) | $26,887 |
| 1 Earner | 102 (23.1%) | $91,818 |
| 2 Earners | 123 (27.8%) | $0 |
| 3+ Earners | 60 (13.6%) | $77,619 |
| Total | 442 (100.0%) | $69,688 |
Household Income in Rock Creek
Household Income Brackets in Rock Creek
With 120 households falling in the category, the $50,000 to $74,999 income range is the most frequent in Rock Creek, accounting for 20.3% of all households.
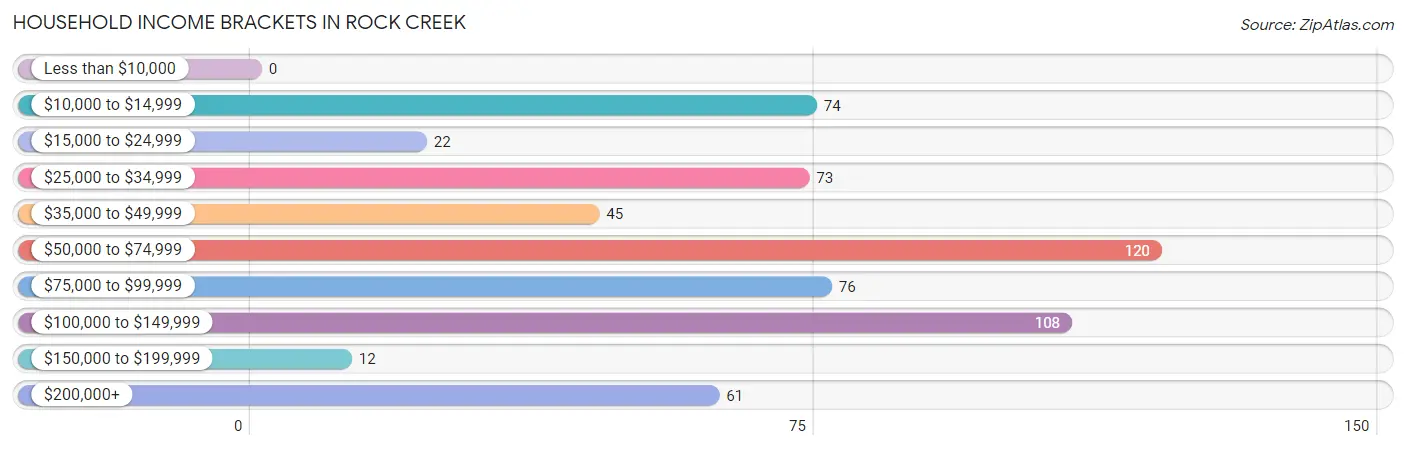
| Income Bracket | # Households | % Households |
| Less than $10,000 | 0 | 0.0% |
| $10,000 to $14,999 | 74 | 12.5% |
| $15,000 to $24,999 | 22 | 3.7% |
| $25,000 to $34,999 | 73 | 12.4% |
| $35,000 to $49,999 | 45 | 7.6% |
| $50,000 to $74,999 | 120 | 20.3% |
| $75,000 to $99,999 | 76 | 12.9% |
| $100,000 to $149,999 | 108 | 18.3% |
| $150,000 to $199,999 | 12 | 2.0% |
| $200,000+ | 61 | 10.3% |
Household Income by Householder Age in Rock Creek
The median household income in Rock Creek is $71,106, with the highest median household income of $135,708 found in the 45 to 64 years age bracket for the primary householder. A total of 241 households (40.8%) fall into this category.
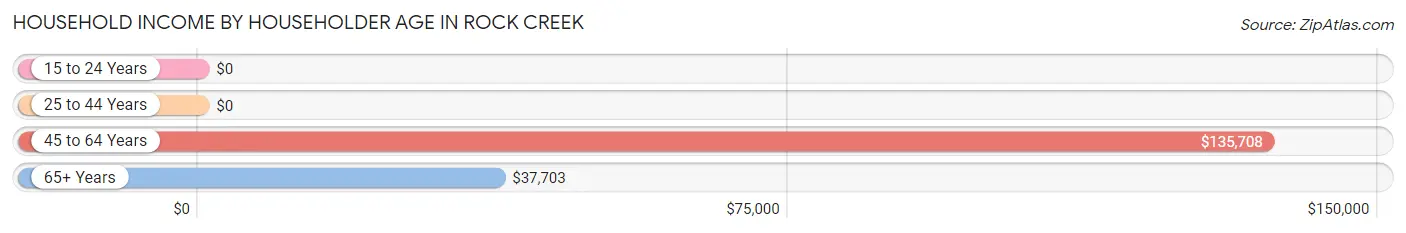
| Income Bracket | # Households | Median Income |
| 15 to 24 Years | 0 (0.0%) | $0 |
| 25 to 44 Years | 84 (14.2%) | $0 |
| 45 to 64 Years | 241 (40.8%) | $135,708 |
| 65+ Years | 266 (45.0%) | $37,703 |
| Total | 591 (100.0%) | $71,106 |
Poverty in Rock Creek
Income Below Poverty by Sex and Age in Rock Creek
With 15.8% poverty level for males and 12.0% for females among the residents of Rock Creek, 18 to 24 year old males and under 5 year old females are the most vulnerable to poverty, with 21 males (100.0%) and 15 females (55.6%) in their respective age groups living below the poverty level.
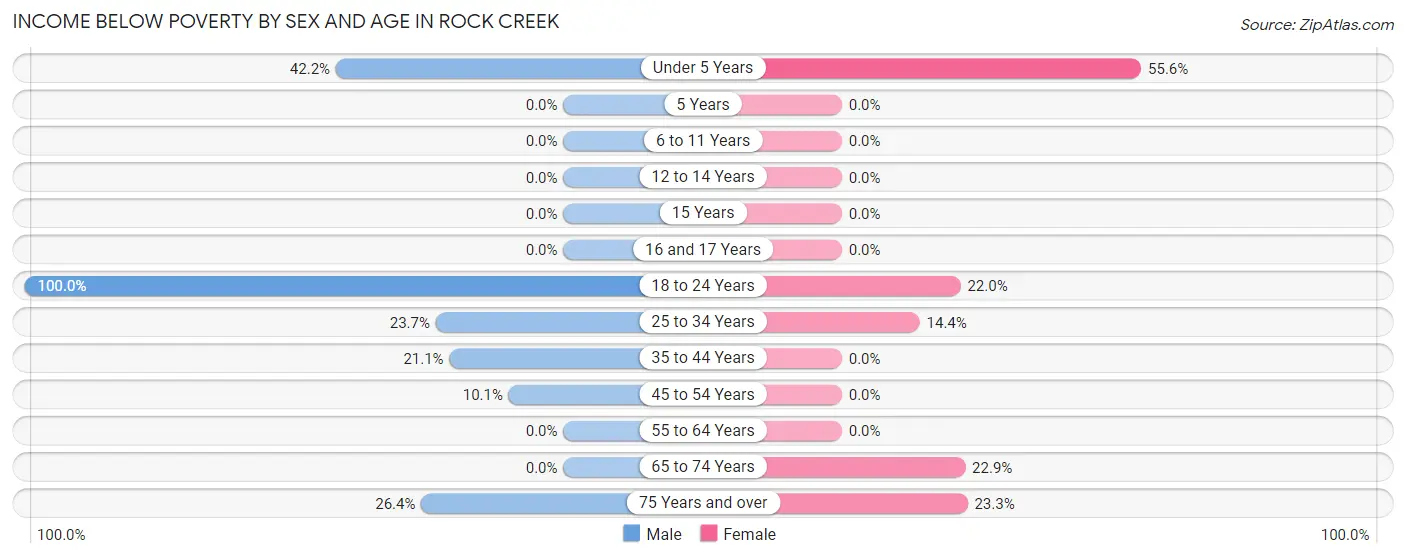
| Age Bracket | Male | Female |
| Under 5 Years | 19 (42.2%) | 15 (55.6%) |
| 5 Years | 0 (0.0%) | 0 (0.0%) |
| 6 to 11 Years | 0 (0.0%) | 0 (0.0%) |
| 12 to 14 Years | 0 (0.0%) | 0 (0.0%) |
| 15 Years | 0 (0.0%) | 0 (0.0%) |
| 16 and 17 Years | 0 (0.0%) | 0 (0.0%) |
| 18 to 24 Years | 21 (100.0%) | 13 (22.0%) |
| 25 to 34 Years | 9 (23.7%) | 13 (14.4%) |
| 35 to 44 Years | 26 (21.1%) | 0 (0.0%) |
| 45 to 54 Years | 8 (10.1%) | 0 (0.0%) |
| 55 to 64 Years | 0 (0.0%) | 0 (0.0%) |
| 65 to 74 Years | 0 (0.0%) | 30 (22.9%) |
| 75 Years and over | 24 (26.4%) | 21 (23.3%) |
| Total | 107 (15.8%) | 92 (12.0%) |
Income Above Poverty by Sex and Age in Rock Creek
According to the poverty statistics in Rock Creek, males aged 5 years and females aged 35 to 44 years are the age groups that are most secure financially, with 100.0% of males and 100.0% of females in these age groups living above the poverty line.
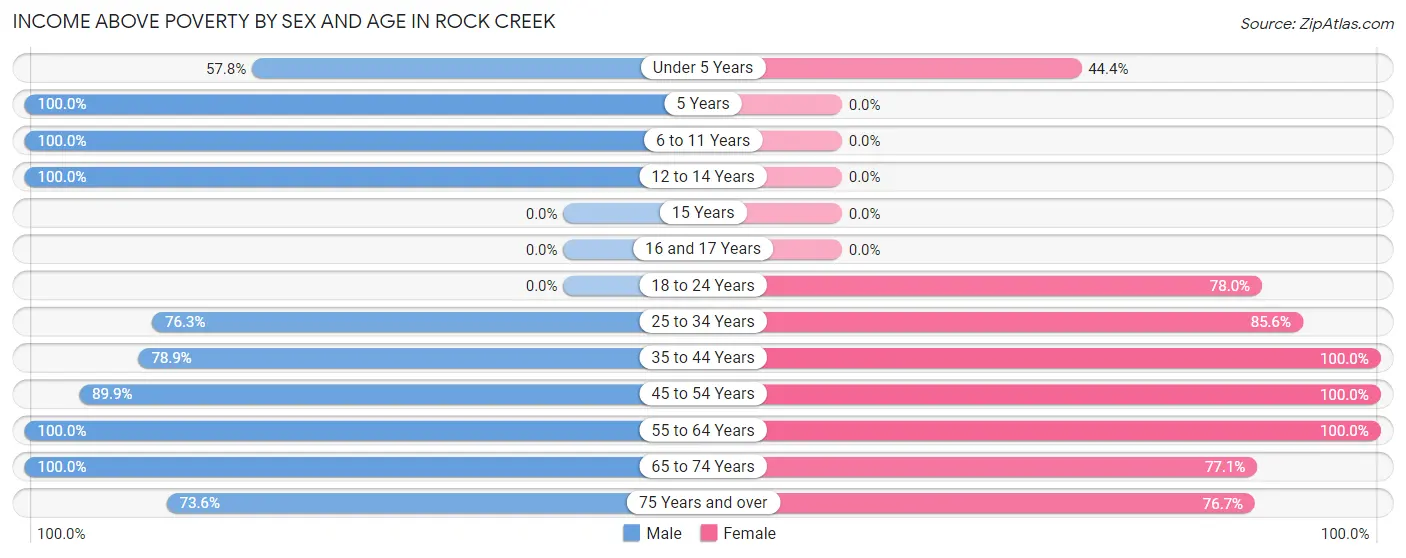
| Age Bracket | Male | Female |
| Under 5 Years | 26 (57.8%) | 12 (44.4%) |
| 5 Years | 10 (100.0%) | 0 (0.0%) |
| 6 to 11 Years | 24 (100.0%) | 0 (0.0%) |
| 12 to 14 Years | 10 (100.0%) | 0 (0.0%) |
| 15 Years | 0 (0.0%) | 0 (0.0%) |
| 16 and 17 Years | 0 (0.0%) | 0 (0.0%) |
| 18 to 24 Years | 0 (0.0%) | 46 (78.0%) |
| 25 to 34 Years | 29 (76.3%) | 77 (85.6%) |
| 35 to 44 Years | 97 (78.9%) | 85 (100.0%) |
| 45 to 54 Years | 71 (89.9%) | 132 (100.0%) |
| 55 to 64 Years | 170 (100.0%) | 154 (100.0%) |
| 65 to 74 Years | 67 (100.0%) | 101 (77.1%) |
| 75 Years and over | 67 (73.6%) | 69 (76.7%) |
| Total | 571 (84.2%) | 676 (88.0%) |
Income Below Poverty Among Married-Couple Families in Rock Creek
The poverty statistics for married-couple families in Rock Creek show that 11.7% or 37 of the total 317 families live below the poverty line. Families with 1 or 2 children have the highest poverty rate of 23.6%, comprising of 13 families. On the other hand, families with no children have the lowest poverty rate of 9.2%, which includes 24 families.
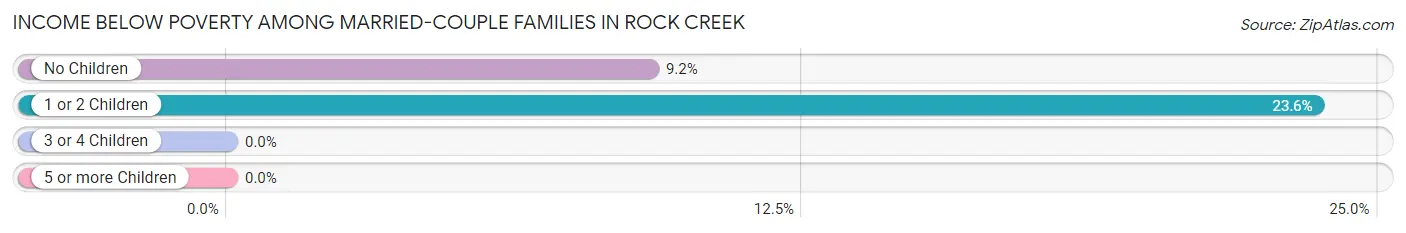
| Children | Above Poverty | Below Poverty |
| No Children | 238 (90.8%) | 24 (9.2%) |
| 1 or 2 Children | 42 (76.4%) | 13 (23.6%) |
| 3 or 4 Children | 0 (0.0%) | 0 (0.0%) |
| 5 or more Children | 0 (0.0%) | 0 (0.0%) |
| Total | 280 (88.3%) | 37 (11.7%) |
Income Below Poverty Among Single-Parent Households in Rock Creek
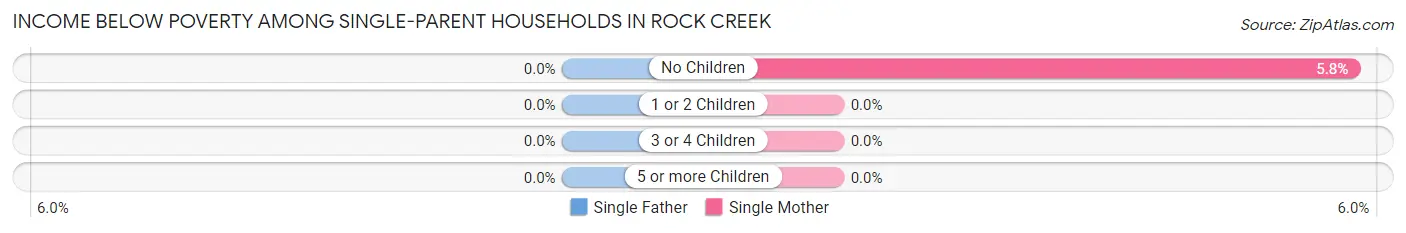
| Children | Single Father | Single Mother |
| No Children | 0 (0.0%) | 6 (5.8%) |
| 1 or 2 Children | 0 (0.0%) | 0 (0.0%) |
| 3 or 4 Children | 0 (0.0%) | 0 (0.0%) |
| 5 or more Children | 0 (0.0%) | 0 (0.0%) |
| Total | 0 (0.0%) | 6 (4.8%) |
Income Below Poverty Among Married-Couple vs Single-Parent Households in Rock Creek
The poverty data for Rock Creek shows that 37 of the married-couple family households (11.7%) and 6 of the single-parent households (4.8%) are living below the poverty level. Within the married-couple family households, those with 1 or 2 children have the highest poverty rate, with 13 households (23.6%) falling below the poverty line. Among the single-parent households, those with no children have the highest poverty rate, with 6 household (5.8%) living below poverty.
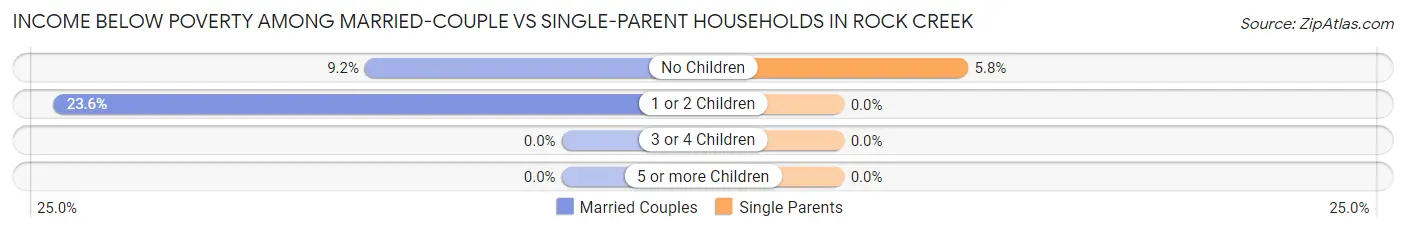
| Children | Married-Couple Families | Single-Parent Households |
| No Children | 24 (9.2%) | 6 (5.8%) |
| 1 or 2 Children | 13 (23.6%) | 0 (0.0%) |
| 3 or 4 Children | 0 (0.0%) | 0 (0.0%) |
| 5 or more Children | 0 (0.0%) | 0 (0.0%) |
| Total | 37 (11.7%) | 6 (4.8%) |
Race in Rock Creek
The most populous races in Rock Creek are White / Caucasian (1,309 | 90.5%), Two or more Races (75 | 5.2%), and Hispanic or Latino (56 | 3.9%).
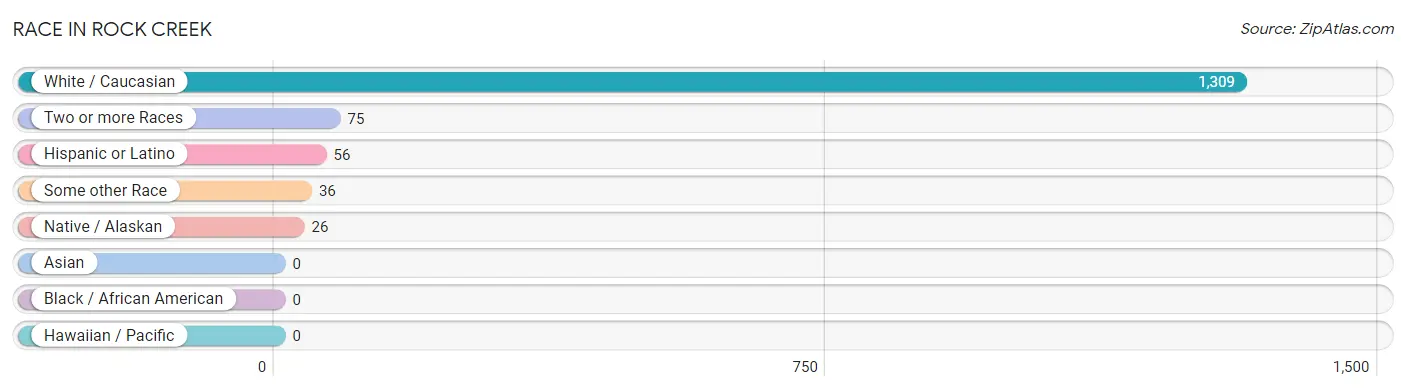
| Race | # Population | % Population |
| Asian | 0 | 0.0% |
| Black / African American | 0 | 0.0% |
| Hawaiian / Pacific | 0 | 0.0% |
| Hispanic or Latino | 56 | 3.9% |
| Native / Alaskan | 26 | 1.8% |
| White / Caucasian | 1,309 | 90.5% |
| Two or more Races | 75 | 5.2% |
| Some other Race | 36 | 2.5% |
| Total | 1,446 | 100.0% |
Ancestry in Rock Creek
The most populous ancestries reported in Rock Creek are American (423 | 29.2%), English (355 | 24.5%), Irish (129 | 8.9%), German (107 | 7.4%), and Mexican (56 | 3.9%), together accounting for 74.0% of all Rock Creek residents.
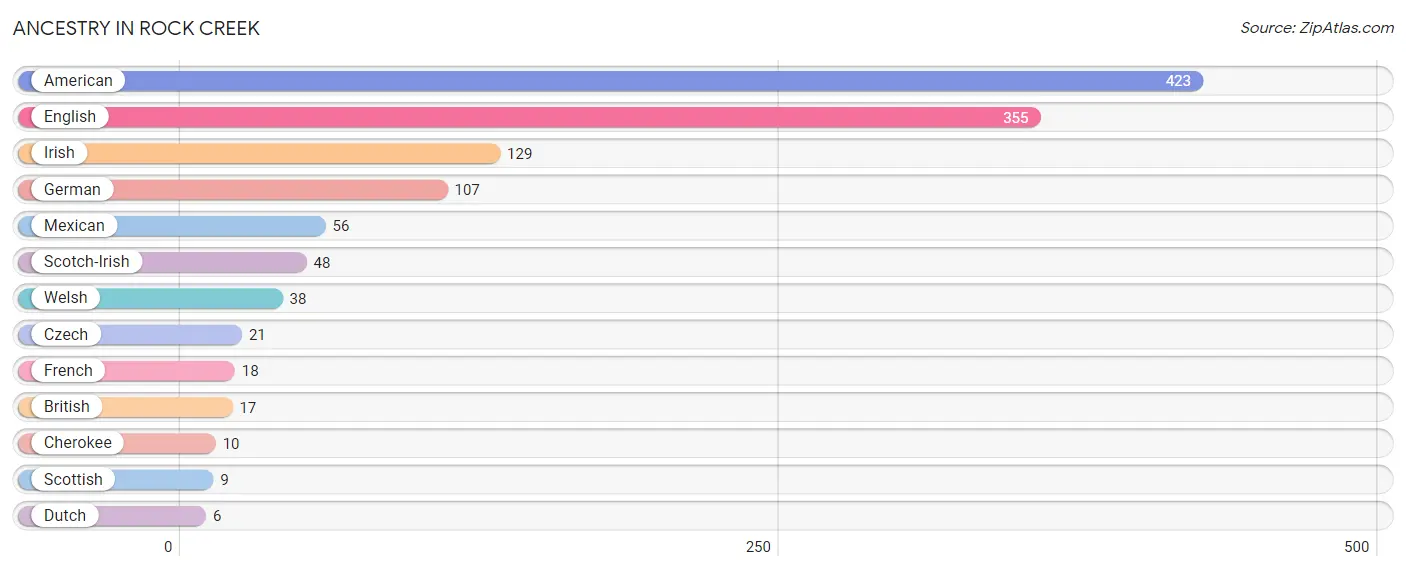
| Ancestry | # Population | % Population |
| American | 423 | 29.2% |
| British | 17 | 1.2% |
| Cherokee | 10 | 0.7% |
| Czech | 21 | 1.5% |
| Dutch | 6 | 0.4% |
| English | 355 | 24.5% |
| French | 18 | 1.2% |
| German | 107 | 7.4% |
| Irish | 129 | 8.9% |
| Mexican | 56 | 3.9% |
| Scotch-Irish | 48 | 3.3% |
| Scottish | 9 | 0.6% |
| Welsh | 38 | 2.6% | View All 13 Rows |
Immigrants in Rock Creek
The most numerous immigrant groups reported in Rock Creek came from Europe (8 | 0.5%), Germany (8 | 0.5%), and Western Europe (8 | 0.5%), together accounting for 1.7% of all Rock Creek residents.
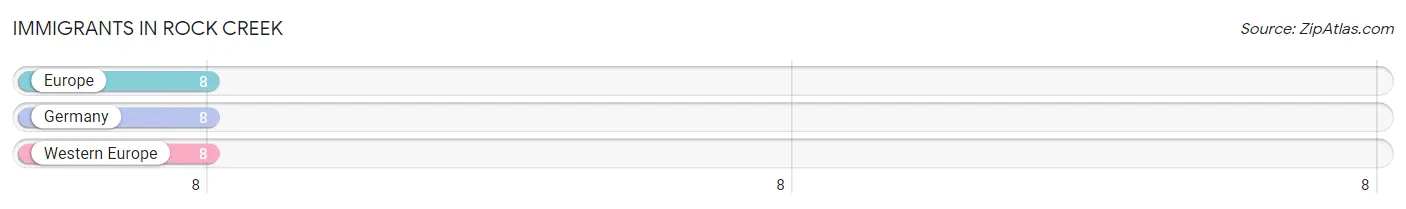
| Immigration Origin | # Population | % Population |
| Europe | 8 | 0.5% |
| Germany | 8 | 0.5% |
| Western Europe | 8 | 0.5% | View All 3 Rows |
Sex and Age in Rock Creek
Sex and Age in Rock Creek
The most populous age groups in Rock Creek are 55 to 59 Years (155 | 22.9%) for men and 55 to 59 Years (109 | 14.2%) for women.
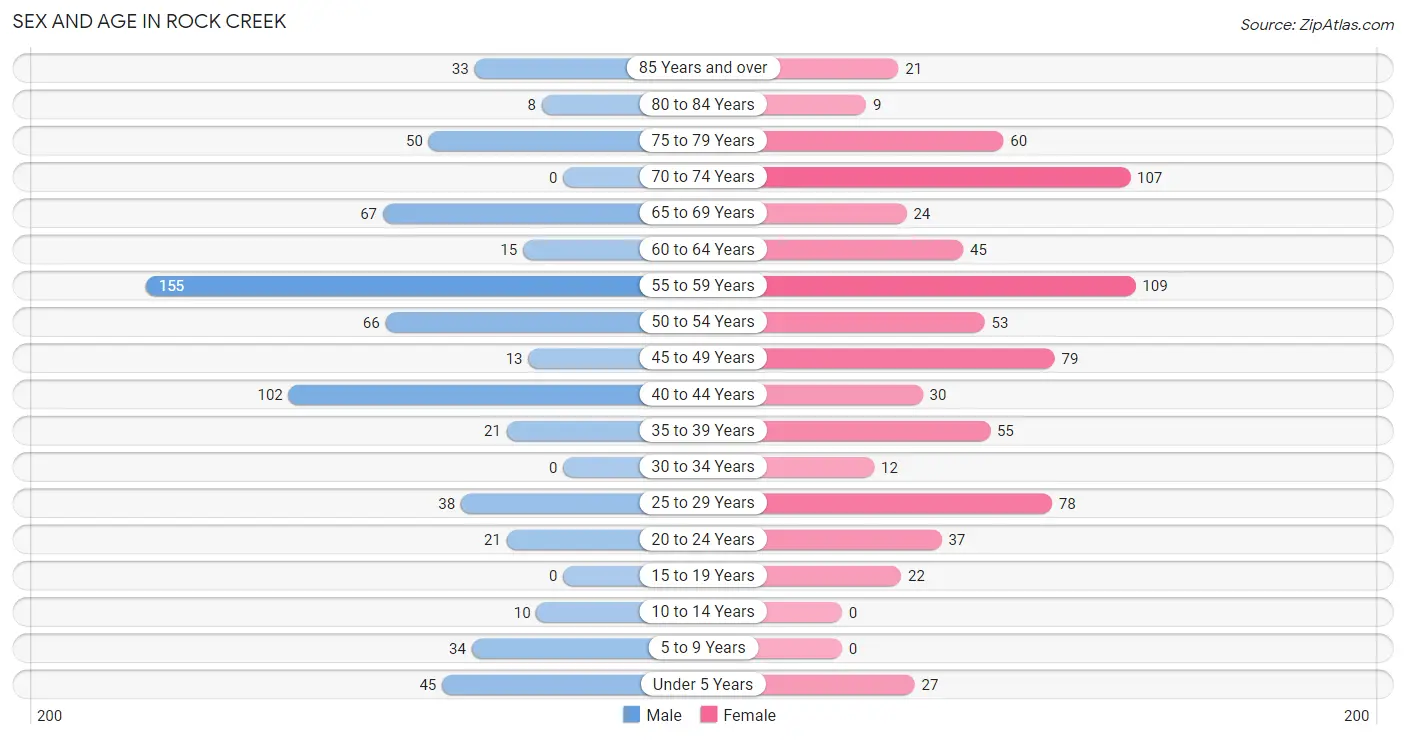
| Age Bracket | Male | Female |
| Under 5 Years | 45 (6.6%) | 27 (3.5%) |
| 5 to 9 Years | 34 (5.0%) | 0 (0.0%) |
| 10 to 14 Years | 10 (1.5%) | 0 (0.0%) |
| 15 to 19 Years | 0 (0.0%) | 22 (2.9%) |
| 20 to 24 Years | 21 (3.1%) | 37 (4.8%) |
| 25 to 29 Years | 38 (5.6%) | 78 (10.2%) |
| 30 to 34 Years | 0 (0.0%) | 12 (1.6%) |
| 35 to 39 Years | 21 (3.1%) | 55 (7.2%) |
| 40 to 44 Years | 102 (15.0%) | 30 (3.9%) |
| 45 to 49 Years | 13 (1.9%) | 79 (10.3%) |
| 50 to 54 Years | 66 (9.7%) | 53 (6.9%) |
| 55 to 59 Years | 155 (22.9%) | 109 (14.2%) |
| 60 to 64 Years | 15 (2.2%) | 45 (5.9%) |
| 65 to 69 Years | 67 (9.9%) | 24 (3.1%) |
| 70 to 74 Years | 0 (0.0%) | 107 (13.9%) |
| 75 to 79 Years | 50 (7.4%) | 60 (7.8%) |
| 80 to 84 Years | 8 (1.2%) | 9 (1.2%) |
| 85 Years and over | 33 (4.9%) | 21 (2.7%) |
| Total | 678 (100.0%) | 768 (100.0%) |
Families and Households in Rock Creek
Median Family Size in Rock Creek
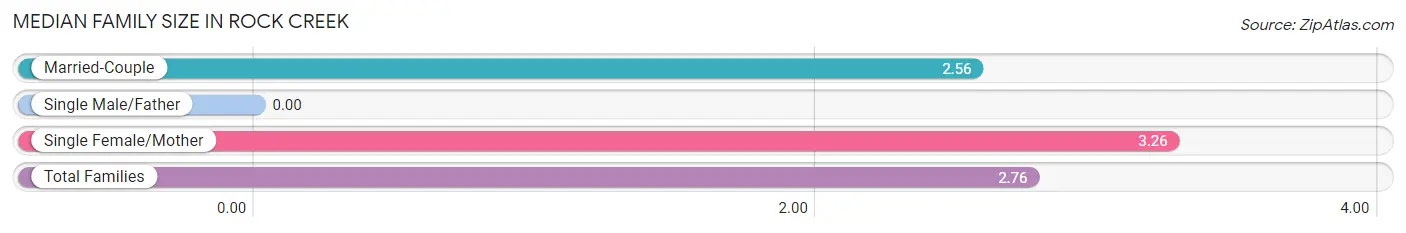
| Family Type | # Families | Family Size |
| Married-Couple | 317 (71.7%) | 2.56 |
| Single Male/Father | 0 (0.0%) | - |
| Single Female/Mother | 125 (28.3%) | 3.26 |
| Total Families | 442 (100.0%) | 2.76 |
Median Household Size in Rock Creek
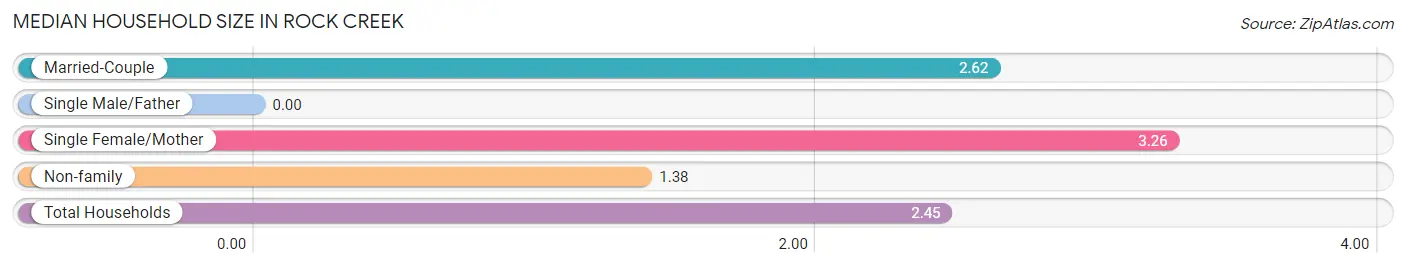
| Household Type | # Households | Household Size |
| Married-Couple | 317 (53.6%) | 2.62 |
| Single Male/Father | 0 (0.0%) | - |
| Single Female/Mother | 125 (21.1%) | 3.26 |
| Non-family | 149 (25.2%) | 1.38 |
| Total Households | 591 (100.0%) | 2.45 |
Household Size by Marriage Status in Rock Creek
Out of a total of 591 households in Rock Creek, 442 (74.8%) are family households, while 149 (25.2%) are nonfamily households. The most numerous type of family households are 2-person households, comprising 289, and the most common type of nonfamily households are 1-person households, comprising 91.
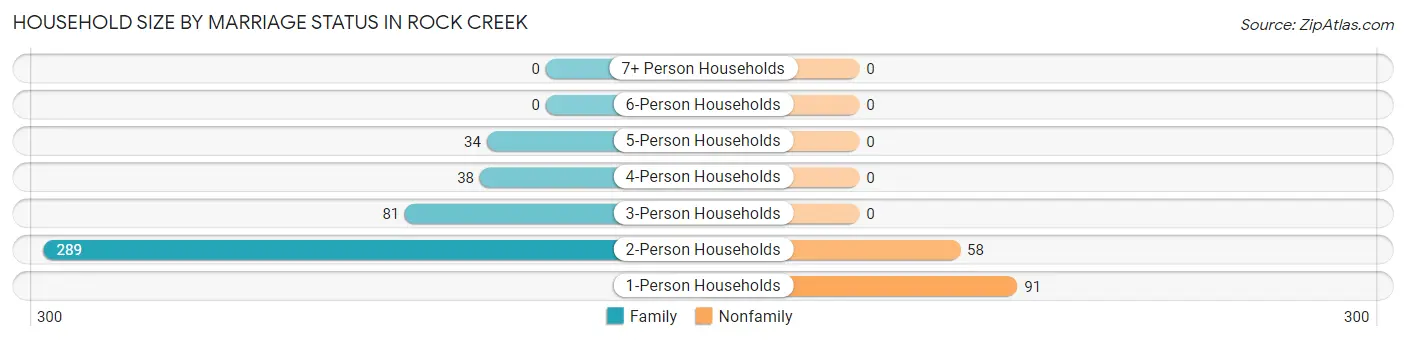
| Household Size | Family Households | Nonfamily Households |
| 1-Person Households | - | 91 (15.4%) |
| 2-Person Households | 289 (48.9%) | 58 (9.8%) |
| 3-Person Households | 81 (13.7%) | 0 (0.0%) |
| 4-Person Households | 38 (6.4%) | 0 (0.0%) |
| 5-Person Households | 34 (5.8%) | 0 (0.0%) |
| 6-Person Households | 0 (0.0%) | 0 (0.0%) |
| 7+ Person Households | 0 (0.0%) | 0 (0.0%) |
| Total | 442 (74.8%) | 149 (25.2%) |
Female Fertility in Rock Creek
Fertility by Age in Rock Creek
Average fertility rate in Rock Creek is 42.0 births per 1,000 women. Women in the age bracket of 20 to 34 years have the highest fertility rate with 102.0 births per 1,000 women. Women in the age bracket of 20 to 34 years acount for 100.0% of all women with births.
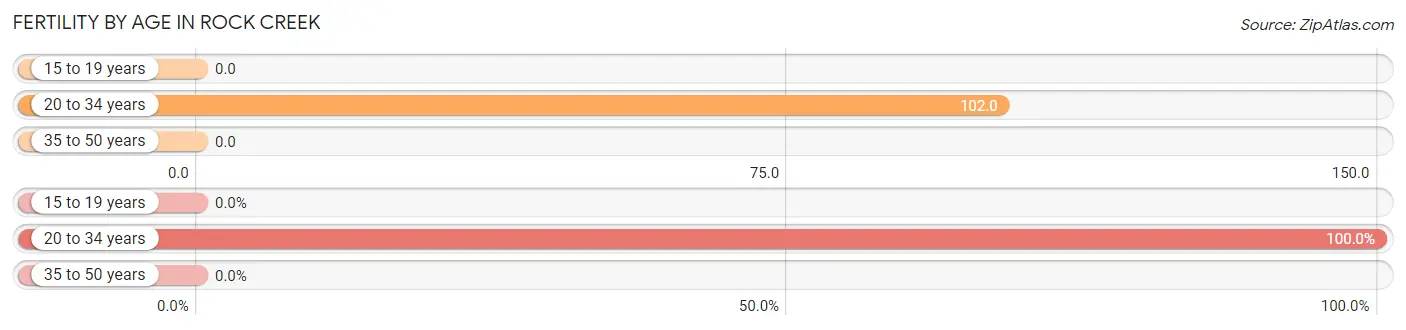
| Age Bracket | Women with Births | Births / 1,000 Women |
| 15 to 19 years | 0 (0.0%) | 0.0 |
| 20 to 34 years | 13 (100.0%) | 102.0 |
| 35 to 50 years | 0 (0.0%) | 0.0 |
| Total | 13 (100.0%) | 42.0 |
Fertility by Age by Marriage Status in Rock Creek
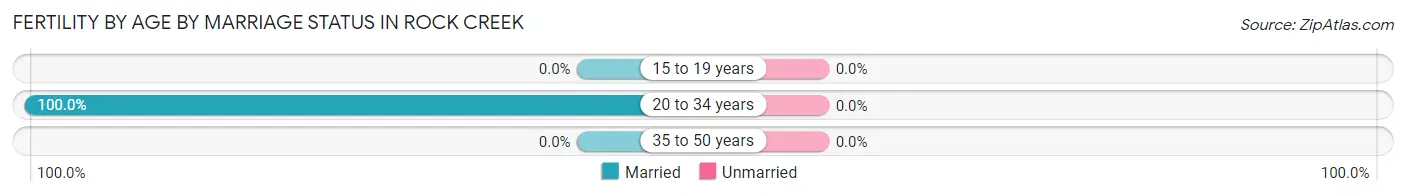
| Age Bracket | Married | Unmarried |
| 15 to 19 years | 0 (0.0%) | 0 (0.0%) |
| 20 to 34 years | 13 (100.0%) | 0 (0.0%) |
| 35 to 50 years | 0 (0.0%) | 0 (0.0%) |
| Total | 13 (100.0%) | 0 (0.0%) |
Fertility by Education in Rock Creek
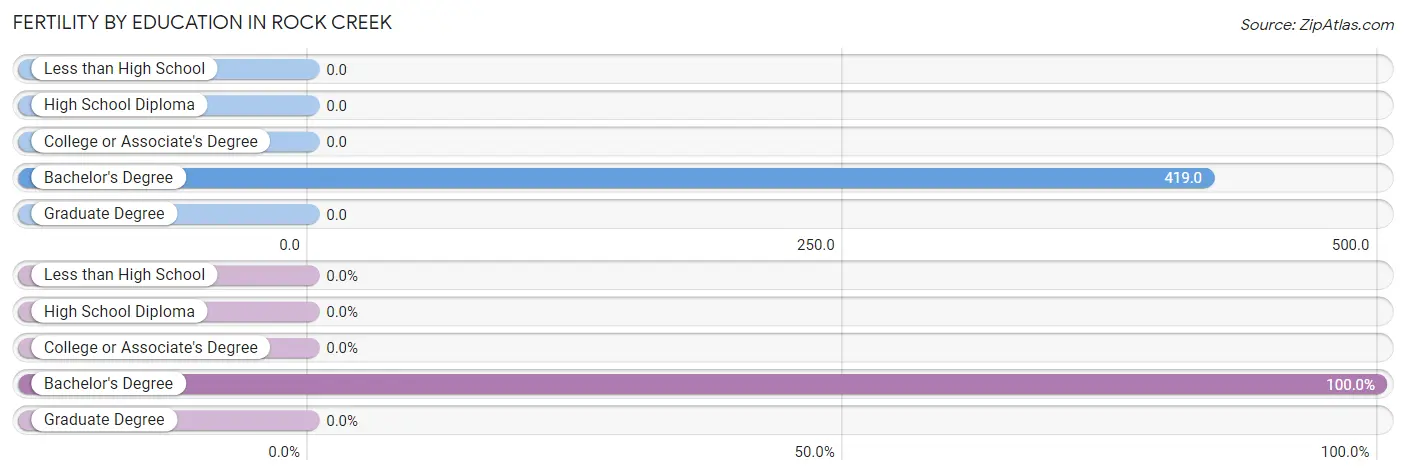
| Educational Attainment | Women with Births | Births / 1,000 Women |
| Less than High School | 0 (0.0%) | 0.0 |
| High School Diploma | 0 (0.0%) | 0.0 |
| College or Associate's Degree | 0 (0.0%) | 0.0 |
| Bachelor's Degree | 13 (100.0%) | 419.0 |
| Graduate Degree | 0 (0.0%) | 0.0 |
| Total | 13 (100.0%) | 42.0 |
Fertility by Education by Marriage Status in Rock Creek
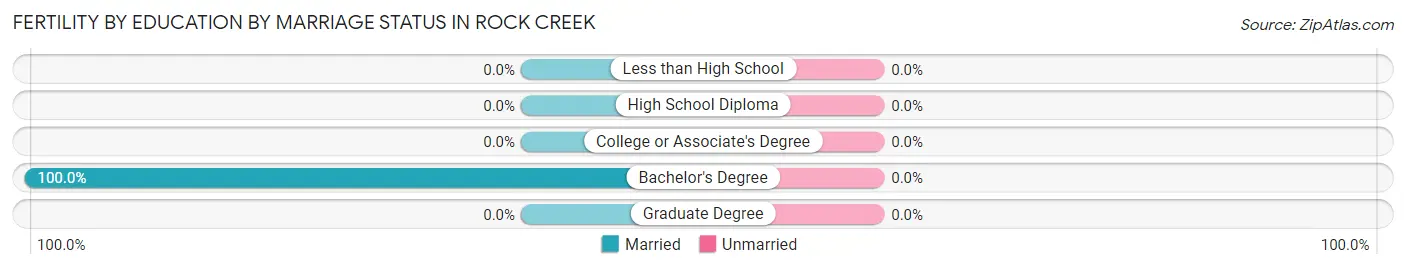
| Educational Attainment | Married | Unmarried |
| Less than High School | 0 (0.0%) | 0 (0.0%) |
| High School Diploma | 0 (0.0%) | 0 (0.0%) |
| College or Associate's Degree | 0 (0.0%) | 0 (0.0%) |
| Bachelor's Degree | 13 (100.0%) | 0 (0.0%) |
| Graduate Degree | 0 (0.0%) | 0 (0.0%) |
| Total | 13 (100.0%) | 0 (0.0%) |
Employment Characteristics in Rock Creek
Employment by Class of Employer in Rock Creek
Among the 705 employed individuals in Rock Creek, private company employees (438 | 62.1%), self-employed (not incorporated) (91 | 12.9%), and local government employees (83 | 11.8%) make up the most common classes of employment.
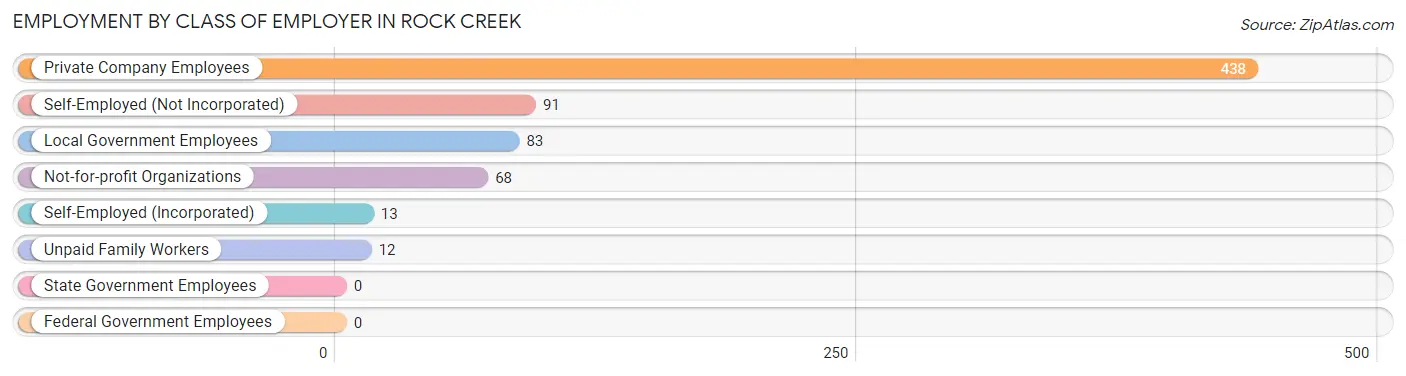
| Employer Class | # Employees | % Employees |
| Private Company Employees | 438 | 62.1% |
| Self-Employed (Incorporated) | 13 | 1.8% |
| Self-Employed (Not Incorporated) | 91 | 12.9% |
| Not-for-profit Organizations | 68 | 9.7% |
| Local Government Employees | 83 | 11.8% |
| State Government Employees | 0 | 0.0% |
| Federal Government Employees | 0 | 0.0% |
| Unpaid Family Workers | 12 | 1.7% |
| Total | 705 | 100.0% |
Employment Status by Age in Rock Creek
According to the labor force statistics for Rock Creek, out of the total population over 16 years of age (1,330), 55.1% or 733 individuals are in the labor force, with 3.8% or 28 of them unemployed. The age group with the highest labor force participation rate is 16 to 19 years, with 100.0% or 22 individuals in the labor force. Within the labor force, the 25 to 29 years age range has the highest percentage of unemployed individuals, with 40.0% or 28 of them being unemployed.
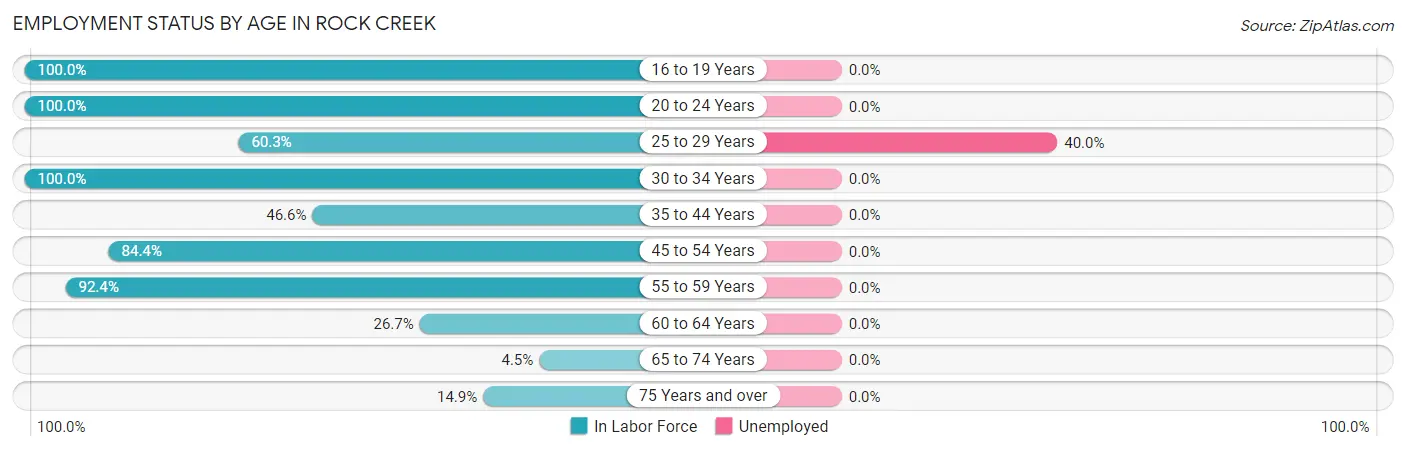
| Age Bracket | In Labor Force | Unemployed |
| 16 to 19 Years | 22 (100.0%) | 0 (0.0%) |
| 20 to 24 Years | 58 (100.0%) | 0 (0.0%) |
| 25 to 29 Years | 70 (60.3%) | 28 (40.0%) |
| 30 to 34 Years | 12 (100.0%) | 0 (0.0%) |
| 35 to 44 Years | 97 (46.6%) | 0 (0.0%) |
| 45 to 54 Years | 178 (84.4%) | 0 (0.0%) |
| 55 to 59 Years | 244 (92.4%) | 0 (0.0%) |
| 60 to 64 Years | 16 (26.7%) | 0 (0.0%) |
| 65 to 74 Years | 9 (4.5%) | 0 (0.0%) |
| 75 Years and over | 27 (14.9%) | 0 (0.0%) |
| Total | 733 (55.1%) | 28 (3.8%) |
Employment Status by Educational Attainment in Rock Creek
According to labor force statistics for Rock Creek, 70.8% of individuals (617) out of the total population between 25 and 64 years of age (871) are in the labor force, with 4.5% or 28 of them being unemployed. The group with the highest labor force participation rate are those with the educational attainment of bachelor's degree or higher, with 100.0% or 75 individuals in the labor force. Within the labor force, individuals with college / associate degree education have the highest percentage of unemployment, with 9.0% or 28 of them being unemployed.
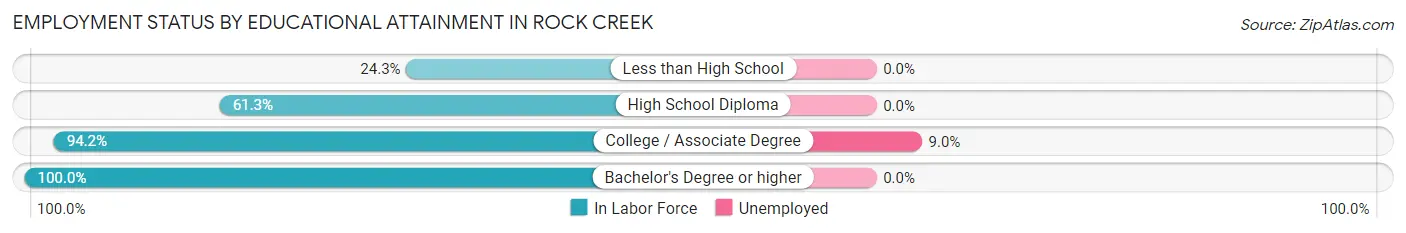
| Educational Attainment | In Labor Force | Unemployed |
| Less than High School | 36 (24.3%) | 0 (0.0%) |
| High School Diploma | 195 (61.3%) | 0 (0.0%) |
| College / Associate Degree | 311 (94.2%) | 30 (9.0%) |
| Bachelor's Degree or higher | 75 (100.0%) | 0 (0.0%) |
| Total | 617 (70.8%) | 39 (4.5%) |
Employment Occupations by Sex in Rock Creek
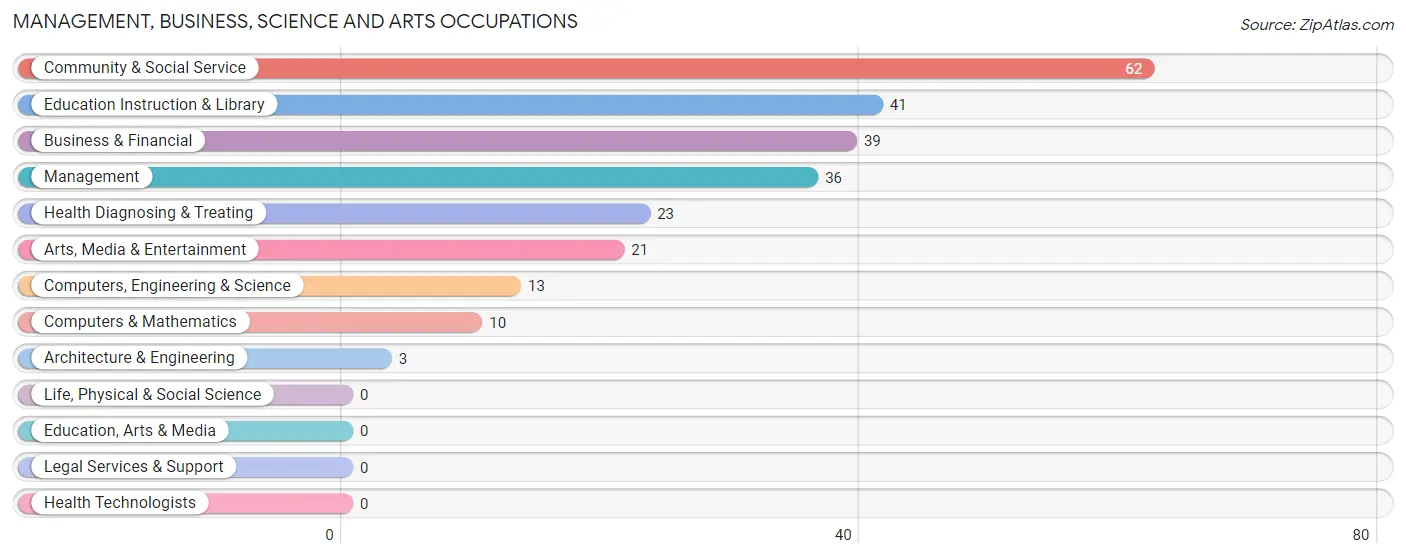
Management, Business, Science and Arts Occupations
The most common Management, Business, Science and Arts occupations in Rock Creek are Community & Social Service (62 | 8.8%), Education Instruction & Library (41 | 5.8%), Business & Financial (39 | 5.5%), Management (36 | 5.1%), and Health Diagnosing & Treating (23 | 3.3%).
Management, Business, Science and Arts Occupations by Sex
Within the Management, Business, Science and Arts occupations in Rock Creek, the most male-oriented occupations are Computers, Engineering & Science (100.0%), Computers & Mathematics (100.0%), and Architecture & Engineering (100.0%), while the most female-oriented occupations are Management (100.0%), Education Instruction & Library (100.0%), and Health Diagnosing & Treating (100.0%).
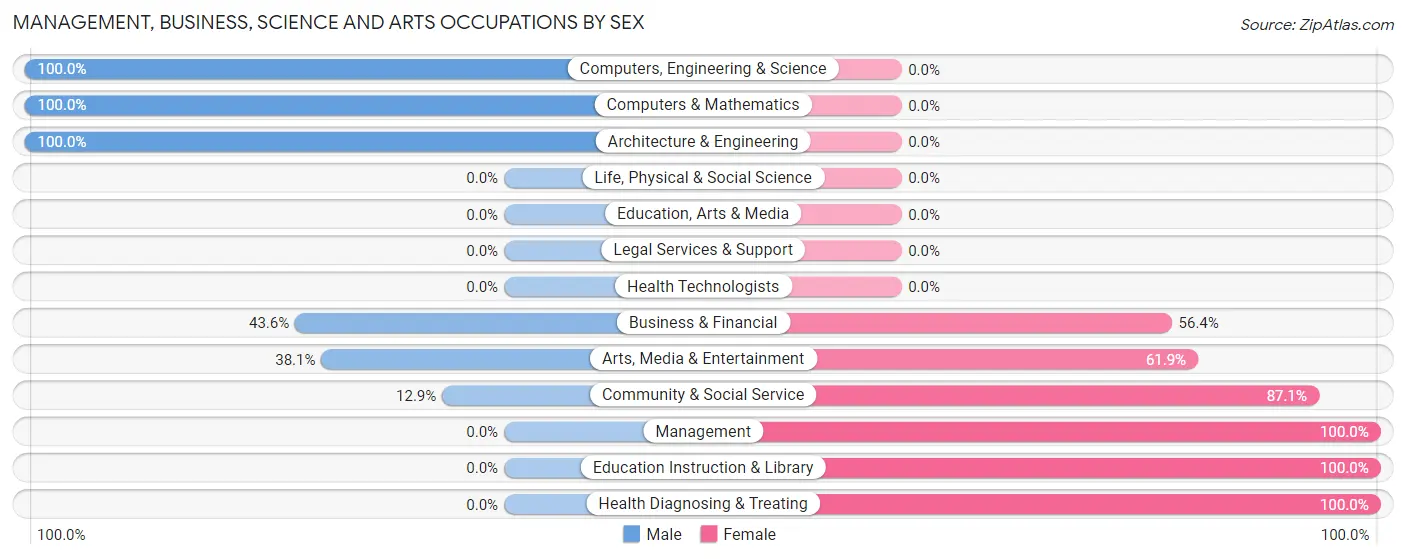
| Occupation | Male | Female |
| Management | 0 (0.0%) | 36 (100.0%) |
| Business & Financial | 17 (43.6%) | 22 (56.4%) |
| Computers, Engineering & Science | 13 (100.0%) | 0 (0.0%) |
| Computers & Mathematics | 10 (100.0%) | 0 (0.0%) |
| Architecture & Engineering | 3 (100.0%) | 0 (0.0%) |
| Life, Physical & Social Science | 0 (0.0%) | 0 (0.0%) |
| Community & Social Service | 8 (12.9%) | 54 (87.1%) |
| Education, Arts & Media | 0 (0.0%) | 0 (0.0%) |
| Legal Services & Support | 0 (0.0%) | 0 (0.0%) |
| Education Instruction & Library | 0 (0.0%) | 41 (100.0%) |
| Arts, Media & Entertainment | 8 (38.1%) | 13 (61.9%) |
| Health Diagnosing & Treating | 0 (0.0%) | 23 (100.0%) |
| Health Technologists | 0 (0.0%) | 0 (0.0%) |
| Total (Category) | 38 (22.0%) | 135 (78.0%) |
| Total (Overall) | 346 (49.1%) | 359 (50.9%) |
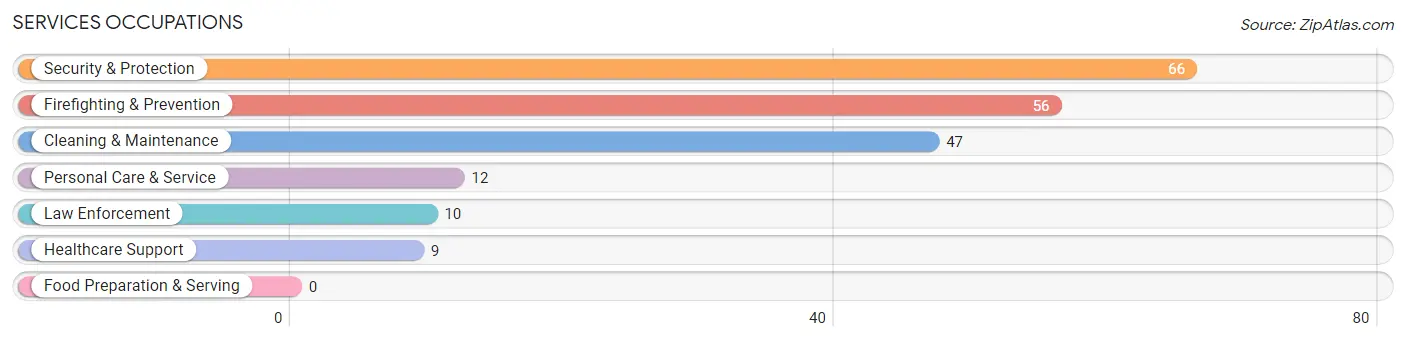
Services Occupations
The most common Services occupations in Rock Creek are Security & Protection (66 | 9.4%), Firefighting & Prevention (56 | 7.9%), Cleaning & Maintenance (47 | 6.7%), Personal Care & Service (12 | 1.7%), and Law Enforcement (10 | 1.4%).
Services Occupations by Sex
Within the Services occupations in Rock Creek, the most male-oriented occupations are Security & Protection (100.0%), Firefighting & Prevention (100.0%), and Law Enforcement (100.0%), while the most female-oriented occupations are Healthcare Support (100.0%), Personal Care & Service (100.0%), and Cleaning & Maintenance (27.7%).
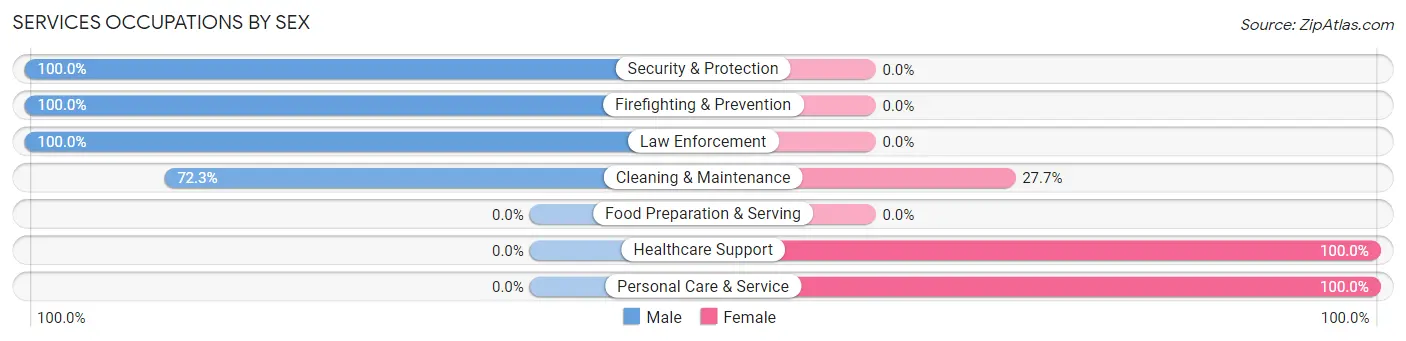
| Occupation | Male | Female |
| Healthcare Support | 0 (0.0%) | 9 (100.0%) |
| Security & Protection | 66 (100.0%) | 0 (0.0%) |
| Firefighting & Prevention | 56 (100.0%) | 0 (0.0%) |
| Law Enforcement | 10 (100.0%) | 0 (0.0%) |
| Food Preparation & Serving | 0 (0.0%) | 0 (0.0%) |
| Cleaning & Maintenance | 34 (72.3%) | 13 (27.7%) |
| Personal Care & Service | 0 (0.0%) | 12 (100.0%) |
| Total (Category) | 100 (74.6%) | 34 (25.4%) |
| Total (Overall) | 346 (49.1%) | 359 (50.9%) |
Sales and Office Occupations
The most common Sales and Office occupations in Rock Creek are Office & Administration (125 | 17.7%), and Sales & Related (107 | 15.2%).

Sales and Office Occupations by Sex

| Occupation | Male | Female |
| Sales & Related | 29 (27.1%) | 78 (72.9%) |
| Office & Administration | 21 (16.8%) | 104 (83.2%) |
| Total (Category) | 50 (21.5%) | 182 (78.4%) |
| Total (Overall) | 346 (49.1%) | 359 (50.9%) |
Natural Resources, Construction and Maintenance Occupations
The most common Natural Resources, Construction and Maintenance occupations in Rock Creek are , and Installation, Maintenance & Repair (95 | 13.5%).
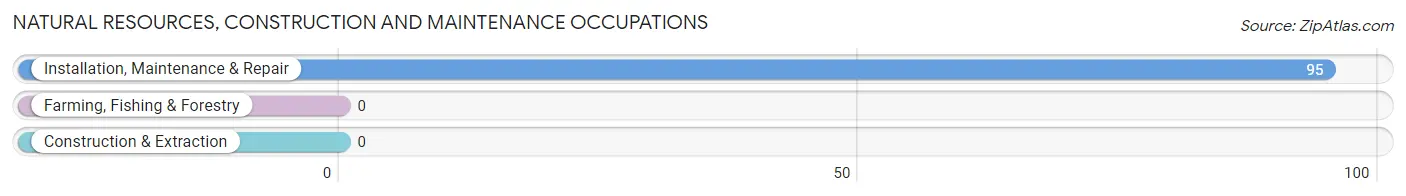
Natural Resources, Construction and Maintenance Occupations by Sex

| Occupation | Male | Female |
| Farming, Fishing & Forestry | 0 (0.0%) | 0 (0.0%) |
| Construction & Extraction | 0 (0.0%) | 0 (0.0%) |
| Installation, Maintenance & Repair | 95 (100.0%) | 0 (0.0%) |
| Total (Category) | 95 (100.0%) | 0 (0.0%) |
| Total (Overall) | 346 (49.1%) | 359 (50.9%) |
Production, Transportation and Moving Occupations
The most common Production, Transportation and Moving occupations in Rock Creek are Transportation (43 | 6.1%), and Production (28 | 4.0%).
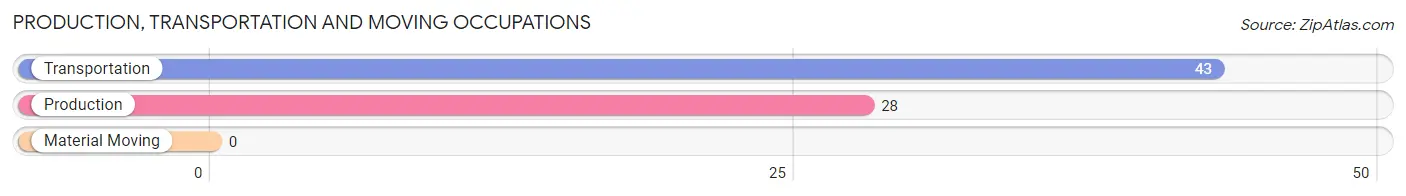
Production, Transportation and Moving Occupations by Sex
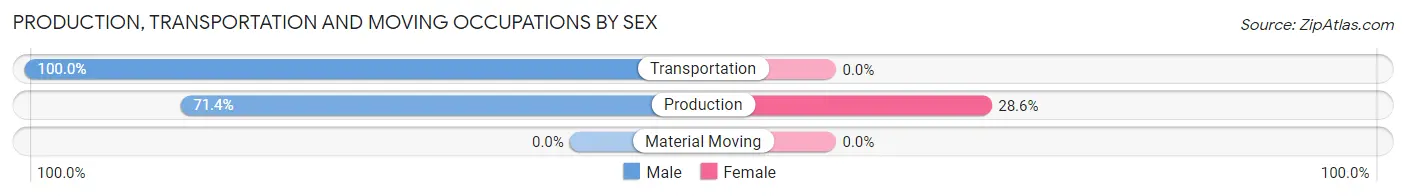
| Occupation | Male | Female |
| Production | 20 (71.4%) | 8 (28.6%) |
| Transportation | 43 (100.0%) | 0 (0.0%) |
| Material Moving | 0 (0.0%) | 0 (0.0%) |
| Total (Category) | 63 (88.7%) | 8 (11.3%) |
| Total (Overall) | 346 (49.1%) | 359 (50.9%) |
Employment Industries by Sex in Rock Creek
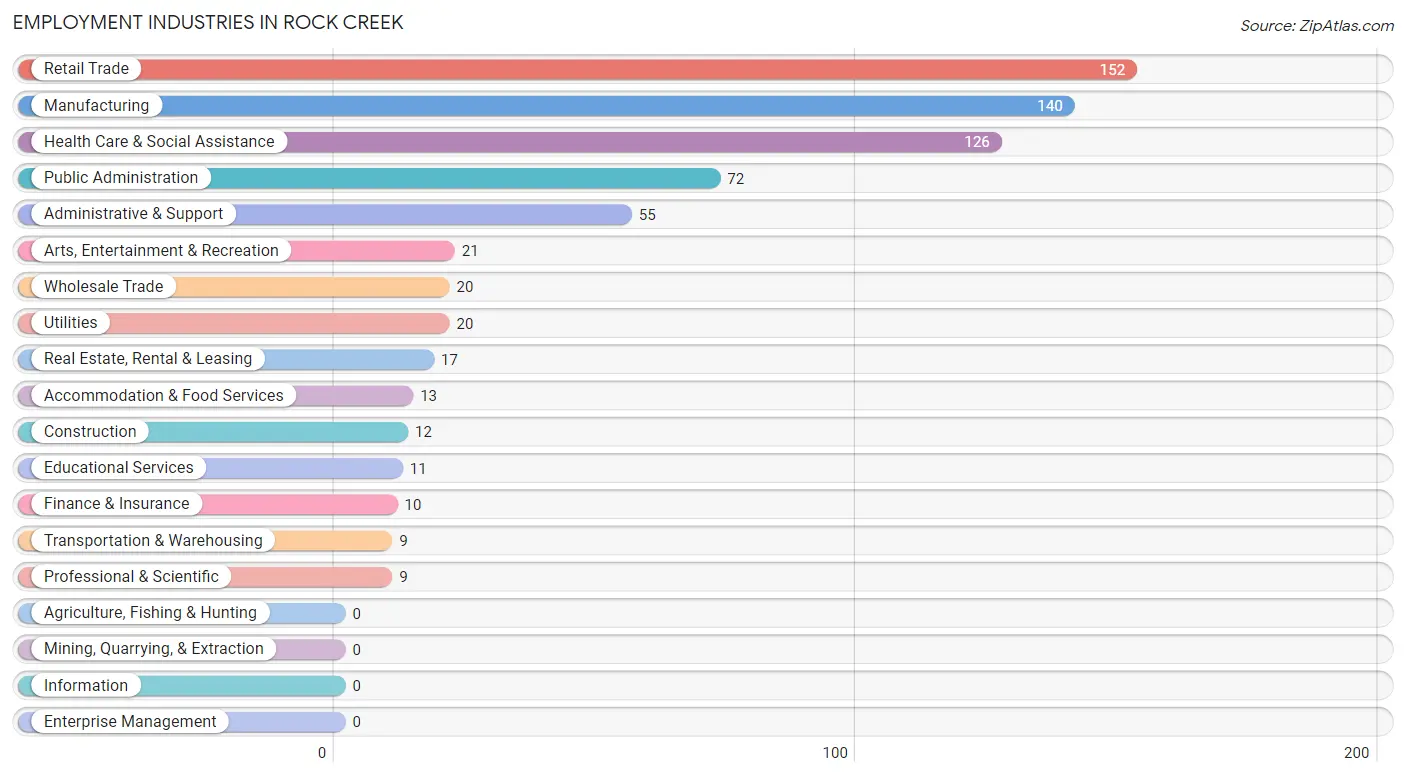
Employment Industries in Rock Creek
The major employment industries in Rock Creek include Retail Trade (152 | 21.6%), Manufacturing (140 | 19.9%), Health Care & Social Assistance (126 | 17.9%), Public Administration (72 | 10.2%), and Administrative & Support (55 | 7.8%).
Employment Industries by Sex in Rock Creek
The Rock Creek industries that see more men than women are Transportation & Warehousing (100.0%), Real Estate, Rental & Leasing (100.0%), and Administrative & Support (100.0%), whereas the industries that tend to have a higher number of women are Construction (100.0%), Finance & Insurance (100.0%), and Professional & Scientific (100.0%).
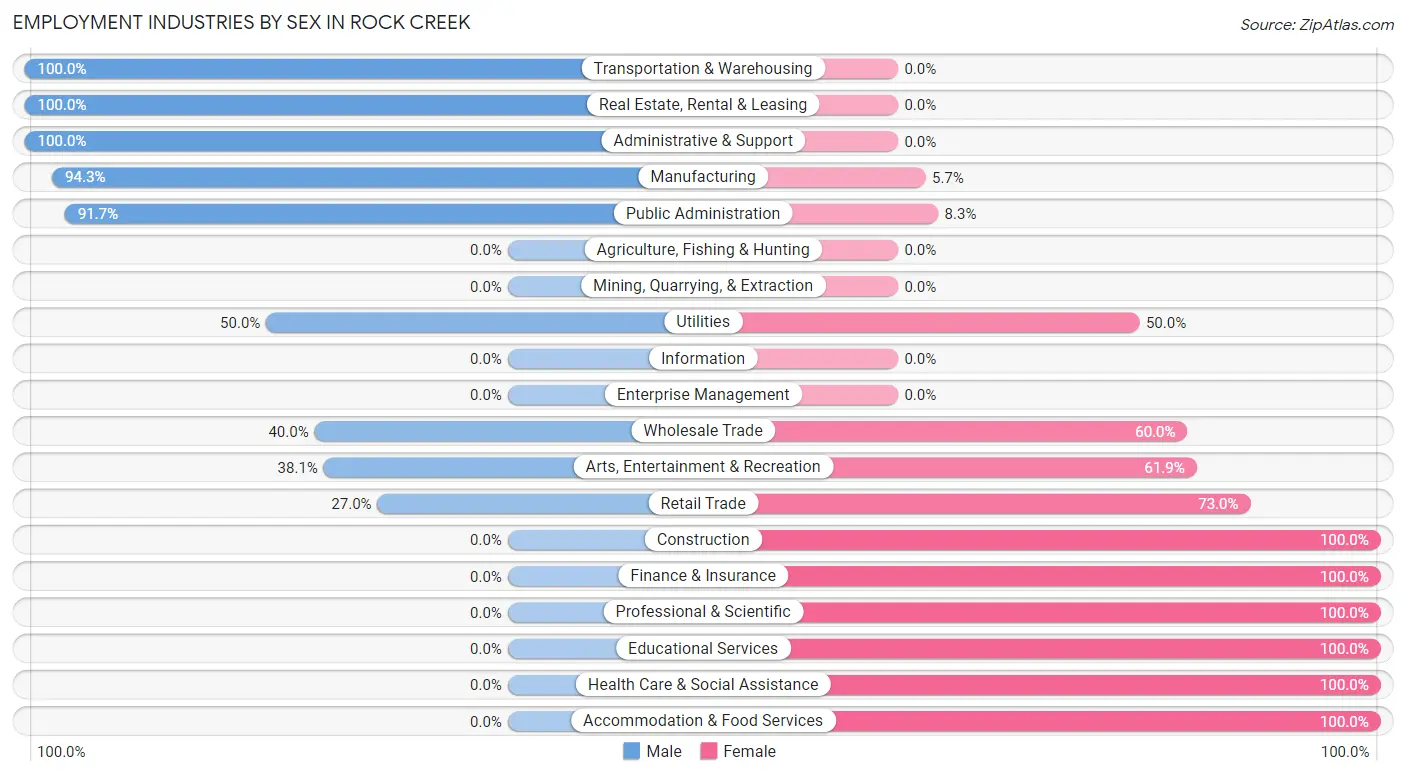
| Industry | Male | Female |
| Agriculture, Fishing & Hunting | 0 (0.0%) | 0 (0.0%) |
| Mining, Quarrying, & Extraction | 0 (0.0%) | 0 (0.0%) |
| Construction | 0 (0.0%) | 12 (100.0%) |
| Manufacturing | 132 (94.3%) | 8 (5.7%) |
| Wholesale Trade | 8 (40.0%) | 12 (60.0%) |
| Retail Trade | 41 (27.0%) | 111 (73.0%) |
| Transportation & Warehousing | 9 (100.0%) | 0 (0.0%) |
| Utilities | 10 (50.0%) | 10 (50.0%) |
| Information | 0 (0.0%) | 0 (0.0%) |
| Finance & Insurance | 0 (0.0%) | 10 (100.0%) |
| Real Estate, Rental & Leasing | 17 (100.0%) | 0 (0.0%) |
| Professional & Scientific | 0 (0.0%) | 9 (100.0%) |
| Enterprise Management | 0 (0.0%) | 0 (0.0%) |
| Administrative & Support | 55 (100.0%) | 0 (0.0%) |
| Educational Services | 0 (0.0%) | 11 (100.0%) |
| Health Care & Social Assistance | 0 (0.0%) | 126 (100.0%) |
| Arts, Entertainment & Recreation | 8 (38.1%) | 13 (61.9%) |
| Accommodation & Food Services | 0 (0.0%) | 13 (100.0%) |
| Public Administration | 66 (91.7%) | 6 (8.3%) |
| Total | 346 (49.1%) | 359 (50.9%) |
Education in Rock Creek
School Enrollment in Rock Creek
The most common levels of schooling among the 66 students in Rock Creek are nursery / preschool (22 | 33.3%), college / undergraduate (21 | 31.8%), and elementary school (13 | 19.7%).
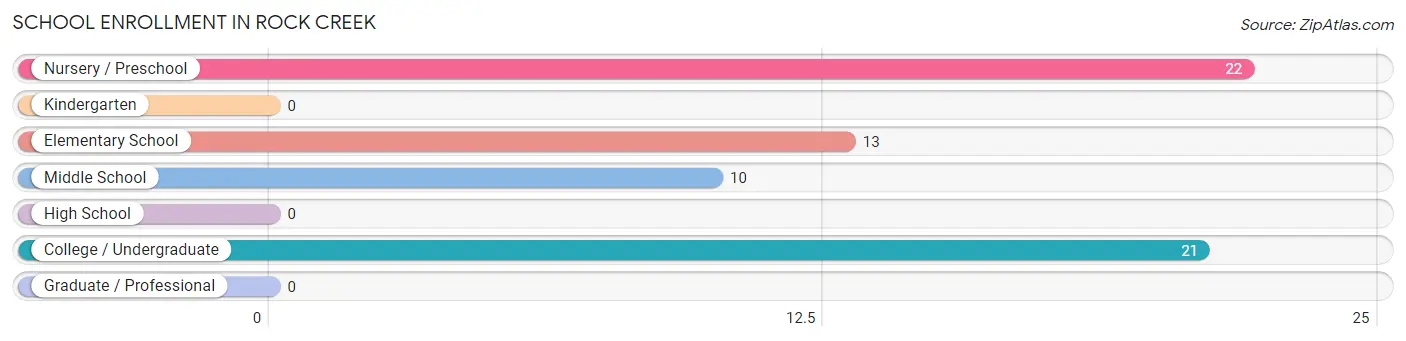
| School Level | # Students | % Students |
| Nursery / Preschool | 22 | 33.3% |
| Kindergarten | 0 | 0.0% |
| Elementary School | 13 | 19.7% |
| Middle School | 10 | 15.1% |
| High School | 0 | 0.0% |
| College / Undergraduate | 21 | 31.8% |
| Graduate / Professional | 0 | 0.0% |
| Total | 66 | 100.0% |
School Enrollment by Age by Funding Source in Rock Creek
Out of a total of 66 students who are enrolled in schools in Rock Creek, 22 (33.3%) attend a private institution, while the remaining 44 (66.7%) are enrolled in public schools. The age group of 3 to 4 year olds has the highest likelihood of being enrolled in private schools, with 12 (100.0% in the age bracket) enrolled. Conversely, the age group of 10 to 14 year olds has the lowest likelihood of being enrolled in a private school, with 10 (100.0% in the age bracket) attending a public institution.
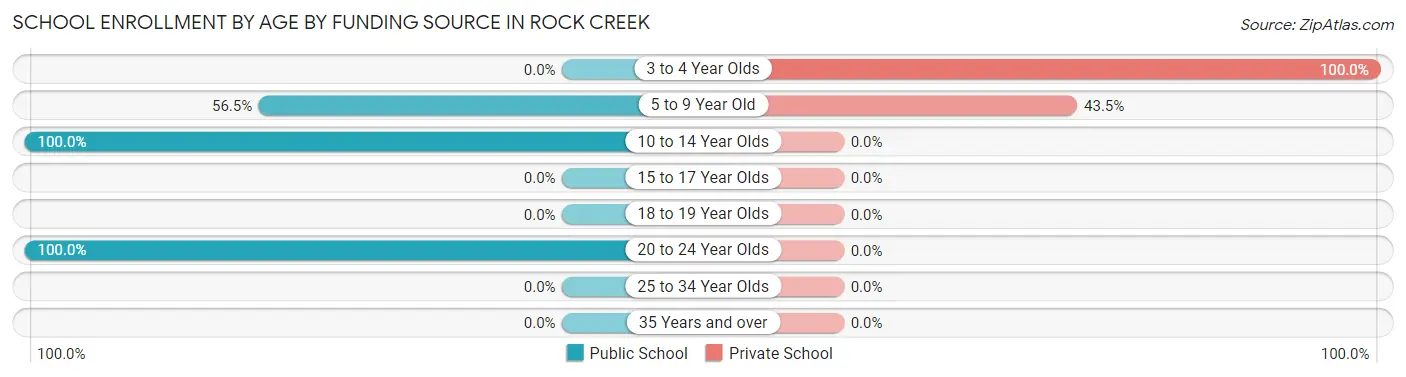
| Age Bracket | Public School | Private School |
| 3 to 4 Year Olds | 0 (0.0%) | 12 (100.0%) |
| 5 to 9 Year Old | 13 (56.5%) | 10 (43.5%) |
| 10 to 14 Year Olds | 10 (100.0%) | 0 (0.0%) |
| 15 to 17 Year Olds | 0 (0.0%) | 0 (0.0%) |
| 18 to 19 Year Olds | 0 (0.0%) | 0 (0.0%) |
| 20 to 24 Year Olds | 21 (100.0%) | 0 (0.0%) |
| 25 to 34 Year Olds | 0 (0.0%) | 0 (0.0%) |
| 35 Years and over | 0 (0.0%) | 0 (0.0%) |
| Total | 44 (66.7%) | 22 (33.3%) |
Educational Attainment by Field of Study in Rock Creek
Arts & humanities (25 | 26.6%), social sciences (18 | 19.2%), engineering (17 | 18.1%), business (17 | 18.1%), and science & technology (13 | 13.8%) are the most common fields of study among 94 individuals in Rock Creek who have obtained a bachelor's degree or higher.
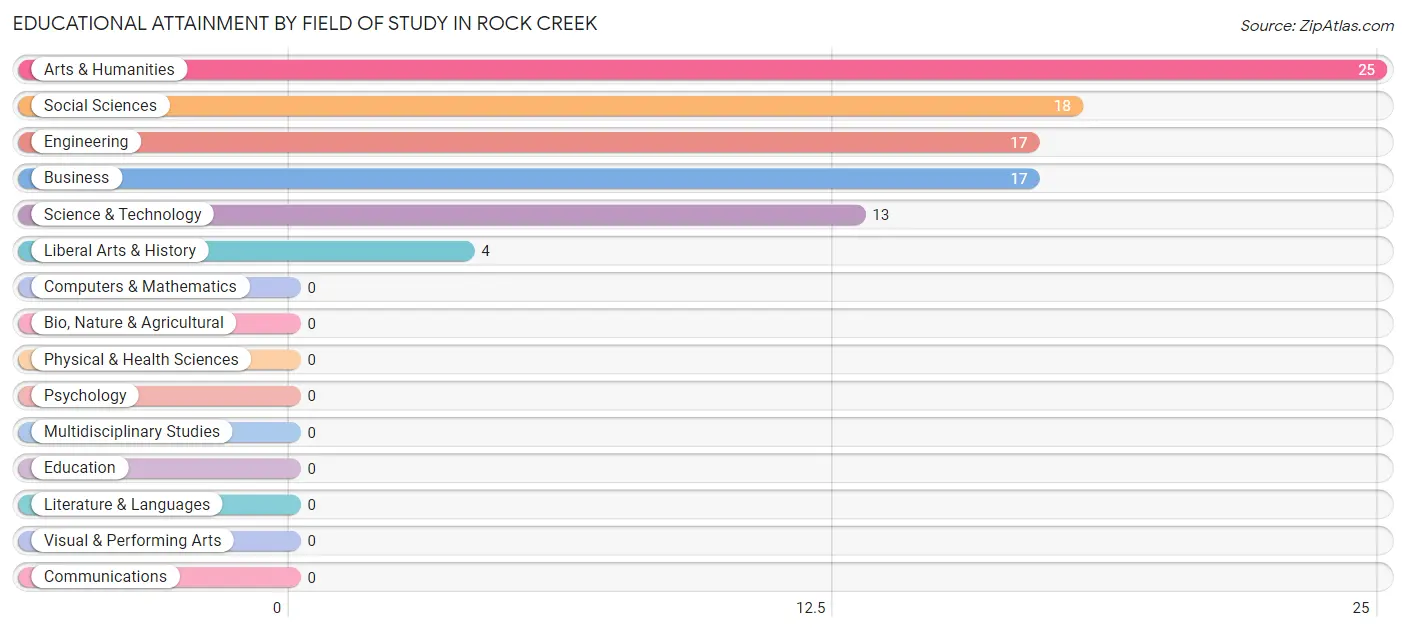
| Field of Study | # Graduates | % Graduates |
| Computers & Mathematics | 0 | 0.0% |
| Bio, Nature & Agricultural | 0 | 0.0% |
| Physical & Health Sciences | 0 | 0.0% |
| Psychology | 0 | 0.0% |
| Social Sciences | 18 | 19.2% |
| Engineering | 17 | 18.1% |
| Multidisciplinary Studies | 0 | 0.0% |
| Science & Technology | 13 | 13.8% |
| Business | 17 | 18.1% |
| Education | 0 | 0.0% |
| Literature & Languages | 0 | 0.0% |
| Liberal Arts & History | 4 | 4.3% |
| Visual & Performing Arts | 0 | 0.0% |
| Communications | 0 | 0.0% |
| Arts & Humanities | 25 | 26.6% |
| Total | 94 | 100.0% |
Transportation & Commute in Rock Creek
Vehicle Availability by Sex in Rock Creek
The most prevalent vehicle ownership categories in Rock Creek are males with 2 vehicles (170, accounting for 49.1%) and females with 2 vehicles (68, making up 47.3%).
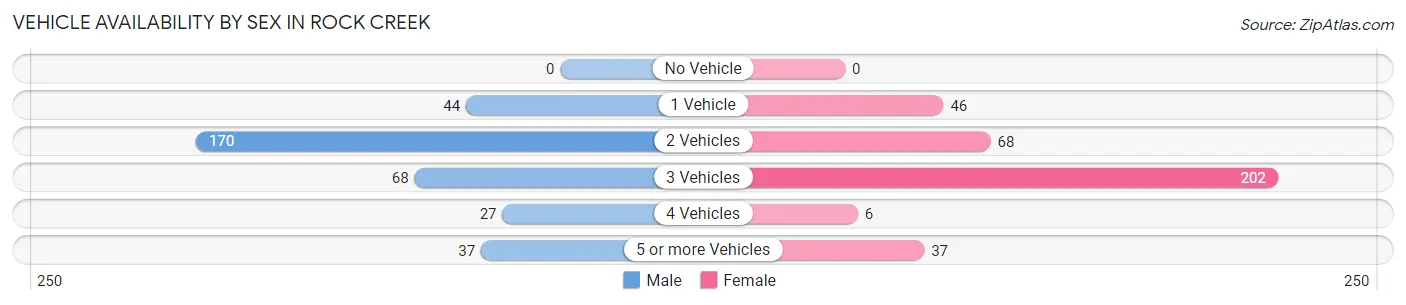
| Vehicles Available | Male | Female |
| No Vehicle | 0 (0.0%) | 0 (0.0%) |
| 1 Vehicle | 44 (12.7%) | 46 (12.8%) |
| 2 Vehicles | 170 (49.1%) | 68 (18.9%) |
| 3 Vehicles | 68 (19.7%) | 202 (56.3%) |
| 4 Vehicles | 27 (7.8%) | 6 (1.7%) |
| 5 or more Vehicles | 37 (10.7%) | 37 (10.3%) |
| Total | 346 (100.0%) | 359 (100.0%) |
Commute Time in Rock Creek
The most frequently occuring commute durations in Rock Creek are 45 to 59 minutes (109 commuters, 16.3%), 20 to 24 minutes (93 commuters, 13.9%), and 15 to 19 minutes (85 commuters, 12.7%).
| Commute Time | # Commuters | % Commuters |
| Less than 5 Minutes | 82 | 12.2% |
| 5 to 9 Minutes | 28 | 4.2% |
| 10 to 14 Minutes | 67 | 10.0% |
| 15 to 19 Minutes | 85 | 12.7% |
| 20 to 24 Minutes | 93 | 13.9% |
| 25 to 29 Minutes | 26 | 3.9% |
| 30 to 34 Minutes | 60 | 9.0% |
| 35 to 39 Minutes | 70 | 10.4% |
| 40 to 44 Minutes | 18 | 2.7% |
| 45 to 59 Minutes | 109 | 16.3% |
| 60 to 89 Minutes | 32 | 4.8% |
| 90 or more Minutes | 0 | 0.0% |
Commute Time by Sex in Rock Creek
The most common commute times in Rock Creek are 30 to 34 minutes (60 commuters, 17.3%) for males and 45 to 59 minutes (74 commuters, 22.8%) for females.
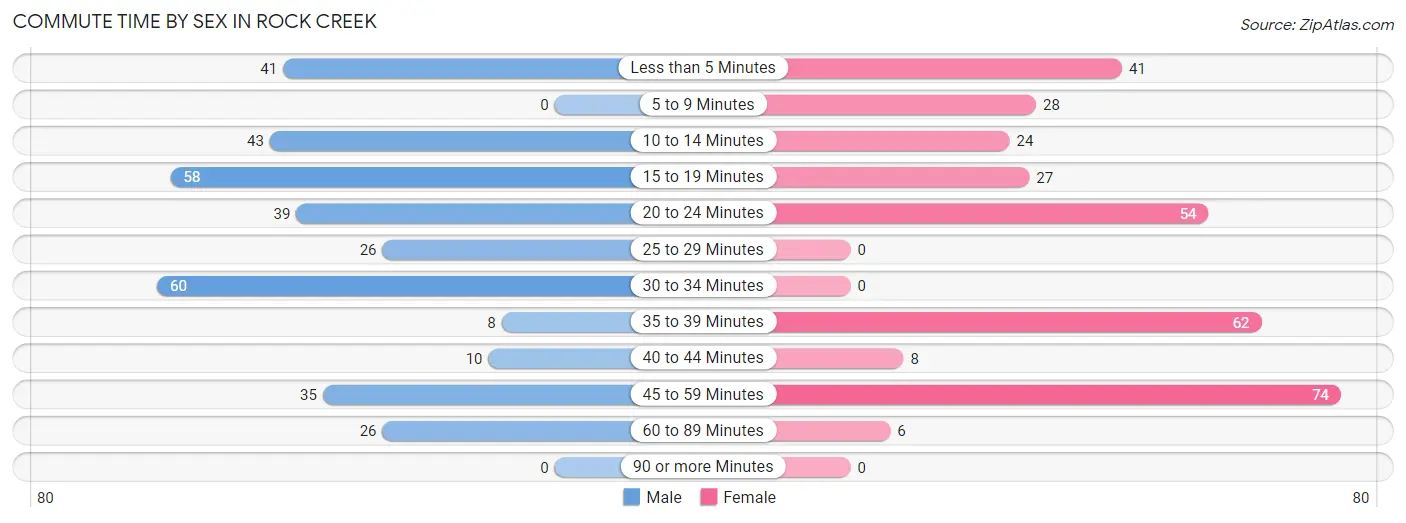
| Commute Time | Male | Female |
| Less than 5 Minutes | 41 (11.8%) | 41 (12.7%) |
| 5 to 9 Minutes | 0 (0.0%) | 28 (8.6%) |
| 10 to 14 Minutes | 43 (12.4%) | 24 (7.4%) |
| 15 to 19 Minutes | 58 (16.8%) | 27 (8.3%) |
| 20 to 24 Minutes | 39 (11.3%) | 54 (16.7%) |
| 25 to 29 Minutes | 26 (7.5%) | 0 (0.0%) |
| 30 to 34 Minutes | 60 (17.3%) | 0 (0.0%) |
| 35 to 39 Minutes | 8 (2.3%) | 62 (19.1%) |
| 40 to 44 Minutes | 10 (2.9%) | 8 (2.5%) |
| 45 to 59 Minutes | 35 (10.1%) | 74 (22.8%) |
| 60 to 89 Minutes | 26 (7.5%) | 6 (1.8%) |
| 90 or more Minutes | 0 (0.0%) | 0 (0.0%) |
Time of Departure to Work by Sex in Rock Creek
The most frequent times of departure to work in Rock Creek are 7:00 AM to 7:29 AM (167, 48.3%) for males and 7:30 AM to 7:59 AM (73, 22.5%) for females.
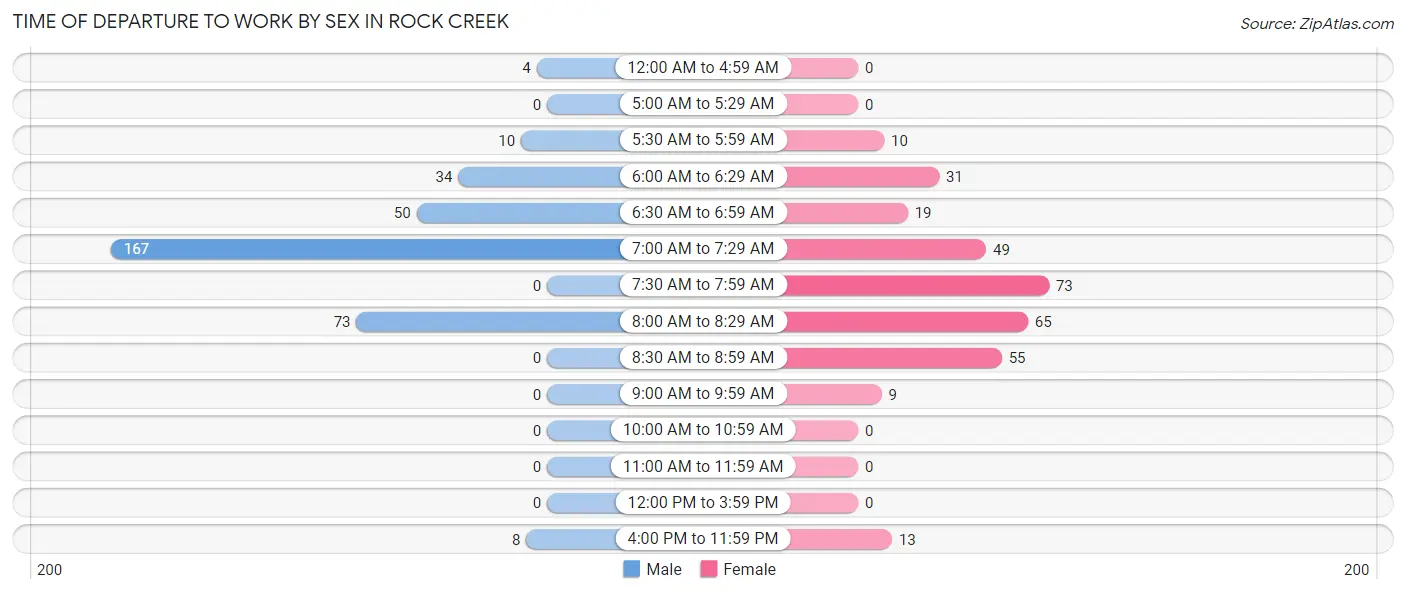
| Time of Departure | Male | Female |
| 12:00 AM to 4:59 AM | 4 (1.2%) | 0 (0.0%) |
| 5:00 AM to 5:29 AM | 0 (0.0%) | 0 (0.0%) |
| 5:30 AM to 5:59 AM | 10 (2.9%) | 10 (3.1%) |
| 6:00 AM to 6:29 AM | 34 (9.8%) | 31 (9.6%) |
| 6:30 AM to 6:59 AM | 50 (14.4%) | 19 (5.9%) |
| 7:00 AM to 7:29 AM | 167 (48.3%) | 49 (15.1%) |
| 7:30 AM to 7:59 AM | 0 (0.0%) | 73 (22.5%) |
| 8:00 AM to 8:29 AM | 73 (21.1%) | 65 (20.1%) |
| 8:30 AM to 8:59 AM | 0 (0.0%) | 55 (17.0%) |
| 9:00 AM to 9:59 AM | 0 (0.0%) | 9 (2.8%) |
| 10:00 AM to 10:59 AM | 0 (0.0%) | 0 (0.0%) |
| 11:00 AM to 11:59 AM | 0 (0.0%) | 0 (0.0%) |
| 12:00 PM to 3:59 PM | 0 (0.0%) | 0 (0.0%) |
| 4:00 PM to 11:59 PM | 8 (2.3%) | 13 (4.0%) |
| Total | 346 (100.0%) | 324 (100.0%) |
Housing Occupancy in Rock Creek
Occupancy by Ownership in Rock Creek
Of the total 591 dwellings in Rock Creek, owner-occupied units account for 553 (93.6%), while renter-occupied units make up 38 (6.4%).
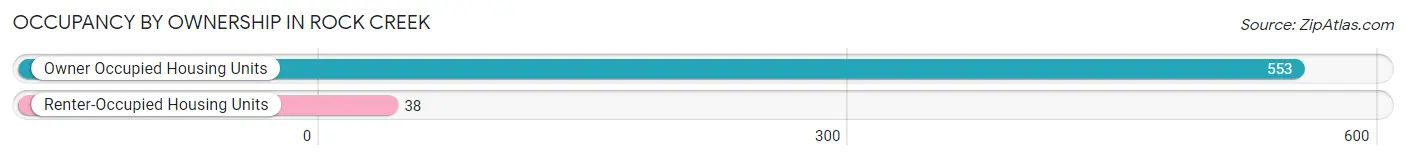
| Occupancy | # Housing Units | % Housing Units |
| Owner Occupied Housing Units | 553 | 93.6% |
| Renter-Occupied Housing Units | 38 | 6.4% |
| Total Occupied Housing Units | 591 | 100.0% |
Occupancy by Household Size in Rock Creek
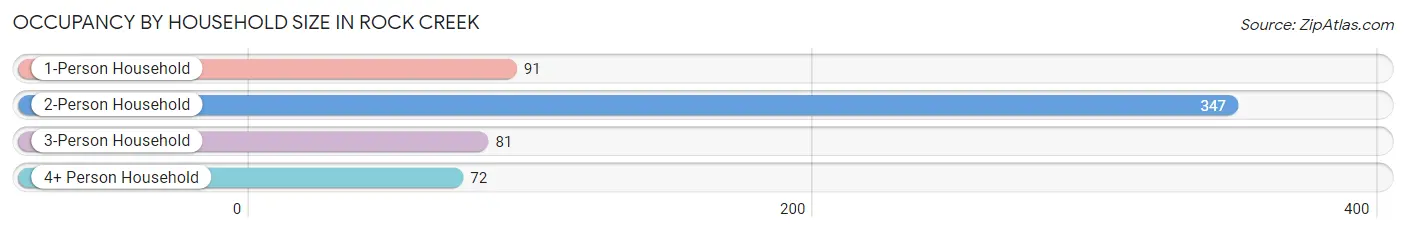
| Household Size | # Housing Units | % Housing Units |
| 1-Person Household | 91 | 15.4% |
| 2-Person Household | 347 | 58.7% |
| 3-Person Household | 81 | 13.7% |
| 4+ Person Household | 72 | 12.2% |
| Total Housing Units | 591 | 100.0% |
Occupancy by Ownership by Household Size in Rock Creek
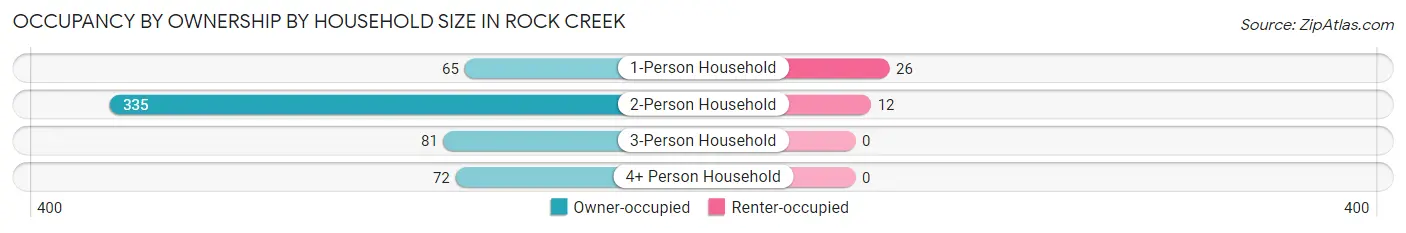
| Household Size | Owner-occupied | Renter-occupied |
| 1-Person Household | 65 (71.4%) | 26 (28.6%) |
| 2-Person Household | 335 (96.5%) | 12 (3.5%) |
| 3-Person Household | 81 (100.0%) | 0 (0.0%) |
| 4+ Person Household | 72 (100.0%) | 0 (0.0%) |
| Total Housing Units | 553 (93.6%) | 38 (6.4%) |
Occupancy by Educational Attainment in Rock Creek
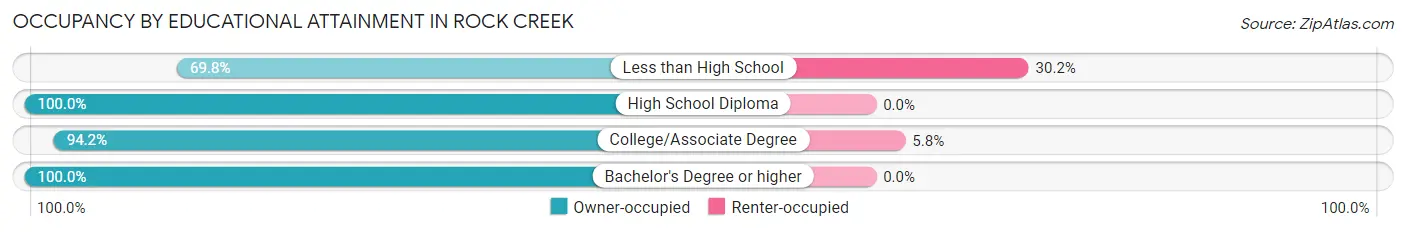
| Household Size | Owner-occupied | Renter-occupied |
| Less than High School | 60 (69.8%) | 26 (30.2%) |
| High School Diploma | 235 (100.0%) | 0 (0.0%) |
| College/Associate Degree | 195 (94.2%) | 12 (5.8%) |
| Bachelor's Degree or higher | 63 (100.0%) | 0 (0.0%) |
Occupancy by Age of Householder in Rock Creek
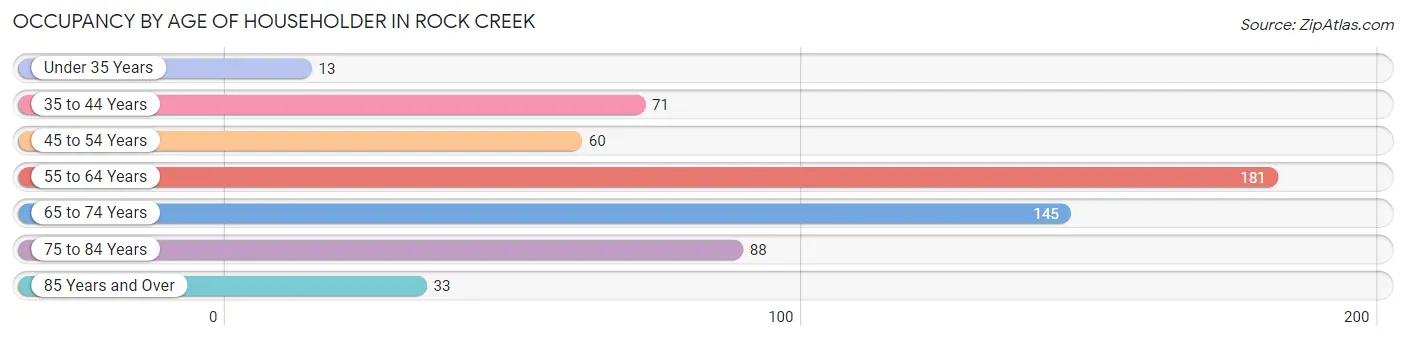
| Age Bracket | # Households | % Households |
| Under 35 Years | 13 | 2.2% |
| 35 to 44 Years | 71 | 12.0% |
| 45 to 54 Years | 60 | 10.2% |
| 55 to 64 Years | 181 | 30.6% |
| 65 to 74 Years | 145 | 24.5% |
| 75 to 84 Years | 88 | 14.9% |
| 85 Years and Over | 33 | 5.6% |
| Total | 591 | 100.0% |
Housing Finances in Rock Creek
Median Income by Occupancy in Rock Creek
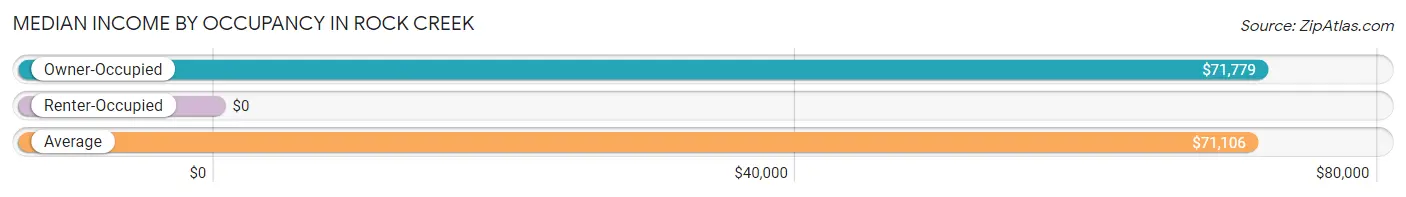
| Occupancy Type | # Households | Median Income |
| Owner-Occupied | 553 (93.6%) | $71,779 |
| Renter-Occupied | 38 (6.4%) | $0 |
| Average | 591 (100.0%) | $71,106 |
Occupancy by Householder Income Bracket in Rock Creek
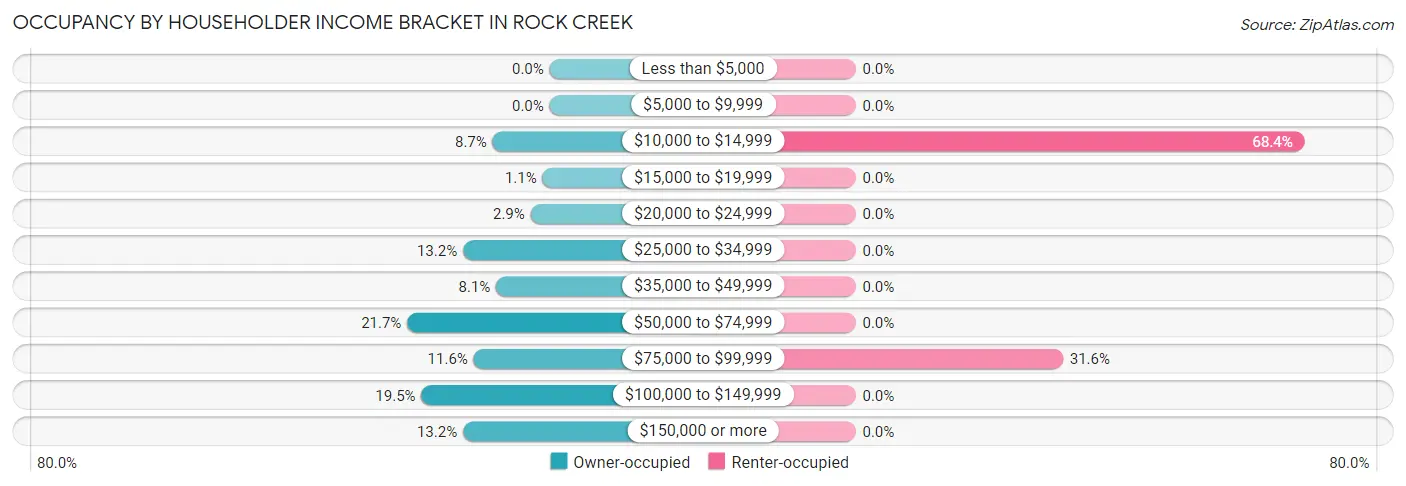
| Income Bracket | Owner-occupied | Renter-occupied |
| Less than $5,000 | 0 (0.0%) | 0 (0.0%) |
| $5,000 to $9,999 | 0 (0.0%) | 0 (0.0%) |
| $10,000 to $14,999 | 48 (8.7%) | 26 (68.4%) |
| $15,000 to $19,999 | 6 (1.1%) | 0 (0.0%) |
| $20,000 to $24,999 | 16 (2.9%) | 0 (0.0%) |
| $25,000 to $34,999 | 73 (13.2%) | 0 (0.0%) |
| $35,000 to $49,999 | 45 (8.1%) | 0 (0.0%) |
| $50,000 to $74,999 | 120 (21.7%) | 0 (0.0%) |
| $75,000 to $99,999 | 64 (11.6%) | 12 (31.6%) |
| $100,000 to $149,999 | 108 (19.5%) | 0 (0.0%) |
| $150,000 or more | 73 (13.2%) | 0 (0.0%) |
| Total | 553 (100.0%) | 38 (100.0%) |
Monthly Housing Cost Tiers in Rock Creek
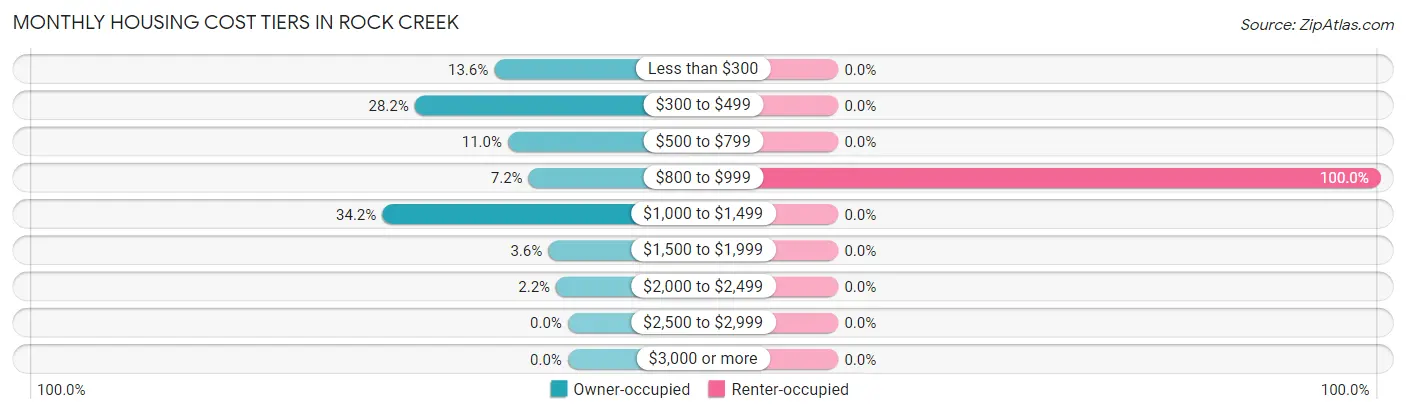
| Monthly Cost | Owner-occupied | Renter-occupied |
| Less than $300 | 75 (13.6%) | 0 (0.0%) |
| $300 to $499 | 156 (28.2%) | 0 (0.0%) |
| $500 to $799 | 61 (11.0%) | 0 (0.0%) |
| $800 to $999 | 40 (7.2%) | 38 (100.0%) |
| $1,000 to $1,499 | 189 (34.2%) | 0 (0.0%) |
| $1,500 to $1,999 | 20 (3.6%) | 0 (0.0%) |
| $2,000 to $2,499 | 12 (2.2%) | 0 (0.0%) |
| $2,500 to $2,999 | 0 (0.0%) | 0 (0.0%) |
| $3,000 or more | 0 (0.0%) | 0 (0.0%) |
| Total | 553 (100.0%) | 38 (100.0%) |
Physical Housing Characteristics in Rock Creek
Housing Structures in Rock Creek
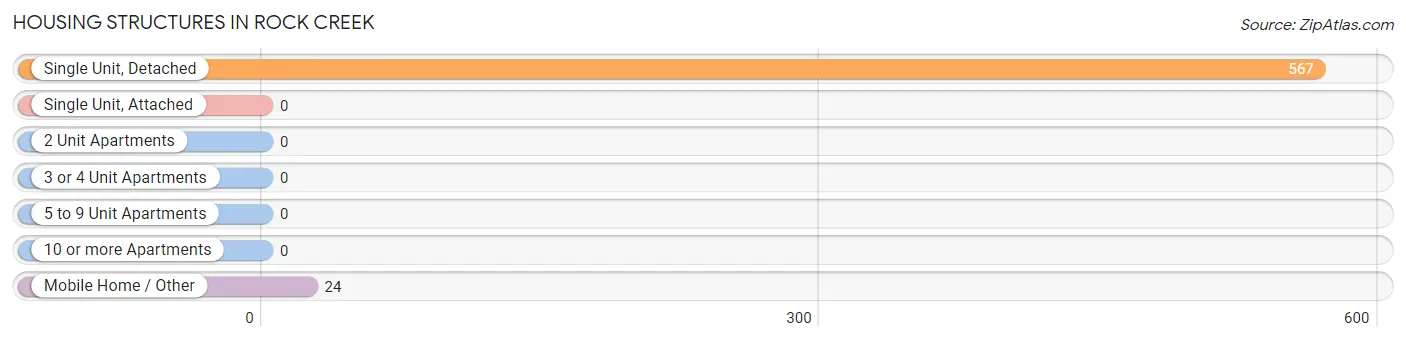
| Structure Type | # Housing Units | % Housing Units |
| Single Unit, Detached | 567 | 95.9% |
| Single Unit, Attached | 0 | 0.0% |
| 2 Unit Apartments | 0 | 0.0% |
| 3 or 4 Unit Apartments | 0 | 0.0% |
| 5 to 9 Unit Apartments | 0 | 0.0% |
| 10 or more Apartments | 0 | 0.0% |
| Mobile Home / Other | 24 | 4.1% |
| Total | 591 | 100.0% |
Housing Structures by Occupancy in Rock Creek
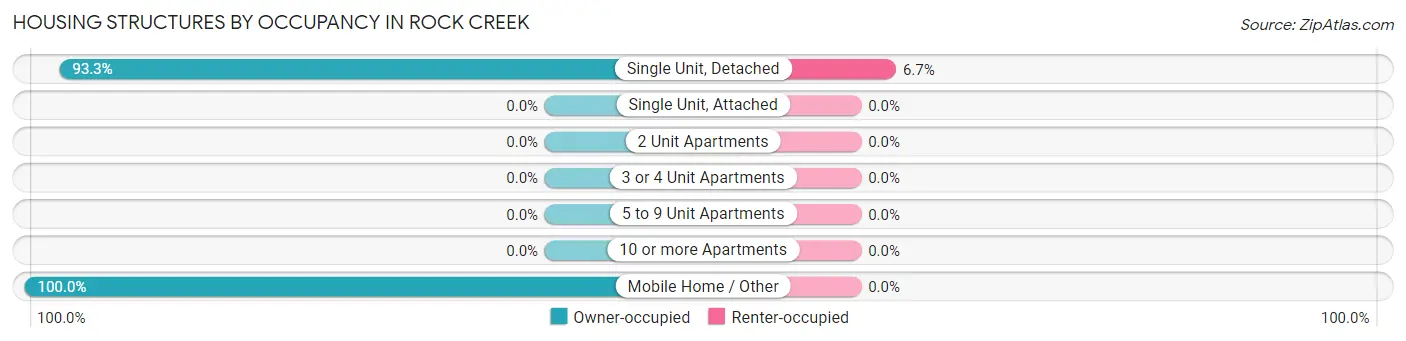
| Structure Type | Owner-occupied | Renter-occupied |
| Single Unit, Detached | 529 (93.3%) | 38 (6.7%) |
| Single Unit, Attached | 0 (0.0%) | 0 (0.0%) |
| 2 Unit Apartments | 0 (0.0%) | 0 (0.0%) |
| 3 or 4 Unit Apartments | 0 (0.0%) | 0 (0.0%) |
| 5 to 9 Unit Apartments | 0 (0.0%) | 0 (0.0%) |
| 10 or more Apartments | 0 (0.0%) | 0 (0.0%) |
| Mobile Home / Other | 24 (100.0%) | 0 (0.0%) |
| Total | 553 (93.6%) | 38 (6.4%) |
Housing Structures by Number of Rooms in Rock Creek
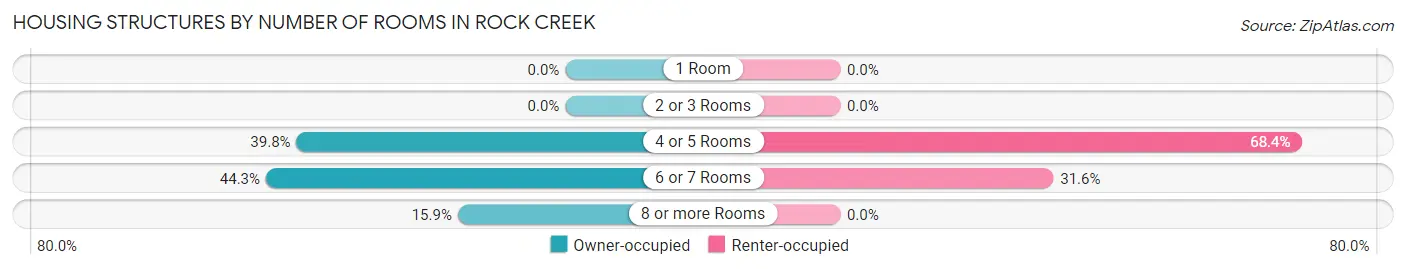
| Number of Rooms | Owner-occupied | Renter-occupied |
| 1 Room | 0 (0.0%) | 0 (0.0%) |
| 2 or 3 Rooms | 0 (0.0%) | 0 (0.0%) |
| 4 or 5 Rooms | 220 (39.8%) | 26 (68.4%) |
| 6 or 7 Rooms | 245 (44.3%) | 12 (31.6%) |
| 8 or more Rooms | 88 (15.9%) | 0 (0.0%) |
| Total | 553 (100.0%) | 38 (100.0%) |
Housing Structure by Heating Type in Rock Creek
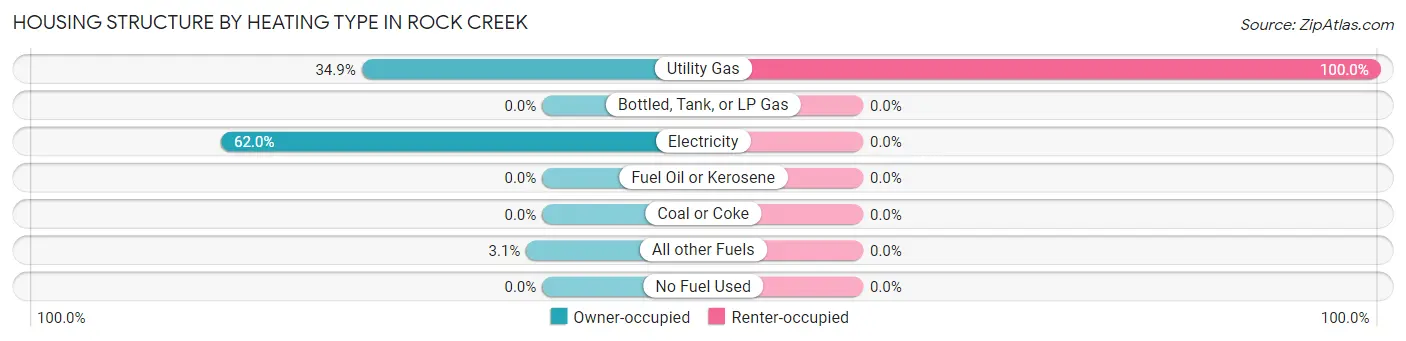
| Heating Type | Owner-occupied | Renter-occupied |
| Utility Gas | 193 (34.9%) | 38 (100.0%) |
| Bottled, Tank, or LP Gas | 0 (0.0%) | 0 (0.0%) |
| Electricity | 343 (62.0%) | 0 (0.0%) |
| Fuel Oil or Kerosene | 0 (0.0%) | 0 (0.0%) |
| Coal or Coke | 0 (0.0%) | 0 (0.0%) |
| All other Fuels | 17 (3.1%) | 0 (0.0%) |
| No Fuel Used | 0 (0.0%) | 0 (0.0%) |
| Total | 553 (100.0%) | 38 (100.0%) |
Household Vehicle Usage in Rock Creek
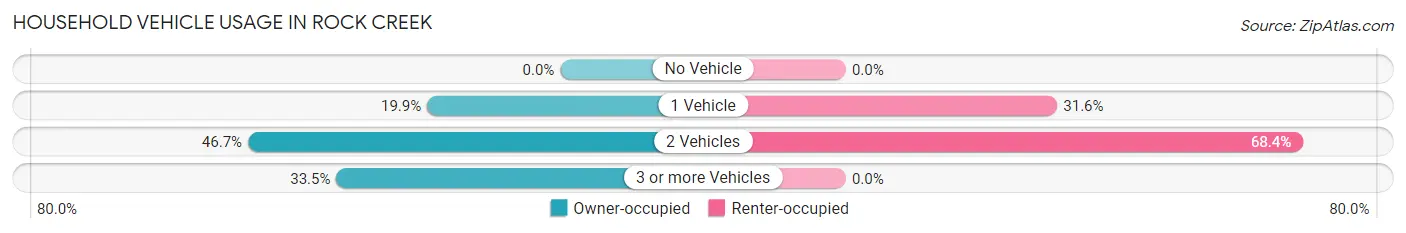
| Vehicles per Household | Owner-occupied | Renter-occupied |
| No Vehicle | 0 (0.0%) | 0 (0.0%) |
| 1 Vehicle | 110 (19.9%) | 12 (31.6%) |
| 2 Vehicles | 258 (46.7%) | 26 (68.4%) |
| 3 or more Vehicles | 185 (33.5%) | 0 (0.0%) |
| Total | 553 (100.0%) | 38 (100.0%) |
Real Estate & Mortgages in Rock Creek
Real Estate and Mortgage Overview in Rock Creek
| Characteristic | Without Mortgage | With Mortgage |
| Housing Units | 266 | 287 |
| Median Property Value | $108,600 | $191,000 |
| Median Household Income | $64,091 | $22 |
| Monthly Housing Costs | $375 | $0 |
| Real Estate Taxes | $1,022 | $9 |
Property Value by Mortgage Status in Rock Creek
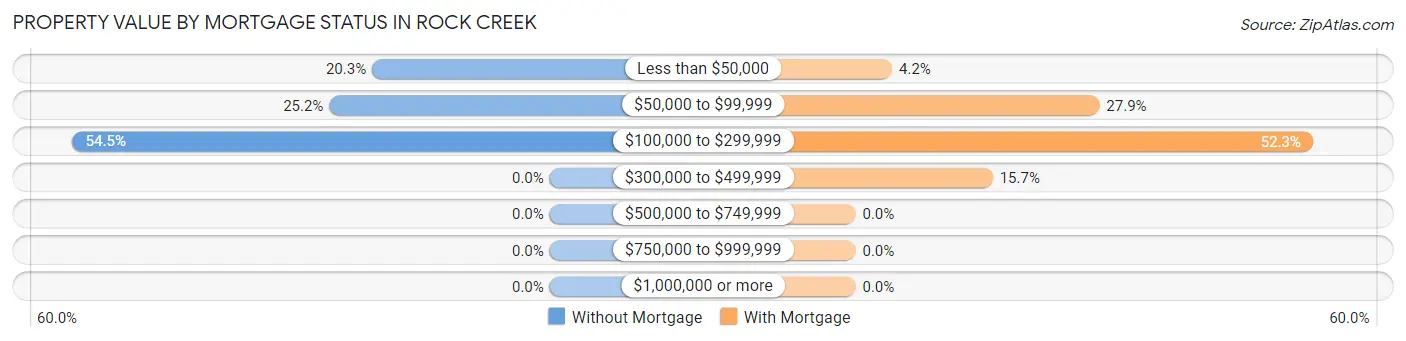
| Property Value | Without Mortgage | With Mortgage |
| Less than $50,000 | 54 (20.3%) | 12 (4.2%) |
| $50,000 to $99,999 | 67 (25.2%) | 80 (27.9%) |
| $100,000 to $299,999 | 145 (54.5%) | 150 (52.3%) |
| $300,000 to $499,999 | 0 (0.0%) | 45 (15.7%) |
| $500,000 to $749,999 | 0 (0.0%) | 0 (0.0%) |
| $750,000 to $999,999 | 0 (0.0%) | 0 (0.0%) |
| $1,000,000 or more | 0 (0.0%) | 0 (0.0%) |
| Total | 266 (100.0%) | 287 (100.0%) |
Household Income by Mortgage Status in Rock Creek
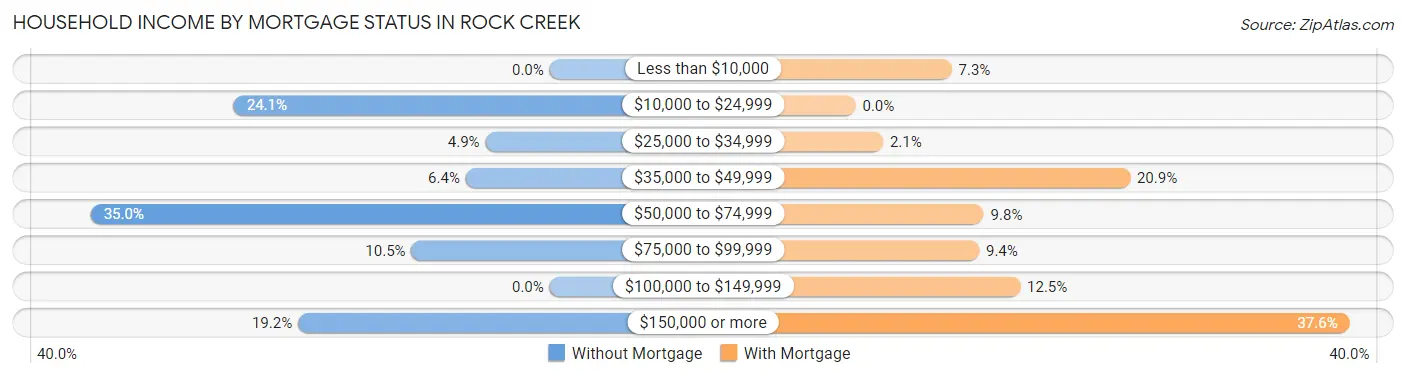
| Household Income | Without Mortgage | With Mortgage |
| Less than $10,000 | 0 (0.0%) | 21 (7.3%) |
| $10,000 to $24,999 | 64 (24.1%) | 0 (0.0%) |
| $25,000 to $34,999 | 13 (4.9%) | 6 (2.1%) |
| $35,000 to $49,999 | 17 (6.4%) | 60 (20.9%) |
| $50,000 to $74,999 | 93 (35.0%) | 28 (9.8%) |
| $75,000 to $99,999 | 28 (10.5%) | 27 (9.4%) |
| $100,000 to $149,999 | 0 (0.0%) | 36 (12.5%) |
| $150,000 or more | 51 (19.2%) | 108 (37.6%) |
| Total | 266 (100.0%) | 287 (100.0%) |
Property Value to Household Income Ratio in Rock Creek
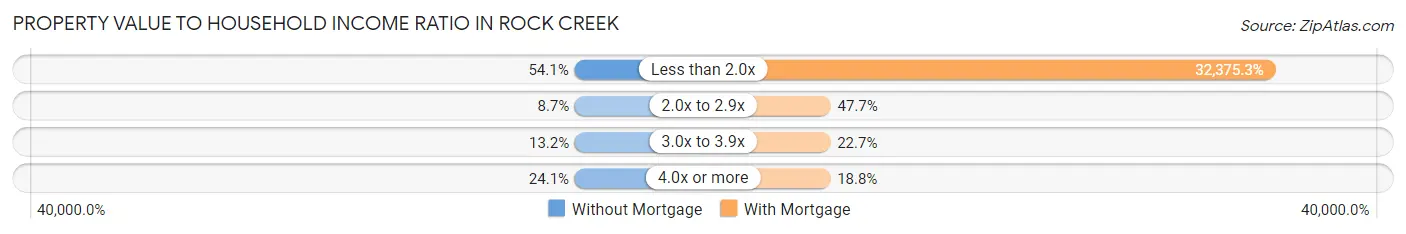
| Value-to-Income Ratio | Without Mortgage | With Mortgage |
| Less than 2.0x | 144 (54.1%) | 92,917 (32,375.3%) |
| 2.0x to 2.9x | 23 (8.6%) | 137 (47.7%) |
| 3.0x to 3.9x | 35 (13.2%) | 65 (22.7%) |
| 4.0x or more | 64 (24.1%) | 54 (18.8%) |
| Total | 266 (100.0%) | 287 (100.0%) |
Real Estate Taxes by Mortgage Status in Rock Creek
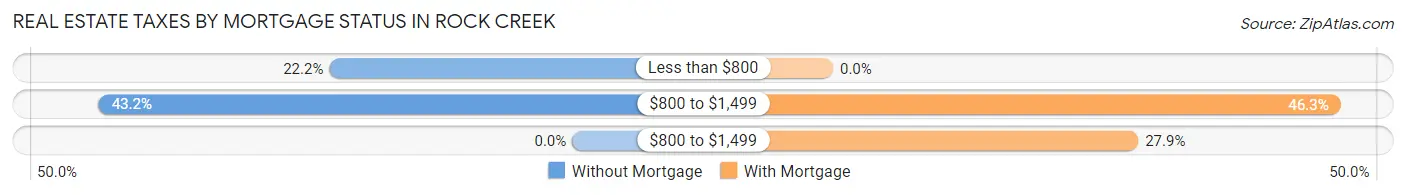
| Property Taxes | Without Mortgage | With Mortgage |
| Less than $800 | 59 (22.2%) | 0 (0.0%) |
| $800 to $1,499 | 115 (43.2%) | 133 (46.3%) |
| $800 to $1,499 | 0 (0.0%) | 80 (27.9%) |
| Total | 266 (100.0%) | 287 (100.0%) |
Health & Disability in Rock Creek
Health Insurance Coverage by Age in Rock Creek
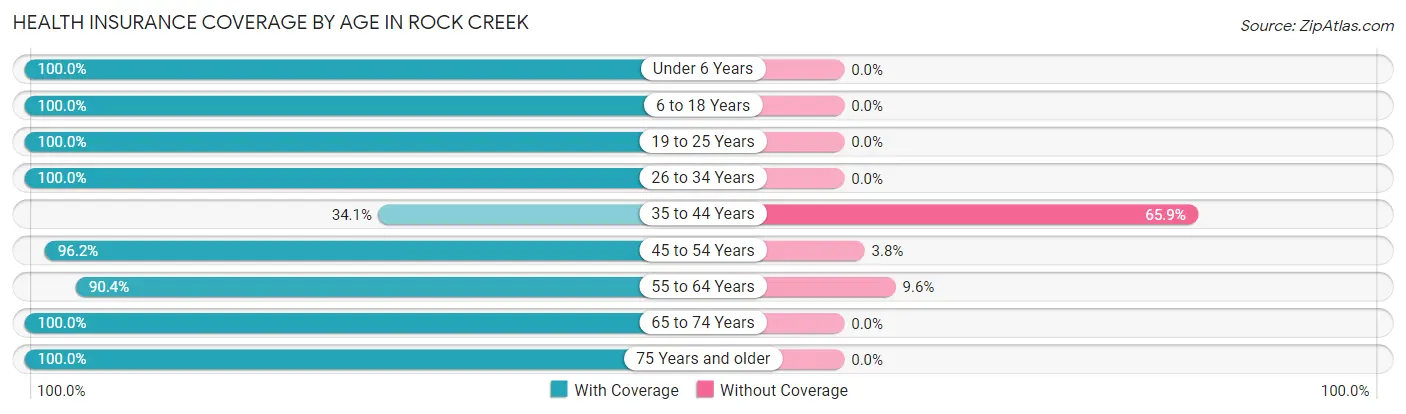
| Age Bracket | With Coverage | Without Coverage |
| Under 6 Years | 82 (100.0%) | 0 (0.0%) |
| 6 to 18 Years | 56 (100.0%) | 0 (0.0%) |
| 19 to 25 Years | 58 (100.0%) | 0 (0.0%) |
| 26 to 34 Years | 128 (100.0%) | 0 (0.0%) |
| 35 to 44 Years | 71 (34.1%) | 137 (65.9%) |
| 45 to 54 Years | 203 (96.2%) | 8 (3.8%) |
| 55 to 64 Years | 293 (90.4%) | 31 (9.6%) |
| 65 to 74 Years | 198 (100.0%) | 0 (0.0%) |
| 75 Years and older | 181 (100.0%) | 0 (0.0%) |
| Total | 1,270 (87.8%) | 176 (12.2%) |
Health Insurance Coverage by Citizenship Status in Rock Creek

| Citizenship Status | With Coverage | Without Coverage |
| Native Born | 82 (100.0%) | 0 (0.0%) |
| Foreign Born, Citizen | 56 (100.0%) | 0 (0.0%) |
| Foreign Born, not a Citizen | 58 (100.0%) | 0 (0.0%) |
Health Insurance Coverage by Household Income in Rock Creek
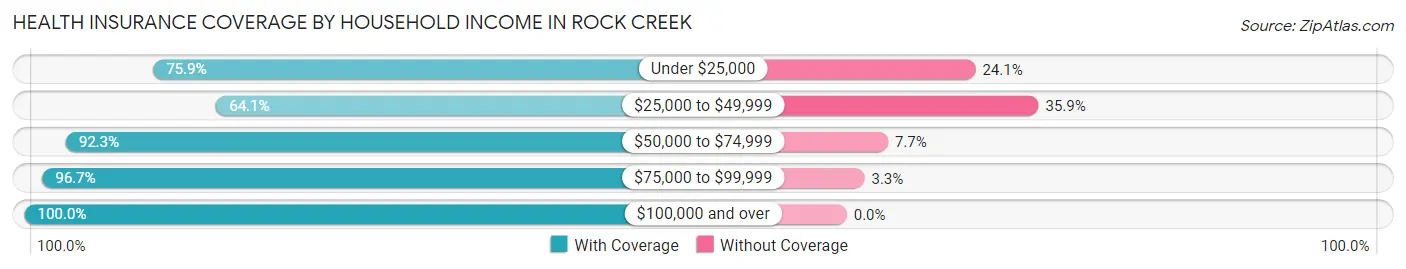
| Household Income | With Coverage | Without Coverage |
| Under $25,000 | 107 (75.9%) | 34 (24.1%) |
| $25,000 to $49,999 | 198 (64.1%) | 111 (35.9%) |
| $50,000 to $74,999 | 275 (92.3%) | 23 (7.7%) |
| $75,000 to $99,999 | 233 (96.7%) | 8 (3.3%) |
| $100,000 and over | 457 (100.0%) | 0 (0.0%) |
Public vs Private Health Insurance Coverage by Age in Rock Creek
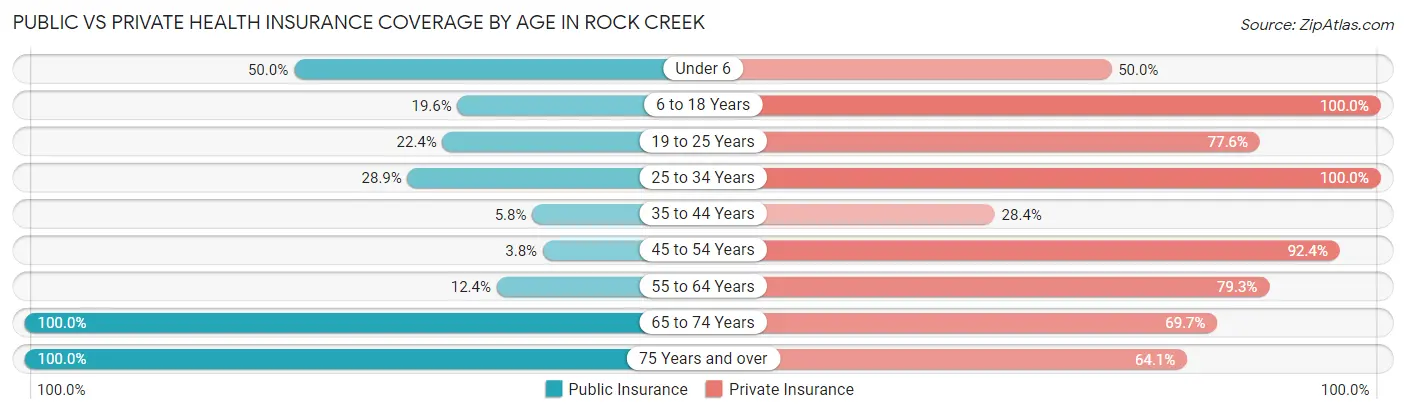
| Age Bracket | Public Insurance | Private Insurance |
| Under 6 | 41 (50.0%) | 41 (50.0%) |
| 6 to 18 Years | 11 (19.6%) | 56 (100.0%) |
| 19 to 25 Years | 13 (22.4%) | 45 (77.6%) |
| 25 to 34 Years | 37 (28.9%) | 128 (100.0%) |
| 35 to 44 Years | 12 (5.8%) | 59 (28.4%) |
| 45 to 54 Years | 8 (3.8%) | 195 (92.4%) |
| 55 to 64 Years | 40 (12.3%) | 257 (79.3%) |
| 65 to 74 Years | 198 (100.0%) | 138 (69.7%) |
| 75 Years and over | 181 (100.0%) | 116 (64.1%) |
| Total | 541 (37.4%) | 1,035 (71.6%) |
Disability Status by Sex by Age in Rock Creek
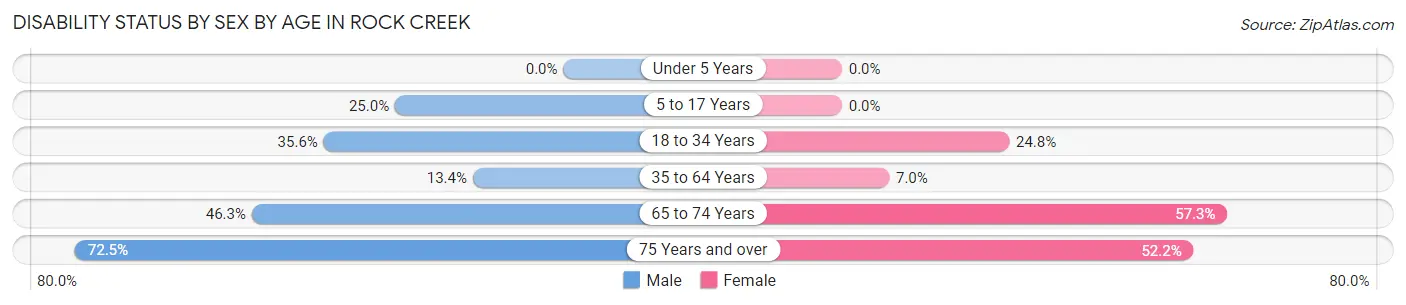
| Age Bracket | Male | Female |
| Under 5 Years | 0 (0.0%) | 0 (0.0%) |
| 5 to 17 Years | 11 (25.0%) | 0 (0.0%) |
| 18 to 34 Years | 21 (35.6%) | 37 (24.8%) |
| 35 to 64 Years | 50 (13.4%) | 26 (7.0%) |
| 65 to 74 Years | 31 (46.3%) | 75 (57.3%) |
| 75 Years and over | 66 (72.5%) | 47 (52.2%) |
Disability Class by Sex by Age in Rock Creek
Disability Class: Hearing Difficulty
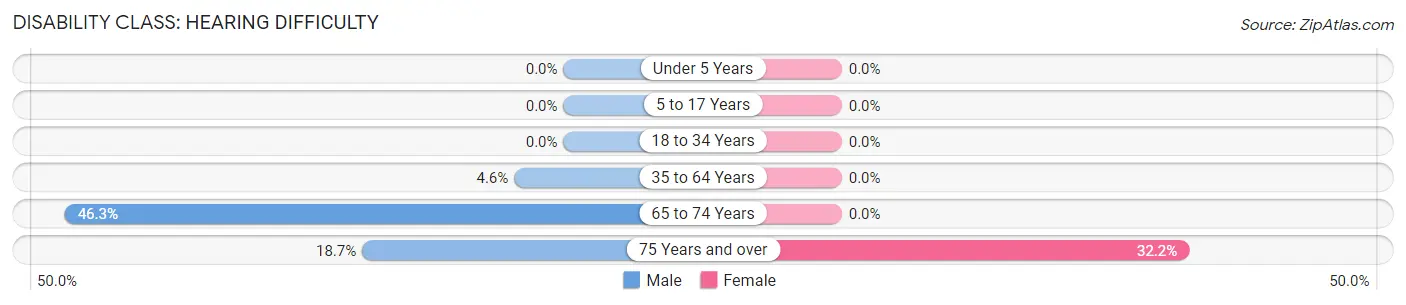
| Age Bracket | Male | Female |
| Under 5 Years | 0 (0.0%) | 0 (0.0%) |
| 5 to 17 Years | 0 (0.0%) | 0 (0.0%) |
| 18 to 34 Years | 0 (0.0%) | 0 (0.0%) |
| 35 to 64 Years | 17 (4.6%) | 0 (0.0%) |
| 65 to 74 Years | 31 (46.3%) | 0 (0.0%) |
| 75 Years and over | 17 (18.7%) | 29 (32.2%) |
Disability Class: Vision Difficulty
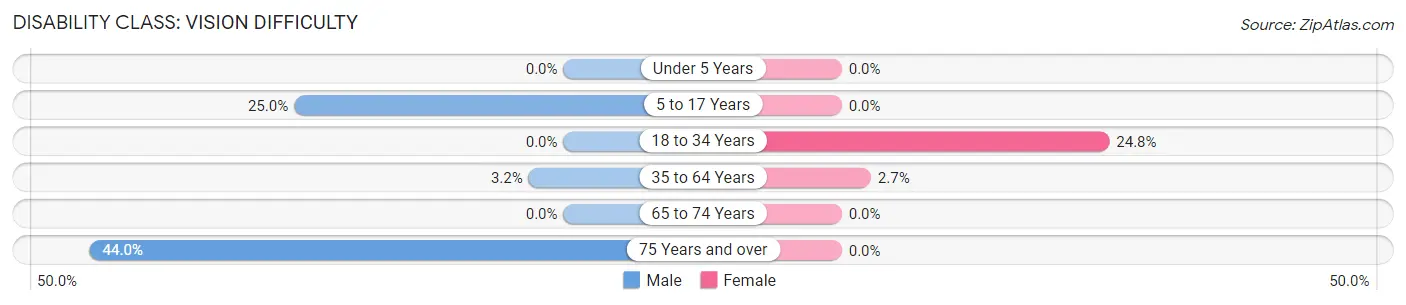
| Age Bracket | Male | Female |
| Under 5 Years | 0 (0.0%) | 0 (0.0%) |
| 5 to 17 Years | 11 (25.0%) | 0 (0.0%) |
| 18 to 34 Years | 0 (0.0%) | 37 (24.8%) |
| 35 to 64 Years | 12 (3.2%) | 10 (2.7%) |
| 65 to 74 Years | 0 (0.0%) | 0 (0.0%) |
| 75 Years and over | 40 (44.0%) | 0 (0.0%) |
Disability Class: Cognitive Difficulty
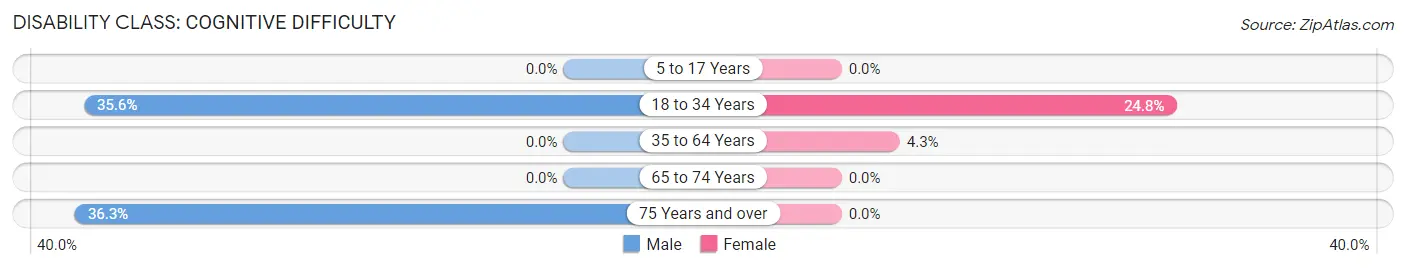
| Age Bracket | Male | Female |
| 5 to 17 Years | 0 (0.0%) | 0 (0.0%) |
| 18 to 34 Years | 21 (35.6%) | 37 (24.8%) |
| 35 to 64 Years | 0 (0.0%) | 16 (4.3%) |
| 65 to 74 Years | 0 (0.0%) | 0 (0.0%) |
| 75 Years and over | 33 (36.3%) | 0 (0.0%) |
Disability Class: Ambulatory Difficulty
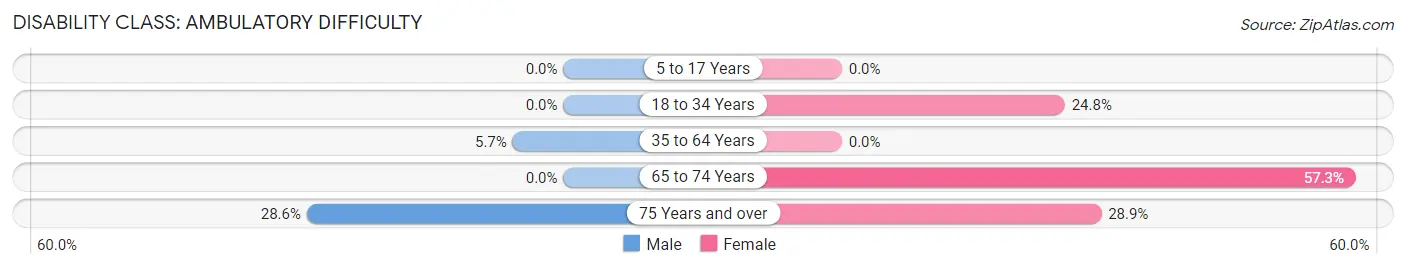
| Age Bracket | Male | Female |
| 5 to 17 Years | 0 (0.0%) | 0 (0.0%) |
| 18 to 34 Years | 0 (0.0%) | 37 (24.8%) |
| 35 to 64 Years | 21 (5.7%) | 0 (0.0%) |
| 65 to 74 Years | 0 (0.0%) | 75 (57.3%) |
| 75 Years and over | 26 (28.6%) | 26 (28.9%) |
Disability Class: Self-Care Difficulty
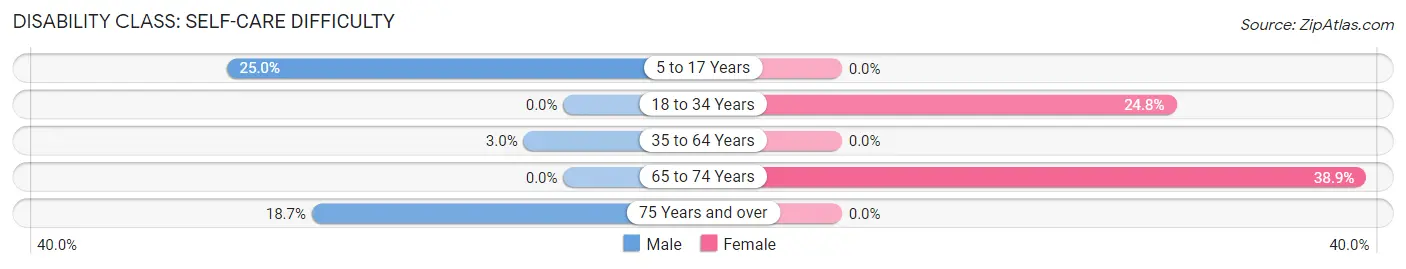
| Age Bracket | Male | Female |
| 5 to 17 Years | 11 (25.0%) | 0 (0.0%) |
| 18 to 34 Years | 0 (0.0%) | 37 (24.8%) |
| 35 to 64 Years | 11 (3.0%) | 0 (0.0%) |
| 65 to 74 Years | 0 (0.0%) | 51 (38.9%) |
| 75 Years and over | 17 (18.7%) | 0 (0.0%) |
Technology Access in Rock Creek
Computing Device Access in Rock Creek
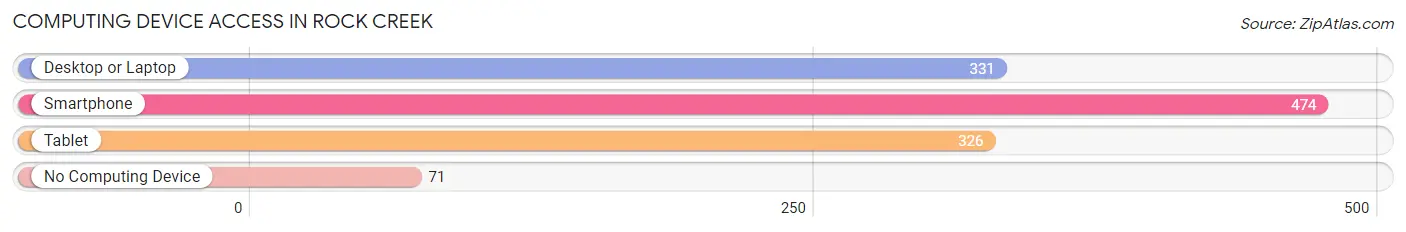
| Device Type | # Households | % Households |
| Desktop or Laptop | 331 | 56.0% |
| Smartphone | 474 | 80.2% |
| Tablet | 326 | 55.2% |
| No Computing Device | 71 | 12.0% |
| Total | 591 | 100.0% |
Internet Access in Rock Creek
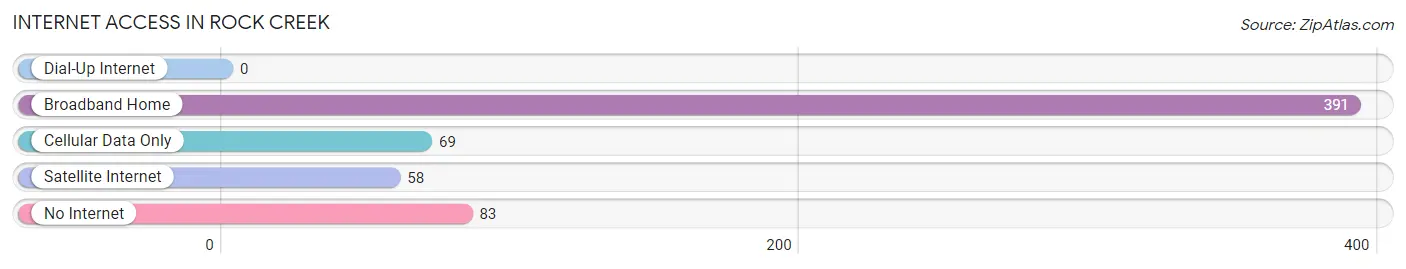
| Internet Type | # Households | % Households |
| Dial-Up Internet | 0 | 0.0% |
| Broadband Home | 391 | 66.2% |
| Cellular Data Only | 69 | 11.7% |
| Satellite Internet | 58 | 9.8% |
| No Internet | 83 | 14.0% |
| Total | 591 | 100.0% |
Rock Creek Summary
Introduction
Rock Creek is a small unincorporated community located in the northwest corner of Marshall County, Alabama. It is situated on the banks of the Tennessee River, just south of the Tennessee-Alabama state line. The community is home to a population of approximately 1,000 people, and is known for its rural charm and small-town atmosphere.
History
Rock Creek was first settled in the early 1800s by settlers from North Carolina and Virginia. The community was originally known as "Rocky Creek," and was named for the rocky terrain of the area. The first post office was established in 1845, and the town was officially incorporated in 1848.
In the late 1800s, Rock Creek was a thriving agricultural community, with cotton, corn, and tobacco being the main crops. The town also had a number of small businesses, including a general store, a blacksmith shop, and a sawmill.
In the early 1900s, the town began to decline as the railroad bypassed it and the population began to move away. The town was eventually abandoned in the 1940s, and the post office was closed in 1950.
Geography
Rock Creek is located in the northwest corner of Marshall County, Alabama, on the banks of the Tennessee River. The town is situated at an elevation of approximately 600 feet above sea level. The area is characterized by rolling hills and wooded areas, with the Tennessee River providing a scenic backdrop.
The climate in Rock Creek is humid subtropical, with hot, humid summers and mild winters. The average annual temperature is around 68 degrees Fahrenheit, with an average annual precipitation of around 50 inches.
Economy
The economy of Rock Creek is largely based on agriculture and tourism. The town is home to a number of small farms, which produce a variety of crops, including corn, cotton, and tobacco. The town also has a number of small businesses, including a general store, a blacksmith shop, and a sawmill.
Tourism is also an important part of the local economy. The town is home to a number of historic sites, including the Rock Creek Cemetery, which dates back to the early 1800s. The town also has a number of outdoor recreational activities, including fishing, hunting, and camping.
Demographics
As of the 2010 census, the population of Rock Creek was 1,000 people. The racial makeup of the town was 97.2% White, 0.7% African American, 0.3% Native American, 0.2% Asian, and 1.6% from other races. The median household income was $30,000, and the median family income was $35,000.
Conclusion
Rock Creek is a small unincorporated community located in the northwest corner of Marshall County, Alabama. It is situated on the banks of the Tennessee River, just south of the Tennessee-Alabama state line. The community is home to a population of approximately 1,000 people, and is known for its rural charm and small-town atmosphere. The economy of Rock Creek is largely based on agriculture and tourism, and the town is home to a number of historic sites and outdoor recreational activities.
Common Questions
What is Per Capita Income in Rock Creek?
Per Capita income in Rock Creek is $37,597.
What is the Median Family Income in Rock Creek?
Median Family Income in Rock Creek is $69,688.
What is the Median Household income in Rock Creek?
Median Household Income in Rock Creek is $71,106.
What is Inequality or Gini Index in Rock Creek?
Inequality or Gini Index in Rock Creek is 0.46.
What is the Total Population of Rock Creek?
Total Population of Rock Creek is 1,446.
What is the Total Male Population of Rock Creek?
Total Male Population of Rock Creek is 678.
What is the Total Female Population of Rock Creek?
Total Female Population of Rock Creek is 768.
What is the Ratio of Males per 100 Females in Rock Creek?
There are 88.28 Males per 100 Females in Rock Creek.
What is the Ratio of Females per 100 Males in Rock Creek?
There are 113.27 Females per 100 Males in Rock Creek.
What is the Median Population Age in Rock Creek?
Median Population Age in Rock Creek is 53.7 Years.
What is the Average Family Size in Rock Creek
Average Family Size in Rock Creek is 2.8 People.
What is the Average Household Size in Rock Creek
Average Household Size in Rock Creek is 2.5 People.
How Large is the Labor Force in Rock Creek?
There are 733 People in the Labor Forcein in Rock Creek.
What is the Percentage of People in the Labor Force in Rock Creek?
55.1% of People are in the Labor Force in Rock Creek.
What is the Unemployment Rate in Rock Creek?
Unemployment Rate in Rock Creek is 3.8%.