Faunsdale, AL Map & Demographics
Faunsdale Map
Faunsdale Overview
$16,287
PER CAPITA INCOME
$115,417
AVG FAMILY INCOME
60.9%
WAGE / INCOME GAP [ % ]
39.1¢/ $1
WAGE / INCOME GAP [ $ ]
0.65
INEQUALITY / GINI INDEX
136
TOTAL POPULATION
43
MALE POPULATION
93
FEMALE POPULATION
46.24
MALES / 100 FEMALES
216.28
FEMALES / 100 MALES
20.7
MEDIAN AGE
9.0
AVG FAMILY SIZE
4.2
AVG HOUSEHOLD SIZE
55
LABOR FORCE [ PEOPLE ]
67.9%
PERCENT IN LABOR FORCE
Faunsdale Zip Codes
Faunsdale Area Codes
Income in Faunsdale
Income Overview in Faunsdale
| Characteristic | Number | Measure |
| Per Capita Income | 136 | $16,287 |
| Median Family Income | 13 | $115,417 |
| Mean Family Income | 13 | $145,300 |
| Median Household Income | 32 | $0 |
| Mean Household Income | 32 | $64,947 |
| Income Deficit | 13 | $0 |
| Wage / Income Gap (%) | 136 | 60.93% |
| Wage / Income Gap ($) | 136 | 39.07¢ per $1 |
| Gini / Inequality Index | 136 | 0.65 |
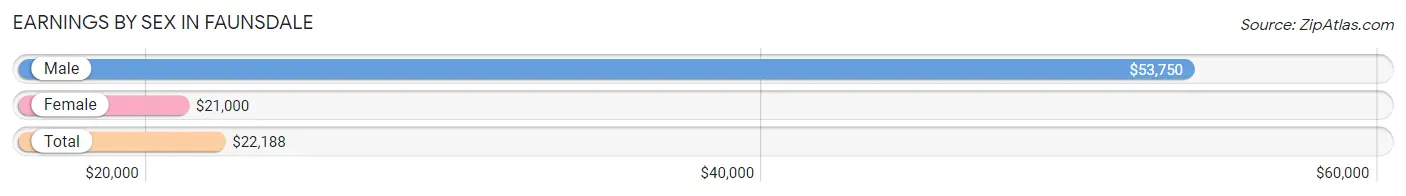
Earnings by Sex in Faunsdale
Average Earnings in Faunsdale are $22,188, $53,750 for men and $21,000 for women, a difference of 60.9%.
| Sex | Number | Average Earnings |
| Male | 26 (41.9%) | $53,750 |
| Female | 36 (58.1%) | $21,000 |
| Total | 62 (100.0%) | $22,188 |
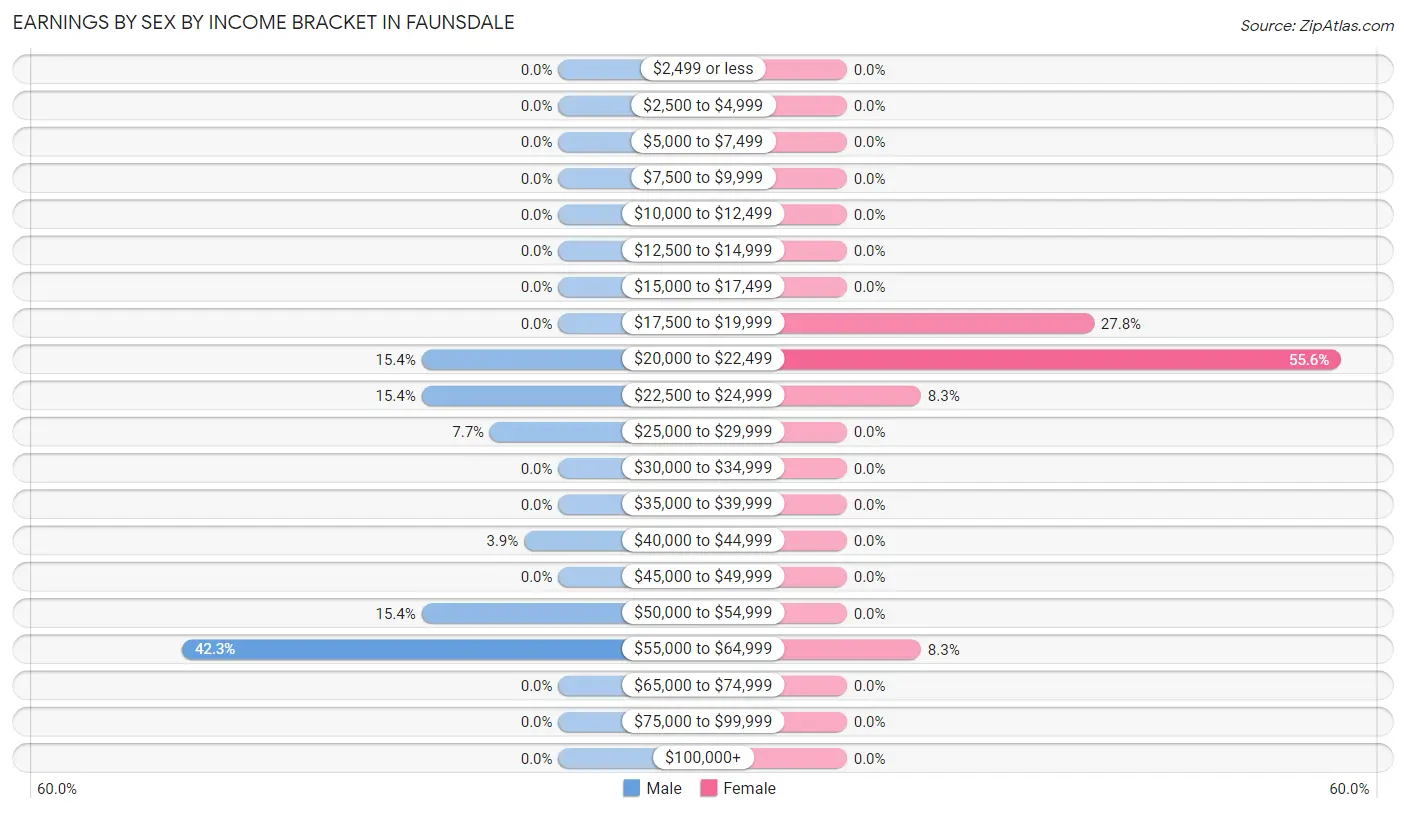
Earnings by Sex by Income Bracket in Faunsdale
The most common earnings brackets in Faunsdale are $55,000 to $64,999 for men (11 | 42.3%) and $20,000 to $22,499 for women (20 | 55.6%).
| Income | Male | Female |
| $2,499 or less | 0 (0.0%) | 0 (0.0%) |
| $2,500 to $4,999 | 0 (0.0%) | 0 (0.0%) |
| $5,000 to $7,499 | 0 (0.0%) | 0 (0.0%) |
| $7,500 to $9,999 | 0 (0.0%) | 0 (0.0%) |
| $10,000 to $12,499 | 0 (0.0%) | 0 (0.0%) |
| $12,500 to $14,999 | 0 (0.0%) | 0 (0.0%) |
| $15,000 to $17,499 | 0 (0.0%) | 0 (0.0%) |
| $17,500 to $19,999 | 0 (0.0%) | 10 (27.8%) |
| $20,000 to $22,499 | 4 (15.4%) | 20 (55.6%) |
| $22,500 to $24,999 | 4 (15.4%) | 3 (8.3%) |
| $25,000 to $29,999 | 2 (7.7%) | 0 (0.0%) |
| $30,000 to $34,999 | 0 (0.0%) | 0 (0.0%) |
| $35,000 to $39,999 | 0 (0.0%) | 0 (0.0%) |
| $40,000 to $44,999 | 1 (3.8%) | 0 (0.0%) |
| $45,000 to $49,999 | 0 (0.0%) | 0 (0.0%) |
| $50,000 to $54,999 | 4 (15.4%) | 0 (0.0%) |
| $55,000 to $64,999 | 11 (42.3%) | 3 (8.3%) |
| $65,000 to $74,999 | 0 (0.0%) | 0 (0.0%) |
| $75,000 to $99,999 | 0 (0.0%) | 0 (0.0%) |
| $100,000+ | 0 (0.0%) | 0 (0.0%) |
| Total | 26 (100.0%) | 36 (100.0%) |
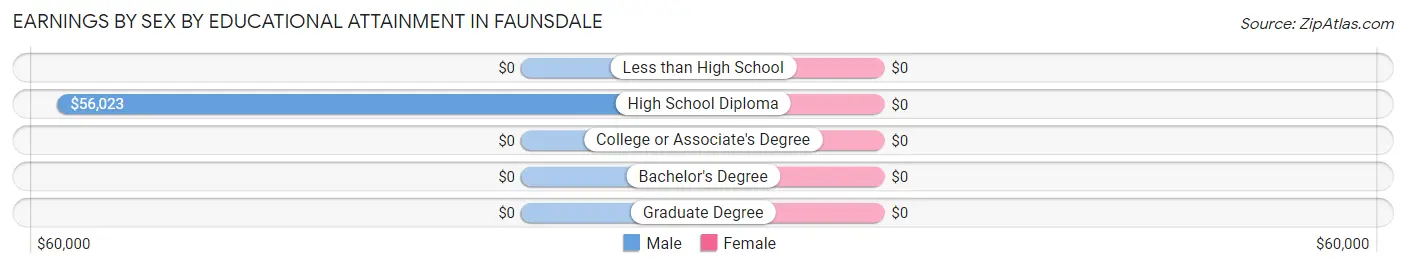
Earnings by Sex by Educational Attainment in Faunsdale
| Educational Attainment | Male Income | Female Income |
| Less than High School | - | - |
| High School Diploma | $56,023 | $0 |
| College or Associate's Degree | - | - |
| Bachelor's Degree | - | - |
| Graduate Degree | - | - |
| Total | $55,455 | $20,417 |
Family Income in Faunsdale
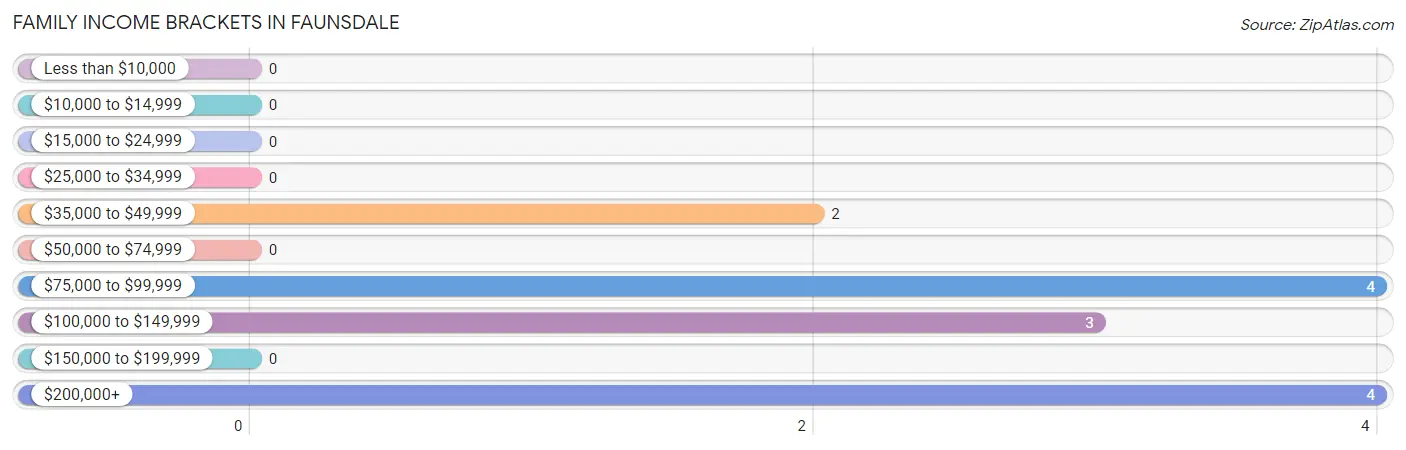
Family Income Brackets in Faunsdale
According to the Faunsdale family income data, there are 4 families falling into the $75,000 to $99,999 income range, which is the most common income bracket and makes up 30.8% of all families.
| Income Bracket | # Families | % Families |
| Less than $10,000 | 0 | 0.0% |
| $10,000 to $14,999 | 0 | 0.0% |
| $15,000 to $24,999 | 0 | 0.0% |
| $25,000 to $34,999 | 0 | 0.0% |
| $35,000 to $49,999 | 2 | 15.4% |
| $50,000 to $74,999 | 0 | 0.0% |
| $75,000 to $99,999 | 4 | 30.8% |
| $100,000 to $149,999 | 3 | 23.1% |
| $150,000 to $199,999 | 0 | 0.0% |
| $200,000+ | 4 | 30.8% |
Family Income by Famaliy Size in Faunsdale
| Income Bracket | # Families | Median Income |
| 2-Person Families | 0 (0.0%) | $0 |
| 3-Person Families | 0 (0.0%) | $0 |
| 4-Person Families | 3 (23.1%) | $0 |
| 5-Person Families | 6 (46.2%) | $0 |
| 6-Person Families | 0 (0.0%) | $0 |
| 7+ Person Families | 4 (30.8%) | $0 |
| Total | 13 (100.0%) | $115,417 |
Family Income by Number of Earners in Faunsdale
| Number of Earners | # Families | Median Income |
| No Earners | 0 (0.0%) | $0 |
| 1 Earner | 2 (15.4%) | $0 |
| 2 Earners | 7 (53.8%) | $0 |
| 3+ Earners | 4 (30.8%) | $0 |
| Total | 13 (100.0%) | $115,417 |
Household Income in Faunsdale
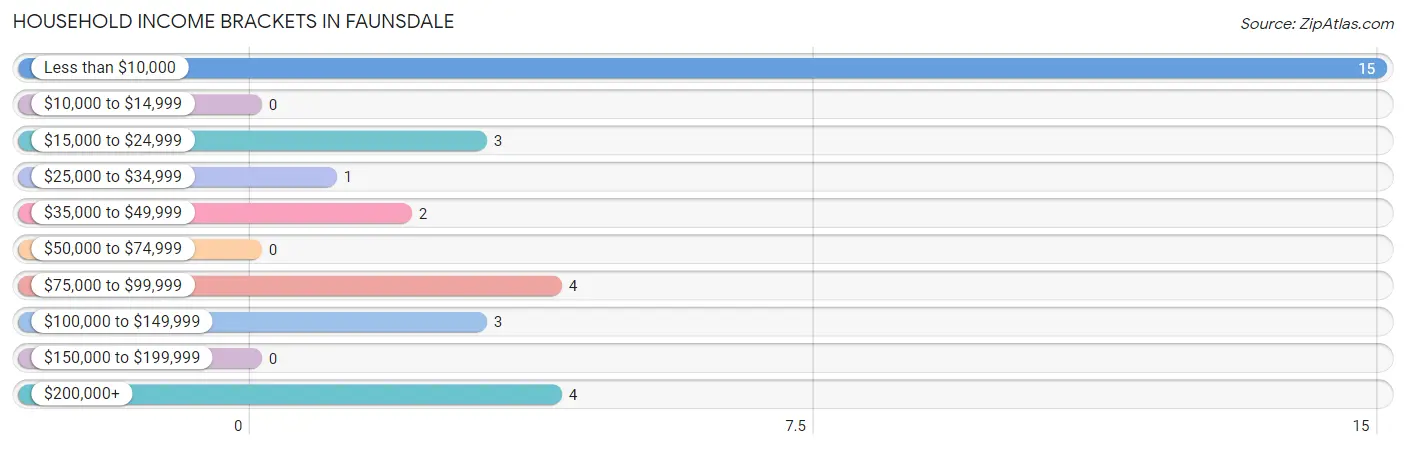
Household Income Brackets in Faunsdale
With 15 households falling in the category, the less than $10,000 income range is the most frequent in Faunsdale, accounting for 46.9% of all households.
| Income Bracket | # Households | % Households |
| Less than $10,000 | 15 | 46.9% |
| $10,000 to $14,999 | 0 | 0.0% |
| $15,000 to $24,999 | 3 | 9.4% |
| $25,000 to $34,999 | 1 | 3.1% |
| $35,000 to $49,999 | 2 | 6.3% |
| $50,000 to $74,999 | 0 | 0.0% |
| $75,000 to $99,999 | 4 | 12.5% |
| $100,000 to $149,999 | 3 | 9.4% |
| $150,000 to $199,999 | 0 | 0.0% |
| $200,000+ | 4 | 12.5% |
Household Income by Householder Age in Faunsdale
The median household income in Faunsdale is $0, with the highest median household income of $75,938 found in the 25 to 44 years age bracket for the primary householder. A total of 11 households (34.4%) fall into this category. Meanwhile, the 15 to 24 years age bracket for the primary householder has the lowest median household income of $0, with 5 households (15.6%) in this group.
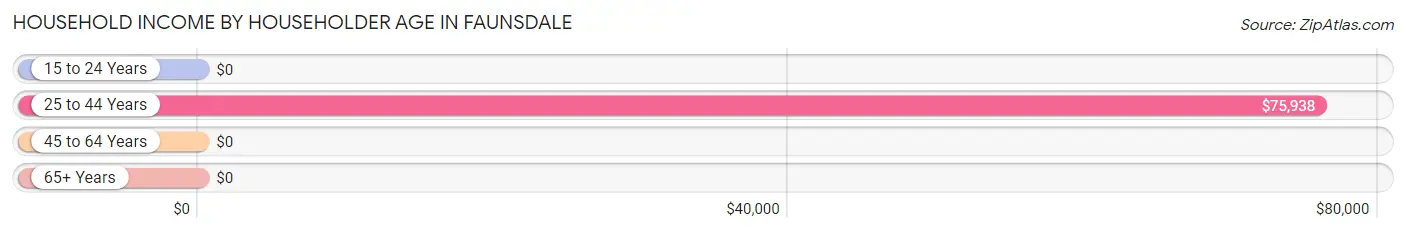
| Income Bracket | # Households | Median Income |
| 15 to 24 Years | 5 (15.6%) | $0 |
| 25 to 44 Years | 11 (34.4%) | $75,938 |
| 45 to 64 Years | 14 (43.8%) | $0 |
| 65+ Years | 2 (6.2%) | $0 |
| Total | 32 (100.0%) | $0 |
Poverty in Faunsdale
Income Below Poverty by Sex and Age in Faunsdale
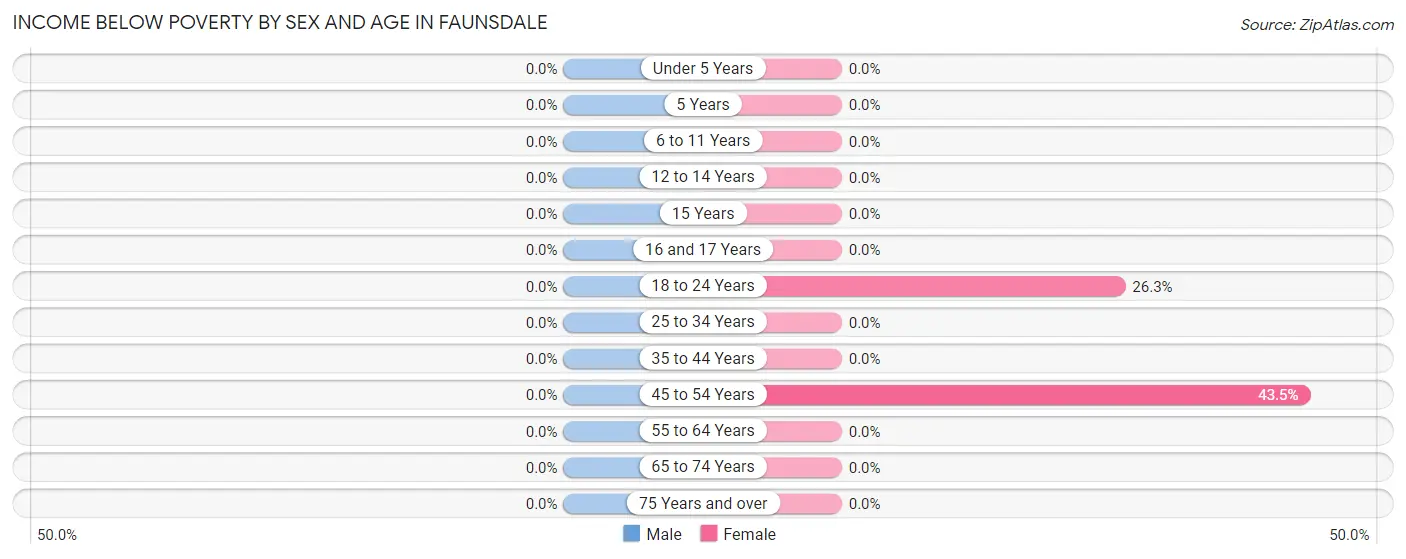
| Age Bracket | Male | Female |
| Under 5 Years | 0 (0.0%) | 0 (0.0%) |
| 5 Years | 0 (0.0%) | 0 (0.0%) |
| 6 to 11 Years | 0 (0.0%) | 0 (0.0%) |
| 12 to 14 Years | 0 (0.0%) | 0 (0.0%) |
| 15 Years | 0 (0.0%) | 0 (0.0%) |
| 16 and 17 Years | 0 (0.0%) | 0 (0.0%) |
| 18 to 24 Years | 0 (0.0%) | 5 (26.3%) |
| 25 to 34 Years | 0 (0.0%) | 0 (0.0%) |
| 35 to 44 Years | 0 (0.0%) | 0 (0.0%) |
| 45 to 54 Years | 0 (0.0%) | 10 (43.5%) |
| 55 to 64 Years | 0 (0.0%) | 0 (0.0%) |
| 65 to 74 Years | 0 (0.0%) | 0 (0.0%) |
| 75 Years and over | 0 (0.0%) | 0 (0.0%) |
| Total | 0 (0.0%) | 15 (16.1%) |
Income Above Poverty by Sex and Age in Faunsdale
According to the poverty statistics in Faunsdale, males aged under 5 years and females aged under 5 years are the age groups that are most secure financially, with 100.0% of males and 100.0% of females in these age groups living above the poverty line.
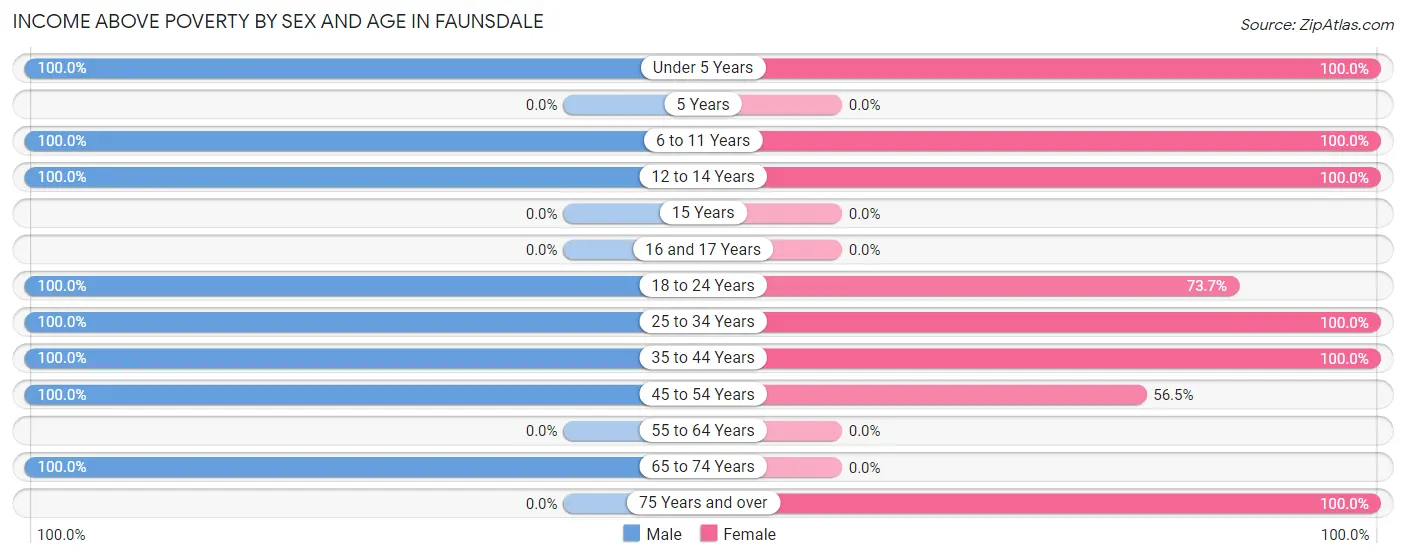
| Age Bracket | Male | Female |
| Under 5 Years | 4 (100.0%) | 26 (100.0%) |
| 5 Years | 0 (0.0%) | 0 (0.0%) |
| 6 to 11 Years | 7 (100.0%) | 7 (100.0%) |
| 12 to 14 Years | 5 (100.0%) | 6 (100.0%) |
| 15 Years | 0 (0.0%) | 0 (0.0%) |
| 16 and 17 Years | 0 (0.0%) | 0 (0.0%) |
| 18 to 24 Years | 8 (100.0%) | 14 (73.7%) |
| 25 to 34 Years | 1 (100.0%) | 4 (100.0%) |
| 35 to 44 Years | 6 (100.0%) | 7 (100.0%) |
| 45 to 54 Years | 11 (100.0%) | 13 (56.5%) |
| 55 to 64 Years | 0 (0.0%) | 0 (0.0%) |
| 65 to 74 Years | 1 (100.0%) | 0 (0.0%) |
| 75 Years and over | 0 (0.0%) | 1 (100.0%) |
| Total | 43 (100.0%) | 78 (83.9%) |
Income Below Poverty Among Married-Couple Families in Faunsdale
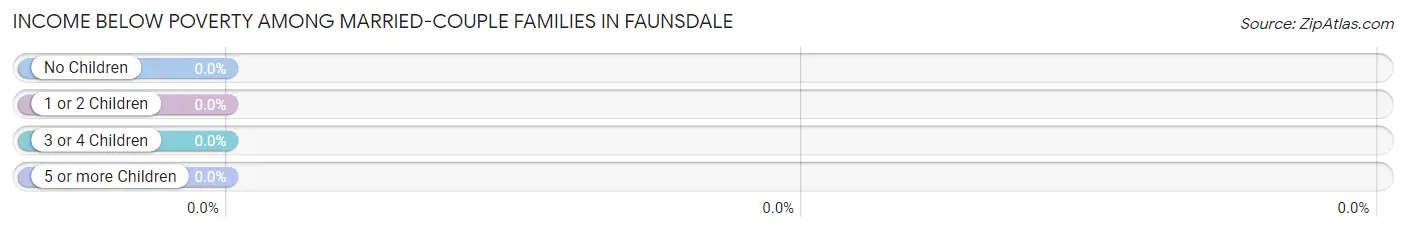
| Children | Above Poverty | Below Poverty |
| No Children | 0 (0.0%) | 0 (0.0%) |
| 1 or 2 Children | 3 (100.0%) | 0 (0.0%) |
| 3 or 4 Children | 10 (100.0%) | 0 (0.0%) |
| 5 or more Children | 0 (0.0%) | 0 (0.0%) |
| Total | 13 (100.0%) | 0 (0.0%) |
Income Below Poverty Among Single-Parent Households in Faunsdale
| Children | Single Father | Single Mother |
| No Children | 0 (0.0%) | 0 (0.0%) |
| 1 or 2 Children | 0 (0.0%) | 0 (0.0%) |
| 3 or 4 Children | 0 (0.0%) | 0 (0.0%) |
| 5 or more Children | 0 (0.0%) | 0 (0.0%) |
| Total | 0 (0.0%) | 0 (0.0%) |
Income Below Poverty Among Married-Couple vs Single-Parent Households in Faunsdale
| Children | Married-Couple Families | Single-Parent Households |
| No Children | 0 (0.0%) | 0 (0.0%) |
| 1 or 2 Children | 0 (0.0%) | 0 (0.0%) |
| 3 or 4 Children | 0 (0.0%) | 0 (0.0%) |
| 5 or more Children | 0 (0.0%) | 0 (0.0%) |
| Total | 0 (0.0%) | 0 (0.0%) |
Race in Faunsdale
The most populous races in Faunsdale are White / Caucasian (92 | 67.6%), and Black / African American (44 | 32.4%).
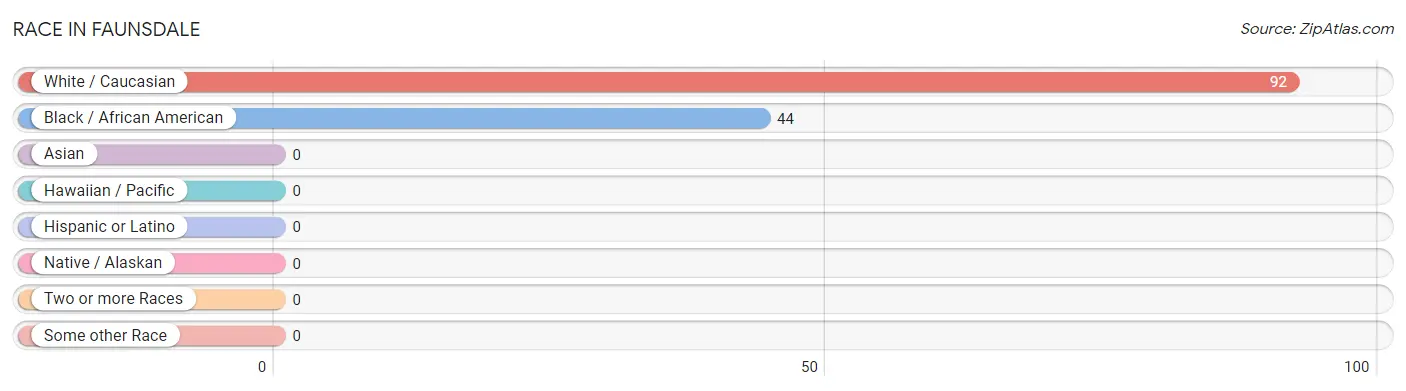
| Race | # Population | % Population |
| Asian | 0 | 0.0% |
| Black / African American | 44 | 32.4% |
| Hawaiian / Pacific | 0 | 0.0% |
| Hispanic or Latino | 0 | 0.0% |
| Native / Alaskan | 0 | 0.0% |
| White / Caucasian | 92 | 67.6% |
| Two or more Races | 0 | 0.0% |
| Some other Race | 0 | 0.0% |
| Total | 136 | 100.0% |
Ancestry in Faunsdale
The most populous ancestries reported in Faunsdale are American (56 | 41.2%), Dutch (6 | 4.4%), German (1 | 0.7%), and Scotch-Irish (1 | 0.7%), together accounting for 47.1% of all Faunsdale residents.
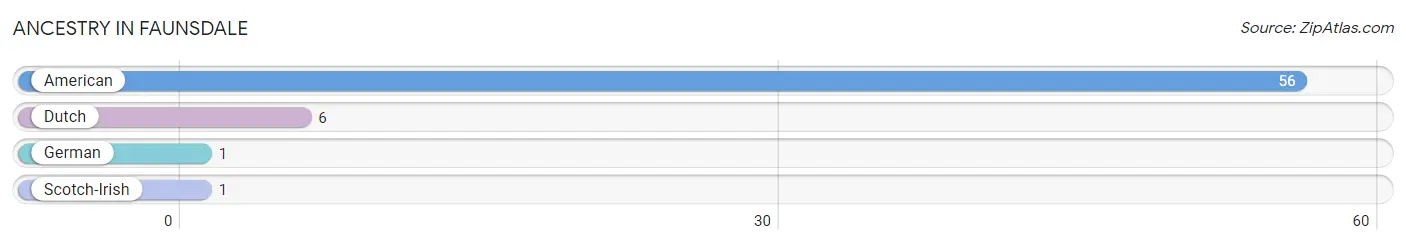
| Ancestry | # Population | % Population |
| American | 56 | 41.2% |
| Dutch | 6 | 4.4% |
| German | 1 | 0.7% |
| Scotch-Irish | 1 | 0.7% | View All 4 Rows |
Immigrants in Faunsdale

| Immigration Origin | # Population | % Population | View All 0 Rows |
Sex and Age in Faunsdale
Sex and Age in Faunsdale
The most populous age groups in Faunsdale are 50 to 54 Years (11 | 25.6%) for men and Under 5 Years (26 | 28.0%) for women.
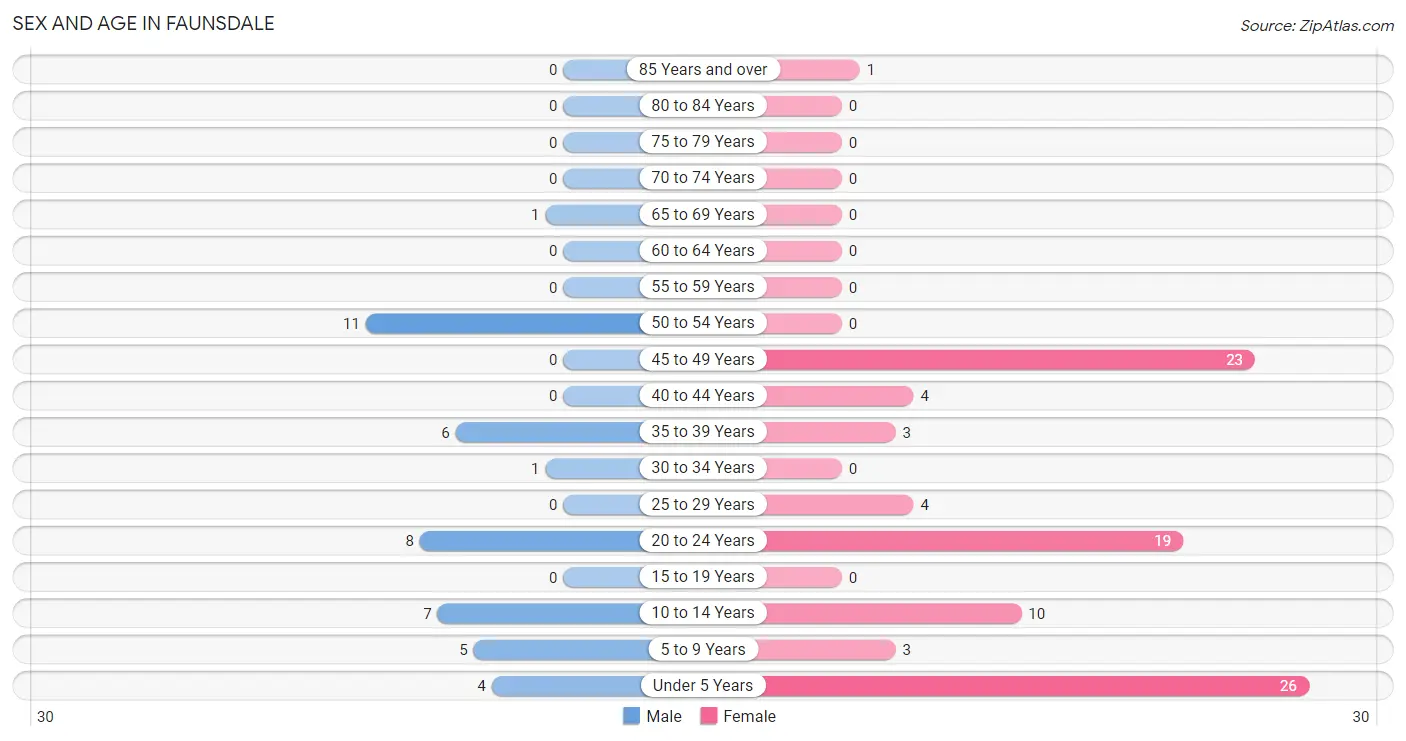
| Age Bracket | Male | Female |
| Under 5 Years | 4 (9.3%) | 26 (28.0%) |
| 5 to 9 Years | 5 (11.6%) | 3 (3.2%) |
| 10 to 14 Years | 7 (16.3%) | 10 (10.7%) |
| 15 to 19 Years | 0 (0.0%) | 0 (0.0%) |
| 20 to 24 Years | 8 (18.6%) | 19 (20.4%) |
| 25 to 29 Years | 0 (0.0%) | 4 (4.3%) |
| 30 to 34 Years | 1 (2.3%) | 0 (0.0%) |
| 35 to 39 Years | 6 (14.0%) | 3 (3.2%) |
| 40 to 44 Years | 0 (0.0%) | 4 (4.3%) |
| 45 to 49 Years | 0 (0.0%) | 23 (24.7%) |
| 50 to 54 Years | 11 (25.6%) | 0 (0.0%) |
| 55 to 59 Years | 0 (0.0%) | 0 (0.0%) |
| 60 to 64 Years | 0 (0.0%) | 0 (0.0%) |
| 65 to 69 Years | 1 (2.3%) | 0 (0.0%) |
| 70 to 74 Years | 0 (0.0%) | 0 (0.0%) |
| 75 to 79 Years | 0 (0.0%) | 0 (0.0%) |
| 80 to 84 Years | 0 (0.0%) | 0 (0.0%) |
| 85 Years and over | 0 (0.0%) | 1 (1.1%) |
| Total | 43 (100.0%) | 93 (100.0%) |
Families and Households in Faunsdale
Median Family Size in Faunsdale
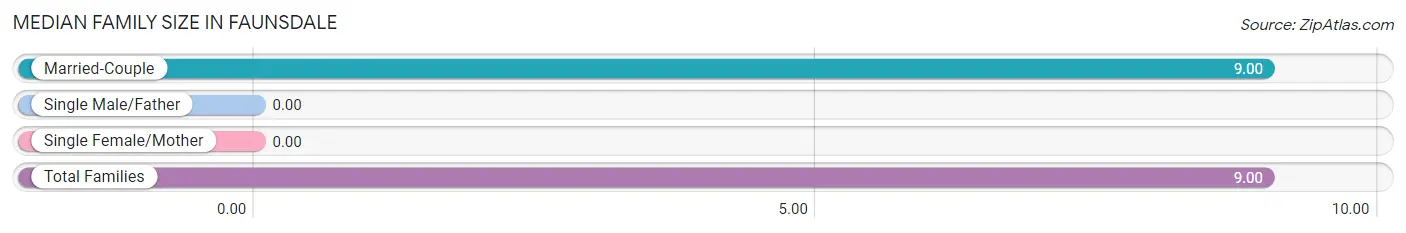
| Family Type | # Families | Family Size |
| Married-Couple | 13 (100.0%) | 9.00 |
| Single Male/Father | 0 (0.0%) | - |
| Single Female/Mother | 0 (0.0%) | - |
| Total Families | 13 (100.0%) | 9.00 |
Median Household Size in Faunsdale
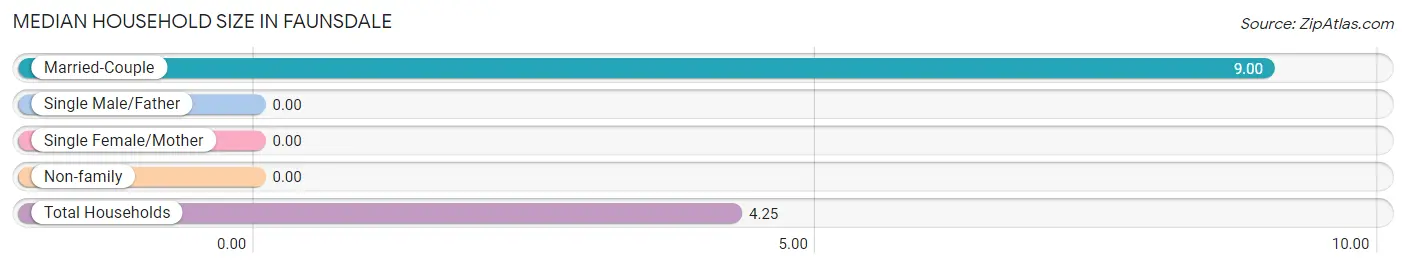
| Household Type | # Households | Household Size |
| Married-Couple | 13 (40.6%) | 9.00 |
| Single Male/Father | 0 (0.0%) | - |
| Single Female/Mother | 0 (0.0%) | - |
| Non-family | 19 (59.4%) | - |
| Total Households | 32 (100.0%) | 4.25 |
Household Size by Marriage Status in Faunsdale
Out of a total of 32 households in Faunsdale, 13 (40.6%) are family households, while 19 (59.4%) are nonfamily households. The most numerous type of family households are 5-person households, comprising 6, and the most common type of nonfamily households are 1-person households, comprising 19.
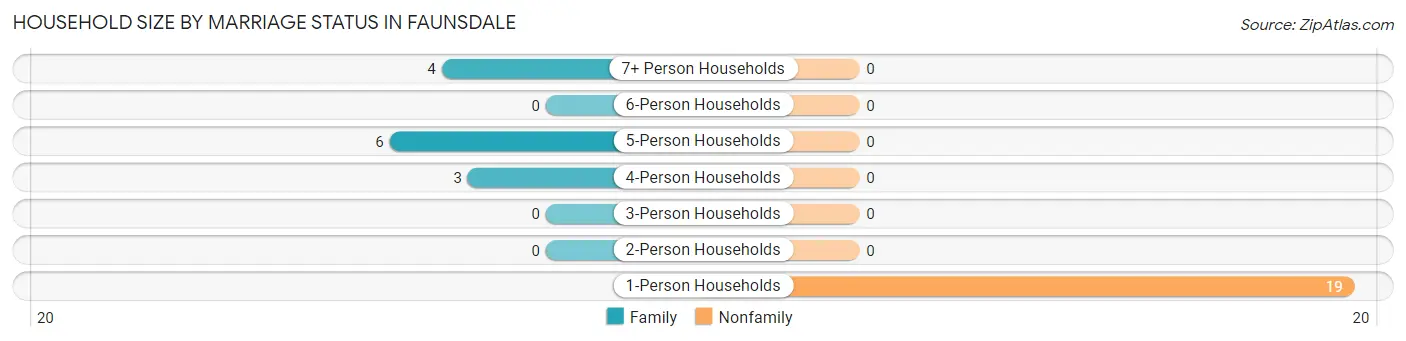
| Household Size | Family Households | Nonfamily Households |
| 1-Person Households | - | 19 (59.4%) |
| 2-Person Households | 0 (0.0%) | 0 (0.0%) |
| 3-Person Households | 0 (0.0%) | 0 (0.0%) |
| 4-Person Households | 3 (9.4%) | 0 (0.0%) |
| 5-Person Households | 6 (18.8%) | 0 (0.0%) |
| 6-Person Households | 0 (0.0%) | 0 (0.0%) |
| 7+ Person Households | 4 (12.5%) | 0 (0.0%) |
| Total | 13 (40.6%) | 19 (59.4%) |
Female Fertility in Faunsdale
Fertility by Age in Faunsdale
| Age Bracket | Women with Births | Births / 1,000 Women |
| 15 to 19 years | 0 (0.0%) | 0.0 |
| 20 to 34 years | 0 (0.0%) | 0.0 |
| 35 to 50 years | 0 (0.0%) | 0.0 |
| Total | 0 (0.0%) | 0.0 |
Fertility by Age by Marriage Status in Faunsdale
| Age Bracket | Married | Unmarried |
| 15 to 19 years | 0 (0.0%) | 0 (0.0%) |
| 20 to 34 years | 0 (0.0%) | 0 (0.0%) |
| 35 to 50 years | 0 (0.0%) | 0 (0.0%) |
| Total | 0 (0.0%) | 0 (0.0%) |
Fertility by Education in Faunsdale
| Educational Attainment | Women with Births | Births / 1,000 Women |
| Less than High School | 0 (0.0%) | 0.0 |
| High School Diploma | 0 (0.0%) | 0.0 |
| College or Associate's Degree | 0 (0.0%) | 0.0 |
| Bachelor's Degree | 0 (0.0%) | 0.0 |
| Graduate Degree | 0 (0.0%) | 0.0 |
| Total | 0 (0.0%) | 0.0 |
Fertility by Education by Marriage Status in Faunsdale
| Educational Attainment | Married | Unmarried |
| Less than High School | 0 (0.0%) | 0 (0.0%) |
| High School Diploma | 0 (0.0%) | 0 (0.0%) |
| College or Associate's Degree | 0 (0.0%) | 0 (0.0%) |
| Bachelor's Degree | 0 (0.0%) | 0 (0.0%) |
| Graduate Degree | 0 (0.0%) | 0 (0.0%) |
| Total | 0 (0.0%) | 0 (0.0%) |
Employment Characteristics in Faunsdale
Employment by Class of Employer in Faunsdale
Among the 55 employed individuals in Faunsdale, private company employees (52 | 94.6%), and local government employees (3 | 5.4%) make up the most common classes of employment.
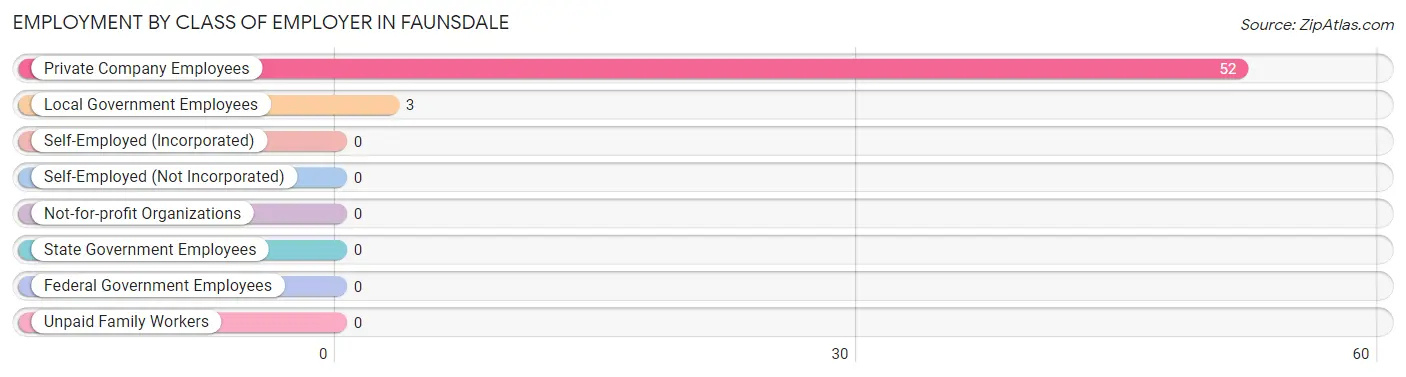
| Employer Class | # Employees | % Employees |
| Private Company Employees | 52 | 94.6% |
| Self-Employed (Incorporated) | 0 | 0.0% |
| Self-Employed (Not Incorporated) | 0 | 0.0% |
| Not-for-profit Organizations | 0 | 0.0% |
| Local Government Employees | 3 | 5.4% |
| State Government Employees | 0 | 0.0% |
| Federal Government Employees | 0 | 0.0% |
| Unpaid Family Workers | 0 | 0.0% |
| Total | 55 | 100.0% |
Employment Status by Age in Faunsdale
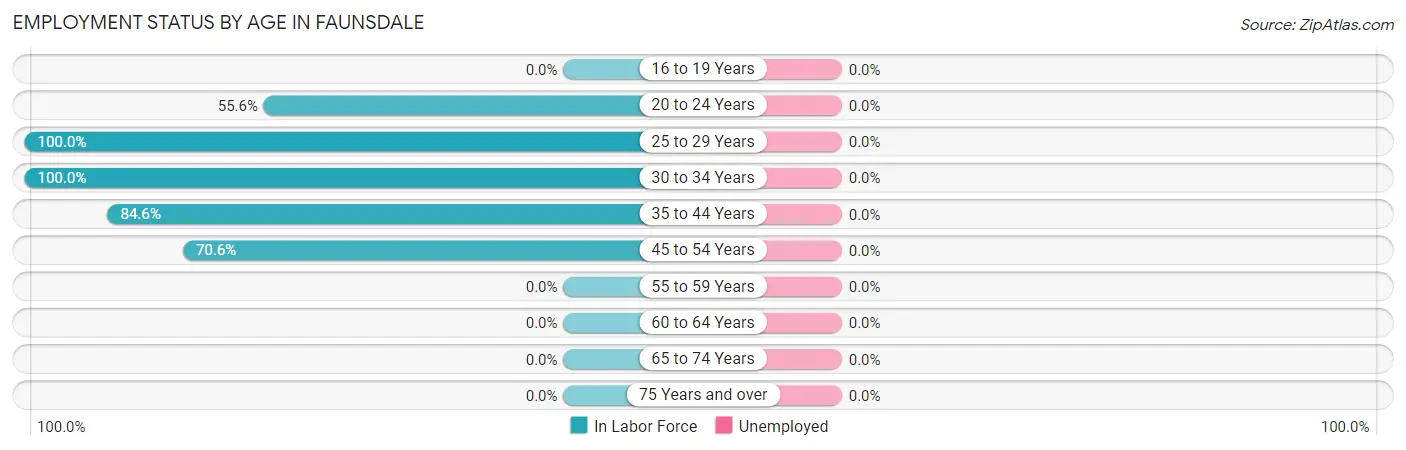
| Age Bracket | In Labor Force | Unemployed |
| 16 to 19 Years | 0 (0.0%) | 0 (0.0%) |
| 20 to 24 Years | 15 (55.6%) | 0 (0.0%) |
| 25 to 29 Years | 4 (100.0%) | 0 (0.0%) |
| 30 to 34 Years | 1 (100.0%) | 0 (0.0%) |
| 35 to 44 Years | 11 (84.6%) | 0 (0.0%) |
| 45 to 54 Years | 24 (70.6%) | 0 (0.0%) |
| 55 to 59 Years | 0 (0.0%) | 0 (0.0%) |
| 60 to 64 Years | 0 (0.0%) | 0 (0.0%) |
| 65 to 74 Years | 0 (0.0%) | 0 (0.0%) |
| 75 Years and over | 0 (0.0%) | 0 (0.0%) |
| Total | 55 (67.9%) | 0 (0.0%) |
Employment Status by Educational Attainment in Faunsdale
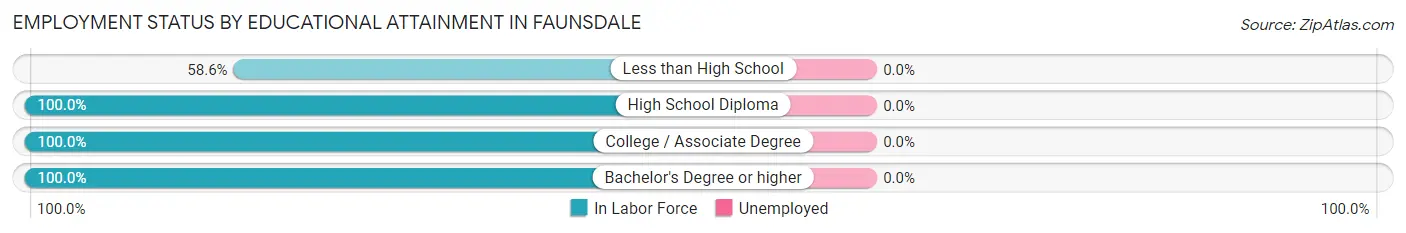
| Educational Attainment | In Labor Force | Unemployed |
| Less than High School | 17 (58.6%) | 0 (0.0%) |
| High School Diploma | 13 (100.0%) | 0 (0.0%) |
| College / Associate Degree | 7 (100.0%) | 0 (0.0%) |
| Bachelor's Degree or higher | 3 (100.0%) | 0 (0.0%) |
| Total | 40 (76.9%) | 0 (0.0%) |
Employment Occupations by Sex in Faunsdale
Management, Business, Science and Arts Occupations
The most common Management, Business, Science and Arts occupations in Faunsdale are Health Diagnosing & Treating (13 | 23.6%), Business & Financial (4 | 7.3%), Community & Social Service (3 | 5.4%), and Education, Arts & Media (3 | 5.4%).
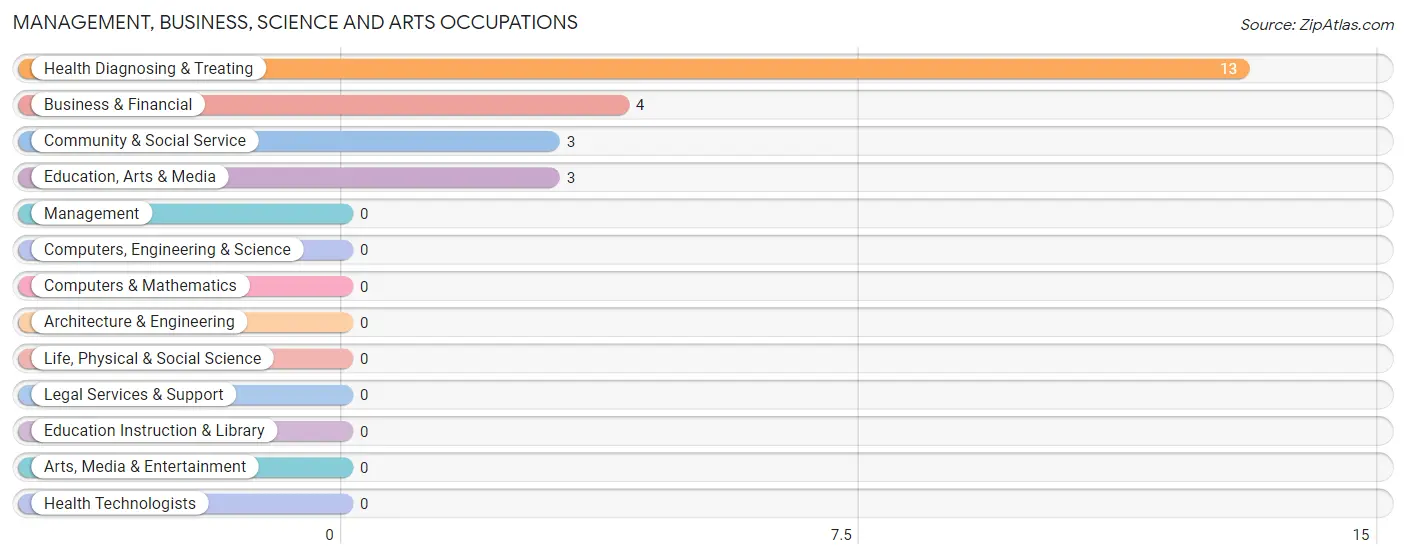
Management, Business, Science and Arts Occupations by Sex
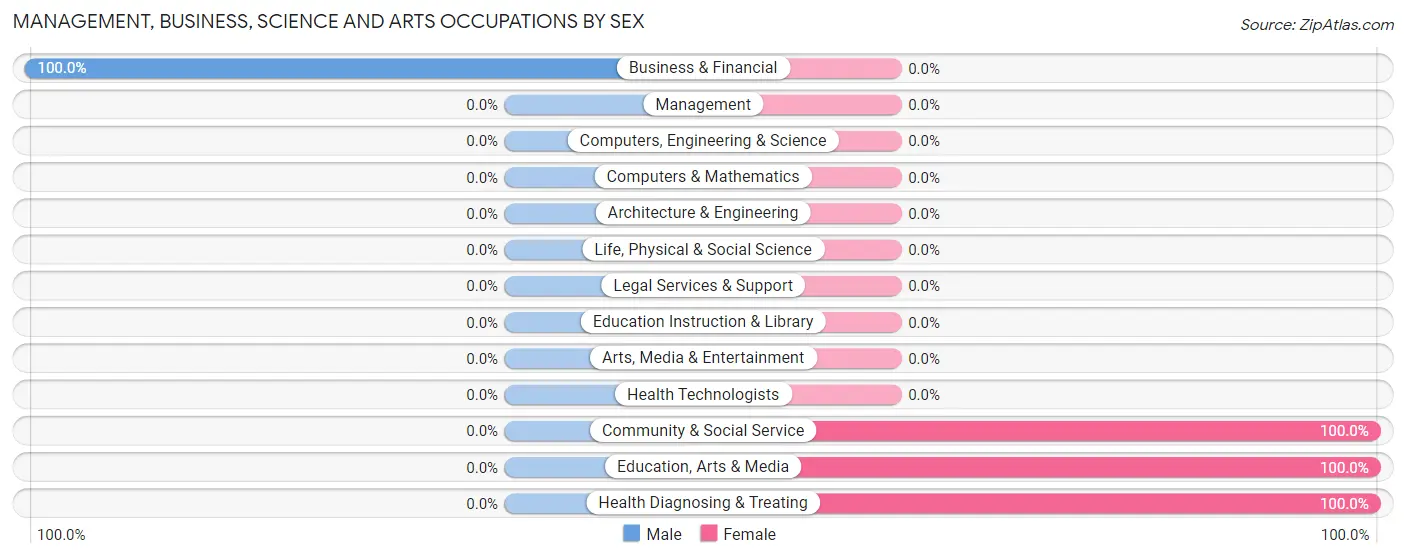
| Occupation | Male | Female |
| Management | 0 (0.0%) | 0 (0.0%) |
| Business & Financial | 4 (100.0%) | 0 (0.0%) |
| Computers, Engineering & Science | 0 (0.0%) | 0 (0.0%) |
| Computers & Mathematics | 0 (0.0%) | 0 (0.0%) |
| Architecture & Engineering | 0 (0.0%) | 0 (0.0%) |
| Life, Physical & Social Science | 0 (0.0%) | 0 (0.0%) |
| Community & Social Service | 0 (0.0%) | 3 (100.0%) |
| Education, Arts & Media | 0 (0.0%) | 3 (100.0%) |
| Legal Services & Support | 0 (0.0%) | 0 (0.0%) |
| Education Instruction & Library | 0 (0.0%) | 0 (0.0%) |
| Arts, Media & Entertainment | 0 (0.0%) | 0 (0.0%) |
| Health Diagnosing & Treating | 0 (0.0%) | 13 (100.0%) |
| Health Technologists | 0 (0.0%) | 0 (0.0%) |
| Total (Category) | 4 (20.0%) | 16 (80.0%) |
| Total (Overall) | 26 (47.3%) | 29 (52.7%) |
Services Occupations
The most common Services occupations in Faunsdale are , and Healthcare Support (7 | 12.7%).
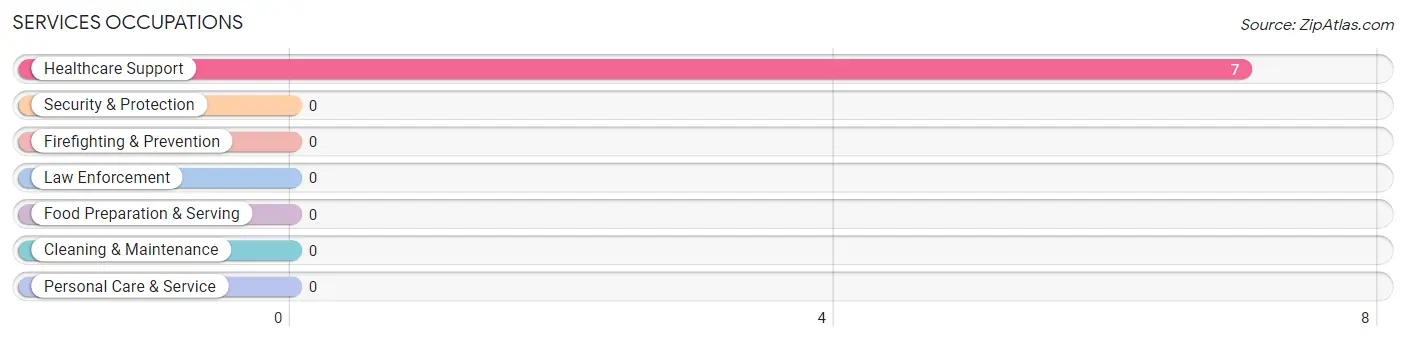
Services Occupations by Sex
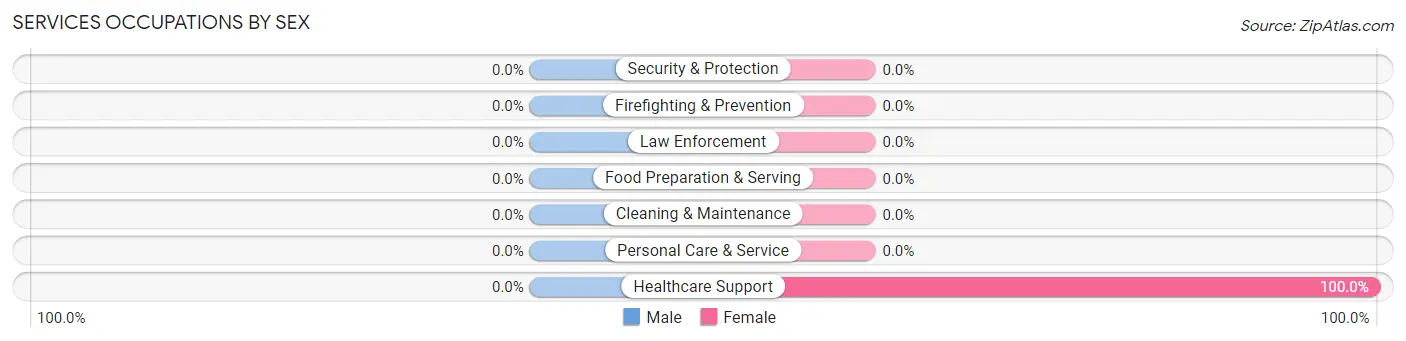
| Occupation | Male | Female |
| Healthcare Support | 0 (0.0%) | 7 (100.0%) |
| Security & Protection | 0 (0.0%) | 0 (0.0%) |
| Firefighting & Prevention | 0 (0.0%) | 0 (0.0%) |
| Law Enforcement | 0 (0.0%) | 0 (0.0%) |
| Food Preparation & Serving | 0 (0.0%) | 0 (0.0%) |
| Cleaning & Maintenance | 0 (0.0%) | 0 (0.0%) |
| Personal Care & Service | 0 (0.0%) | 0 (0.0%) |
| Total (Category) | 0 (0.0%) | 7 (100.0%) |
| Total (Overall) | 26 (47.3%) | 29 (52.7%) |
Sales and Office Occupations
The most common Sales and Office occupations in Faunsdale are , and Office & Administration (6 | 10.9%).
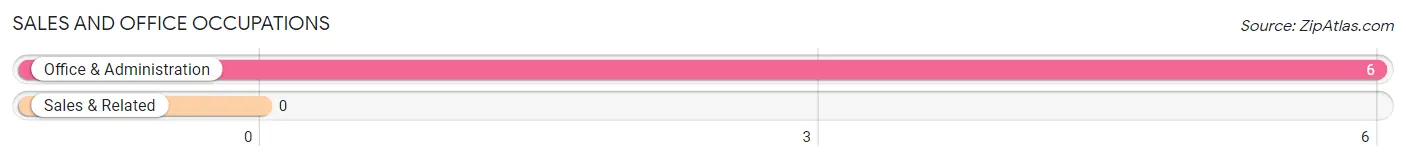
Sales and Office Occupations by Sex
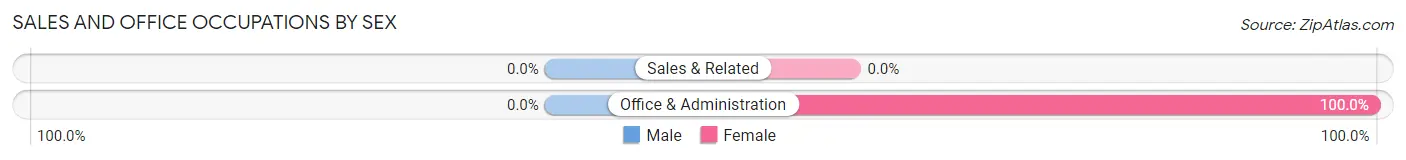
| Occupation | Male | Female |
| Sales & Related | 0 (0.0%) | 0 (0.0%) |
| Office & Administration | 0 (0.0%) | 6 (100.0%) |
| Total (Category) | 0 (0.0%) | 6 (100.0%) |
| Total (Overall) | 26 (47.3%) | 29 (52.7%) |
Natural Resources, Construction and Maintenance Occupations
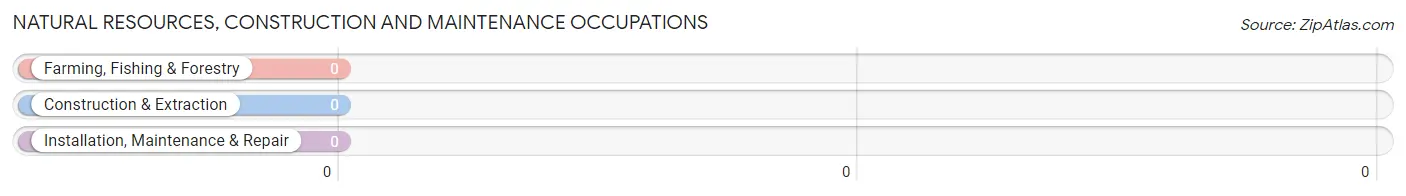
Natural Resources, Construction and Maintenance Occupations by Sex
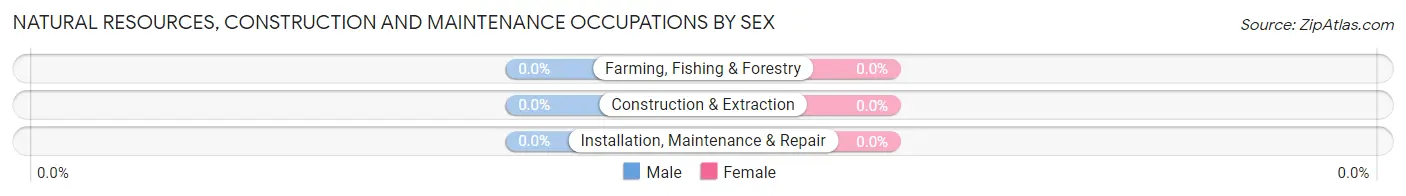
| Occupation | Male | Female |
| Farming, Fishing & Forestry | 0 (0.0%) | 0 (0.0%) |
| Construction & Extraction | 0 (0.0%) | 0 (0.0%) |
| Installation, Maintenance & Repair | 0 (0.0%) | 0 (0.0%) |
| Total (Category) | 0 (0.0%) | 0 (0.0%) |
| Total (Overall) | 26 (47.3%) | 29 (52.7%) |
Production, Transportation and Moving Occupations
The most common Production, Transportation and Moving occupations in Faunsdale are Transportation (12 | 21.8%), Material Moving (6 | 10.9%), and Production (4 | 7.3%).
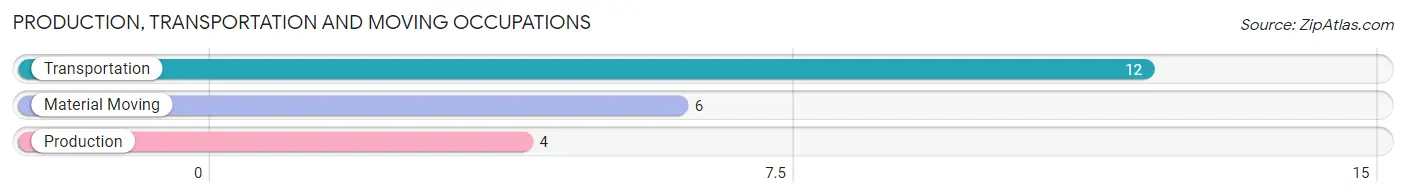
Production, Transportation and Moving Occupations by Sex
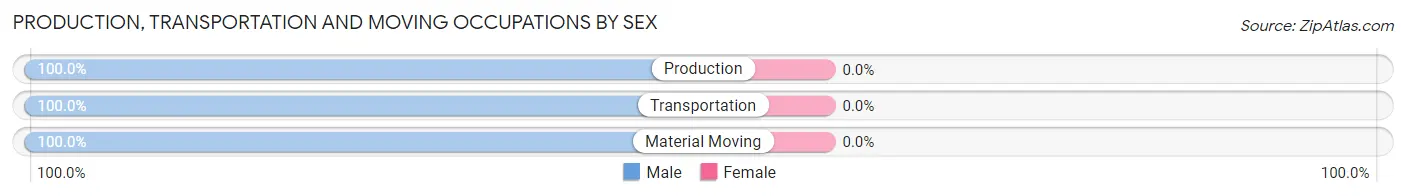
| Occupation | Male | Female |
| Production | 4 (100.0%) | 0 (0.0%) |
| Transportation | 12 (100.0%) | 0 (0.0%) |
| Material Moving | 6 (100.0%) | 0 (0.0%) |
| Total (Category) | 22 (100.0%) | 0 (0.0%) |
| Total (Overall) | 26 (47.3%) | 29 (52.7%) |
Employment Industries by Sex in Faunsdale
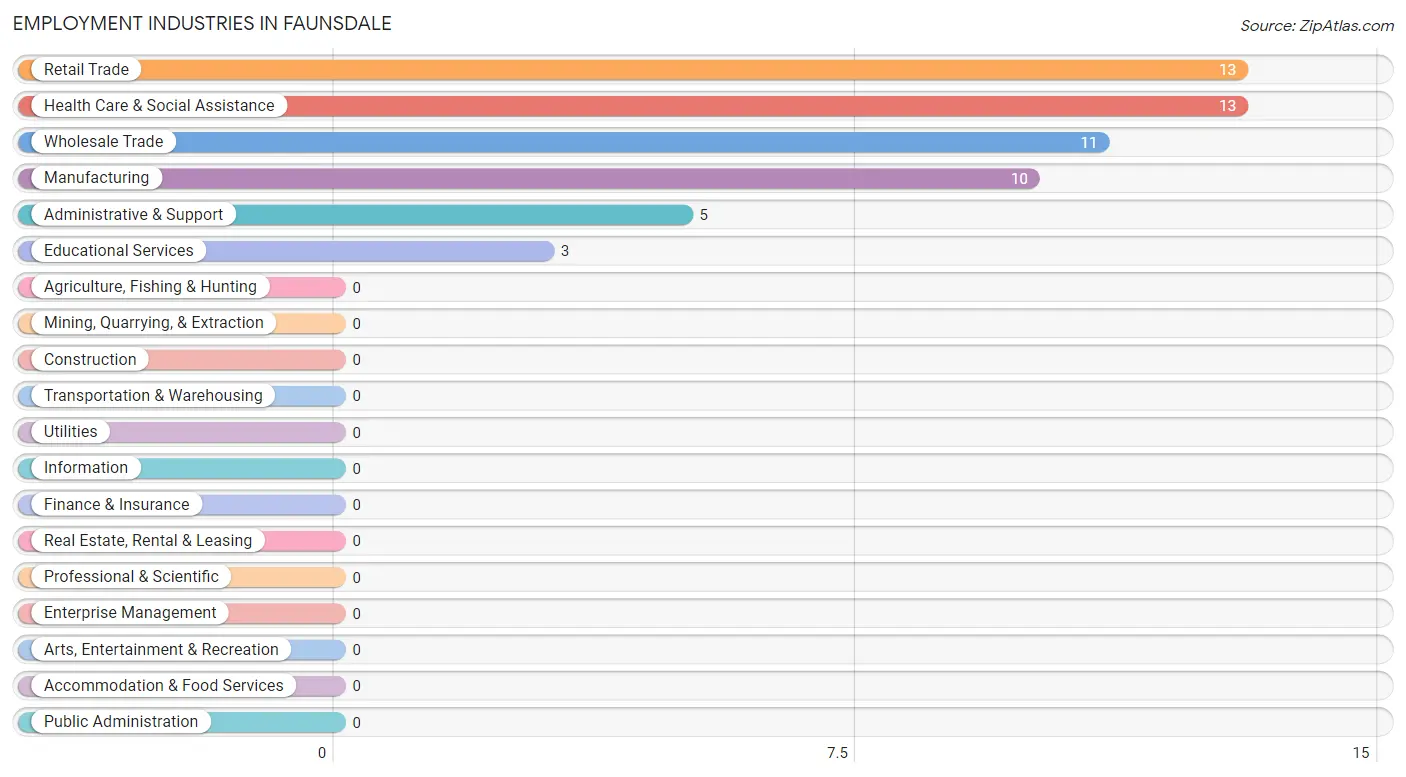
Employment Industries in Faunsdale
The major employment industries in Faunsdale include Retail Trade (13 | 23.6%), Health Care & Social Assistance (13 | 23.6%), Wholesale Trade (11 | 20.0%), Manufacturing (10 | 18.2%), and Administrative & Support (5 | 9.1%).
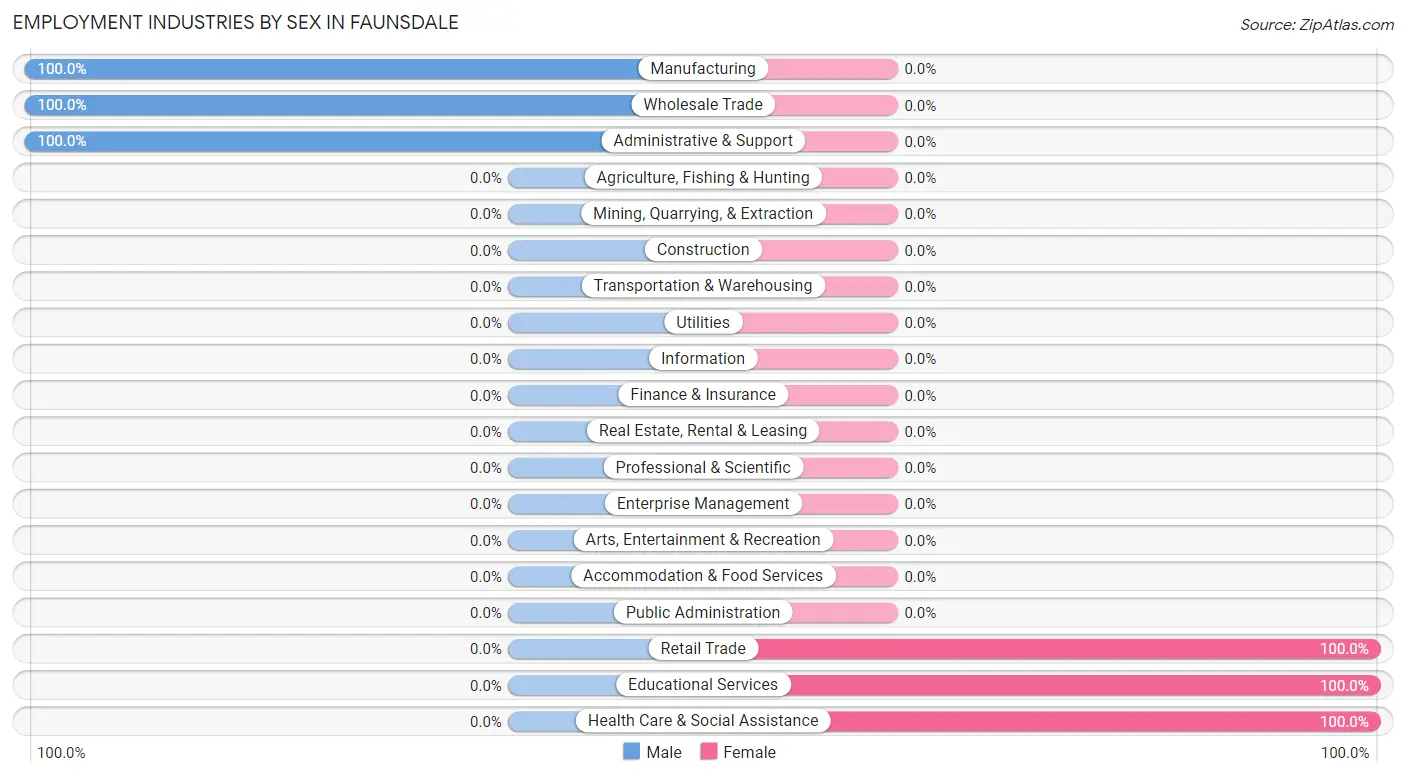
Employment Industries by Sex in Faunsdale
The Faunsdale industries that see more men than women are Manufacturing (100.0%), Wholesale Trade (100.0%), and Administrative & Support (100.0%), whereas the industries that tend to have a higher number of women are Retail Trade (100.0%), Educational Services (100.0%), and Health Care & Social Assistance (100.0%).
| Industry | Male | Female |
| Agriculture, Fishing & Hunting | 0 (0.0%) | 0 (0.0%) |
| Mining, Quarrying, & Extraction | 0 (0.0%) | 0 (0.0%) |
| Construction | 0 (0.0%) | 0 (0.0%) |
| Manufacturing | 10 (100.0%) | 0 (0.0%) |
| Wholesale Trade | 11 (100.0%) | 0 (0.0%) |
| Retail Trade | 0 (0.0%) | 13 (100.0%) |
| Transportation & Warehousing | 0 (0.0%) | 0 (0.0%) |
| Utilities | 0 (0.0%) | 0 (0.0%) |
| Information | 0 (0.0%) | 0 (0.0%) |
| Finance & Insurance | 0 (0.0%) | 0 (0.0%) |
| Real Estate, Rental & Leasing | 0 (0.0%) | 0 (0.0%) |
| Professional & Scientific | 0 (0.0%) | 0 (0.0%) |
| Enterprise Management | 0 (0.0%) | 0 (0.0%) |
| Administrative & Support | 5 (100.0%) | 0 (0.0%) |
| Educational Services | 0 (0.0%) | 3 (100.0%) |
| Health Care & Social Assistance | 0 (0.0%) | 13 (100.0%) |
| Arts, Entertainment & Recreation | 0 (0.0%) | 0 (0.0%) |
| Accommodation & Food Services | 0 (0.0%) | 0 (0.0%) |
| Public Administration | 0 (0.0%) | 0 (0.0%) |
| Total | 26 (47.3%) | 29 (52.7%) |
Education in Faunsdale
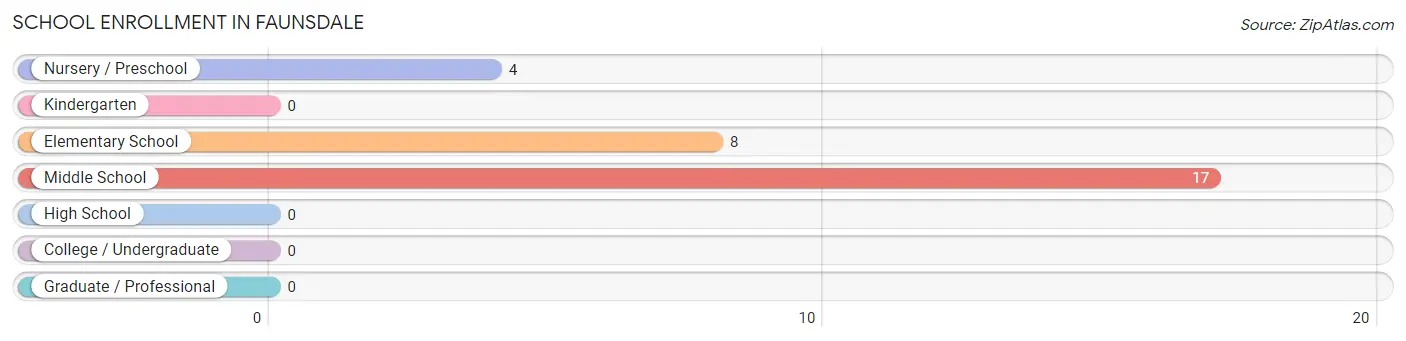
School Enrollment in Faunsdale
The most common levels of schooling among the 29 students in Faunsdale are middle school (17 | 58.6%), elementary school (8 | 27.6%), and nursery / preschool (4 | 13.8%).
| School Level | # Students | % Students |
| Nursery / Preschool | 4 | 13.8% |
| Kindergarten | 0 | 0.0% |
| Elementary School | 8 | 27.6% |
| Middle School | 17 | 58.6% |
| High School | 0 | 0.0% |
| College / Undergraduate | 0 | 0.0% |
| Graduate / Professional | 0 | 0.0% |
| Total | 29 | 100.0% |
School Enrollment by Age by Funding Source in Faunsdale
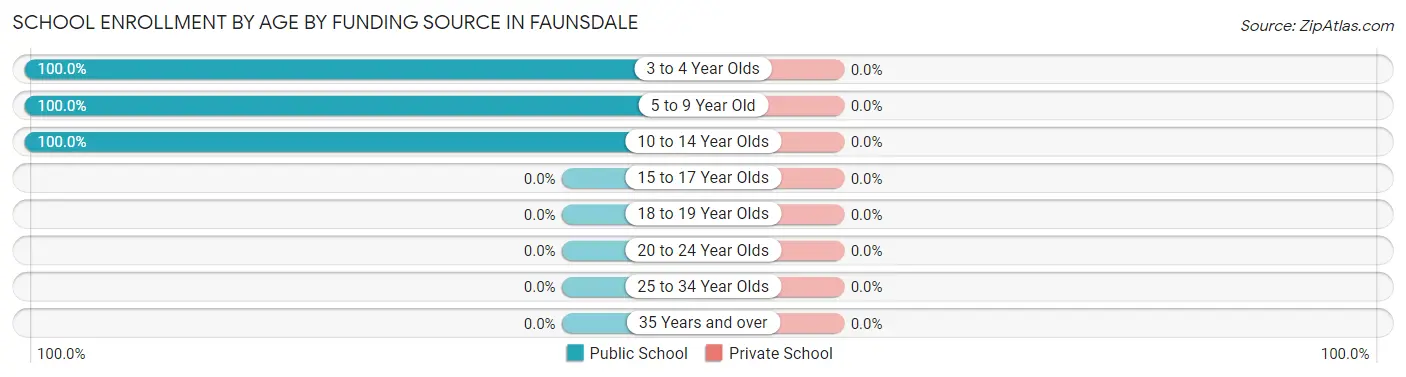
| Age Bracket | Public School | Private School |
| 3 to 4 Year Olds | 4 (100.0%) | 0 (0.0%) |
| 5 to 9 Year Old | 8 (100.0%) | 0 (0.0%) |
| 10 to 14 Year Olds | 17 (100.0%) | 0 (0.0%) |
| 15 to 17 Year Olds | 0 (0.0%) | 0 (0.0%) |
| 18 to 19 Year Olds | 0 (0.0%) | 0 (0.0%) |
| 20 to 24 Year Olds | 0 (0.0%) | 0 (0.0%) |
| 25 to 34 Year Olds | 0 (0.0%) | 0 (0.0%) |
| 35 Years and over | 0 (0.0%) | 0 (0.0%) |
| Total | 29 (100.0%) | 0 (0.0%) |
Educational Attainment by Field of Study in Faunsdale
Education (4 | 80.0%), and liberal arts & history (1 | 20.0%) are the most common fields of study among 5 individuals in Faunsdale who have obtained a bachelor's degree or higher.
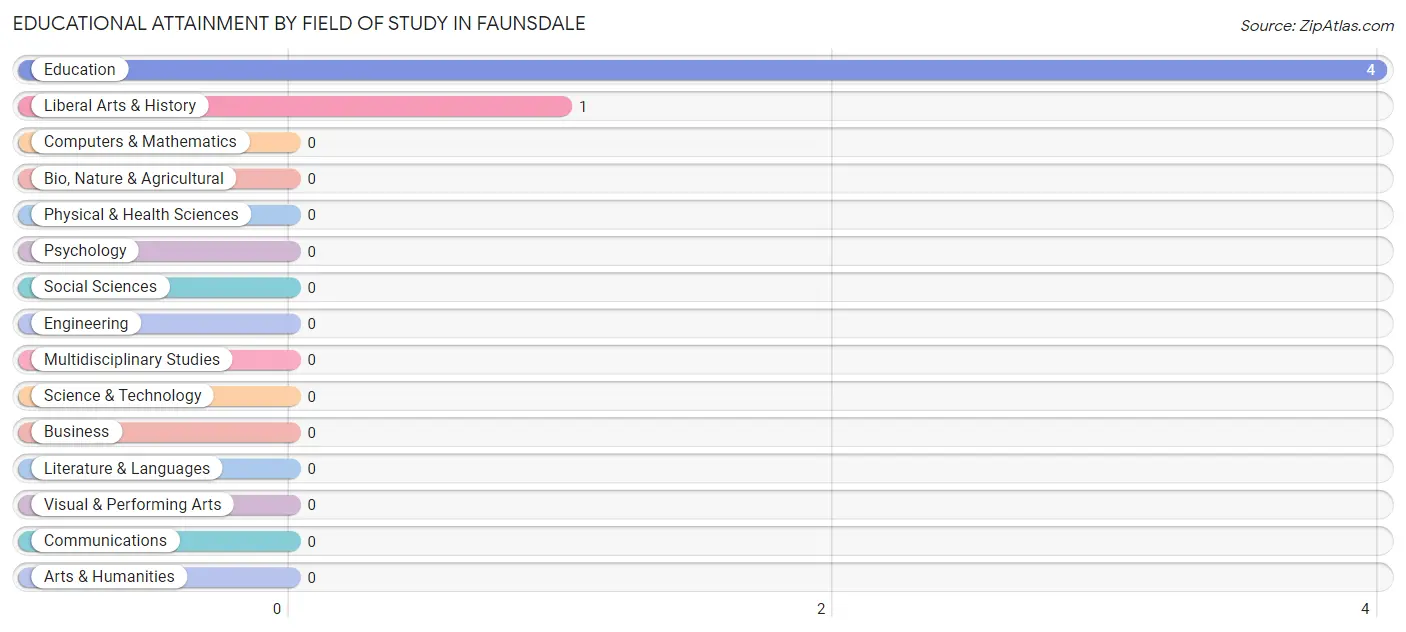
| Field of Study | # Graduates | % Graduates |
| Computers & Mathematics | 0 | 0.0% |
| Bio, Nature & Agricultural | 0 | 0.0% |
| Physical & Health Sciences | 0 | 0.0% |
| Psychology | 0 | 0.0% |
| Social Sciences | 0 | 0.0% |
| Engineering | 0 | 0.0% |
| Multidisciplinary Studies | 0 | 0.0% |
| Science & Technology | 0 | 0.0% |
| Business | 0 | 0.0% |
| Education | 4 | 80.0% |
| Literature & Languages | 0 | 0.0% |
| Liberal Arts & History | 1 | 20.0% |
| Visual & Performing Arts | 0 | 0.0% |
| Communications | 0 | 0.0% |
| Arts & Humanities | 0 | 0.0% |
| Total | 5 | 100.0% |
Transportation & Commute in Faunsdale
Vehicle Availability by Sex in Faunsdale
The most prevalent vehicle ownership categories in Faunsdale are males with 5 or more vehicles (19, accounting for 73.1%) and females with 5 or more vehicles (20, making up 65.5%).
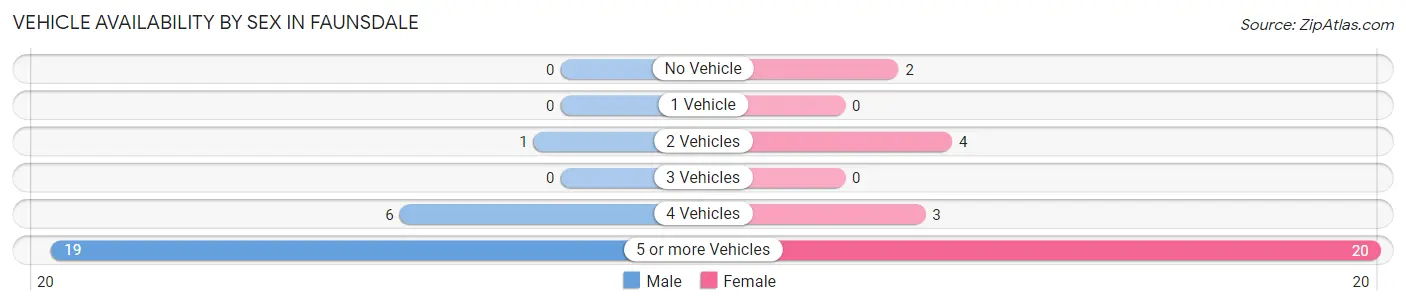
| Vehicles Available | Male | Female |
| No Vehicle | 0 (0.0%) | 2 (6.9%) |
| 1 Vehicle | 0 (0.0%) | 0 (0.0%) |
| 2 Vehicles | 1 (3.8%) | 4 (13.8%) |
| 3 Vehicles | 0 (0.0%) | 0 (0.0%) |
| 4 Vehicles | 6 (23.1%) | 3 (10.3%) |
| 5 or more Vehicles | 19 (73.1%) | 20 (69.0%) |
| Total | 26 (100.0%) | 29 (100.0%) |
Commute Time in Faunsdale
The most frequently occuring commute durations in Faunsdale are 5 to 9 minutes (19 commuters, 34.5%), 25 to 29 minutes (13 commuters, 23.6%), and 20 to 24 minutes (11 commuters, 20.0%).
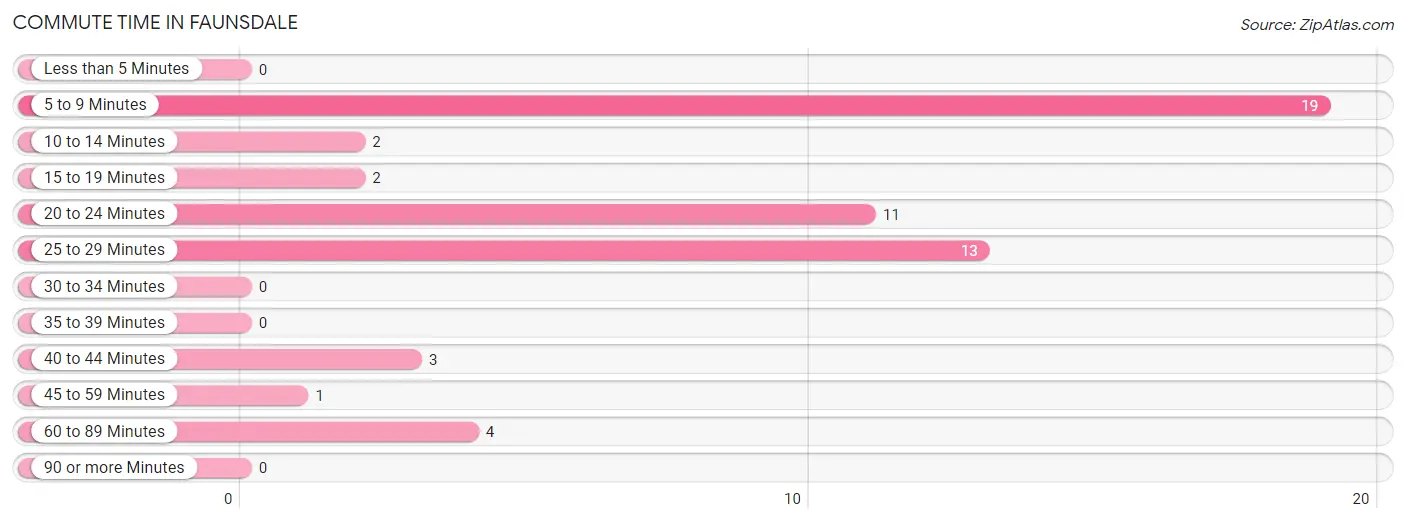
| Commute Time | # Commuters | % Commuters |
| Less than 5 Minutes | 0 | 0.0% |
| 5 to 9 Minutes | 19 | 34.5% |
| 10 to 14 Minutes | 2 | 3.6% |
| 15 to 19 Minutes | 2 | 3.6% |
| 20 to 24 Minutes | 11 | 20.0% |
| 25 to 29 Minutes | 13 | 23.6% |
| 30 to 34 Minutes | 0 | 0.0% |
| 35 to 39 Minutes | 0 | 0.0% |
| 40 to 44 Minutes | 3 | 5.4% |
| 45 to 59 Minutes | 1 | 1.8% |
| 60 to 89 Minutes | 4 | 7.3% |
| 90 or more Minutes | 0 | 0.0% |
Commute Time by Sex in Faunsdale
The most common commute times in Faunsdale are 25 to 29 minutes (13 commuters, 50.0%) for males and 5 to 9 minutes (13 commuters, 44.8%) for females.
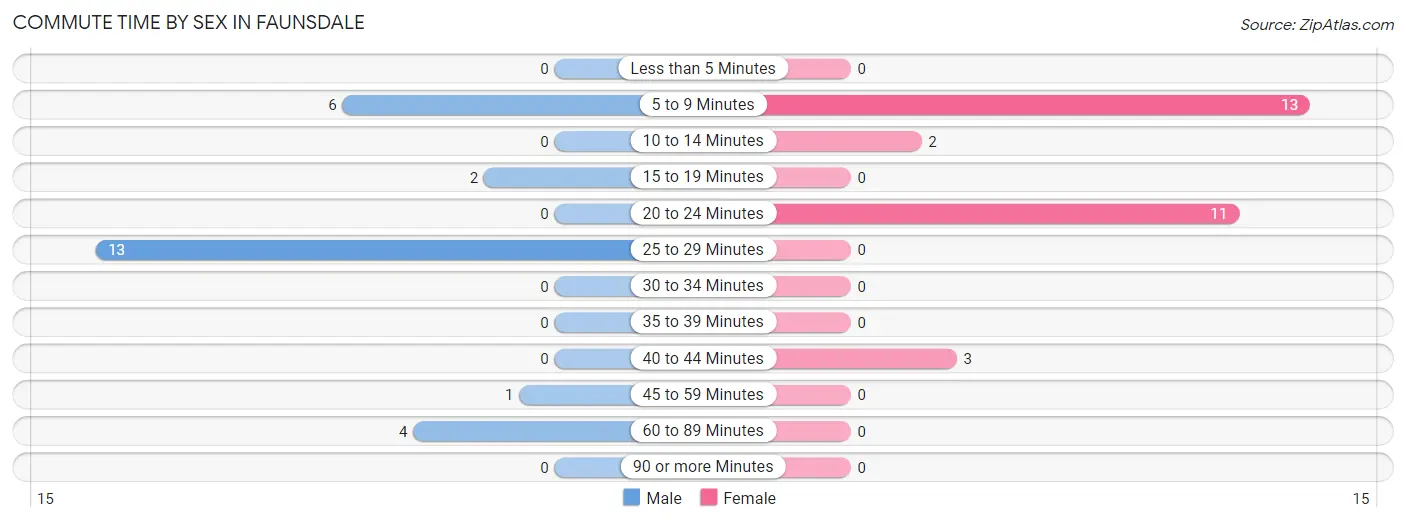
| Commute Time | Male | Female |
| Less than 5 Minutes | 0 (0.0%) | 0 (0.0%) |
| 5 to 9 Minutes | 6 (23.1%) | 13 (44.8%) |
| 10 to 14 Minutes | 0 (0.0%) | 2 (6.9%) |
| 15 to 19 Minutes | 2 (7.7%) | 0 (0.0%) |
| 20 to 24 Minutes | 0 (0.0%) | 11 (37.9%) |
| 25 to 29 Minutes | 13 (50.0%) | 0 (0.0%) |
| 30 to 34 Minutes | 0 (0.0%) | 0 (0.0%) |
| 35 to 39 Minutes | 0 (0.0%) | 0 (0.0%) |
| 40 to 44 Minutes | 0 (0.0%) | 3 (10.3%) |
| 45 to 59 Minutes | 1 (3.8%) | 0 (0.0%) |
| 60 to 89 Minutes | 4 (15.4%) | 0 (0.0%) |
| 90 or more Minutes | 0 (0.0%) | 0 (0.0%) |
Time of Departure to Work by Sex in Faunsdale
The most frequent times of departure to work in Faunsdale are 12:00 AM to 4:59 AM (14, 53.8%) for males and 8:30 AM to 8:59 AM (15, 51.7%) for females.
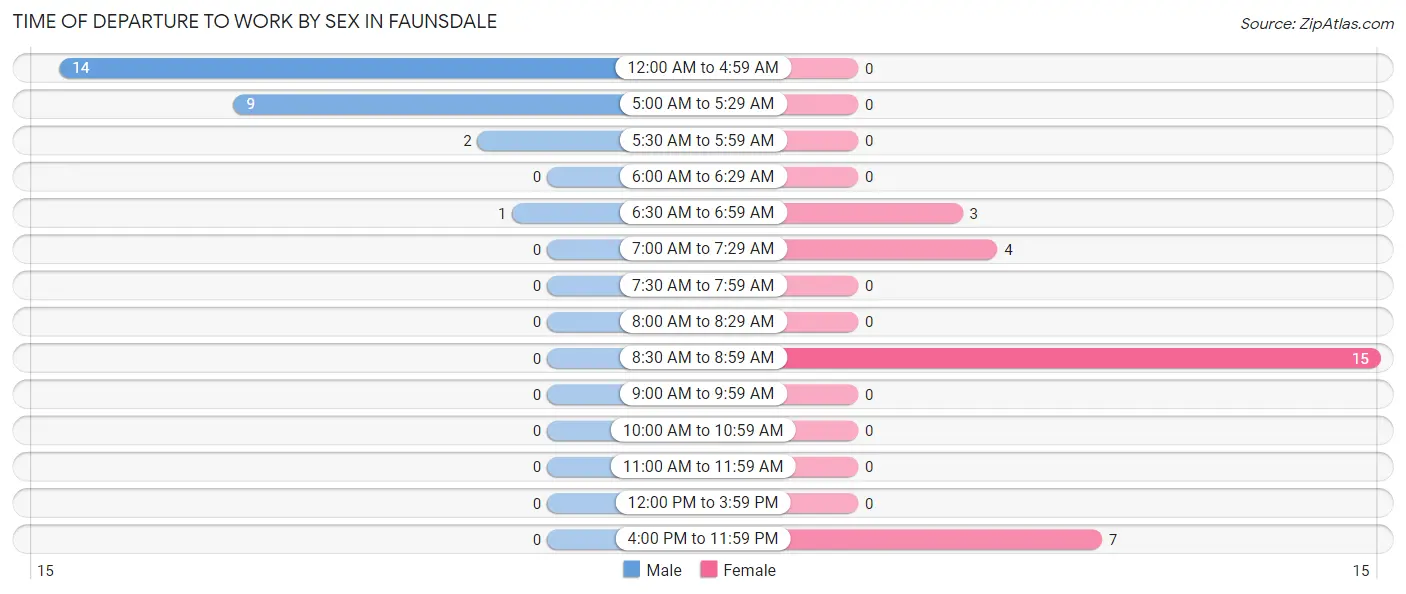
| Time of Departure | Male | Female |
| 12:00 AM to 4:59 AM | 14 (53.8%) | 0 (0.0%) |
| 5:00 AM to 5:29 AM | 9 (34.6%) | 0 (0.0%) |
| 5:30 AM to 5:59 AM | 2 (7.7%) | 0 (0.0%) |
| 6:00 AM to 6:29 AM | 0 (0.0%) | 0 (0.0%) |
| 6:30 AM to 6:59 AM | 1 (3.8%) | 3 (10.3%) |
| 7:00 AM to 7:29 AM | 0 (0.0%) | 4 (13.8%) |
| 7:30 AM to 7:59 AM | 0 (0.0%) | 0 (0.0%) |
| 8:00 AM to 8:29 AM | 0 (0.0%) | 0 (0.0%) |
| 8:30 AM to 8:59 AM | 0 (0.0%) | 15 (51.7%) |
| 9:00 AM to 9:59 AM | 0 (0.0%) | 0 (0.0%) |
| 10:00 AM to 10:59 AM | 0 (0.0%) | 0 (0.0%) |
| 11:00 AM to 11:59 AM | 0 (0.0%) | 0 (0.0%) |
| 12:00 PM to 3:59 PM | 0 (0.0%) | 0 (0.0%) |
| 4:00 PM to 11:59 PM | 0 (0.0%) | 7 (24.1%) |
| Total | 26 (100.0%) | 29 (100.0%) |
Housing Occupancy in Faunsdale
Occupancy by Ownership in Faunsdale
Of the total 32 dwellings in Faunsdale, owner-occupied units account for 17 (53.1%), while renter-occupied units make up 15 (46.9%).
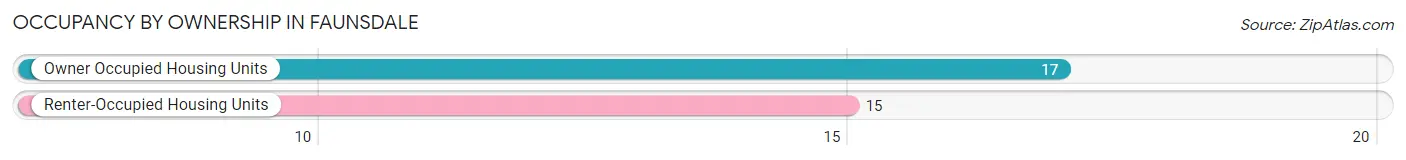
| Occupancy | # Housing Units | % Housing Units |
| Owner Occupied Housing Units | 17 | 53.1% |
| Renter-Occupied Housing Units | 15 | 46.9% |
| Total Occupied Housing Units | 32 | 100.0% |
Occupancy by Household Size in Faunsdale
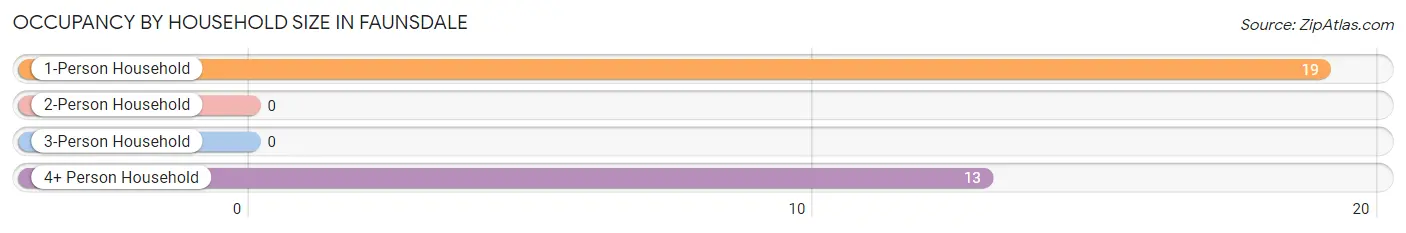
| Household Size | # Housing Units | % Housing Units |
| 1-Person Household | 19 | 59.4% |
| 2-Person Household | 0 | 0.0% |
| 3-Person Household | 0 | 0.0% |
| 4+ Person Household | 13 | 40.6% |
| Total Housing Units | 32 | 100.0% |
Occupancy by Ownership by Household Size in Faunsdale
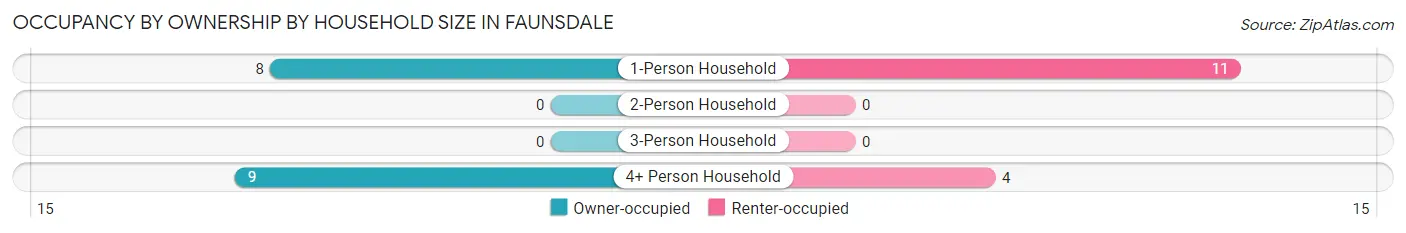
| Household Size | Owner-occupied | Renter-occupied |
| 1-Person Household | 8 (42.1%) | 11 (57.9%) |
| 2-Person Household | 0 (0.0%) | 0 (0.0%) |
| 3-Person Household | 0 (0.0%) | 0 (0.0%) |
| 4+ Person Household | 9 (69.2%) | 4 (30.8%) |
| Total Housing Units | 17 (53.1%) | 15 (46.9%) |
Occupancy by Educational Attainment in Faunsdale
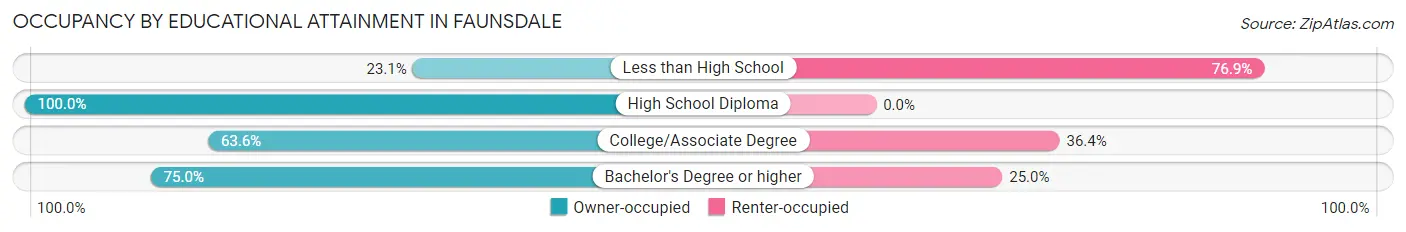
| Household Size | Owner-occupied | Renter-occupied |
| Less than High School | 3 (23.1%) | 10 (76.9%) |
| High School Diploma | 4 (100.0%) | 0 (0.0%) |
| College/Associate Degree | 7 (63.6%) | 4 (36.4%) |
| Bachelor's Degree or higher | 3 (75.0%) | 1 (25.0%) |
Occupancy by Age of Householder in Faunsdale
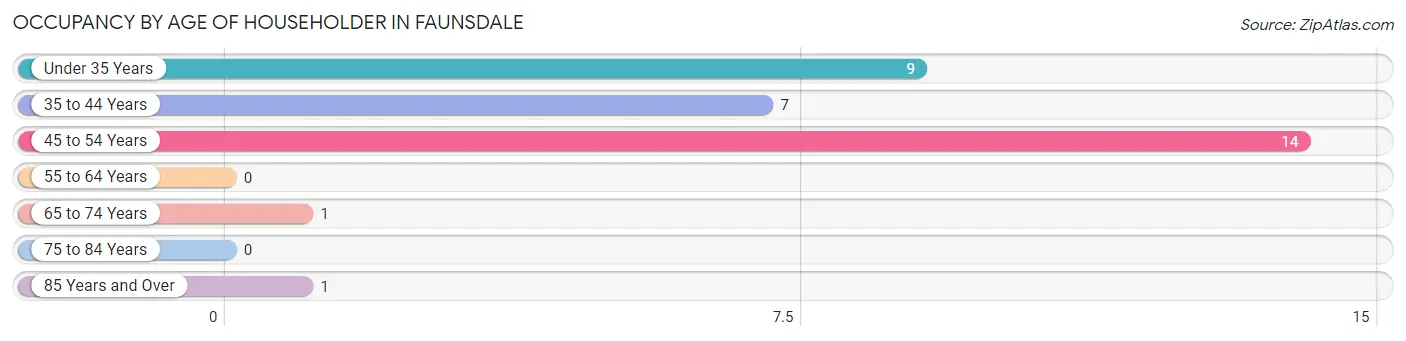
| Age Bracket | # Households | % Households |
| Under 35 Years | 9 | 28.1% |
| 35 to 44 Years | 7 | 21.9% |
| 45 to 54 Years | 14 | 43.8% |
| 55 to 64 Years | 0 | 0.0% |
| 65 to 74 Years | 1 | 3.1% |
| 75 to 84 Years | 0 | 0.0% |
| 85 Years and Over | 1 | 3.1% |
| Total | 32 | 100.0% |
Housing Finances in Faunsdale
Median Income by Occupancy in Faunsdale
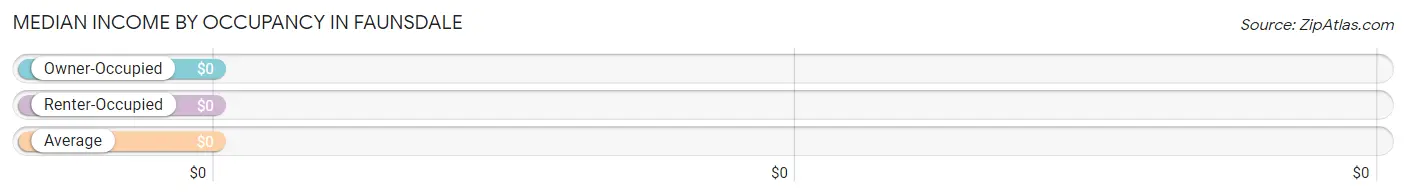
| Occupancy Type | # Households | Median Income |
| Owner-Occupied | 17 (53.1%) | $0 |
| Renter-Occupied | 15 (46.9%) | $0 |
| Average | 32 (100.0%) | $0 |
Occupancy by Householder Income Bracket in Faunsdale
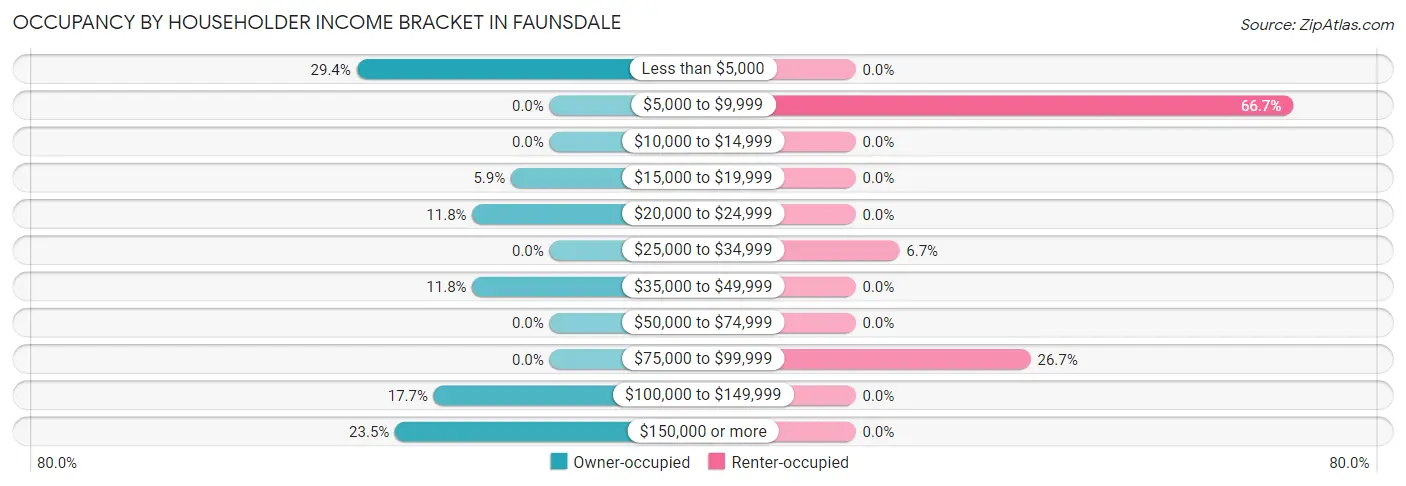
| Income Bracket | Owner-occupied | Renter-occupied |
| Less than $5,000 | 5 (29.4%) | 0 (0.0%) |
| $5,000 to $9,999 | 0 (0.0%) | 10 (66.7%) |
| $10,000 to $14,999 | 0 (0.0%) | 0 (0.0%) |
| $15,000 to $19,999 | 1 (5.9%) | 0 (0.0%) |
| $20,000 to $24,999 | 2 (11.8%) | 0 (0.0%) |
| $25,000 to $34,999 | 0 (0.0%) | 1 (6.7%) |
| $35,000 to $49,999 | 2 (11.8%) | 0 (0.0%) |
| $50,000 to $74,999 | 0 (0.0%) | 0 (0.0%) |
| $75,000 to $99,999 | 0 (0.0%) | 4 (26.7%) |
| $100,000 to $149,999 | 3 (17.6%) | 0 (0.0%) |
| $150,000 or more | 4 (23.5%) | 0 (0.0%) |
| Total | 17 (100.0%) | 15 (100.0%) |
Monthly Housing Cost Tiers in Faunsdale
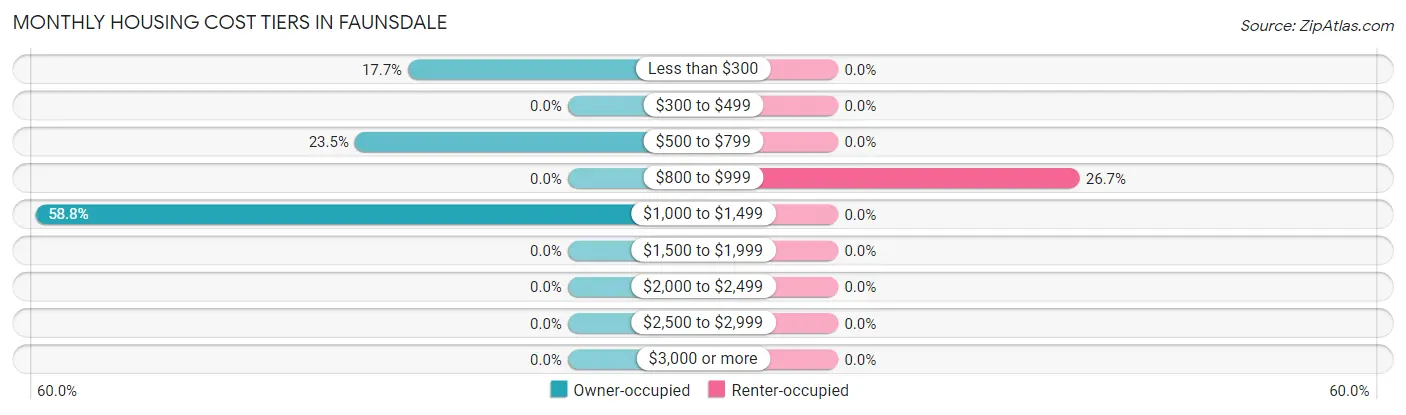
| Monthly Cost | Owner-occupied | Renter-occupied |
| Less than $300 | 3 (17.6%) | 0 (0.0%) |
| $300 to $499 | 0 (0.0%) | 0 (0.0%) |
| $500 to $799 | 4 (23.5%) | 0 (0.0%) |
| $800 to $999 | 0 (0.0%) | 4 (26.7%) |
| $1,000 to $1,499 | 10 (58.8%) | 0 (0.0%) |
| $1,500 to $1,999 | 0 (0.0%) | 0 (0.0%) |
| $2,000 to $2,499 | 0 (0.0%) | 0 (0.0%) |
| $2,500 to $2,999 | 0 (0.0%) | 0 (0.0%) |
| $3,000 or more | 0 (0.0%) | 0 (0.0%) |
| Total | 17 (100.0%) | 15 (100.0%) |
Physical Housing Characteristics in Faunsdale
Housing Structures in Faunsdale
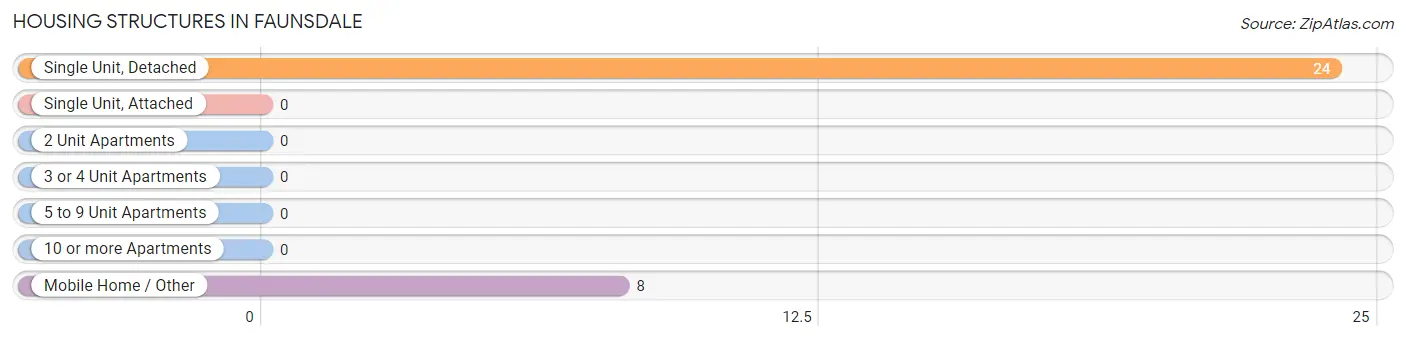
| Structure Type | # Housing Units | % Housing Units |
| Single Unit, Detached | 24 | 75.0% |
| Single Unit, Attached | 0 | 0.0% |
| 2 Unit Apartments | 0 | 0.0% |
| 3 or 4 Unit Apartments | 0 | 0.0% |
| 5 to 9 Unit Apartments | 0 | 0.0% |
| 10 or more Apartments | 0 | 0.0% |
| Mobile Home / Other | 8 | 25.0% |
| Total | 32 | 100.0% |
Housing Structures by Occupancy in Faunsdale
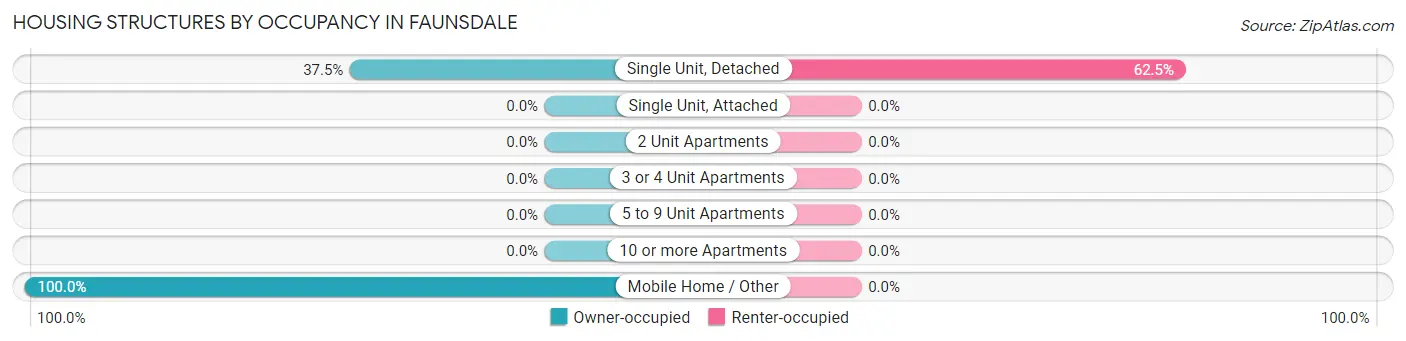
| Structure Type | Owner-occupied | Renter-occupied |
| Single Unit, Detached | 9 (37.5%) | 15 (62.5%) |
| Single Unit, Attached | 0 (0.0%) | 0 (0.0%) |
| 2 Unit Apartments | 0 (0.0%) | 0 (0.0%) |
| 3 or 4 Unit Apartments | 0 (0.0%) | 0 (0.0%) |
| 5 to 9 Unit Apartments | 0 (0.0%) | 0 (0.0%) |
| 10 or more Apartments | 0 (0.0%) | 0 (0.0%) |
| Mobile Home / Other | 8 (100.0%) | 0 (0.0%) |
| Total | 17 (53.1%) | 15 (46.9%) |
Housing Structures by Number of Rooms in Faunsdale
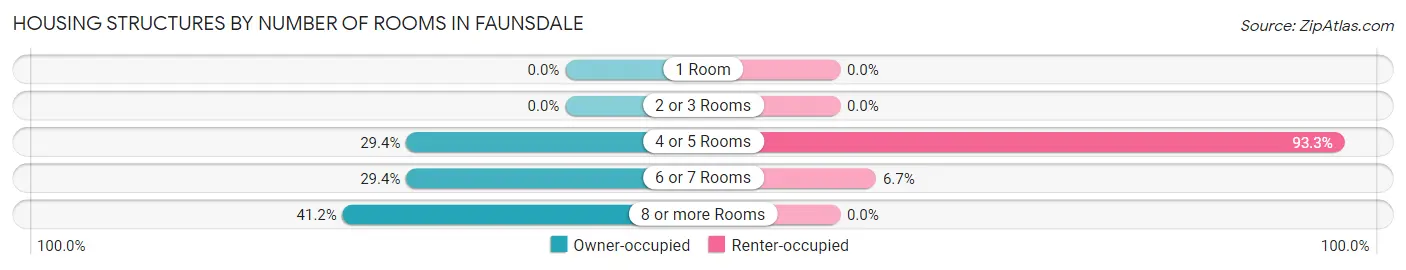
| Number of Rooms | Owner-occupied | Renter-occupied |
| 1 Room | 0 (0.0%) | 0 (0.0%) |
| 2 or 3 Rooms | 0 (0.0%) | 0 (0.0%) |
| 4 or 5 Rooms | 5 (29.4%) | 14 (93.3%) |
| 6 or 7 Rooms | 5 (29.4%) | 1 (6.7%) |
| 8 or more Rooms | 7 (41.2%) | 0 (0.0%) |
| Total | 17 (100.0%) | 15 (100.0%) |
Housing Structure by Heating Type in Faunsdale
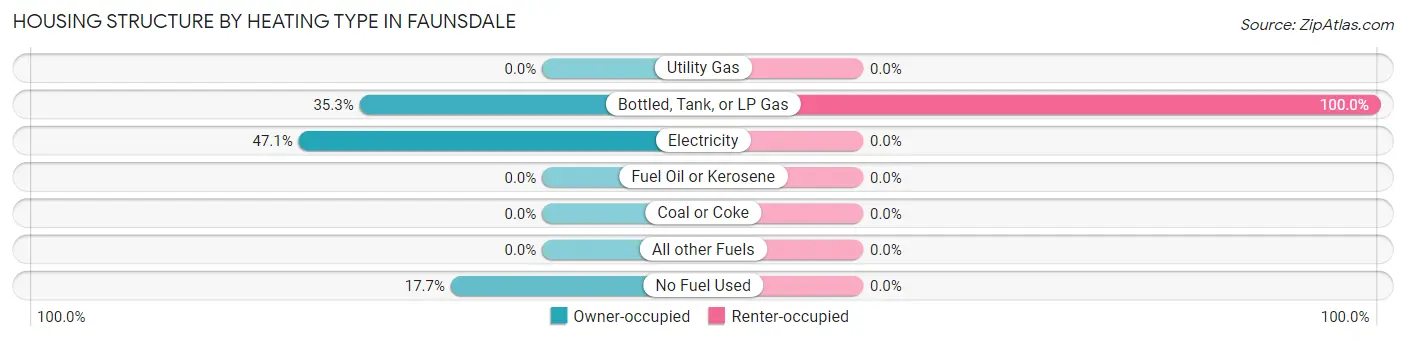
| Heating Type | Owner-occupied | Renter-occupied |
| Utility Gas | 0 (0.0%) | 0 (0.0%) |
| Bottled, Tank, or LP Gas | 6 (35.3%) | 15 (100.0%) |
| Electricity | 8 (47.1%) | 0 (0.0%) |
| Fuel Oil or Kerosene | 0 (0.0%) | 0 (0.0%) |
| Coal or Coke | 0 (0.0%) | 0 (0.0%) |
| All other Fuels | 0 (0.0%) | 0 (0.0%) |
| No Fuel Used | 3 (17.6%) | 0 (0.0%) |
| Total | 17 (100.0%) | 15 (100.0%) |
Household Vehicle Usage in Faunsdale
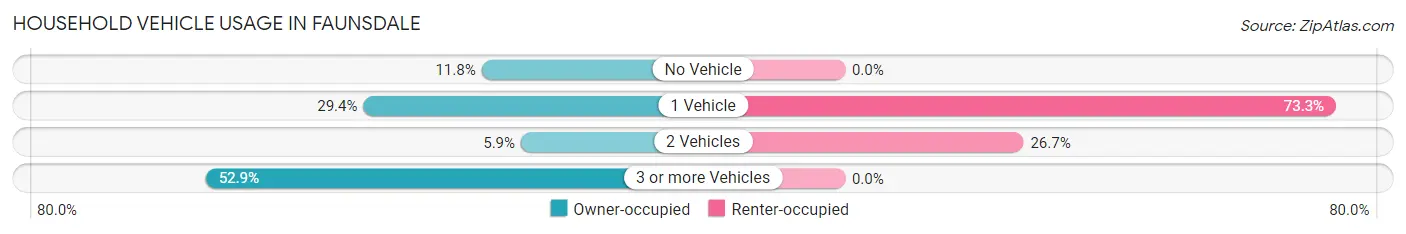
| Vehicles per Household | Owner-occupied | Renter-occupied |
| No Vehicle | 2 (11.8%) | 0 (0.0%) |
| 1 Vehicle | 5 (29.4%) | 11 (73.3%) |
| 2 Vehicles | 1 (5.9%) | 4 (26.7%) |
| 3 or more Vehicles | 9 (52.9%) | 0 (0.0%) |
| Total | 17 (100.0%) | 15 (100.0%) |
Real Estate & Mortgages in Faunsdale
Real Estate and Mortgage Overview in Faunsdale
| Characteristic | Without Mortgage | With Mortgage |
| Housing Units | 9 | 8 |
| Median Property Value | $17,500 | $0 |
| Median Household Income | - | - |
| Monthly Housing Costs | $738 | $0 |
| Real Estate Taxes | $199 | $0 |
Property Value by Mortgage Status in Faunsdale
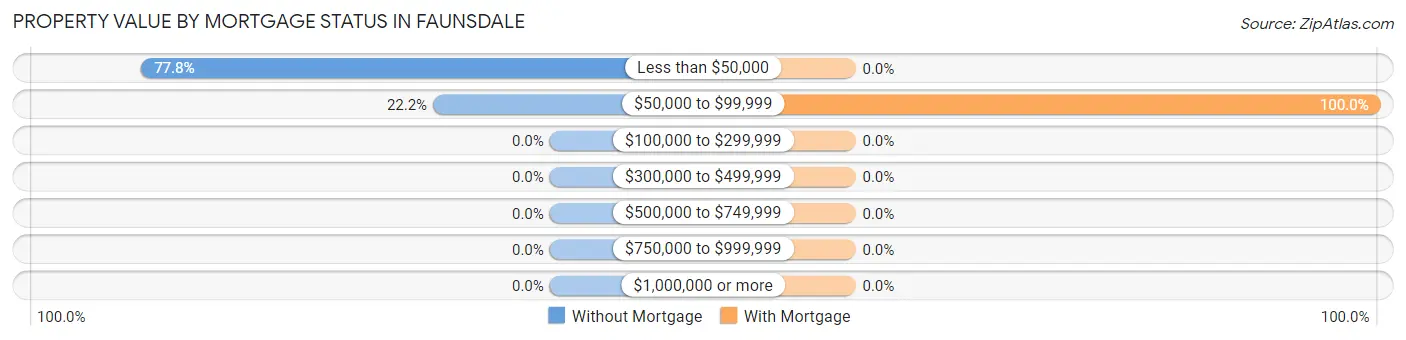
| Property Value | Without Mortgage | With Mortgage |
| Less than $50,000 | 7 (77.8%) | 0 (0.0%) |
| $50,000 to $99,999 | 2 (22.2%) | 8 (100.0%) |
| $100,000 to $299,999 | 0 (0.0%) | 0 (0.0%) |
| $300,000 to $499,999 | 0 (0.0%) | 0 (0.0%) |
| $500,000 to $749,999 | 0 (0.0%) | 0 (0.0%) |
| $750,000 to $999,999 | 0 (0.0%) | 0 (0.0%) |
| $1,000,000 or more | 0 (0.0%) | 0 (0.0%) |
| Total | 9 (100.0%) | 8 (100.0%) |
Household Income by Mortgage Status in Faunsdale
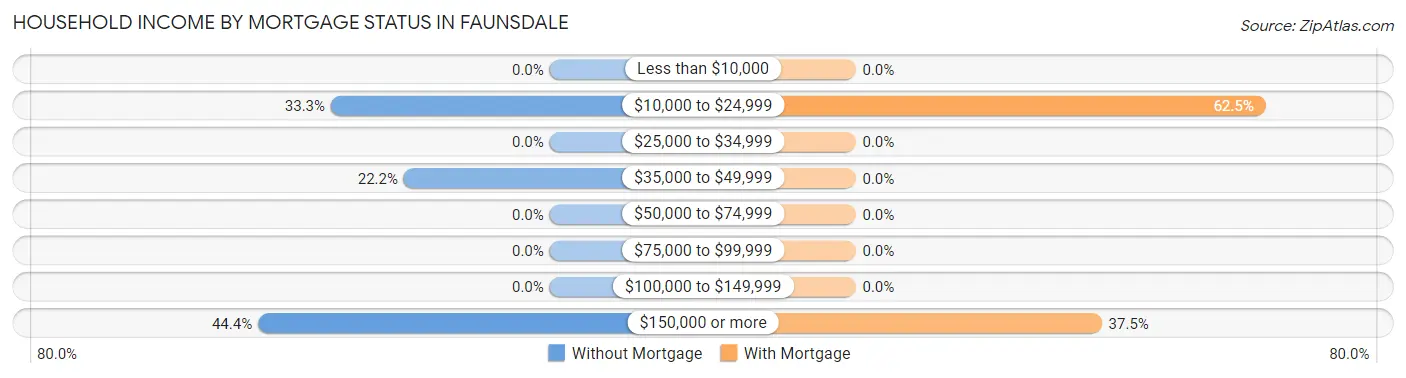
| Household Income | Without Mortgage | With Mortgage |
| Less than $10,000 | 0 (0.0%) | 0 (0.0%) |
| $10,000 to $24,999 | 3 (33.3%) | 5 (62.5%) |
| $25,000 to $34,999 | 0 (0.0%) | 0 (0.0%) |
| $35,000 to $49,999 | 2 (22.2%) | 0 (0.0%) |
| $50,000 to $74,999 | 0 (0.0%) | 0 (0.0%) |
| $75,000 to $99,999 | 0 (0.0%) | 0 (0.0%) |
| $100,000 to $149,999 | 0 (0.0%) | 0 (0.0%) |
| $150,000 or more | 4 (44.4%) | 3 (37.5%) |
| Total | 9 (100.0%) | 8 (100.0%) |
Property Value to Household Income Ratio in Faunsdale
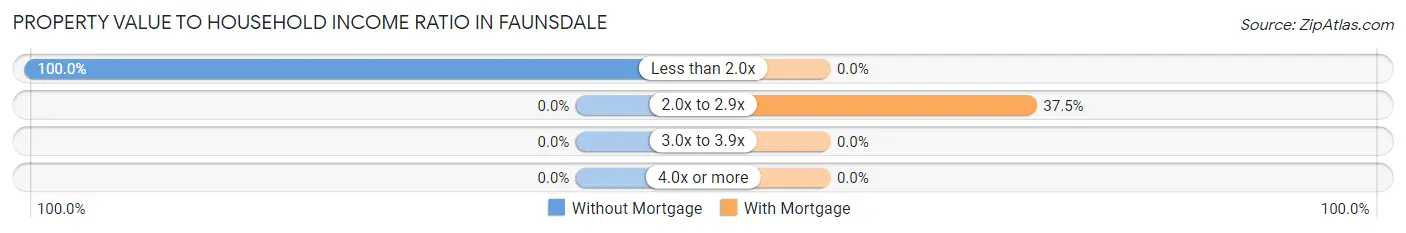
| Value-to-Income Ratio | Without Mortgage | With Mortgage |
| Less than 2.0x | 9 (100.0%) | 0 (0.0%) |
| 2.0x to 2.9x | 0 (0.0%) | 3 (37.5%) |
| 3.0x to 3.9x | 0 (0.0%) | 0 (0.0%) |
| 4.0x or more | 0 (0.0%) | 0 (0.0%) |
| Total | 9 (100.0%) | 8 (100.0%) |
Real Estate Taxes by Mortgage Status in Faunsdale
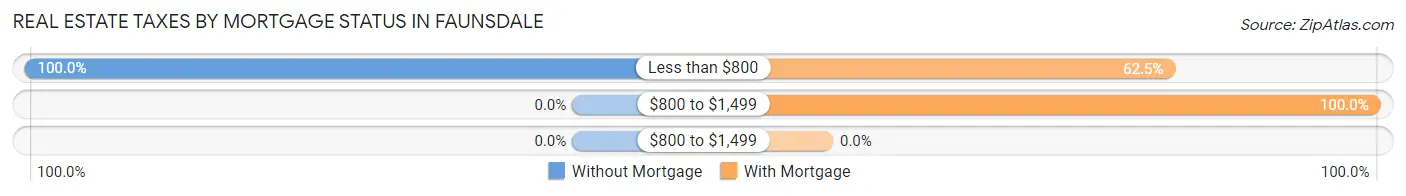
| Property Taxes | Without Mortgage | With Mortgage |
| Less than $800 | 9 (100.0%) | 5 (62.5%) |
| $800 to $1,499 | 0 (0.0%) | 8 (100.0%) |
| $800 to $1,499 | 0 (0.0%) | 0 (0.0%) |
| Total | 9 (100.0%) | 8 (100.0%) |
Health & Disability in Faunsdale
Health Insurance Coverage by Age in Faunsdale
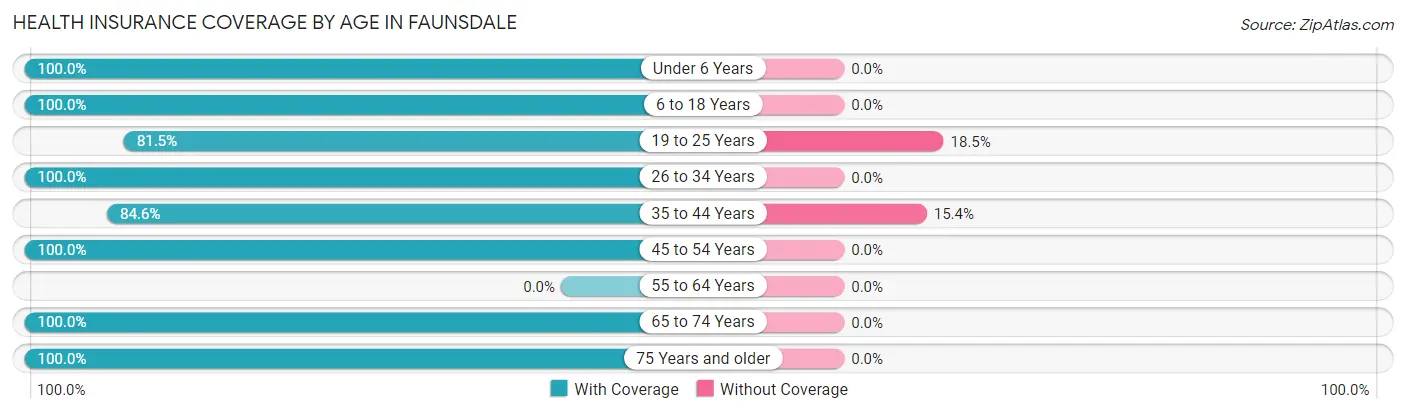
| Age Bracket | With Coverage | Without Coverage |
| Under 6 Years | 30 (100.0%) | 0 (0.0%) |
| 6 to 18 Years | 25 (100.0%) | 0 (0.0%) |
| 19 to 25 Years | 22 (81.5%) | 5 (18.5%) |
| 26 to 34 Years | 5 (100.0%) | 0 (0.0%) |
| 35 to 44 Years | 11 (84.6%) | 2 (15.4%) |
| 45 to 54 Years | 34 (100.0%) | 0 (0.0%) |
| 55 to 64 Years | 0 (0.0%) | 0 (0.0%) |
| 65 to 74 Years | 1 (100.0%) | 0 (0.0%) |
| 75 Years and older | 1 (100.0%) | 0 (0.0%) |
| Total | 129 (94.9%) | 7 (5.1%) |
Health Insurance Coverage by Citizenship Status in Faunsdale
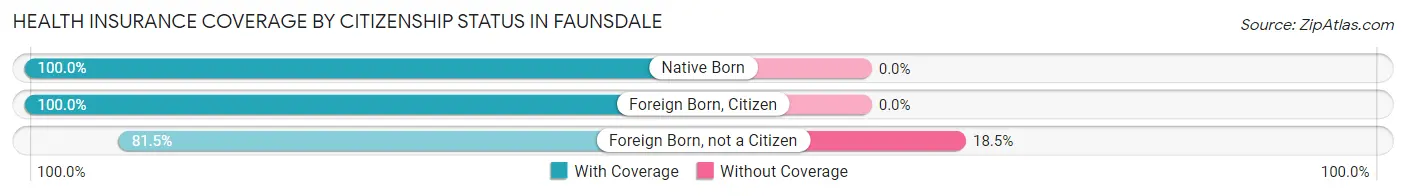
| Citizenship Status | With Coverage | Without Coverage |
| Native Born | 30 (100.0%) | 0 (0.0%) |
| Foreign Born, Citizen | 25 (100.0%) | 0 (0.0%) |
| Foreign Born, not a Citizen | 22 (81.5%) | 5 (18.5%) |
Health Insurance Coverage by Household Income in Faunsdale
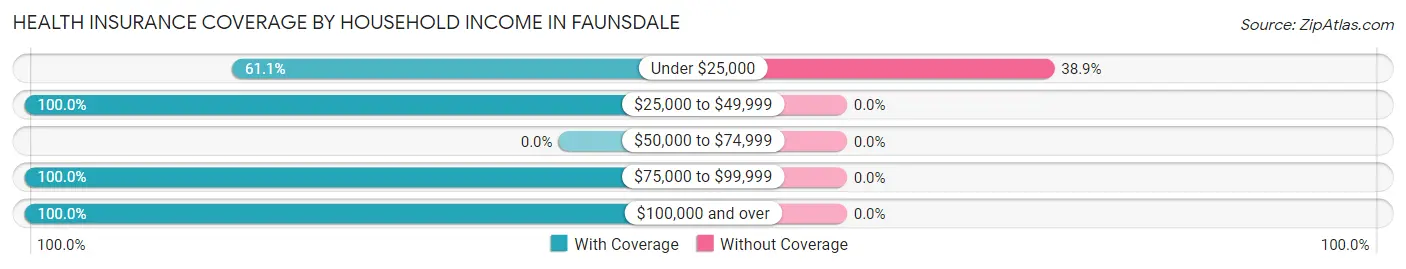
| Household Income | With Coverage | Without Coverage |
| Under $25,000 | 11 (61.1%) | 7 (38.9%) |
| $25,000 to $49,999 | 11 (100.0%) | 0 (0.0%) |
| $50,000 to $74,999 | 0 (0.0%) | 0 (0.0%) |
| $75,000 to $99,999 | 16 (100.0%) | 0 (0.0%) |
| $100,000 and over | 91 (100.0%) | 0 (0.0%) |
Public vs Private Health Insurance Coverage by Age in Faunsdale
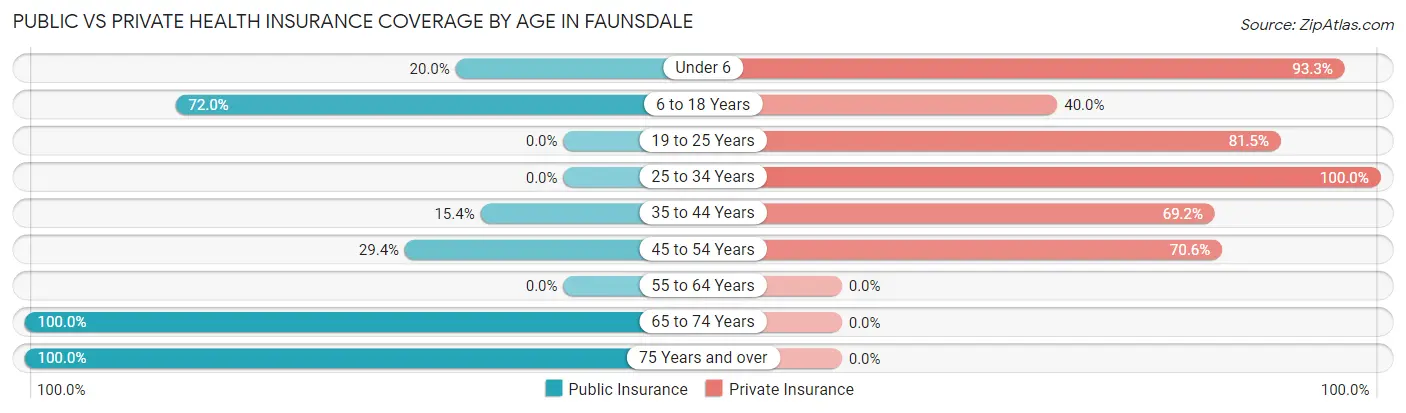
| Age Bracket | Public Insurance | Private Insurance |
| Under 6 | 6 (20.0%) | 28 (93.3%) |
| 6 to 18 Years | 18 (72.0%) | 10 (40.0%) |
| 19 to 25 Years | 0 (0.0%) | 22 (81.5%) |
| 25 to 34 Years | 0 (0.0%) | 5 (100.0%) |
| 35 to 44 Years | 2 (15.4%) | 9 (69.2%) |
| 45 to 54 Years | 10 (29.4%) | 24 (70.6%) |
| 55 to 64 Years | 0 (0.0%) | 0 (0.0%) |
| 65 to 74 Years | 1 (100.0%) | 0 (0.0%) |
| 75 Years and over | 1 (100.0%) | 0 (0.0%) |
| Total | 38 (27.9%) | 98 (72.1%) |
Disability Status by Sex by Age in Faunsdale
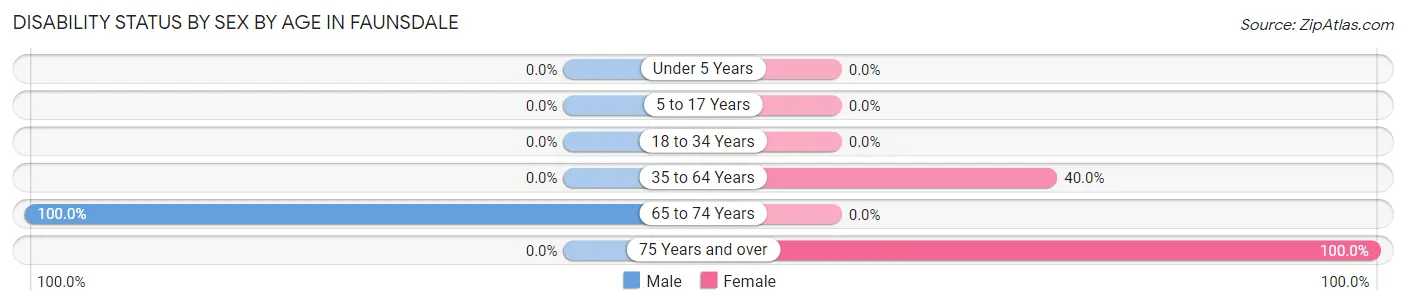
| Age Bracket | Male | Female |
| Under 5 Years | 0 (0.0%) | 0 (0.0%) |
| 5 to 17 Years | 0 (0.0%) | 0 (0.0%) |
| 18 to 34 Years | 0 (0.0%) | 0 (0.0%) |
| 35 to 64 Years | 0 (0.0%) | 12 (40.0%) |
| 65 to 74 Years | 1 (100.0%) | 0 (0.0%) |
| 75 Years and over | 0 (0.0%) | 1 (100.0%) |
Disability Class by Sex by Age in Faunsdale
Disability Class: Hearing Difficulty
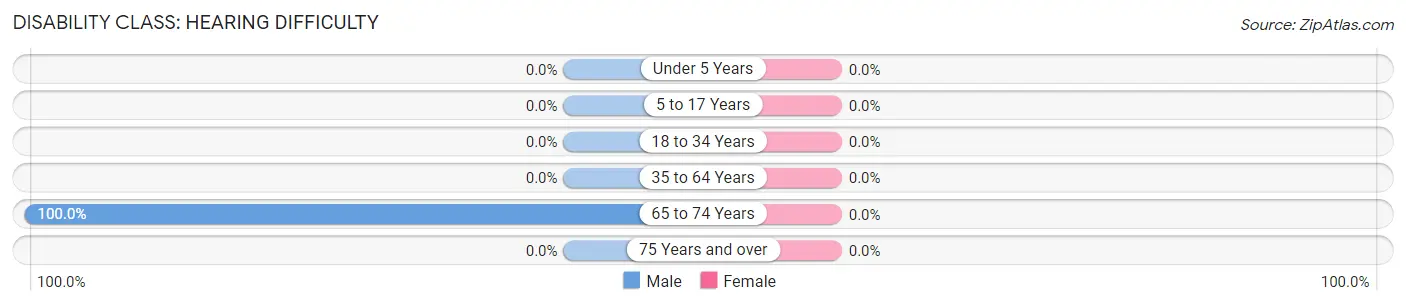
| Age Bracket | Male | Female |
| Under 5 Years | 0 (0.0%) | 0 (0.0%) |
| 5 to 17 Years | 0 (0.0%) | 0 (0.0%) |
| 18 to 34 Years | 0 (0.0%) | 0 (0.0%) |
| 35 to 64 Years | 0 (0.0%) | 0 (0.0%) |
| 65 to 74 Years | 1 (100.0%) | 0 (0.0%) |
| 75 Years and over | 0 (0.0%) | 0 (0.0%) |
Disability Class: Vision Difficulty
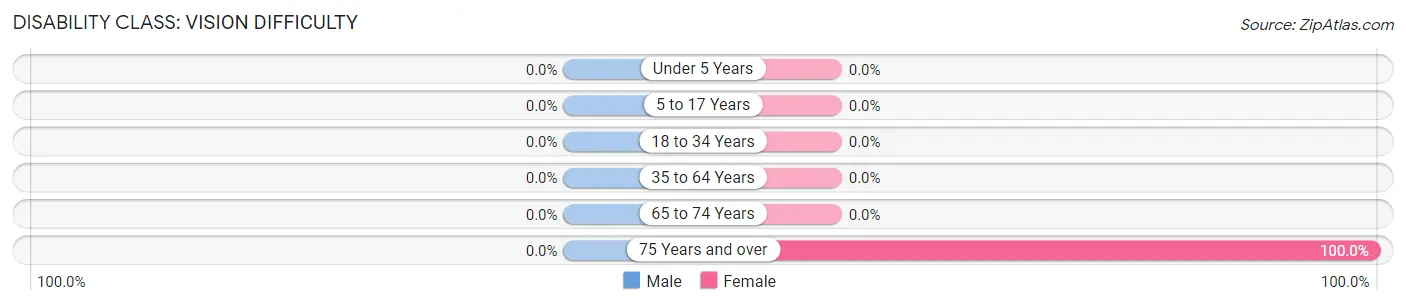
| Age Bracket | Male | Female |
| Under 5 Years | 0 (0.0%) | 0 (0.0%) |
| 5 to 17 Years | 0 (0.0%) | 0 (0.0%) |
| 18 to 34 Years | 0 (0.0%) | 0 (0.0%) |
| 35 to 64 Years | 0 (0.0%) | 0 (0.0%) |
| 65 to 74 Years | 0 (0.0%) | 0 (0.0%) |
| 75 Years and over | 0 (0.0%) | 1 (100.0%) |
Disability Class: Cognitive Difficulty
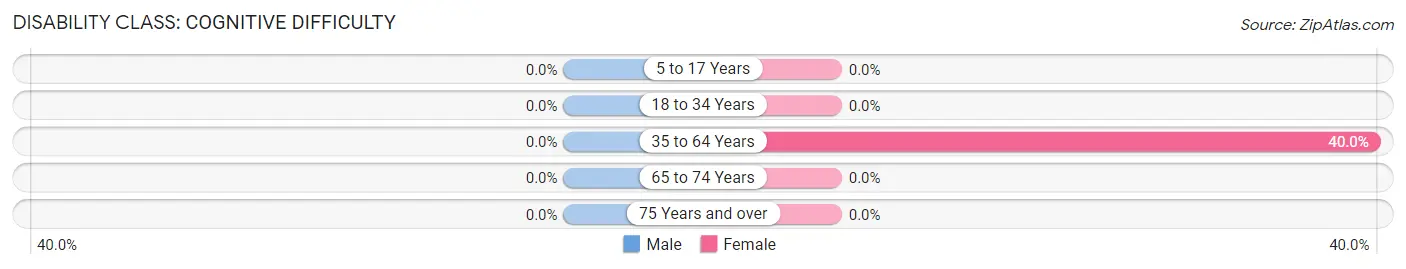
| Age Bracket | Male | Female |
| 5 to 17 Years | 0 (0.0%) | 0 (0.0%) |
| 18 to 34 Years | 0 (0.0%) | 0 (0.0%) |
| 35 to 64 Years | 0 (0.0%) | 12 (40.0%) |
| 65 to 74 Years | 0 (0.0%) | 0 (0.0%) |
| 75 Years and over | 0 (0.0%) | 0 (0.0%) |
Disability Class: Ambulatory Difficulty
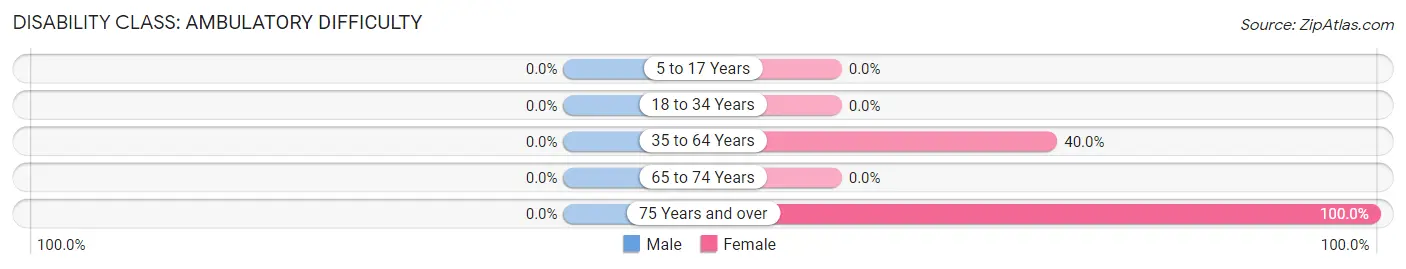
| Age Bracket | Male | Female |
| 5 to 17 Years | 0 (0.0%) | 0 (0.0%) |
| 18 to 34 Years | 0 (0.0%) | 0 (0.0%) |
| 35 to 64 Years | 0 (0.0%) | 12 (40.0%) |
| 65 to 74 Years | 0 (0.0%) | 0 (0.0%) |
| 75 Years and over | 0 (0.0%) | 1 (100.0%) |
Disability Class: Self-Care Difficulty
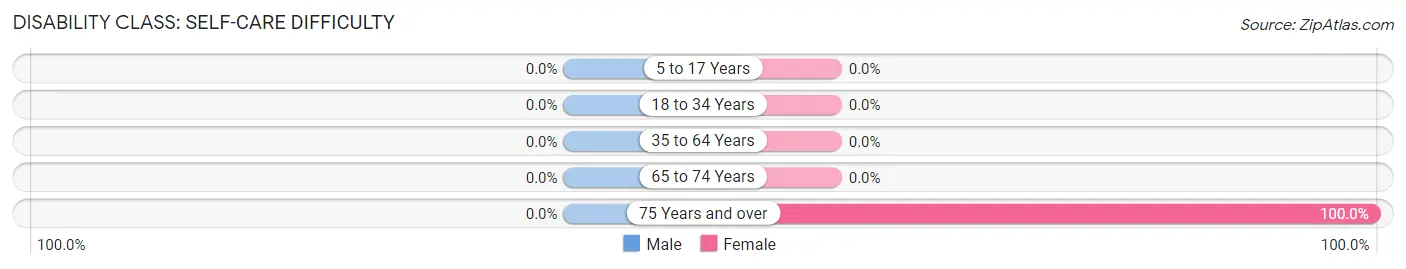
| Age Bracket | Male | Female |
| 5 to 17 Years | 0 (0.0%) | 0 (0.0%) |
| 18 to 34 Years | 0 (0.0%) | 0 (0.0%) |
| 35 to 64 Years | 0 (0.0%) | 0 (0.0%) |
| 65 to 74 Years | 0 (0.0%) | 0 (0.0%) |
| 75 Years and over | 0 (0.0%) | 1 (100.0%) |
Technology Access in Faunsdale
Computing Device Access in Faunsdale
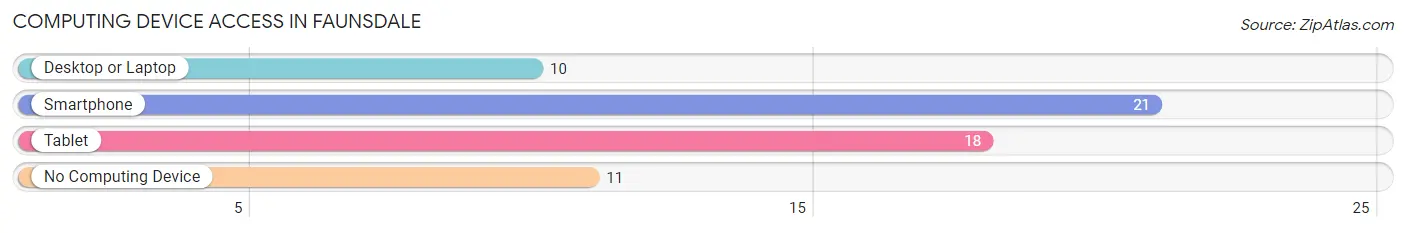
| Device Type | # Households | % Households |
| Desktop or Laptop | 10 | 31.2% |
| Smartphone | 21 | 65.6% |
| Tablet | 18 | 56.2% |
| No Computing Device | 11 | 34.4% |
| Total | 32 | 100.0% |
Internet Access in Faunsdale
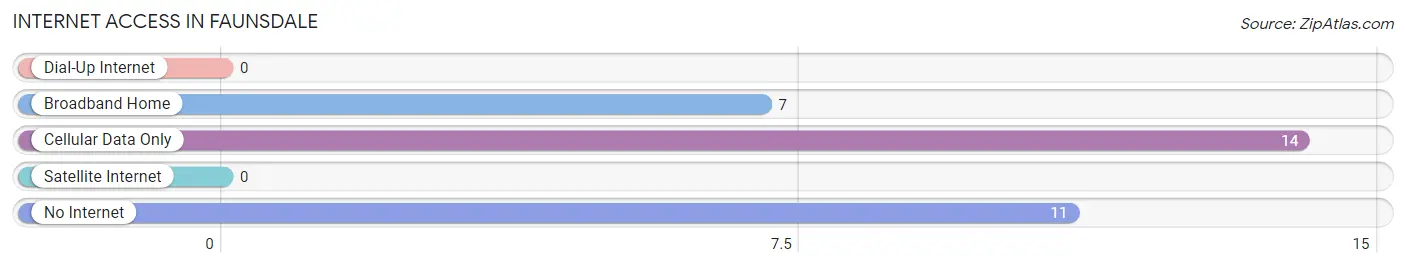
| Internet Type | # Households | % Households |
| Dial-Up Internet | 0 | 0.0% |
| Broadband Home | 7 | 21.9% |
| Cellular Data Only | 14 | 43.8% |
| Satellite Internet | 0 | 0.0% |
| No Internet | 11 | 34.4% |
| Total | 32 | 100.0% |
Faunsdale Summary
Faunsdale is a small town located in Marengo County, Alabama. It is situated in the southwestern part of the state, about 30 miles east of the Mississippi River. The town was founded in 1837 and is named after the Faunsdale Plantation, which was owned by the prominent local family of the same name. The population of Faunsdale was estimated to be around 500 people in 2020.
Geography
Faunsdale is located in the Black Belt region of Alabama, which is characterized by its rich, dark soil. The town is situated in the southwestern part of the state, about 30 miles east of the Mississippi River. The town is surrounded by rolling hills and is located near the Tombigbee River. The climate in Faunsdale is humid subtropical, with hot summers and mild winters.
Economy
Faunsdale’s economy is largely based on agriculture. The town is home to several farms, which produce cotton, soybeans, corn, and other crops. The town also has a few small businesses, including a grocery store, a hardware store, and a few restaurants.
Demographics
As of the 2010 census, the population of Faunsdale was estimated to be around 500 people. The racial makeup of the town was 97.2% White, 0.8% African American, 0.4% Native American, 0.2% Asian, and 1.4% from other races. The median household income in Faunsdale was $30,000, and the median age was 44.
History
Faunsdale was founded in 1837 and is named after the Faunsdale Plantation, which was owned by the prominent local family of the same name. The town was originally a small farming community, but it grew in size and importance after the Civil War. In the late 19th century, the town was home to several cotton gins and sawmills.
In the early 20th century, Faunsdale was a popular destination for hunters and fishermen. The town was also home to several churches, a school, and a post office. In the 1950s, the town began to decline as many of its residents moved away in search of better economic opportunities.
Today, Faunsdale is a small, rural town with a population of around 500 people. The town is home to several churches, a post office, and a few small businesses. The town is also home to the Faunsdale Plantation, which is now a museum and historic site.
Faunsdale is a small, rural town with a rich history and a unique culture. The town is home to several farms, businesses, and churches, and it is a popular destination for hunters and fishermen. The town is also home to the Faunsdale Plantation, which is now a museum and historic site. The population of Faunsdale was estimated to be around 500 people in 2020.
Common Questions
What is Per Capita Income in Faunsdale?
Per Capita income in Faunsdale is $16,287.
What is the Median Family Income in Faunsdale?
Median Family Income in Faunsdale is $115,417.
What is Income or Wage Gap in Faunsdale?
Income or Wage Gap in Faunsdale is 60.9%.
Women in Faunsdale earn 39.1 cents for every dollar earned by a man.
What is Inequality or Gini Index in Faunsdale?
Inequality or Gini Index in Faunsdale is 0.65.
What is the Total Population of Faunsdale?
Total Population of Faunsdale is 136.
What is the Total Male Population of Faunsdale?
Total Male Population of Faunsdale is 43.
What is the Total Female Population of Faunsdale?
Total Female Population of Faunsdale is 93.
What is the Ratio of Males per 100 Females in Faunsdale?
There are 46.24 Males per 100 Females in Faunsdale.
What is the Ratio of Females per 100 Males in Faunsdale?
There are 216.28 Females per 100 Males in Faunsdale.
What is the Median Population Age in Faunsdale?
Median Population Age in Faunsdale is 20.7 Years.
What is the Average Family Size in Faunsdale
Average Family Size in Faunsdale is 9.0 People.
What is the Average Household Size in Faunsdale
Average Household Size in Faunsdale is 4.2 People.
How Large is the Labor Force in Faunsdale?
There are 55 People in the Labor Forcein in Faunsdale.
What is the Percentage of People in the Labor Force in Faunsdale?
67.9% of People are in the Labor Force in Faunsdale.